Week 10 HW: Advanced Imaging & Measurement Technology
Final Project
Please identify at least one (ideally many) aspect(s) of your project that you will measure. It could be the mass or sequence of a protein, the presence, absence, or quantity of a biomarker, etc. Please describe all of the elements you would like to measure, and furthermore describe how you will perform these measurements. What are the technologies you will use (e.g., gel electrophoresis, DNA sequencing, mass spectrometry, etc.)? Describe in detail.
My project MycoBoard consists of:
- Aim 1 - Experimental: Design and computationally validate the cmt overexpression construct for N. crassa, simulating expected silver biosorption and resistance outcomes
- Aim 2 - Development: Translate the validated computational design into a physical prototype: grow engineered N. crassa mats inside molds and validate by working LED circuit powered through a biologically grown conductive track.
- Aim 3 - Visionary: Replace physical molds with optogenetic control of cmt expression, using an interface to draw circuit layouts that the fungus then follows while growing.
Because my project currently focuses on the computational design (Aim 1), most of my measurements are predictions:
Sequence correctness and reading frame validation: See whether the designed cmt overexpression construct has the correct DNA sequence and maintains the proper reading frame. This would be on Benchling and SnapGene by virtually translating the DNA into protein and checking that the HA tag and cmt gene are fused without any unexpected stop codons in between.
Simulated silver binding capacity per square centimeter: Looking for published data on how much silver the metallothionein protein can bind per molecule, I can calculate the expected (or approximated) amount of silver that one square centimeter of my fungal mat could capture in experimental procedures. This is a mathematical prediction, not really a measurement, but is useful data for aim 2.
Predicted resistance heatmap: Based on published bioabsorption values for N. crassa I plan on creating a simulated heatmap showing expected electrical resistance across the mat. This is useful to know where the conductive tracks should work before growing a real fungal mat.
However, I have also planned measurements for a future wet lab phase (Aim 2) where I could physically grow the mats:
If the cmt gene was successfully inserted: After building the DNA construct, I can take a sample of the fungal colonies and run a colony PCR. Then, I can run those copies on gel electrophoresis, separating the extracted DNA by size. Knowing the length (around 600 and 700 bp) of the cmt gene, I can know if it’s in the sample I took. A plan B for this could also be to send the sample for Sanger DNA sequencing, and then see if it is actually the cmt gene sequence.
If the cmt protein is actually being produced: Having the gene does not mean the fungus makes the protein. Because my design adds a small HA tag to the cmt protein, I can use a western blot, where an antibody sticks to the HA tag. If there is presence of a dark blot at the right size, I can confirm the protein is present in engineered cells but not in wild-type controls.
If the engineered mat is more conductive than wild-type: This is the most important measurement. To do the comparison, I can grow engineered and wild-type mats in silver nitrate solution, dry them, and then use a standard multimeter to measure electrical resistance following a small 5×5 grid. Engineered mats should show lower ohm values than wild-type ones.
If the silver nanoparticles are depositing along the hyphae: To see the silver directly, I can put a small piece of the mat under a microscope. Using regular brightfield microscopy, silver nanoparticles look like dark spots or clusters along the “hyphae”. Or, on the other hand, using scanning electron microscopy, I could see the actual shape and size of the nanoparticles at much higher magnification.
If the mat decomposes in soil: To test the compostability of the mat, I can bury one used mat and one small piece of standard FR4 fiberglass circuit board in a container of soil, and take measurements (thickness, weight) and pictures each week for a period of a month or a couple of months.
Waters Part I — Molecular Weight
We will analyze an eGFP standard on a Waters Xevo G3 QTof MS system to determine the molecular weight of intact eGFP and observe its charge state distribution in the native and denatured (unfolded) states. The conditions for LC-MS analysis of intact protein cause it to unfold and be detected in its denatured form (due to the solvents and pH used for analysis).
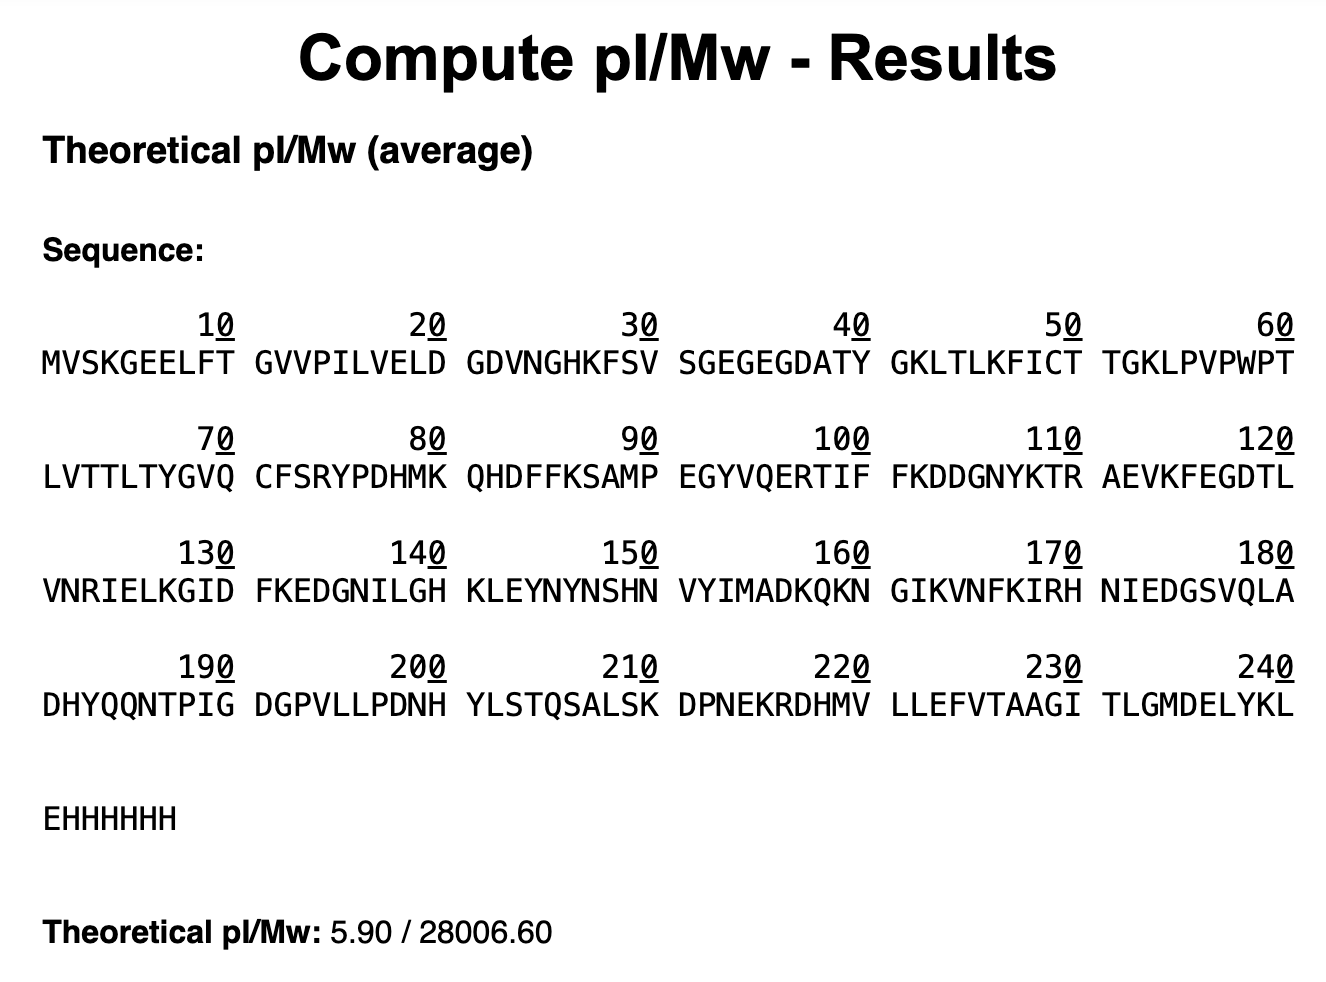
1. Based on the predicted amino acid sequence of eGFP (see below) and any known modifications, what is the calculated molecular weight? You can use an online calculator like the one at https://web.expasy.org/compute_pi/ eGFP Sequence:
MVSKGEELFTG VVPILVELDG DVNGHKFSVS GEGEGDATYG KLTLKFICTT GKLPVPWPTL VTTLTYGVQC FSRYPDHMKQ HDFFKSAMPE GYVQERTIFF KDDGNYKTRA EVKFEGDTLV NRIELKGIDF KEDGNILGHK LEYNYNSHNV YIMADKQKNG IKVNFKIRHN IEDGSVQLAD HYQQNTPIGD GPVLLPDNHY LSTQSALSKD PNEKRDHMVL LEFVTAAGIT LGMDELYKLE HHHHHH
Note: This contains a His-purification tag (HHHHHH) and a linker (the LE before it).
The results from the Expasy calculator are the following:
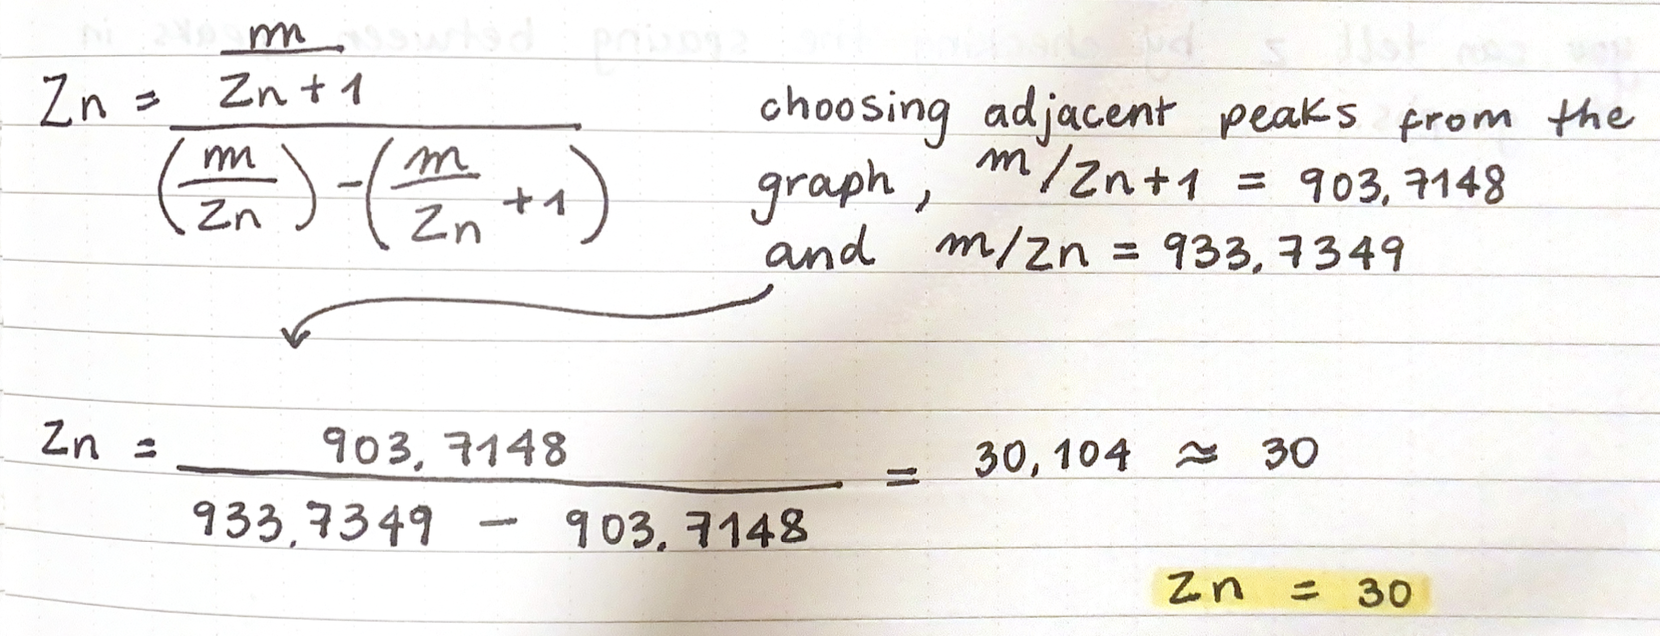
 2. Calculate the molecular weight of the eGFP using the adjacent charge state approach described in the recitation. Select two charge states from the intact LC-MS data (Figure 1) and:
2.1 Determine z for each adjacent pair of peaks (n, n+1):
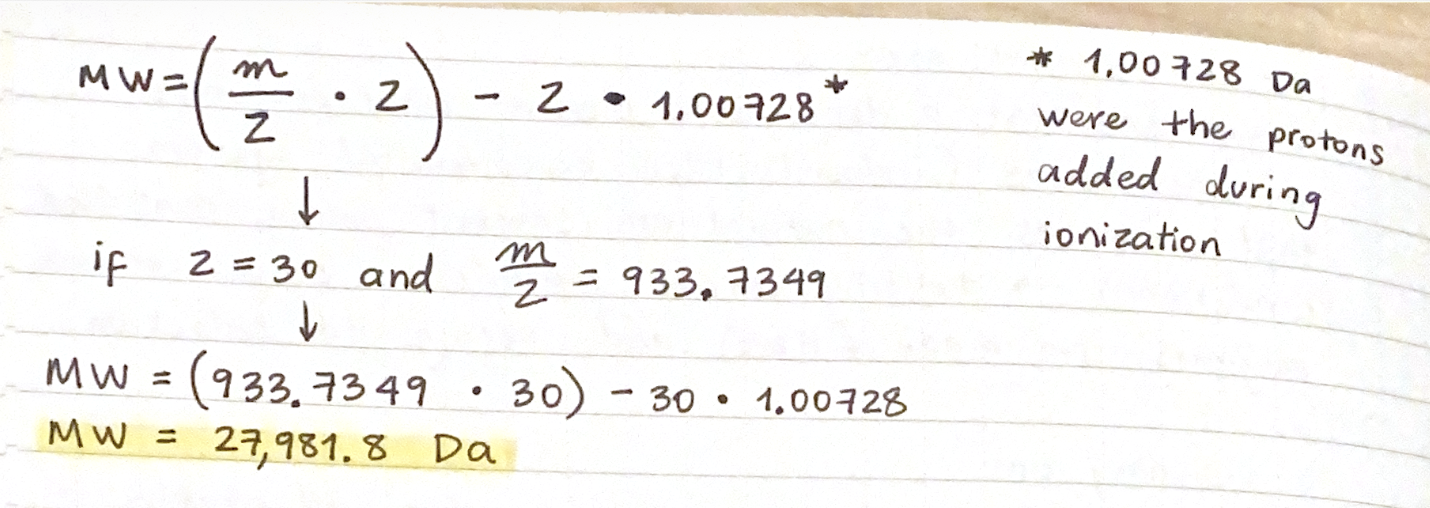
2.2 Determine the MW of the protein:
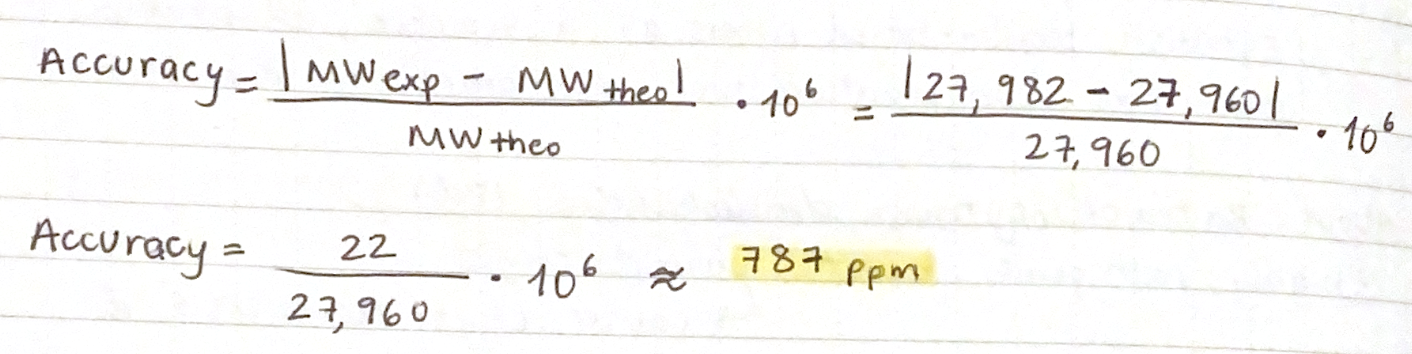
2.3 Calculate the accuracy of the measurement using the deconvoluted MW from 2.2 and the predicted weight of the protein from 2.1
3. Can you observe the charge state for the zoomed-in peak in the mass spectrum for the intact eGFP? If yes, what is it? If no, why not?
Since the protein unfolded and is showing at its denatured state, the protein is in a larger charged state than the mass spectrometer can catch, so you can’t see it.
Waters Part II — Secondary/Tertiary structure
We will analyze eGFP in its native, folded state and compare it to its denatured, unfolded state on a quadrupole time-of-flight MS. We will be doing MS-only analysis (no liquid chromatography, also known as “direct infusion” experiments) on the Waters Xevo G3-QToF MS.
1. Based on learnings in the lab, please explain the difference between native and denatured protein conformations. For example, what happens when a protein unfolds? How is that determined with a mass spectrometer? What changes do you see in the mass spectrum between the native and denatured protein analyses (Figure 2)?
Unfolded proteins tend to have many high charge states, which means that the spectrometer will produce peaks across low m/z, because there are more basic sites exposed where more protons can attach to the protein. Folded proteins, on the other hand, tend to have less lower charge states, which means that the spectrometer will produce peaks at high m/z, because the folded structure hides the protonatable sites. In Figure 2 you can see the peaks around 800-1800 m/z (top) for the unfolded protein and the fewer peaks around 2000-3000 m/z (bottom) for the folded protein.
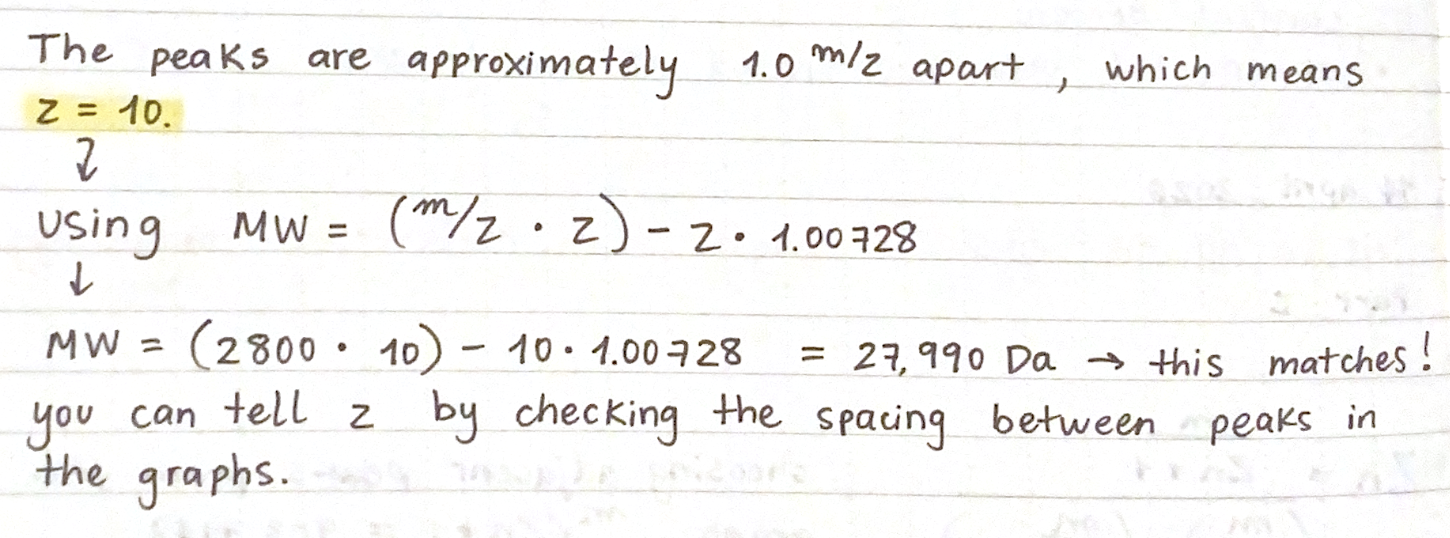
2. Zooming into the native mass spectrum of eGFP from the Waters Xevo G3 QTof MS (see Figure 3), can you discern the charge state of the peak at ~2800 What is the charge state? How can you tell?
Waters Part III — Peptide Mapping - primary structure
We will digest the eGFP protein standard into peptides using trypsin (an enzyme that selectively cleaves the peptide bond after Lysine (K) and Arginine (R) residues. The resulting peptides will be analyzed on the Waters BioAccord LC-MS to measure their molecular weights and fragmented to confirm the amino acid sequence within each peptide – generating a “peptide map”. This process is used to confirm the primary structure of the protein. There are a variety of tools available online to calculate protein molecular weight and predict a list of peptides generated from a tryptic digest. We will be using tools within the online resource Expasy (the bioinformatics resource portal of the Swiss Institute of Bioinformatics (SIB)) to predict a list of tryptic peptides from eGFP.
1. How many Lysines (K) and Arginines (R) are in eGFP? Please circle or highlight them in the eGFP sequence given in Waters Part I question 1 above. (Note: adding the sequence to Benchling as an amino acid file and clicking the biochemical properties tab will show you a count for each amino acid).
There are 19 Lysines and 5 Arginines in total:
MVSKGEELFTG VVPILVELDG DVNGHKFSVS GEGEGDATYG KLTLKFICTT GKLPVPWPTL VTTLTYGVQC FSRYPDHMKQ HDFFKSAMPE GYVQERTIFF KDDGNYKTRA EVKFEGDTLV NRIELKGIDF KEDGNILGHK LEYNYNSHNV YIMADKQKNG IKVNFKIRHN IEDGSVQLAD HYQQNTPIGD GPVLLPDNHY LSTQSALSKD PNEKRDHMVL LEFVTAAGIT LGMDELYKLE HHHHHH
2. How many peptides will be generated from tryptic digestion of eGFP? 2.1 Navigate to https://web.expasy.org/peptide_mass/ 2.2 Copy/paste the sequence above into the input box in the PeptideMass tool to expected list of peptides. 2.3 Use Figure 4 below as a guide for the relevant parameters to predict peptides from eGFP. Here are the results from PeptideMass:
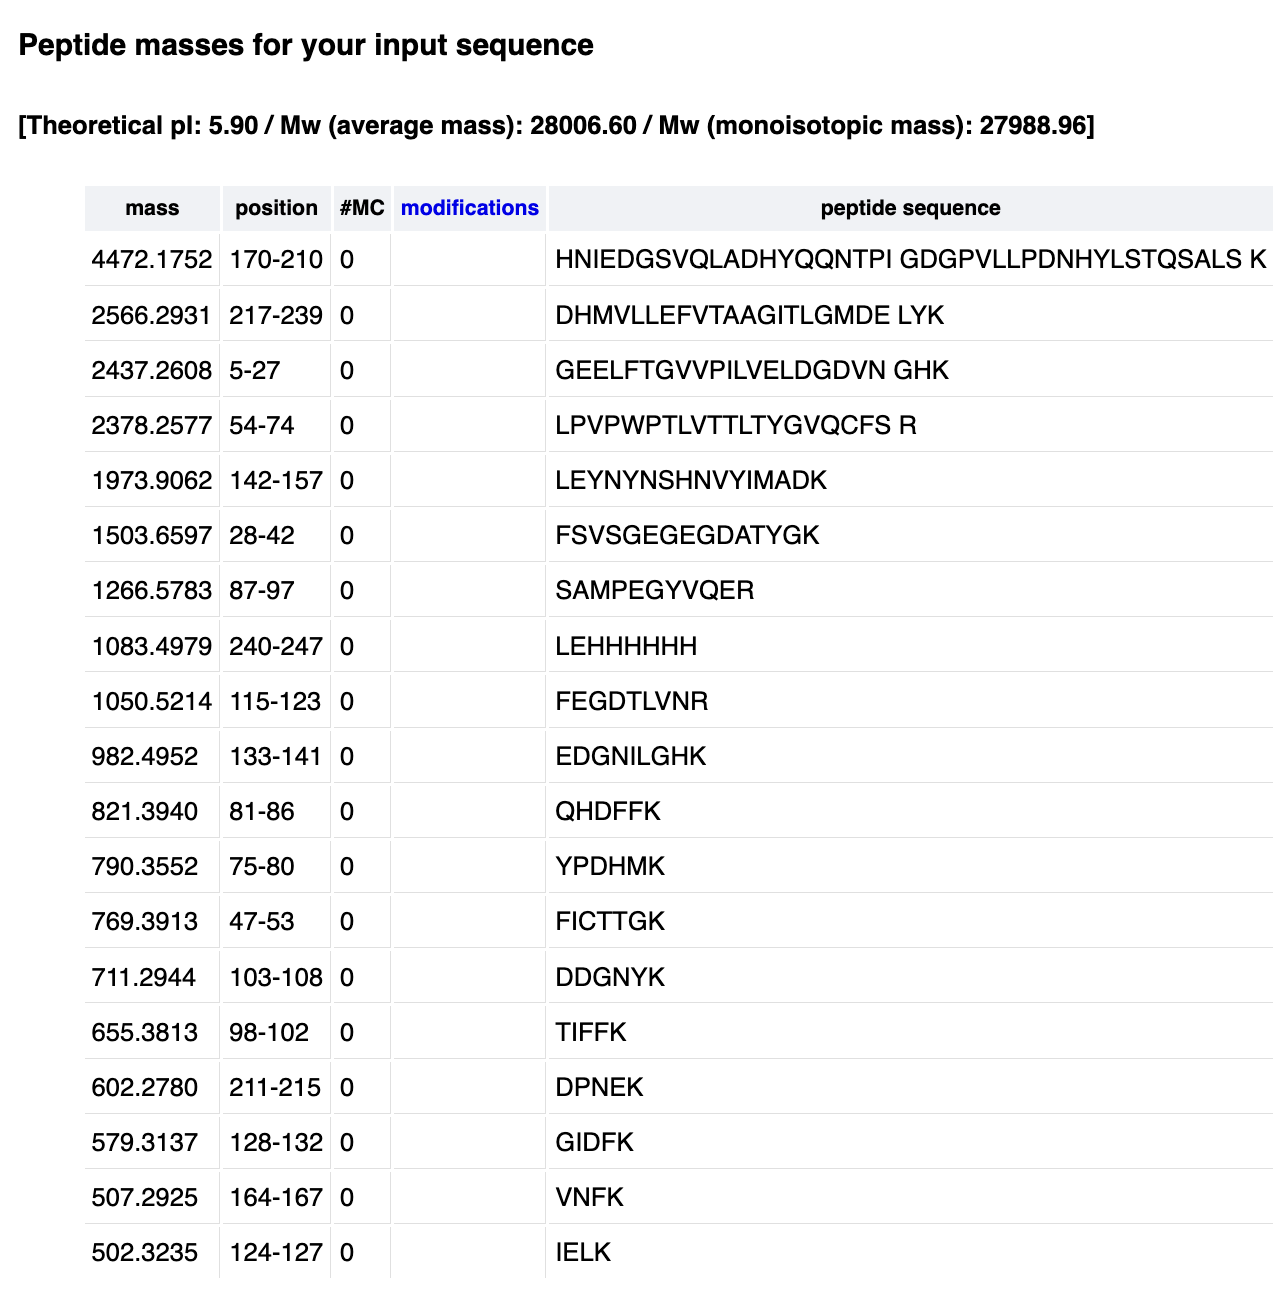
It reports 19 peptides
3. Based on the LC-MS data for the Peptide Map data generated in lab (please use Figure 5a as a reference) how many chromatographic peaks do you see in the eGFP peptide map between 0.5 and 6 minutes? You may count all peaks that are >10% relative abundance.
According to Figure 5a, I can see are approximately 16 peaks above the 10% relative abundance between 0.5 and 6 minutes: 0.43, 0.61, 0.79, 1.20, 1.43, 1.80, 1.85, 1.93, 2.17, 2.26, 2.54, 2.78, 3.27, 3.53, 3.59, 3.70
4. Assuming all the peaks are peptides, does the number of peaks match the number of peptides predicted from question 2 above? Are there more peaks in the chromatogram or fewer?
I see less peaks in the peptide map than the ones predicted. Maybe the prediction had more peptides because they are smaller, and they are retained.
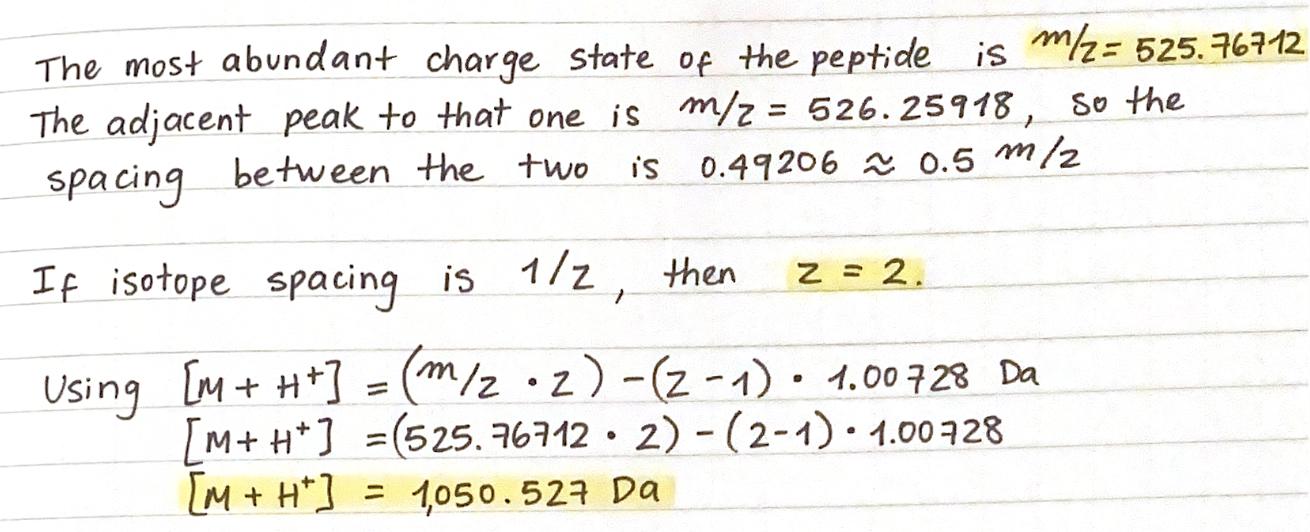
5. Identify the mass-to-charge of the peptide shown in Figure 5b. What is the charge () of the most abundant charge state of the peptide (use the separation of the isotopes to determine the charge state). Calculate the mass of the singly charged form of the peptide
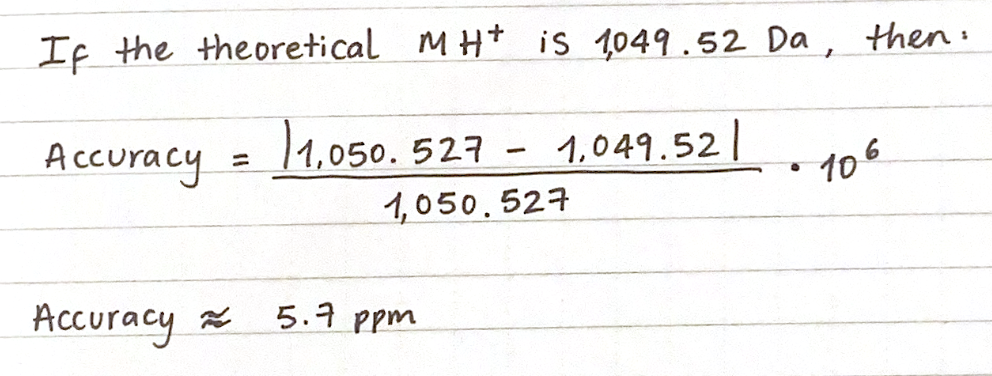
6. Identify the peptide based on comparison to expected masses in the PeptideMass tool. What is mass accuracy of measurement? Please calculate the error in ppm.
7. What is the percentage of the sequence that is confirmed by peptide mapping? According to Figure 6, 88% of the eGFP sequence is confirmed by peptide mapping.
Waters Part IV — Oligomers
We will determine Keyhole Limpet Hemocyanin (KLH)’s oligomeric states using charge detection mass spectrometry (CDMS). CDMS single-particle measurements of KLH allow us to make direct mass measurements to determine what oligomeric states (that is, how many protein subunits combine) are present in solution. Using the known masses of the polypeptide subunits (Table 1) for KLH, identify where the following oligomeric species are on the spectrum shown below from the CDMS (Figure 7):
- 7FU Decamer → 10 x 340 kDa = 3,400 kDa = 3.4 MDa
- 8FU Didecamer → 20 × 400 kDa = 8,000 kDa = 8.0 MDa
- 8FU 3-Decamer → 30 × 400 kDa = 12,000 kDa = 12 MDa
- 8FU 4-Decamer → 40 × 400 kDa = 16,000 kDa = 16 MDa
Now looking at the peaks in Figure 7, I see peaks at approximately 3.4 MDa, 8.33 MDa, 12.67 MDa and a smaller one around 16-17 MDa.
Waters Part V — Did I make GFP?
Please fill out this table with the data you acquired from the lab work done at the Waters Immerse Lab in Cambridge, or else the data screenshots in this document if you were unable to have lab work done at Waters.
| Theoretical | Observed/measured on the Intact LC-MS | PPM Mass Error | Molecular weight (kDa) |
|---|---|---|---|
| 27.960 kDa | 27.990 kDa | 787 ppm |
The measured mass is close to the theoretical mass, confirming that the protein could be eGFP :)