Gel Electrophoresis Designs Our group set out to make a design with the letters “HA”, standing for the name of one of our group members, Hines Alayah. We somehow ended up with “LU” instead. Sometimes biology happens by accident, so we have decided that “LU” stands for Love U.
A few photo highlights below.
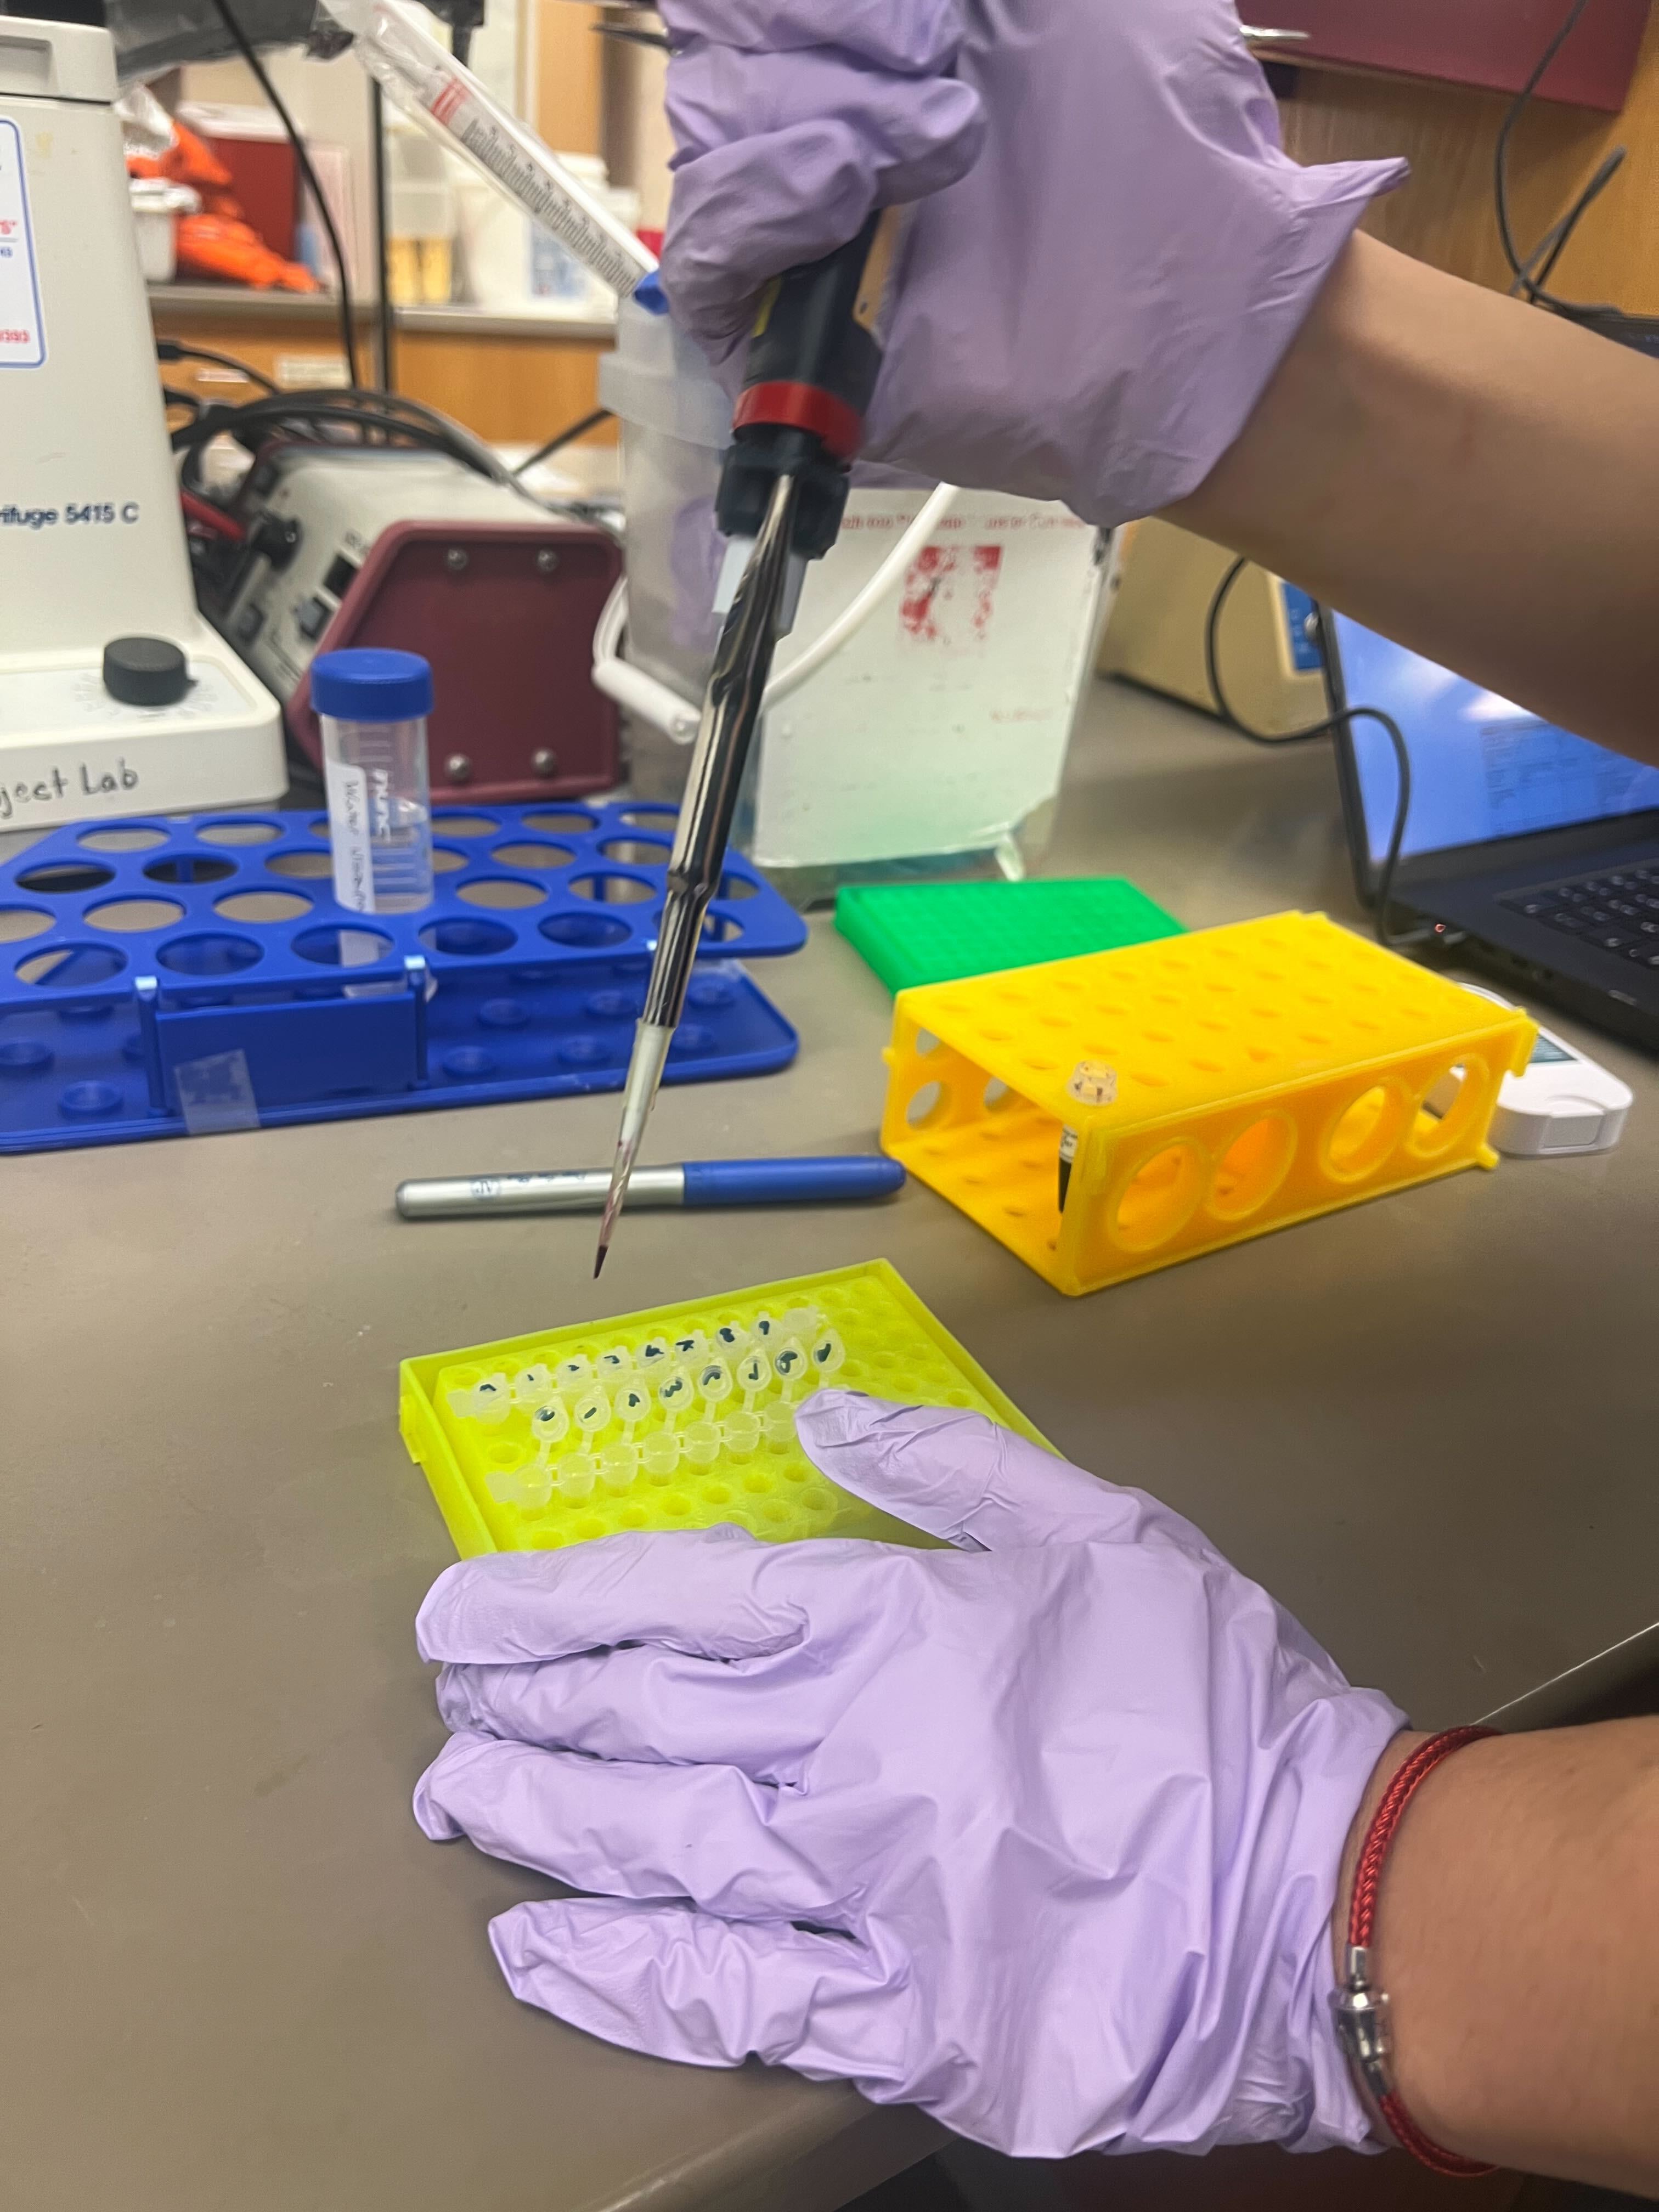
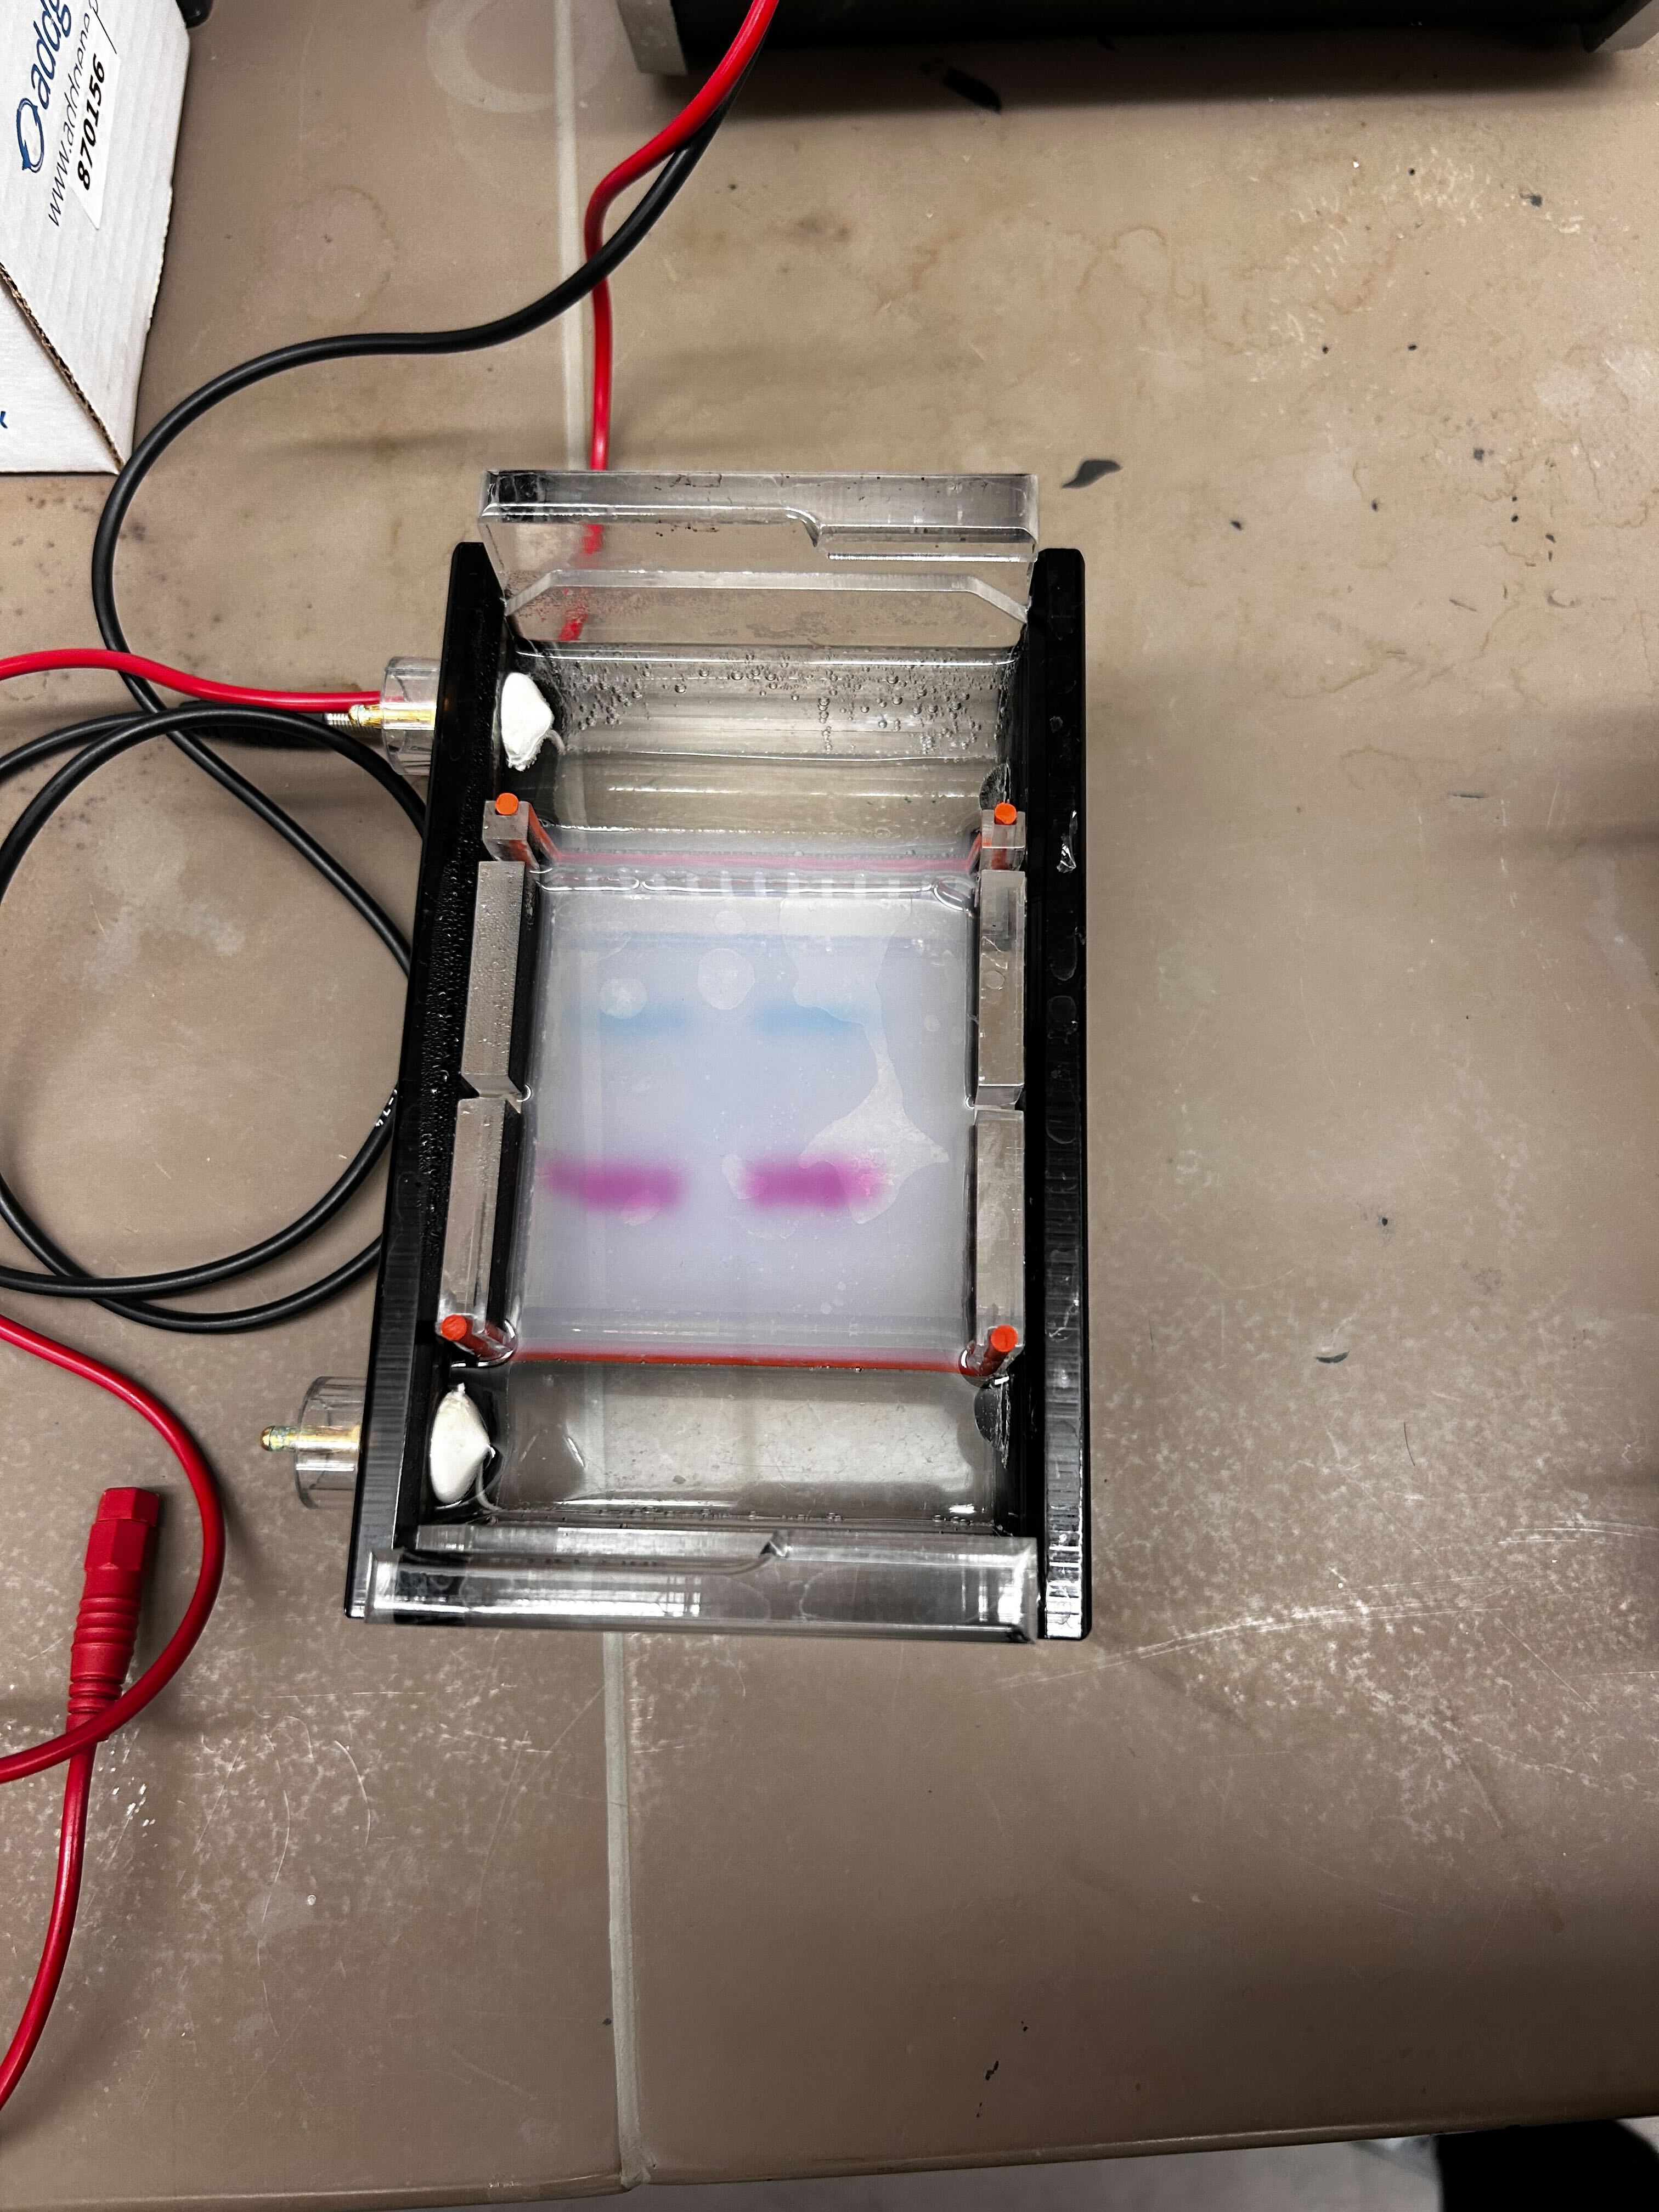
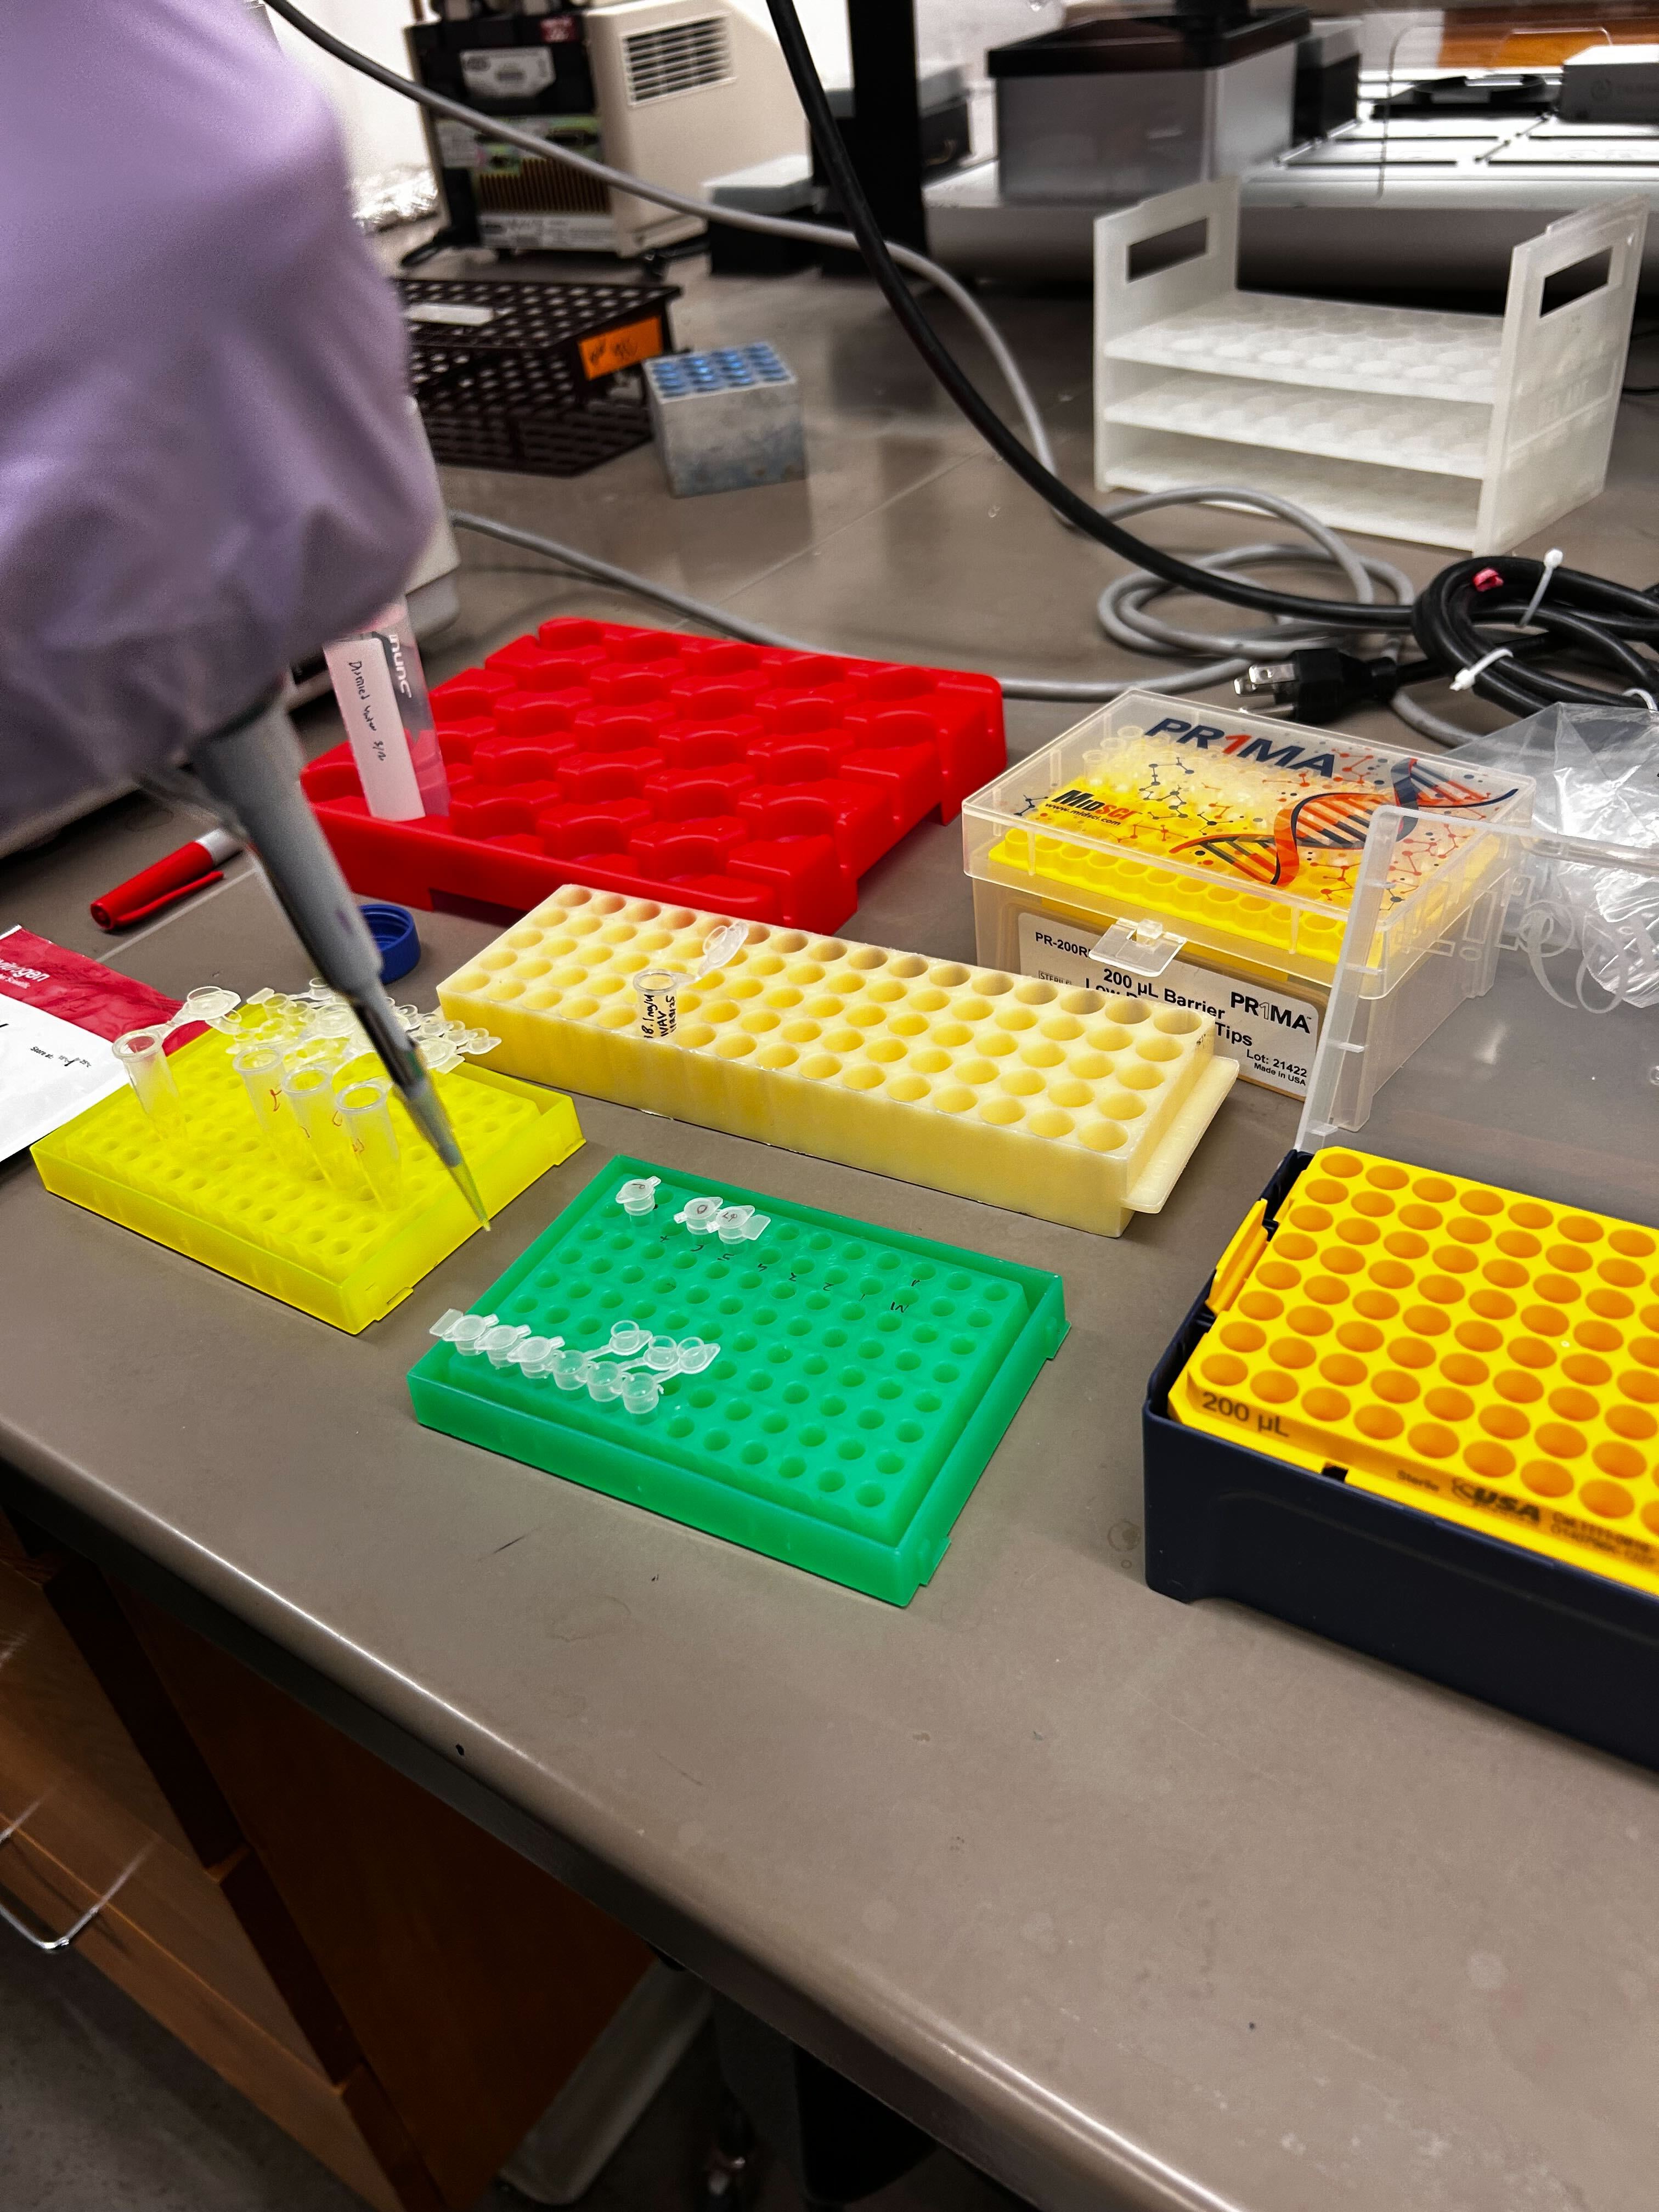
Loading the restriction enzymes into the lanes.
Opentrons Designs I tried to push Opentrons to the limit and chose a fairly hard design: the Mitsudomoe, a traditional Japanese family crest (Kamon) associated with my family. The result didn’t come out particularly clean, but with higher resolution and non-sequential pipetting (for speed) it would be more tractable.
Reference design and Opentrons version:
Lab Automation Find a published paper that uses Opentrons or another automation tool for a novel biological application. The paper I chose is AssemblyTron: flexible automation of DNA assembly with Opentrons OT-2 lab robots, by Bryant et al., published in Synthetic Biology (2023). The authors developed an open-source Python package called AssemblyTron that connects j5 DNA assembly design software to an Opentrons OT-2 liquid handling robot, allowing users to go from a digital DNA design to a physically assembled construct with minimal hands-on work.
Gibson Assembly Lab This week we performed a Gibson Assembly to clone chromophore-mutant inserts into the mUAV backbone. A few photo highlights from the lab.
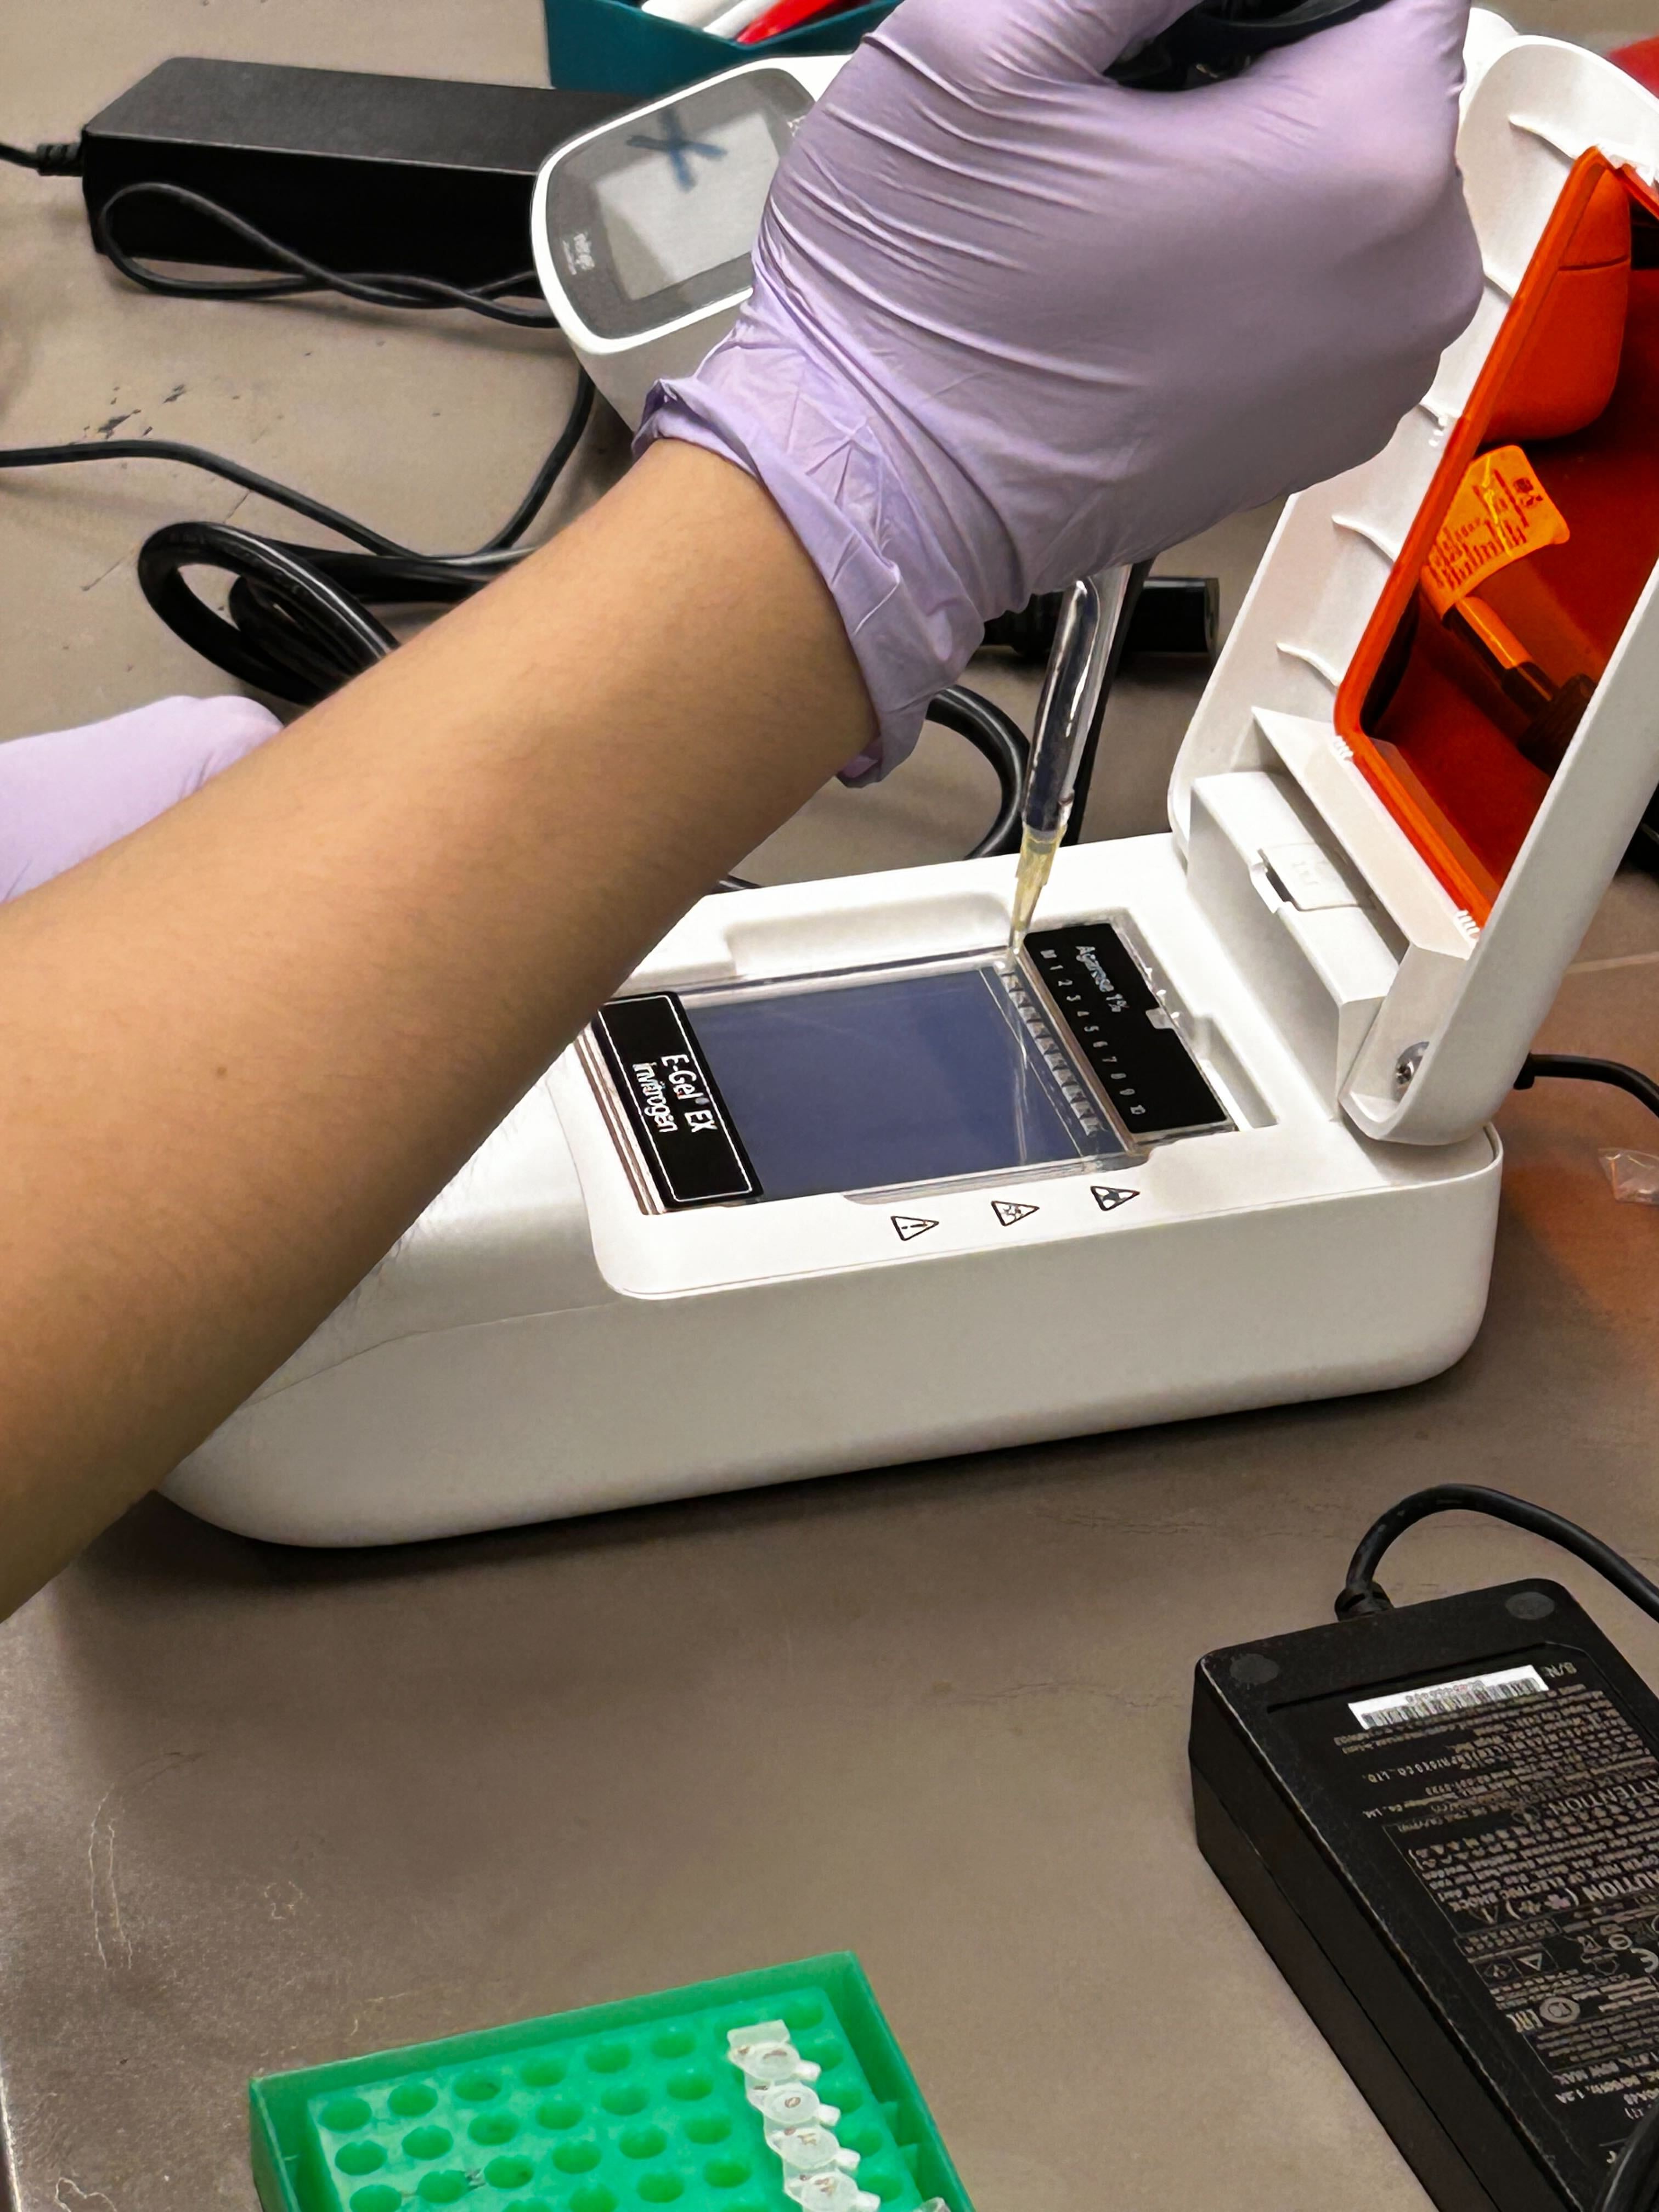
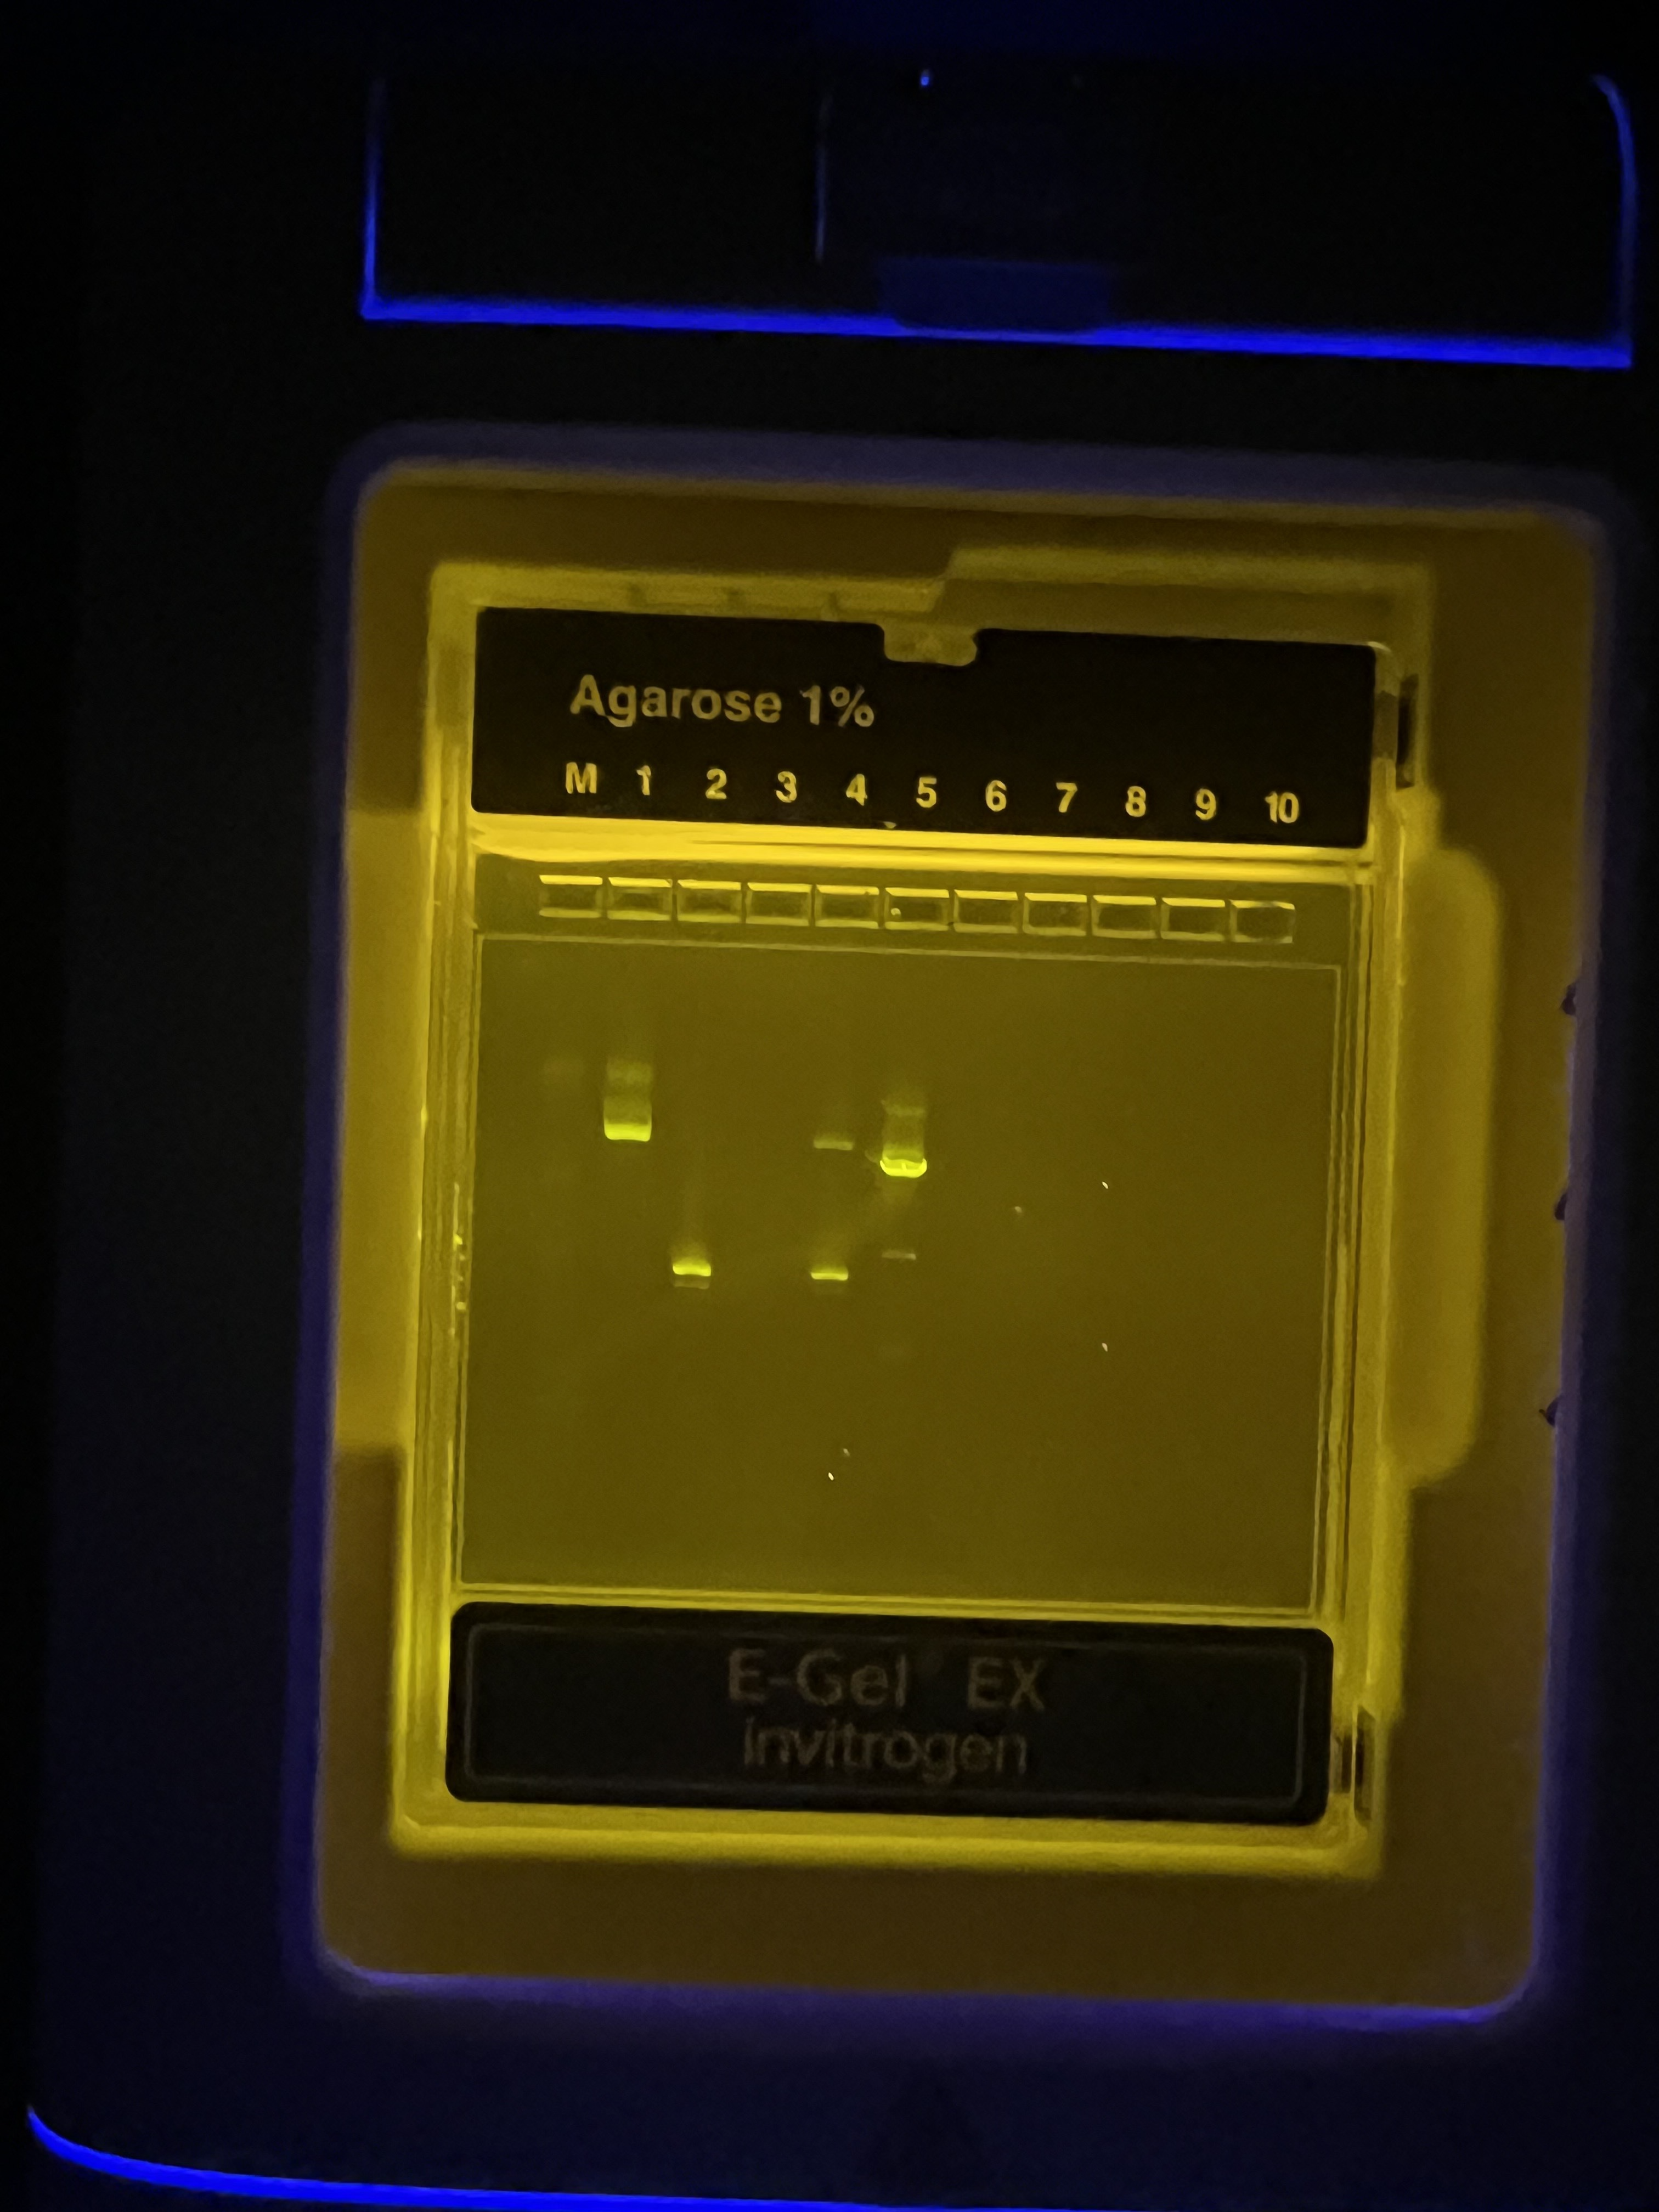
Setting up the PCR reactions: pipetting primers, template, and master mix into tubes. Loading samples into the E-Gel EX Invitrogen cassette for gel electrophoresis.
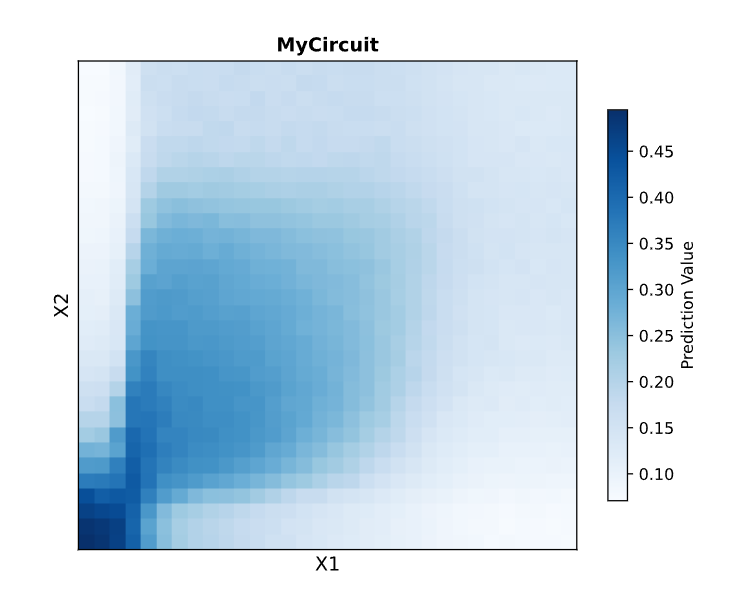
This week we designed a 2-layer intracellular neural network circuit and simulated its behavior. Our team designed a comet. The heatmap of the circuit’s predicted output across X1 and X2 input space produced a comet-shaped gradient: high expression concentrated in the low-X1 / low-X2 corner, with a tail fading diagonally across the landscape.
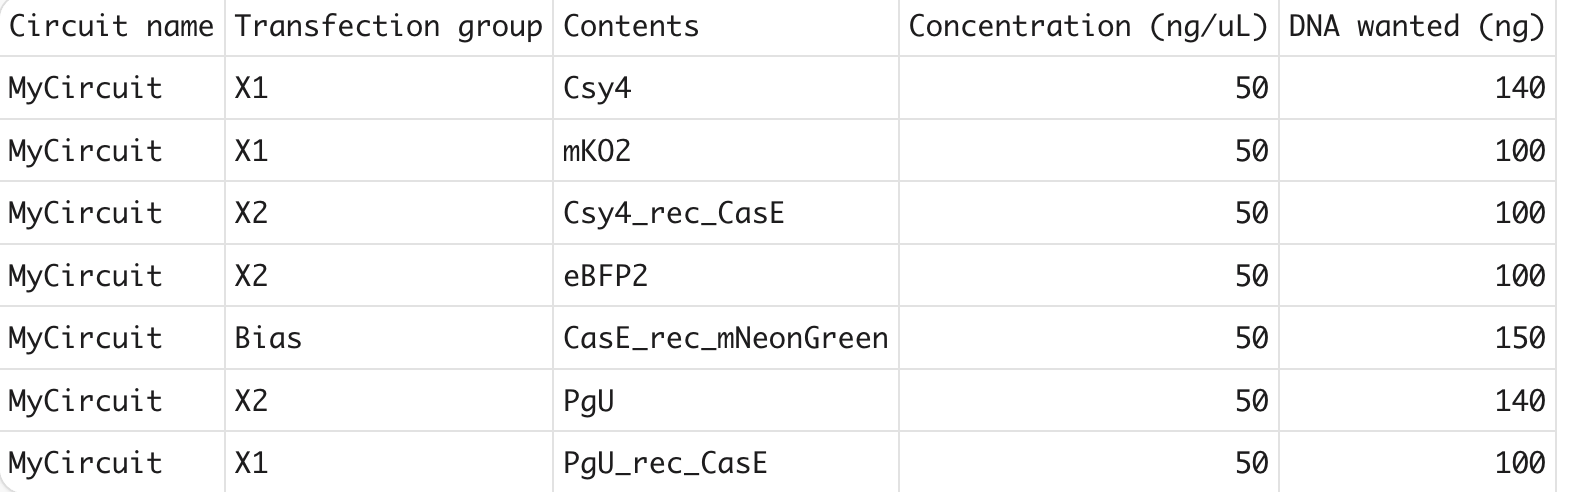
Circuit design spreadsheet. Our poly-transfection mix with Csy4, CasE, mNeonGreen, and fluorescent markers.
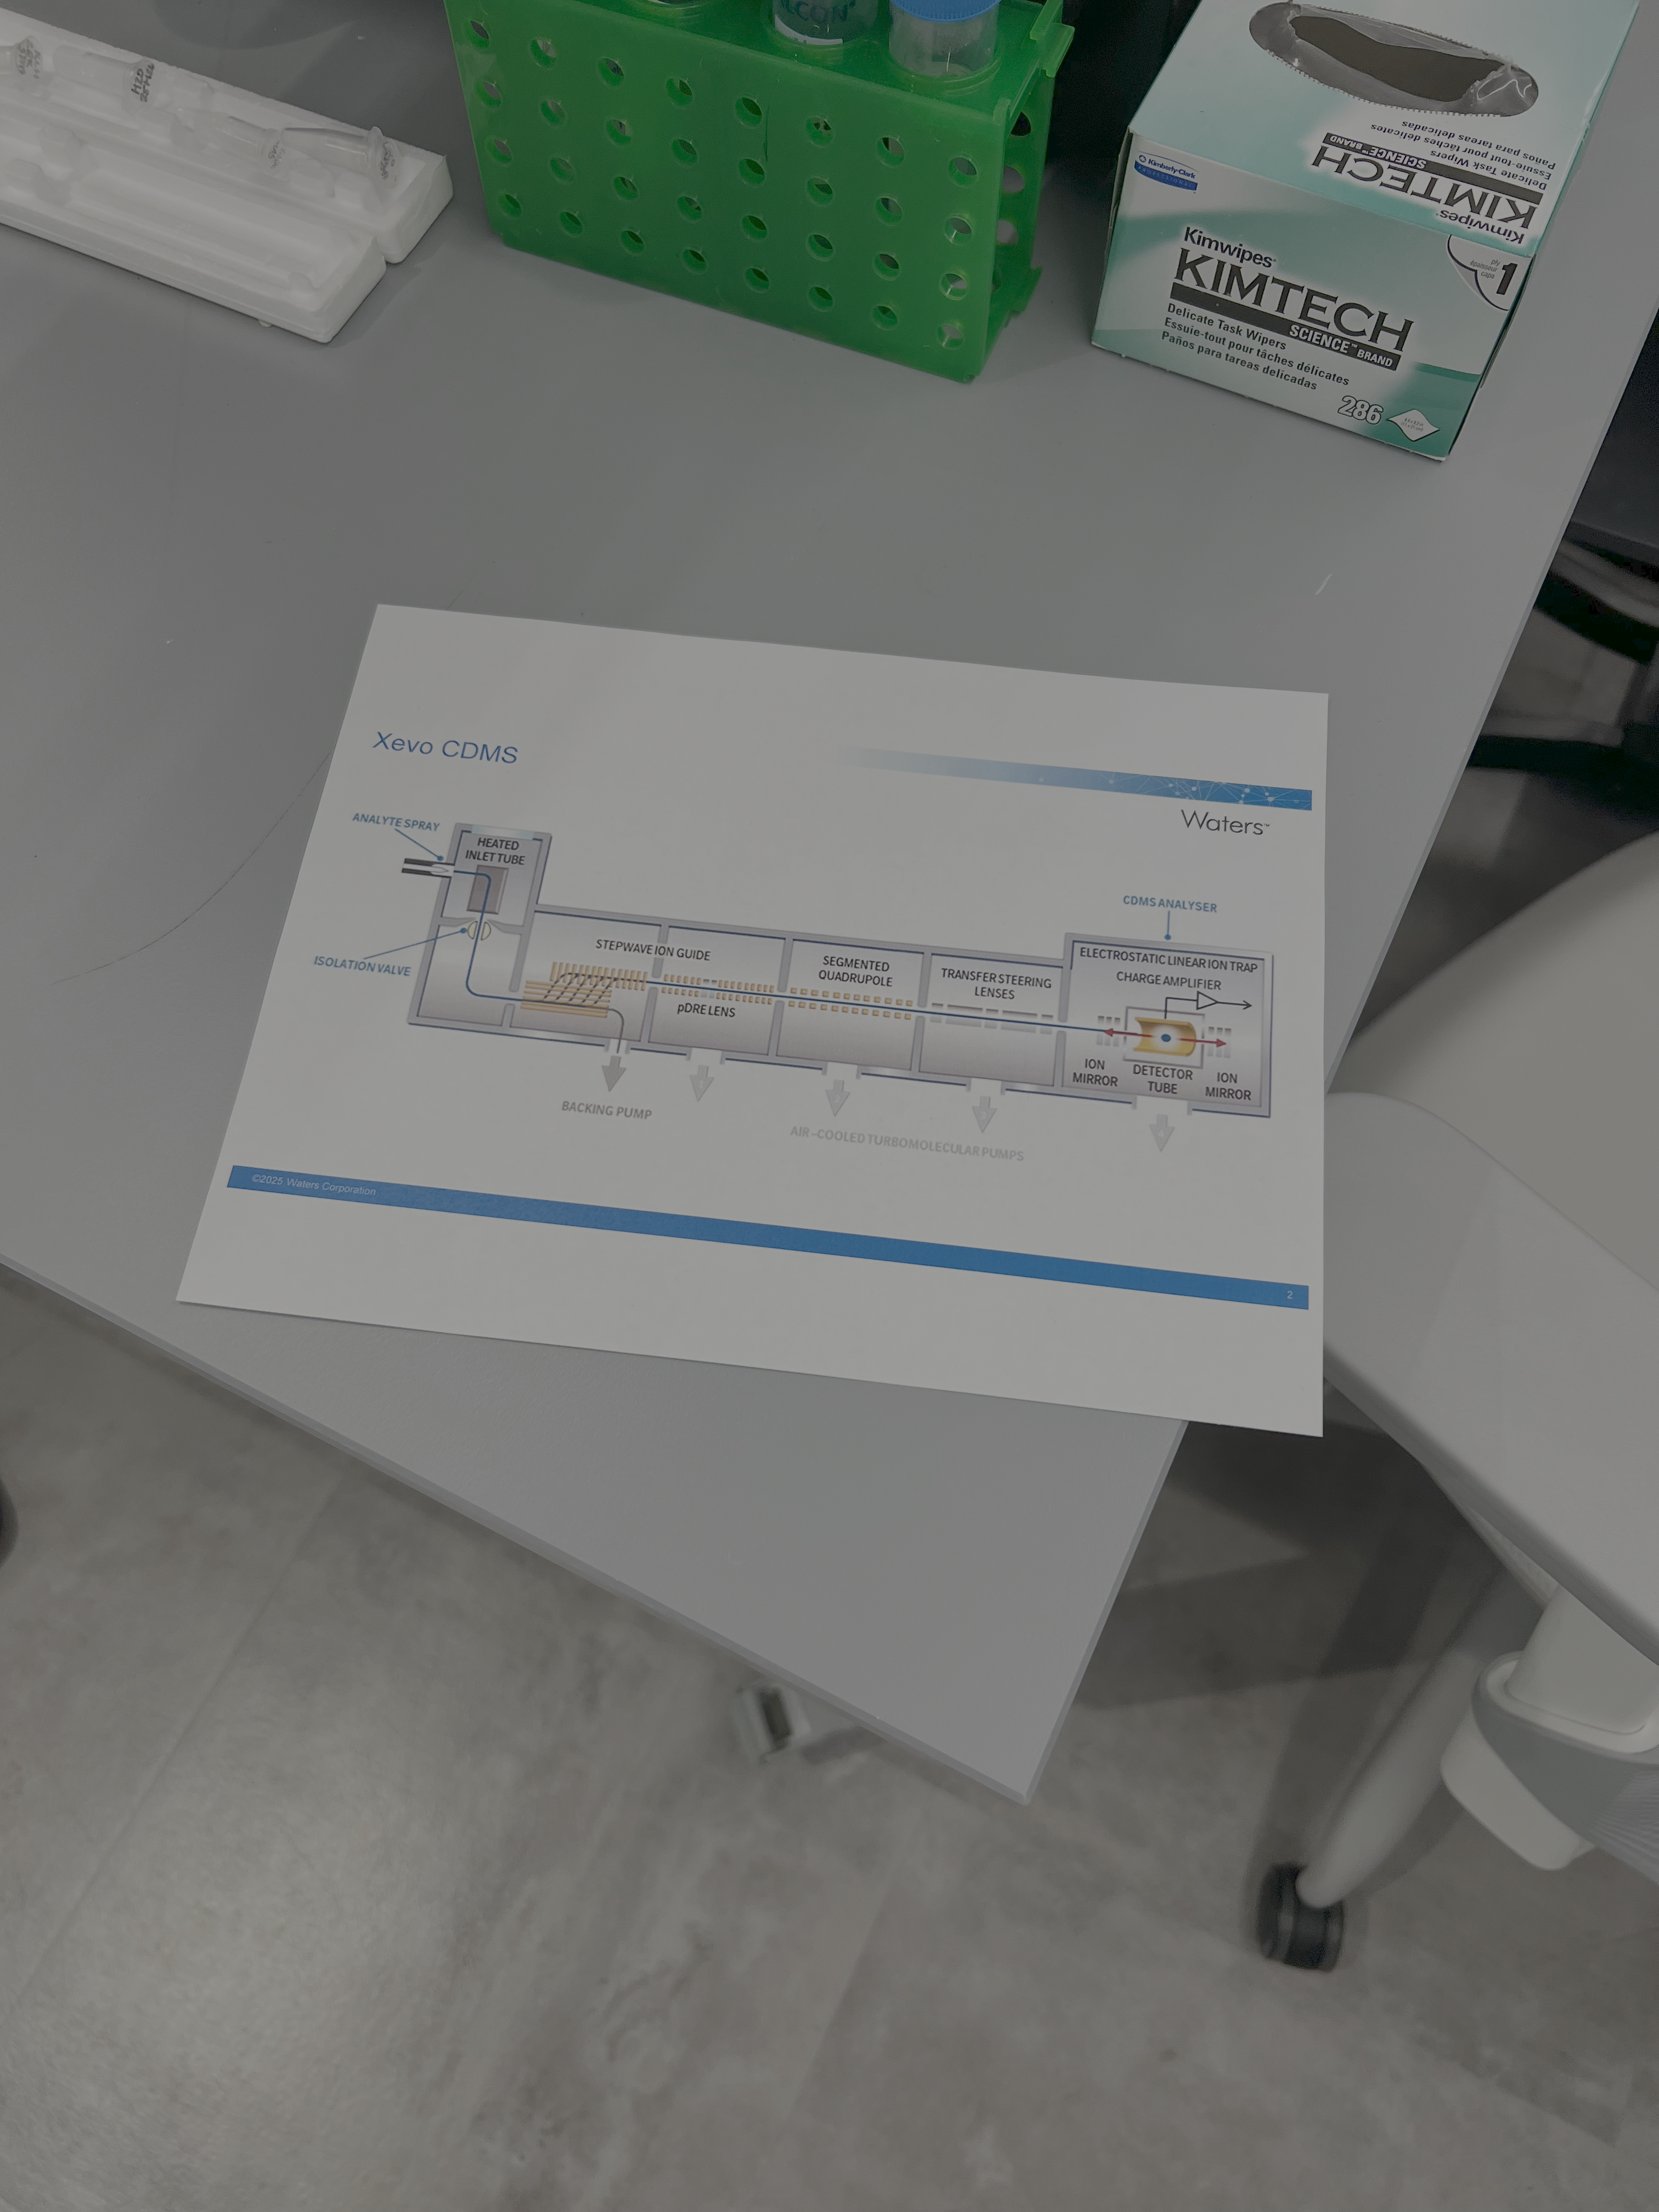
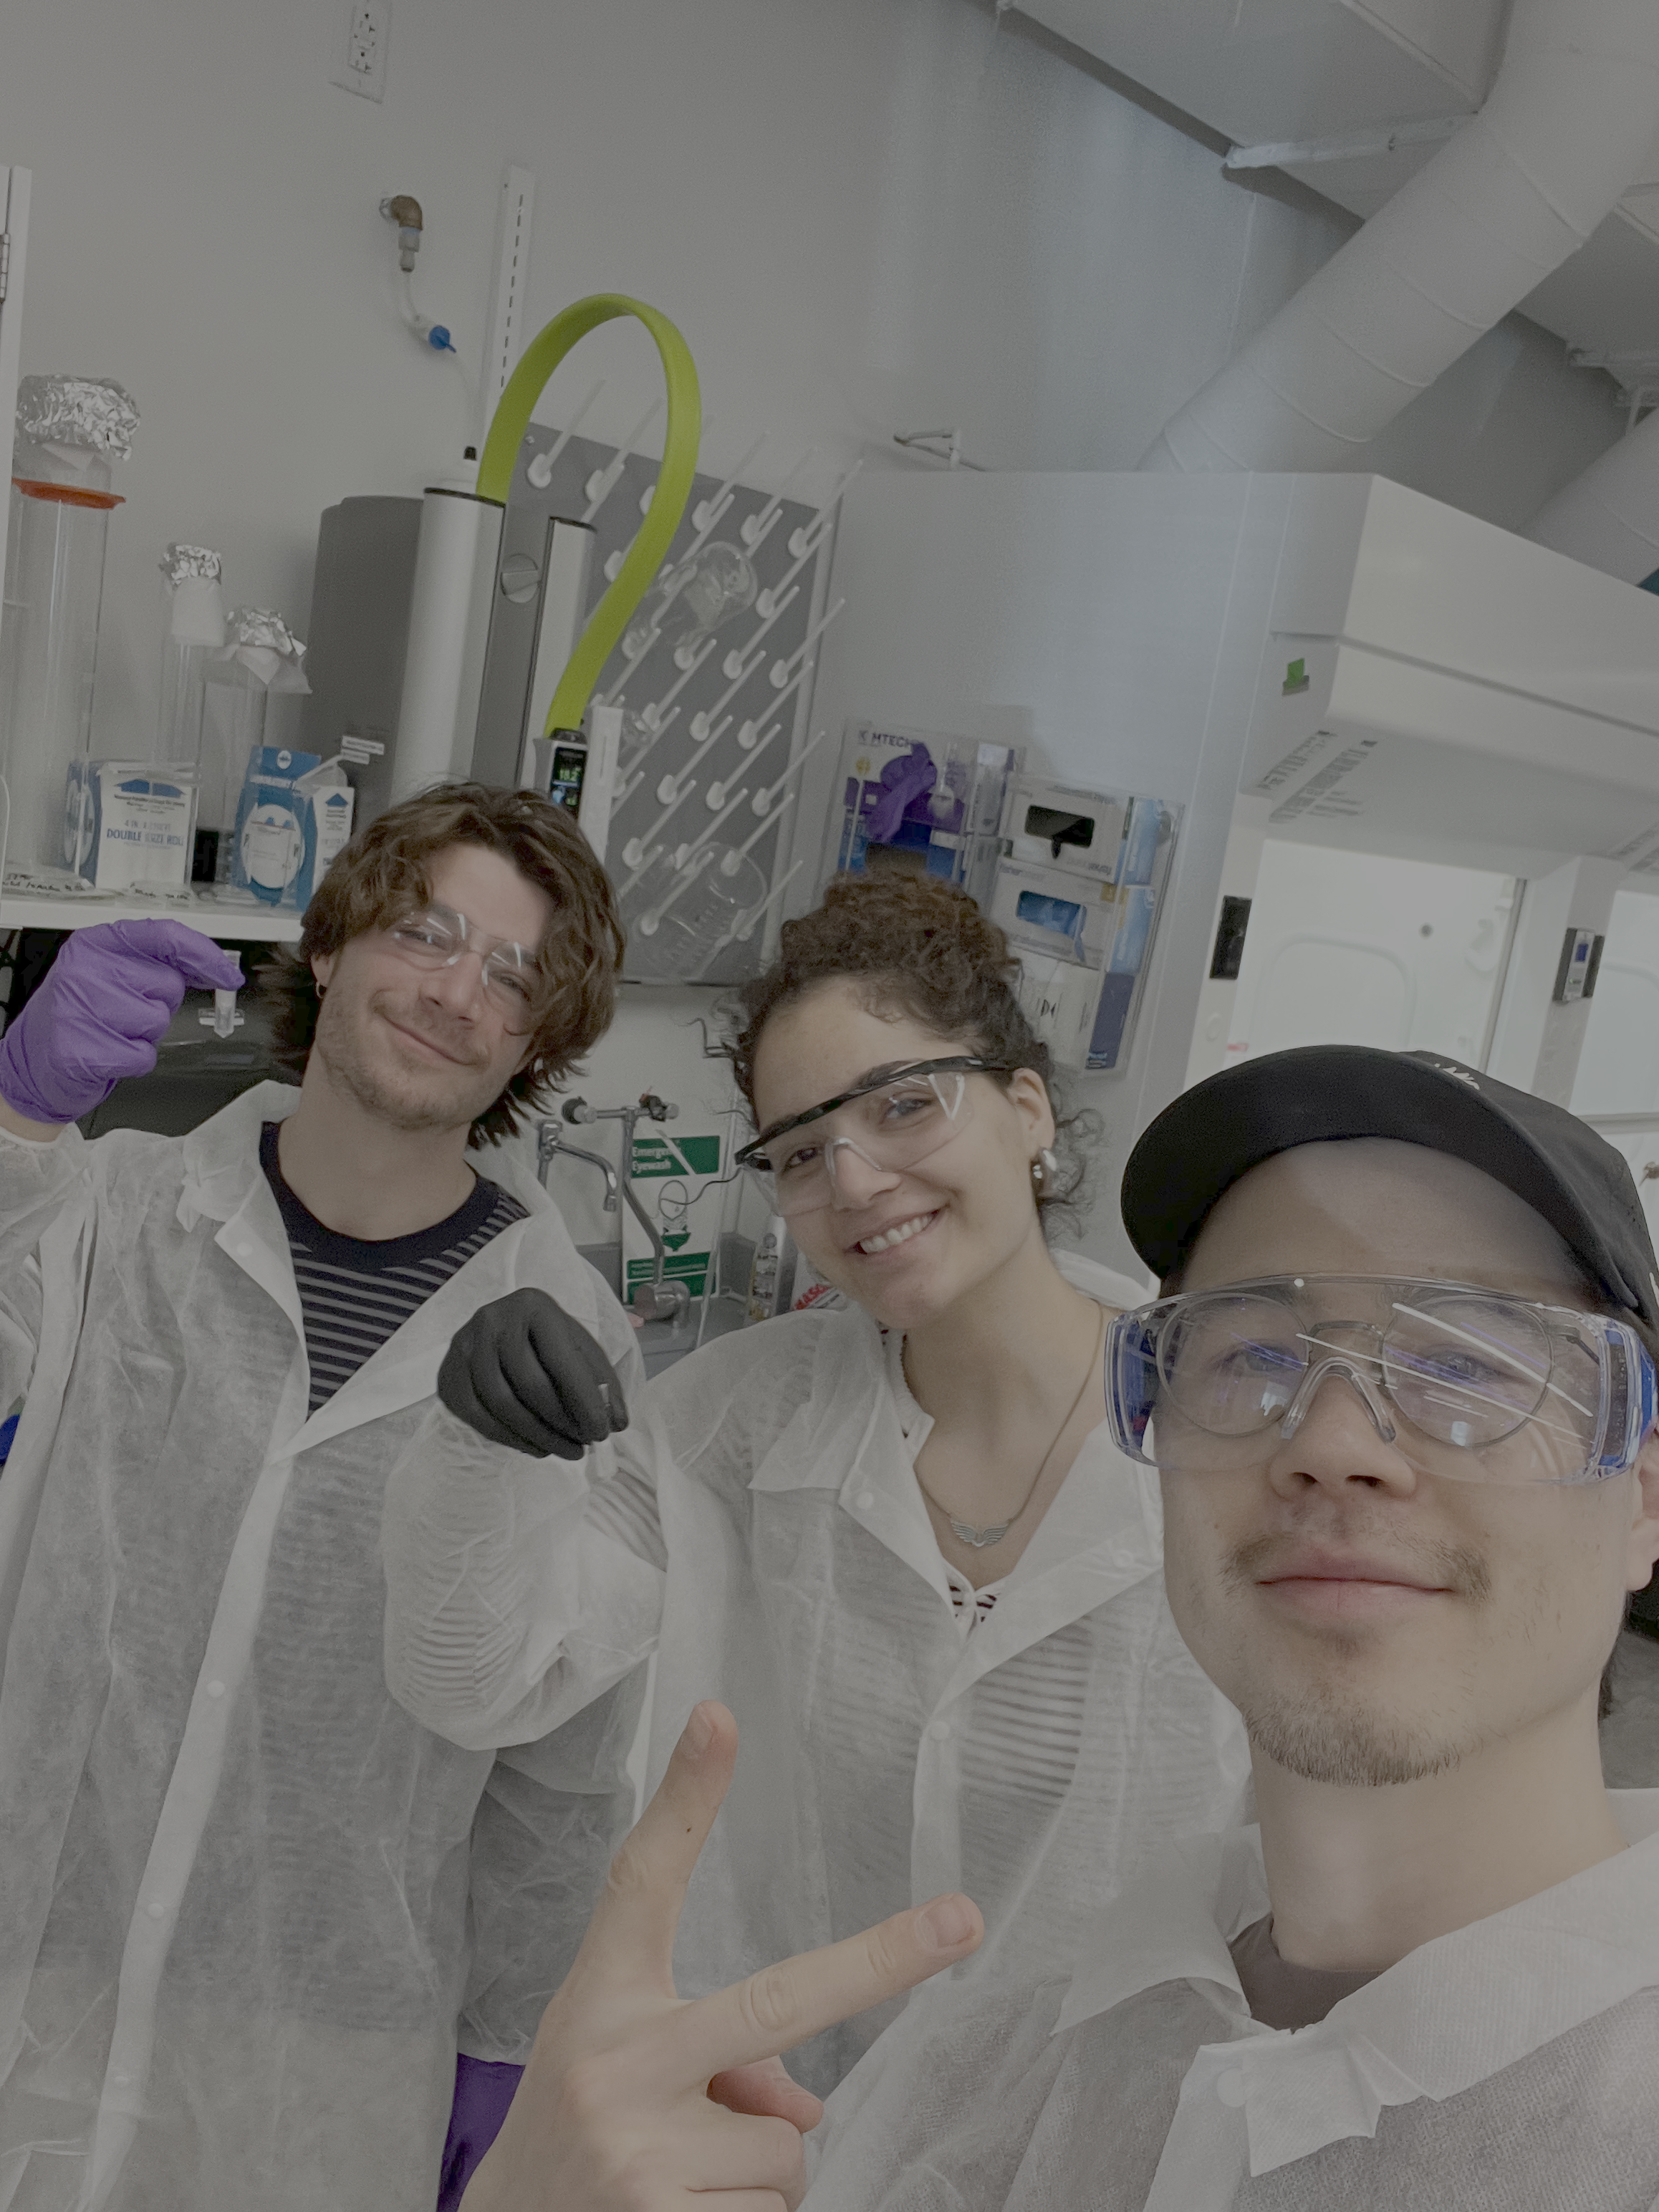
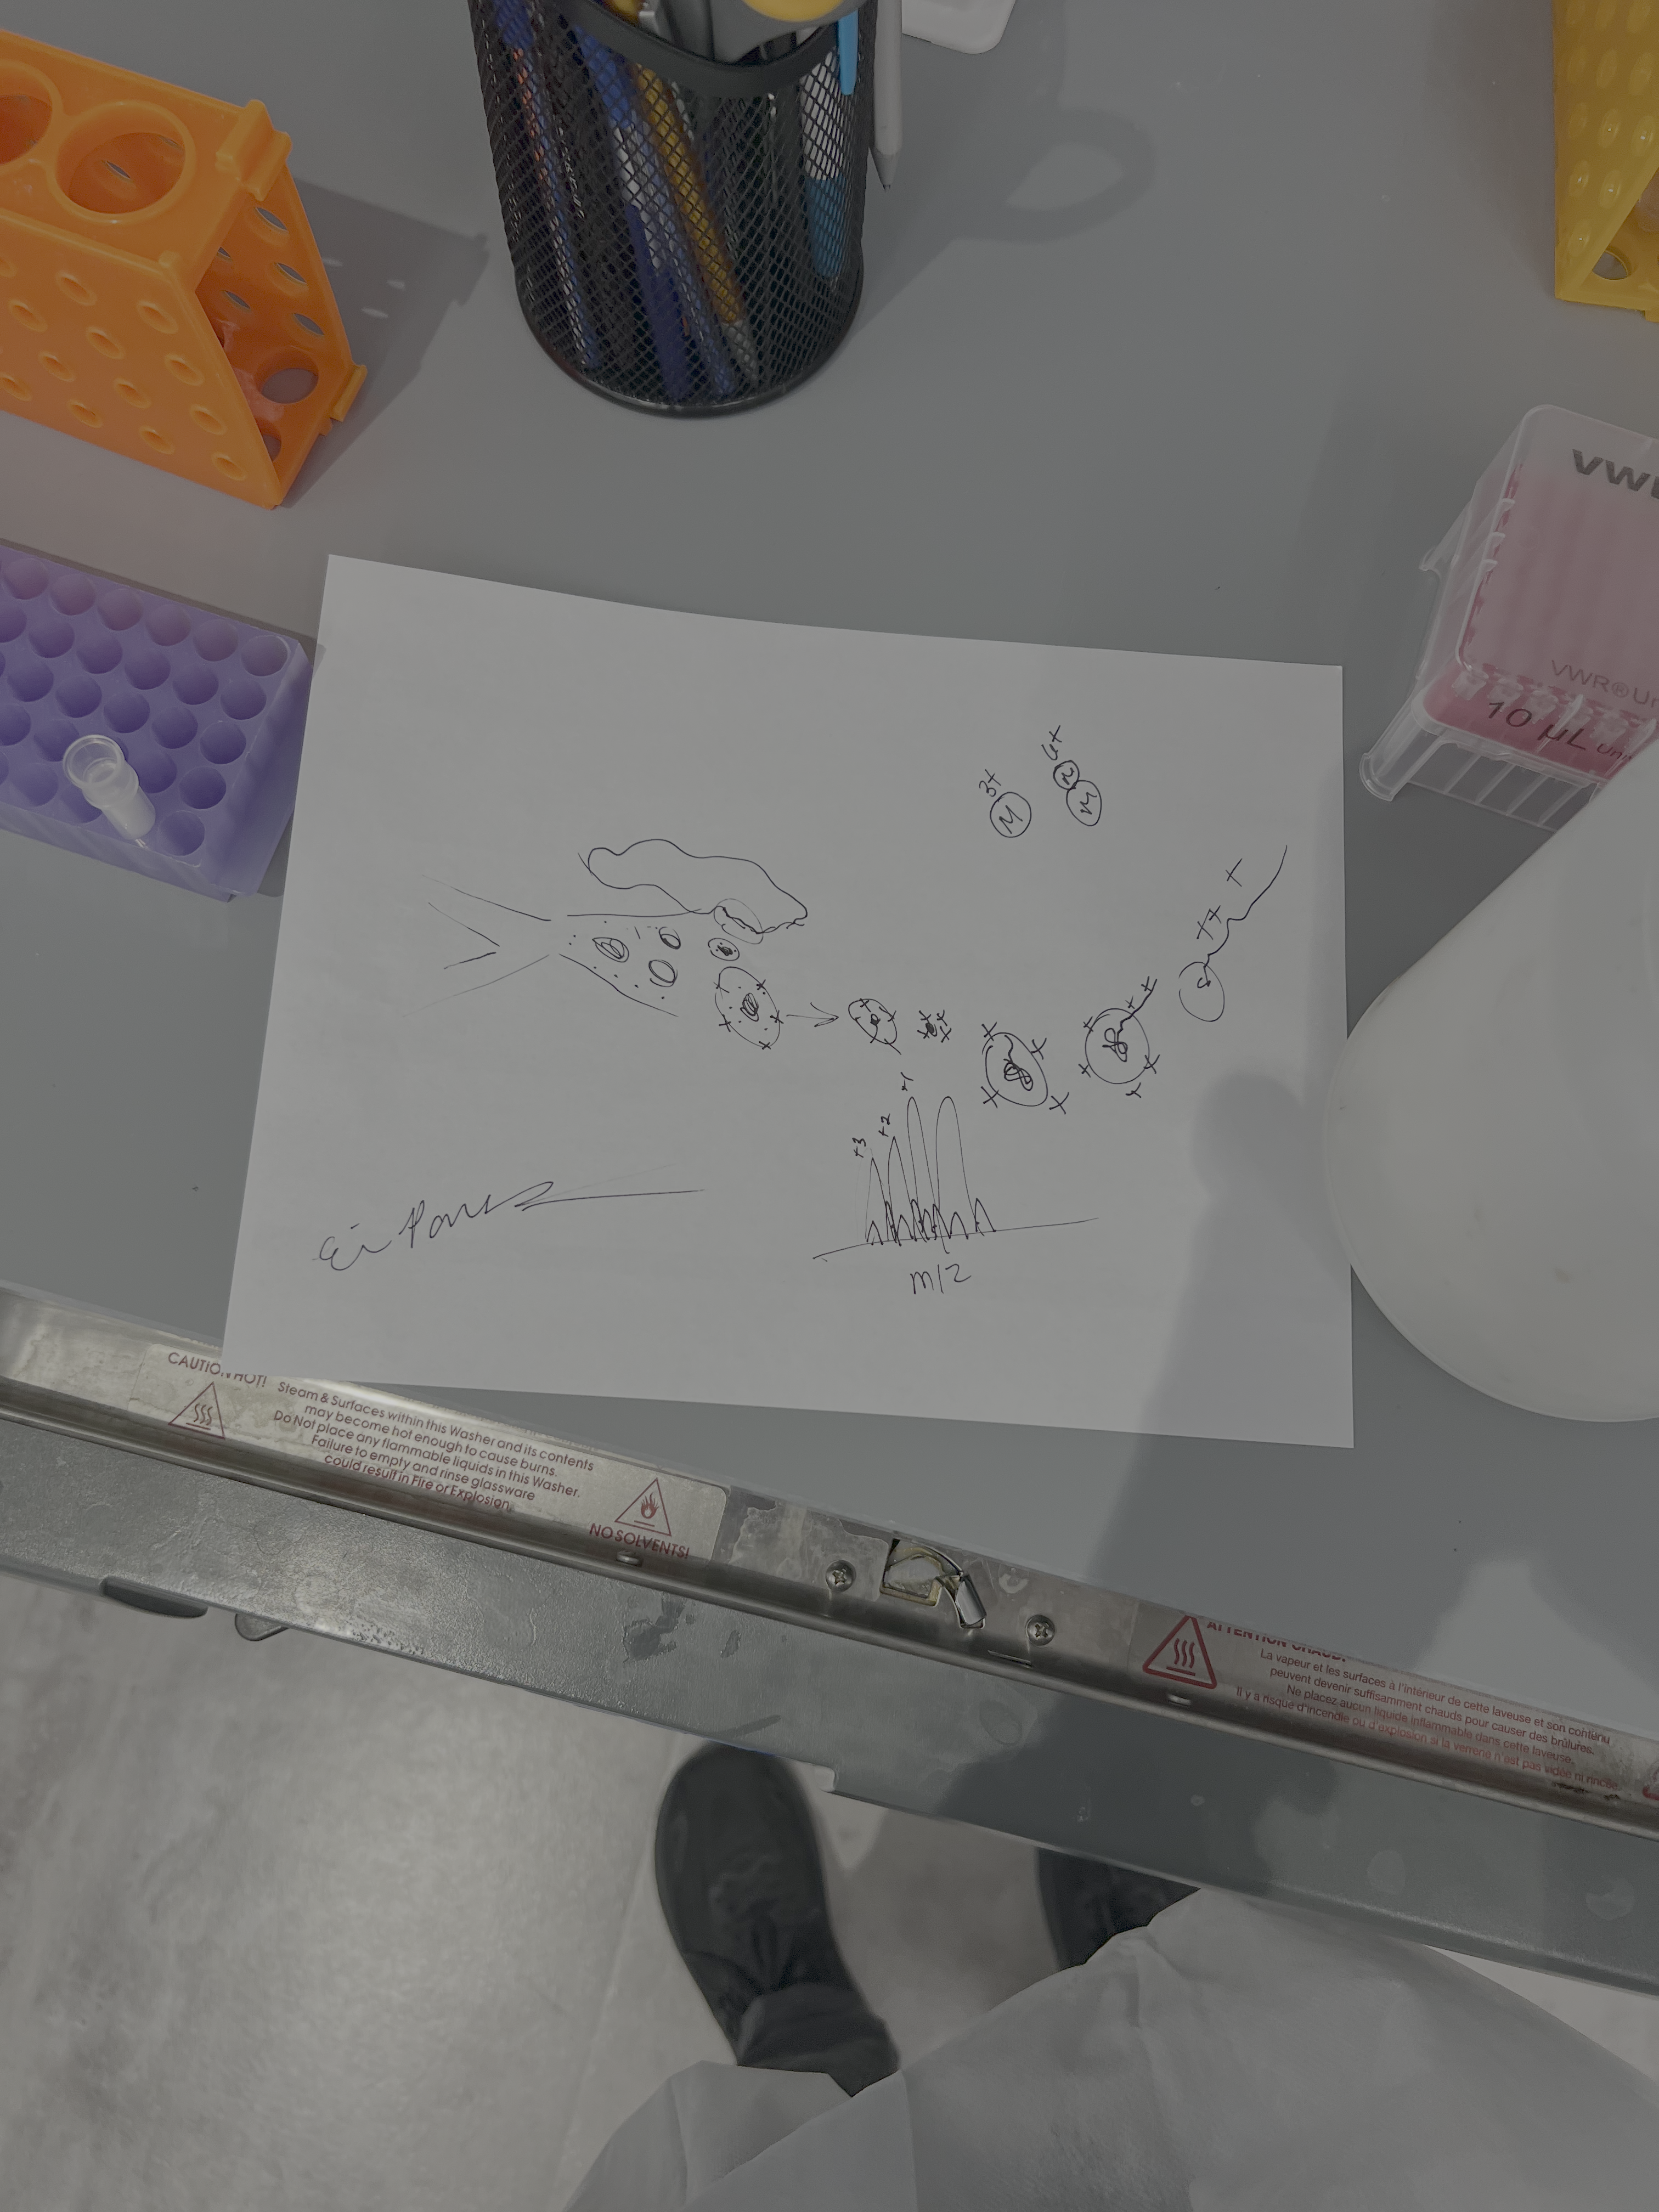
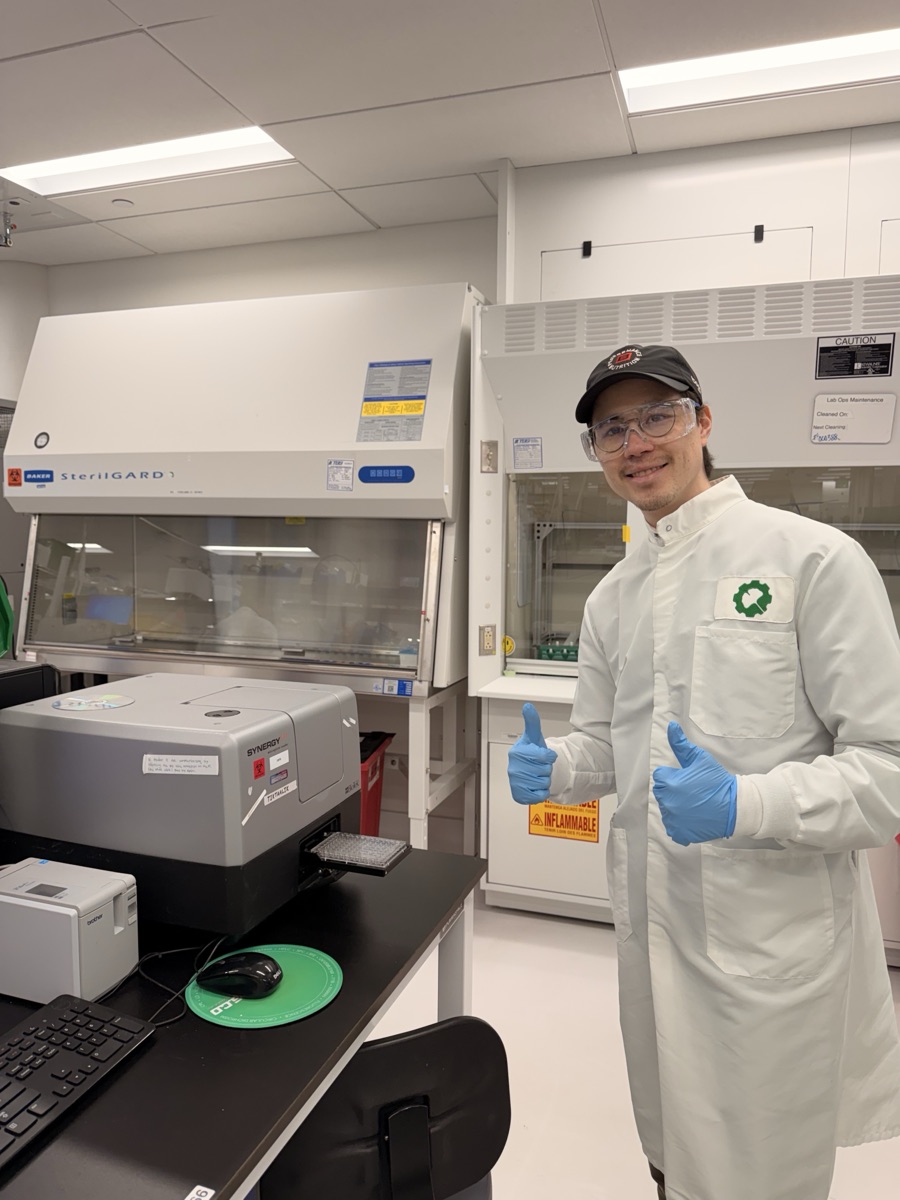
Lab Day at Waters Immerse Schematic of the Waters LC-MS instrument setup. Our roadmap for the day’s experiments. The team suited up in lab coats and safety goggles at the Waters facility. Benchside doodle. Someone’s artistic interpretation of the day’s science between runs.
Our group set out to make a design with the letters “HA”, standing for the name of one of our group members, Hines Alayah. We somehow ended up with “LU” instead. Sometimes biology happens by accident, so we have decided that “LU” stands for Love U.
A few photo highlights below.
Loading the restriction enzymes into the lanes.
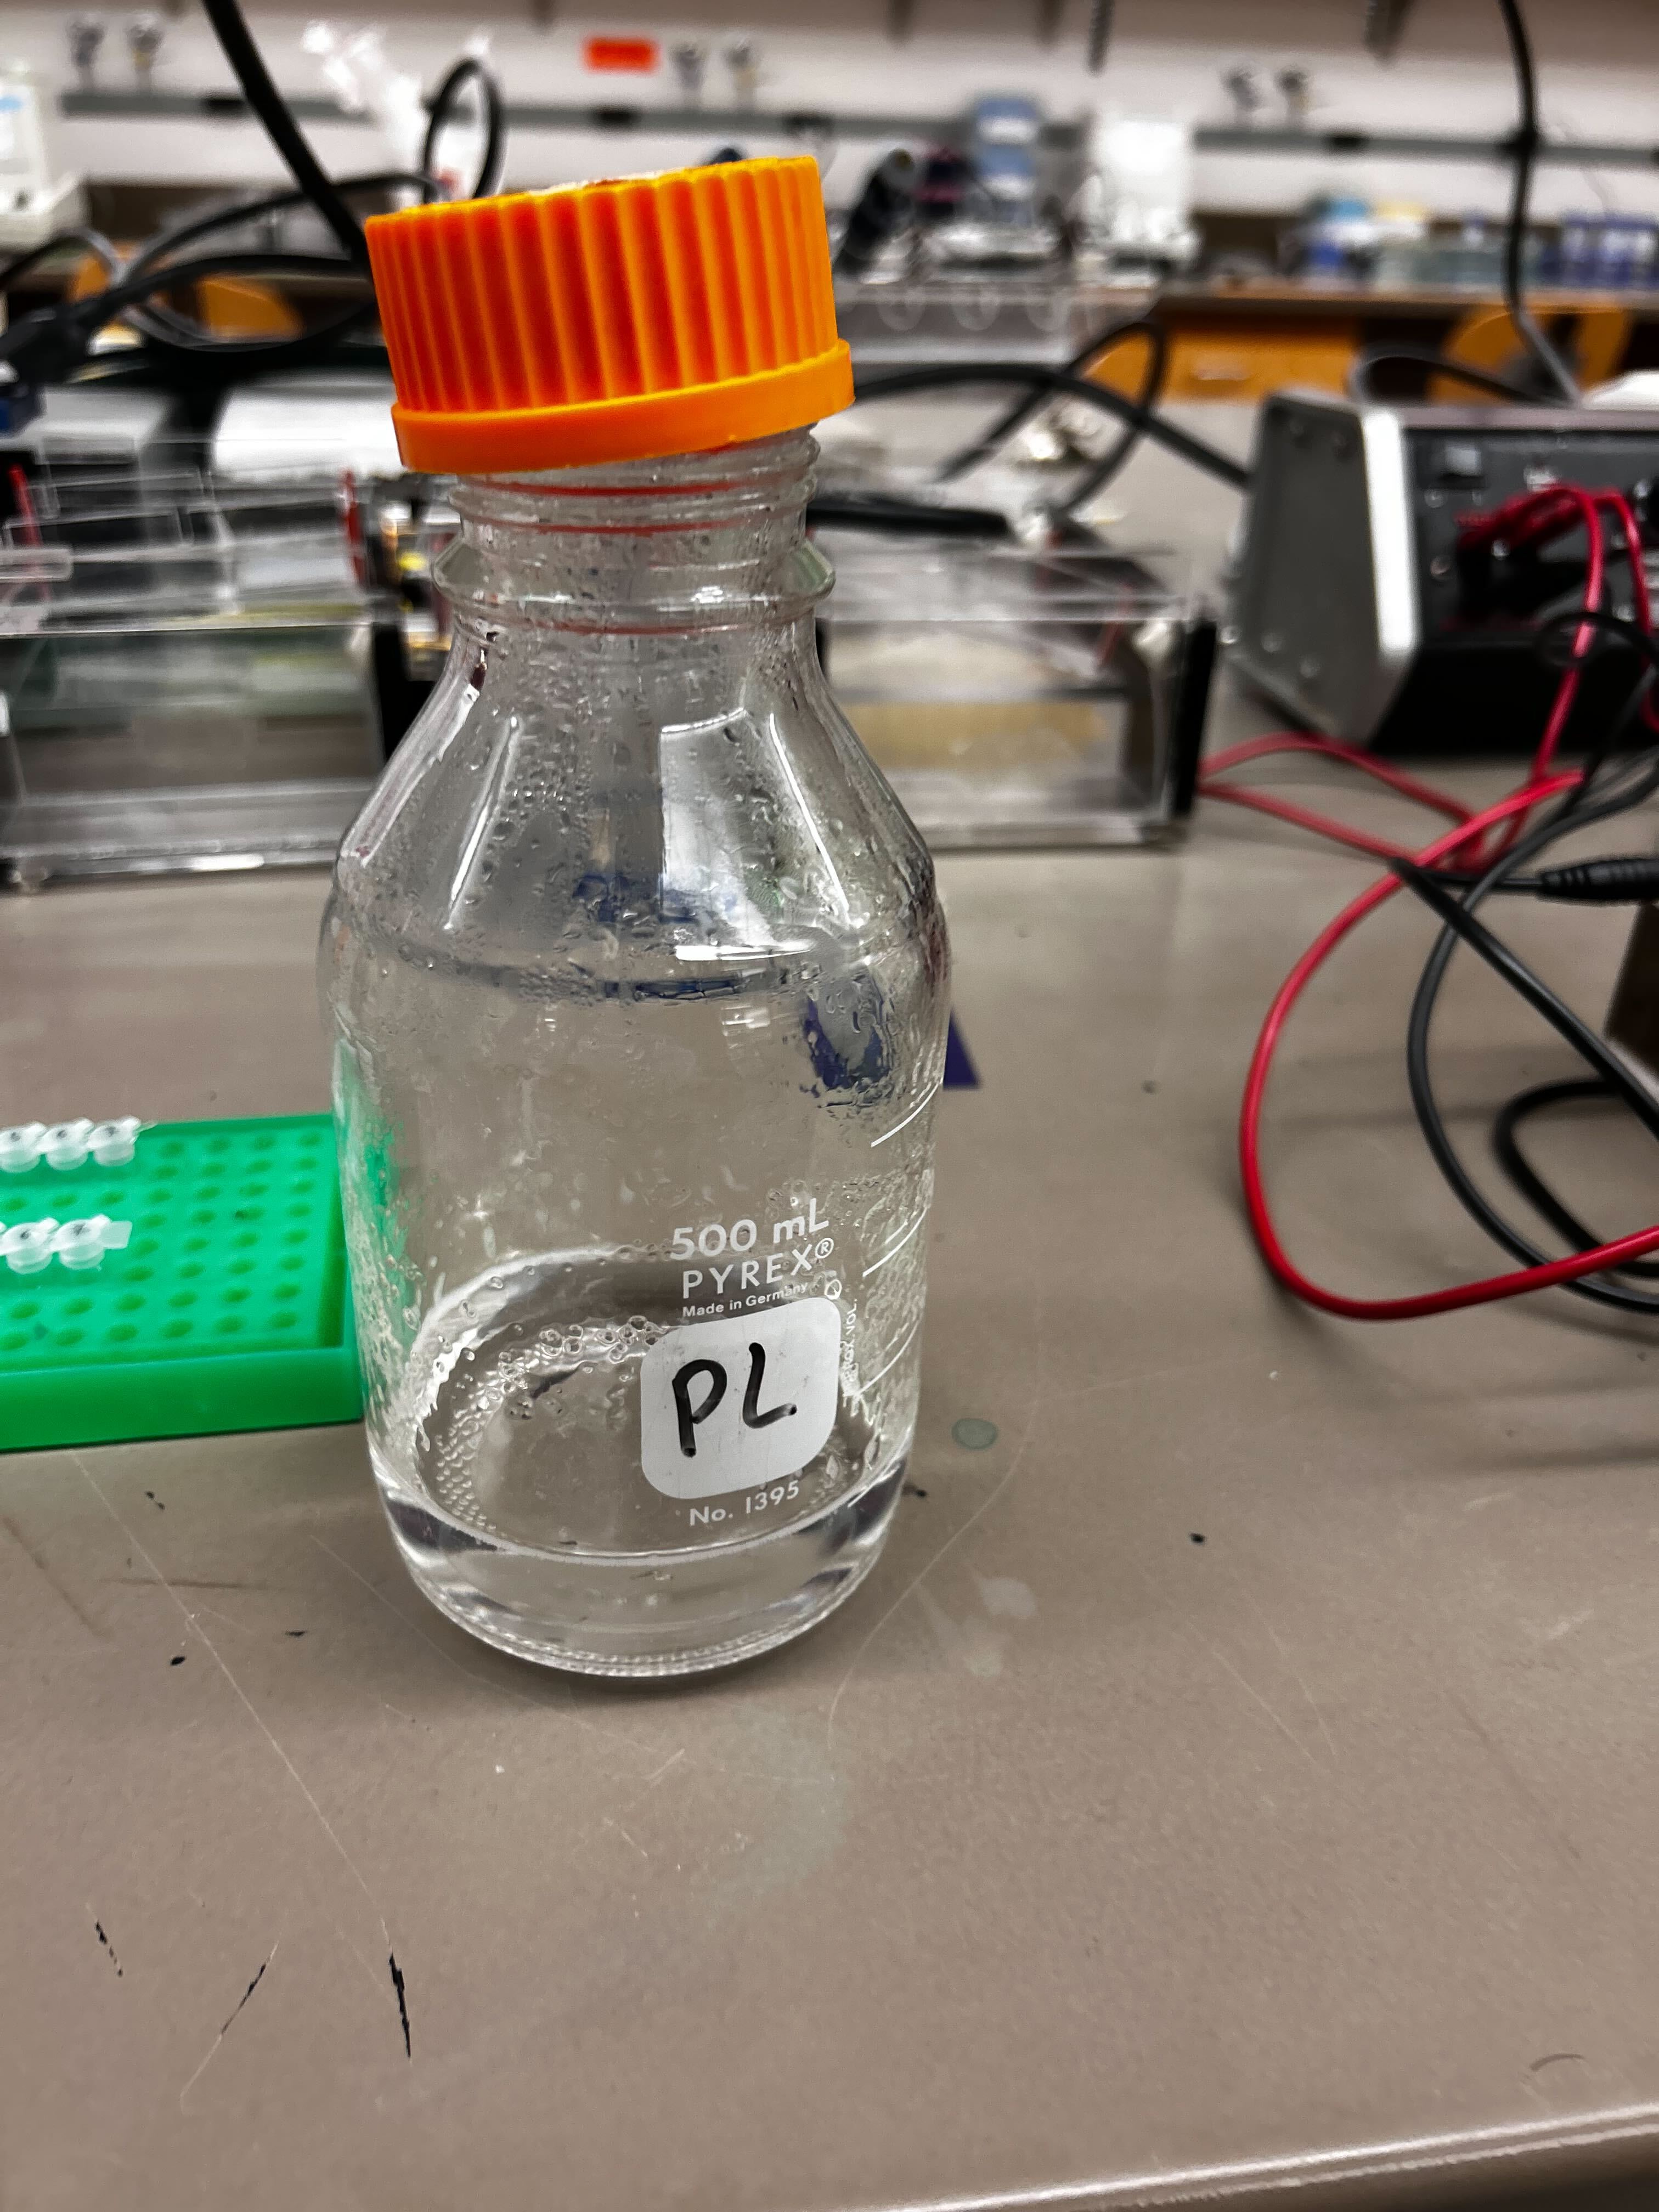
Preparing the buffer.
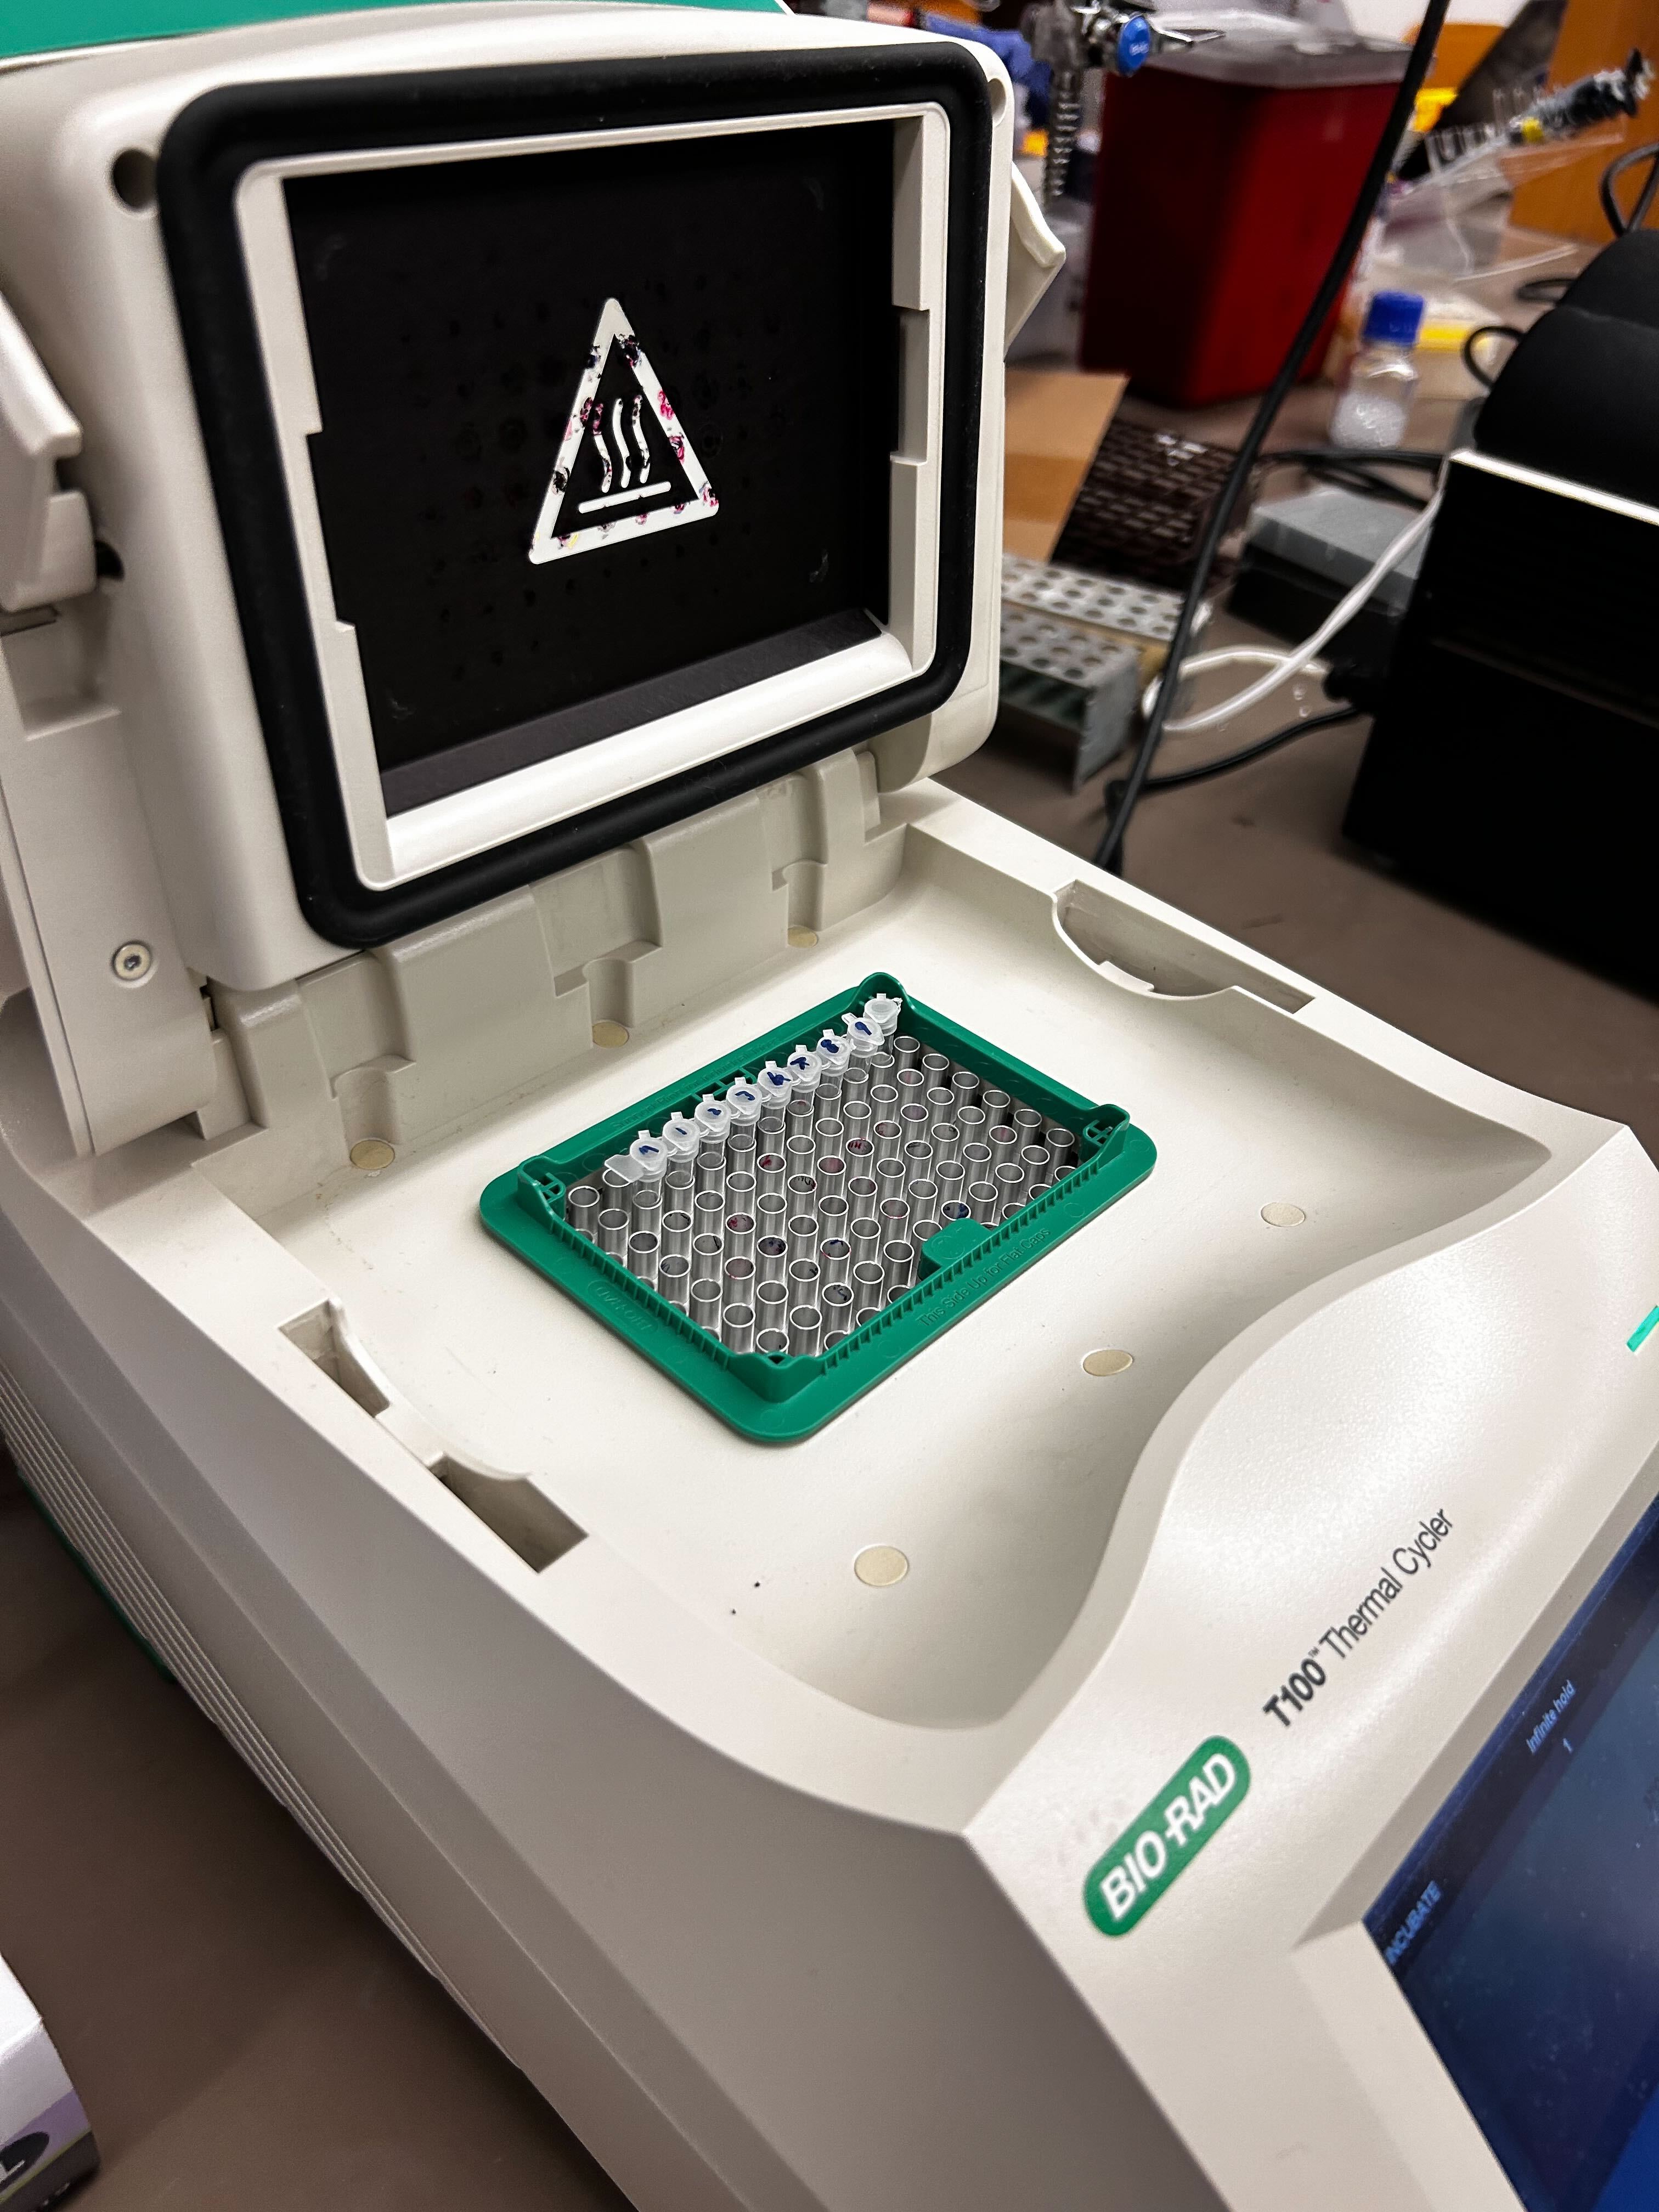
Performing PCR.
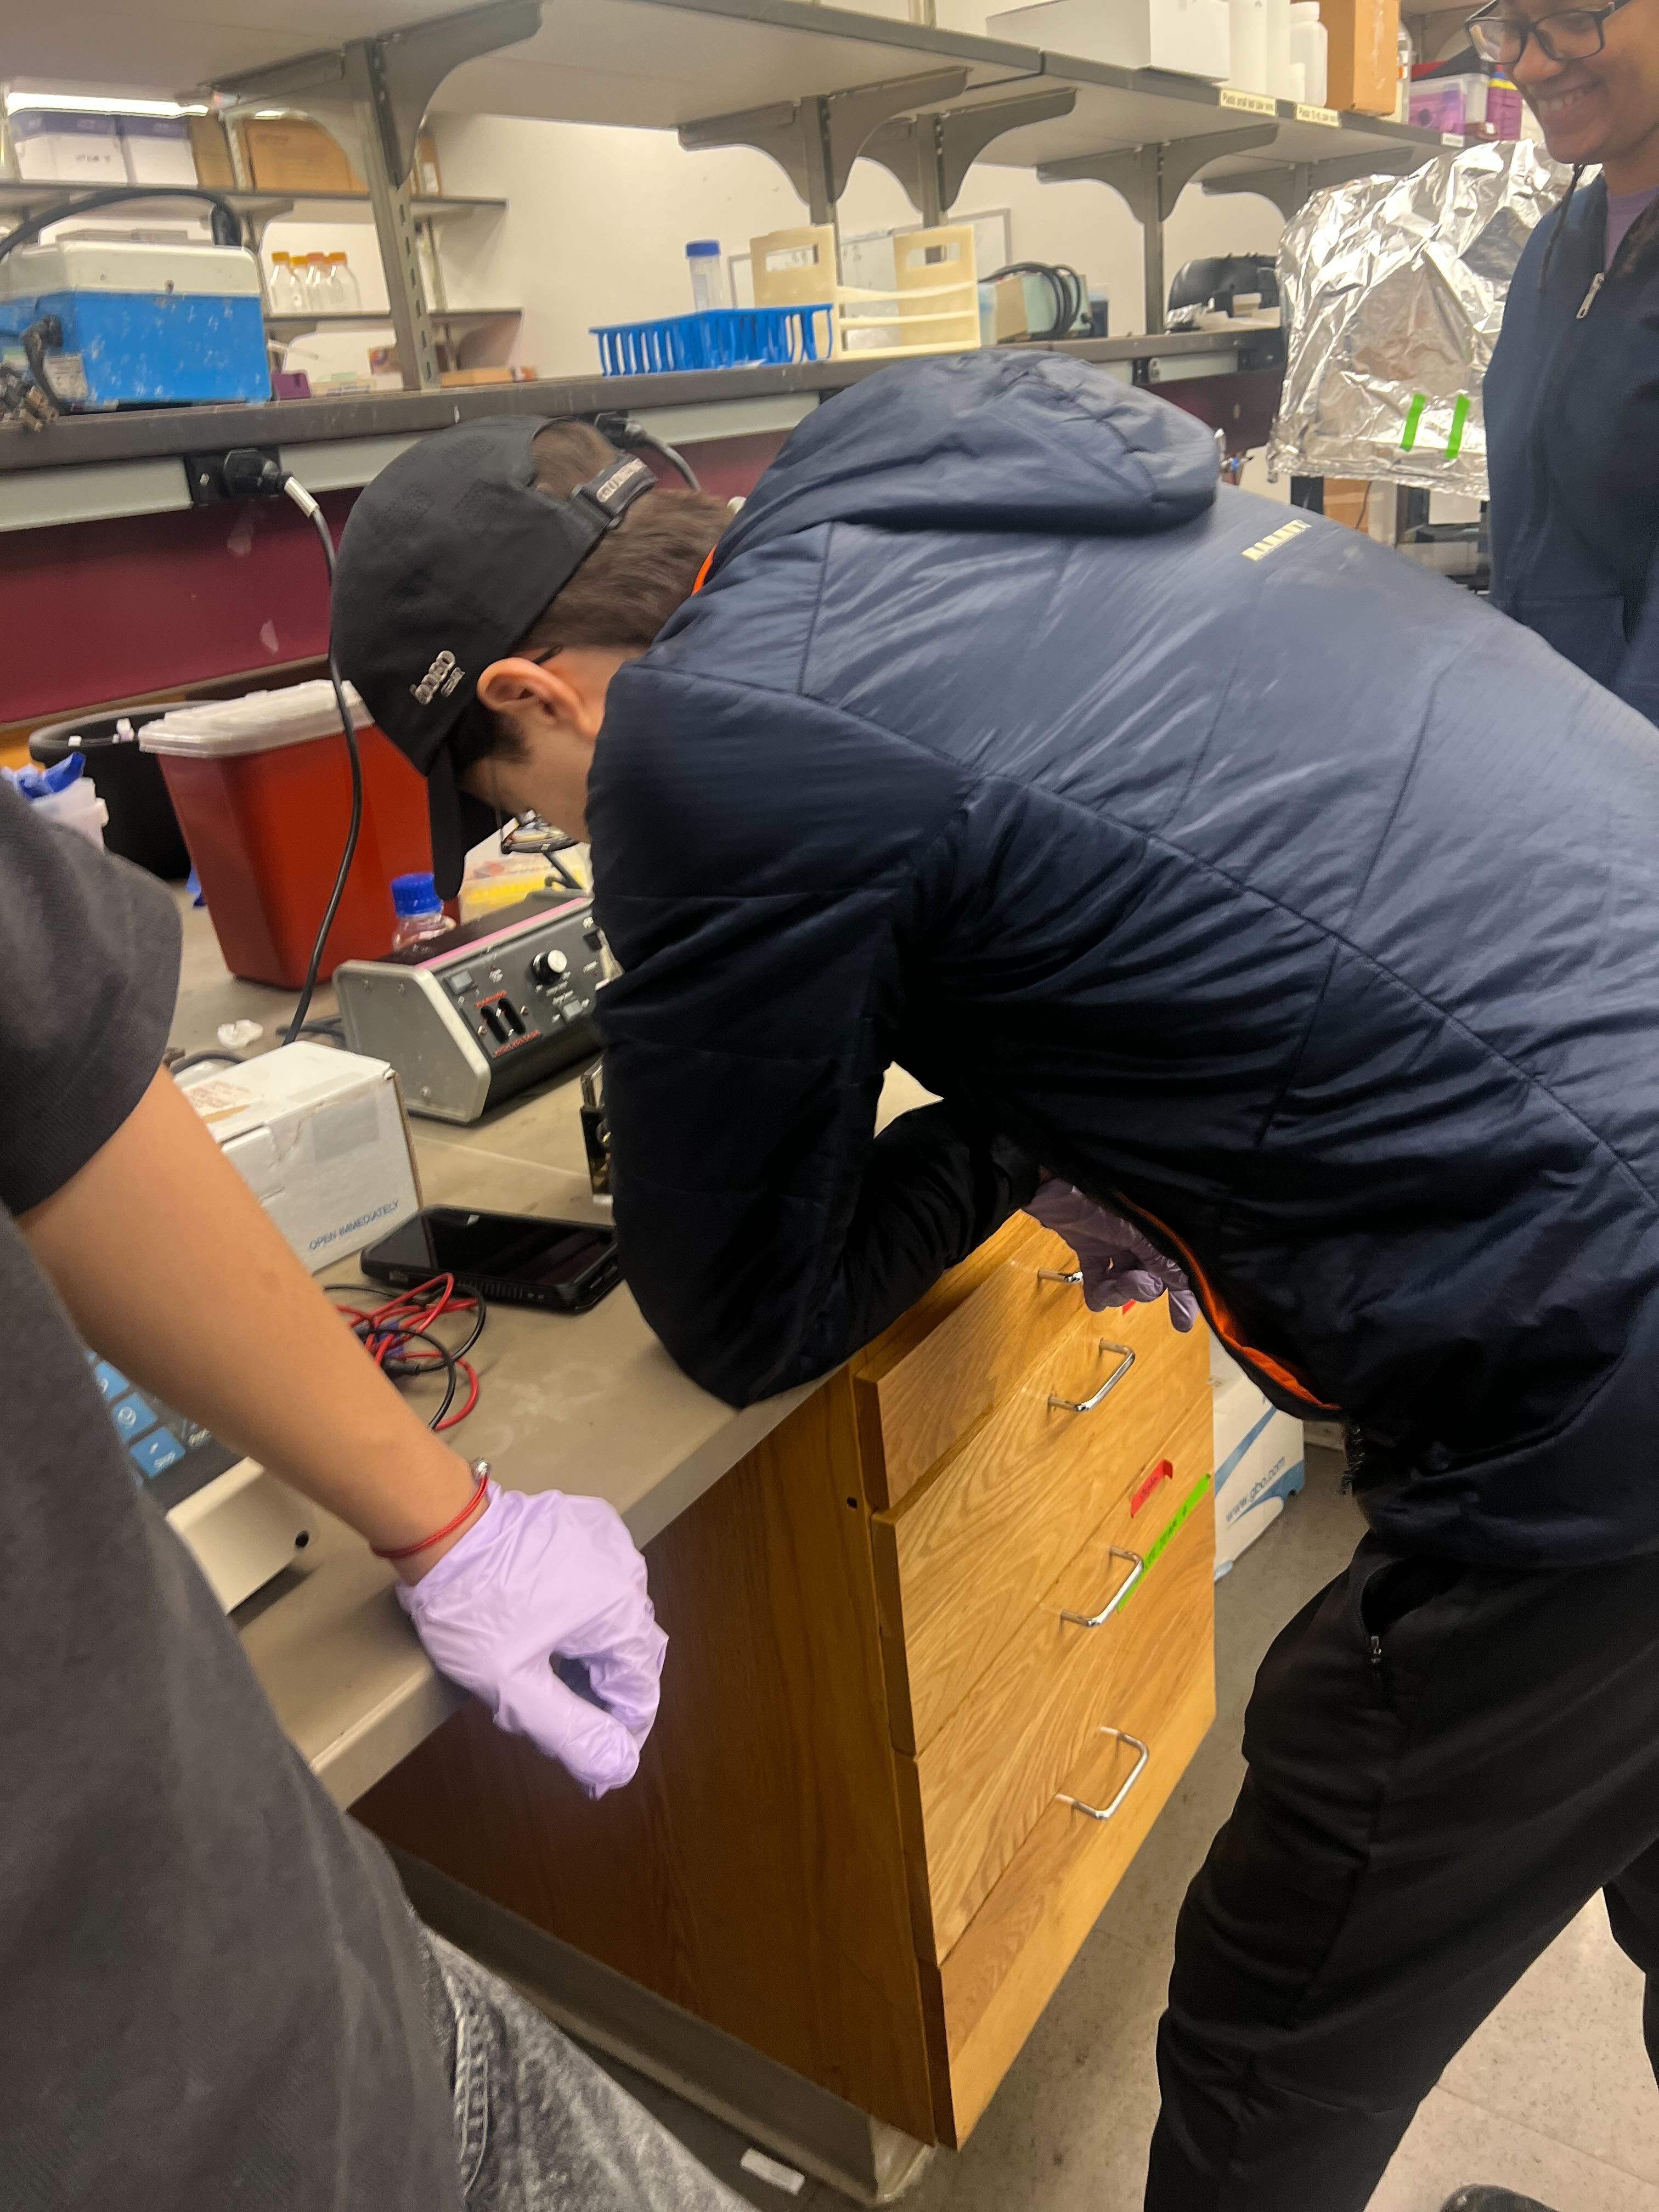
Pipetting the dye.
Separation of the dye through the gel.
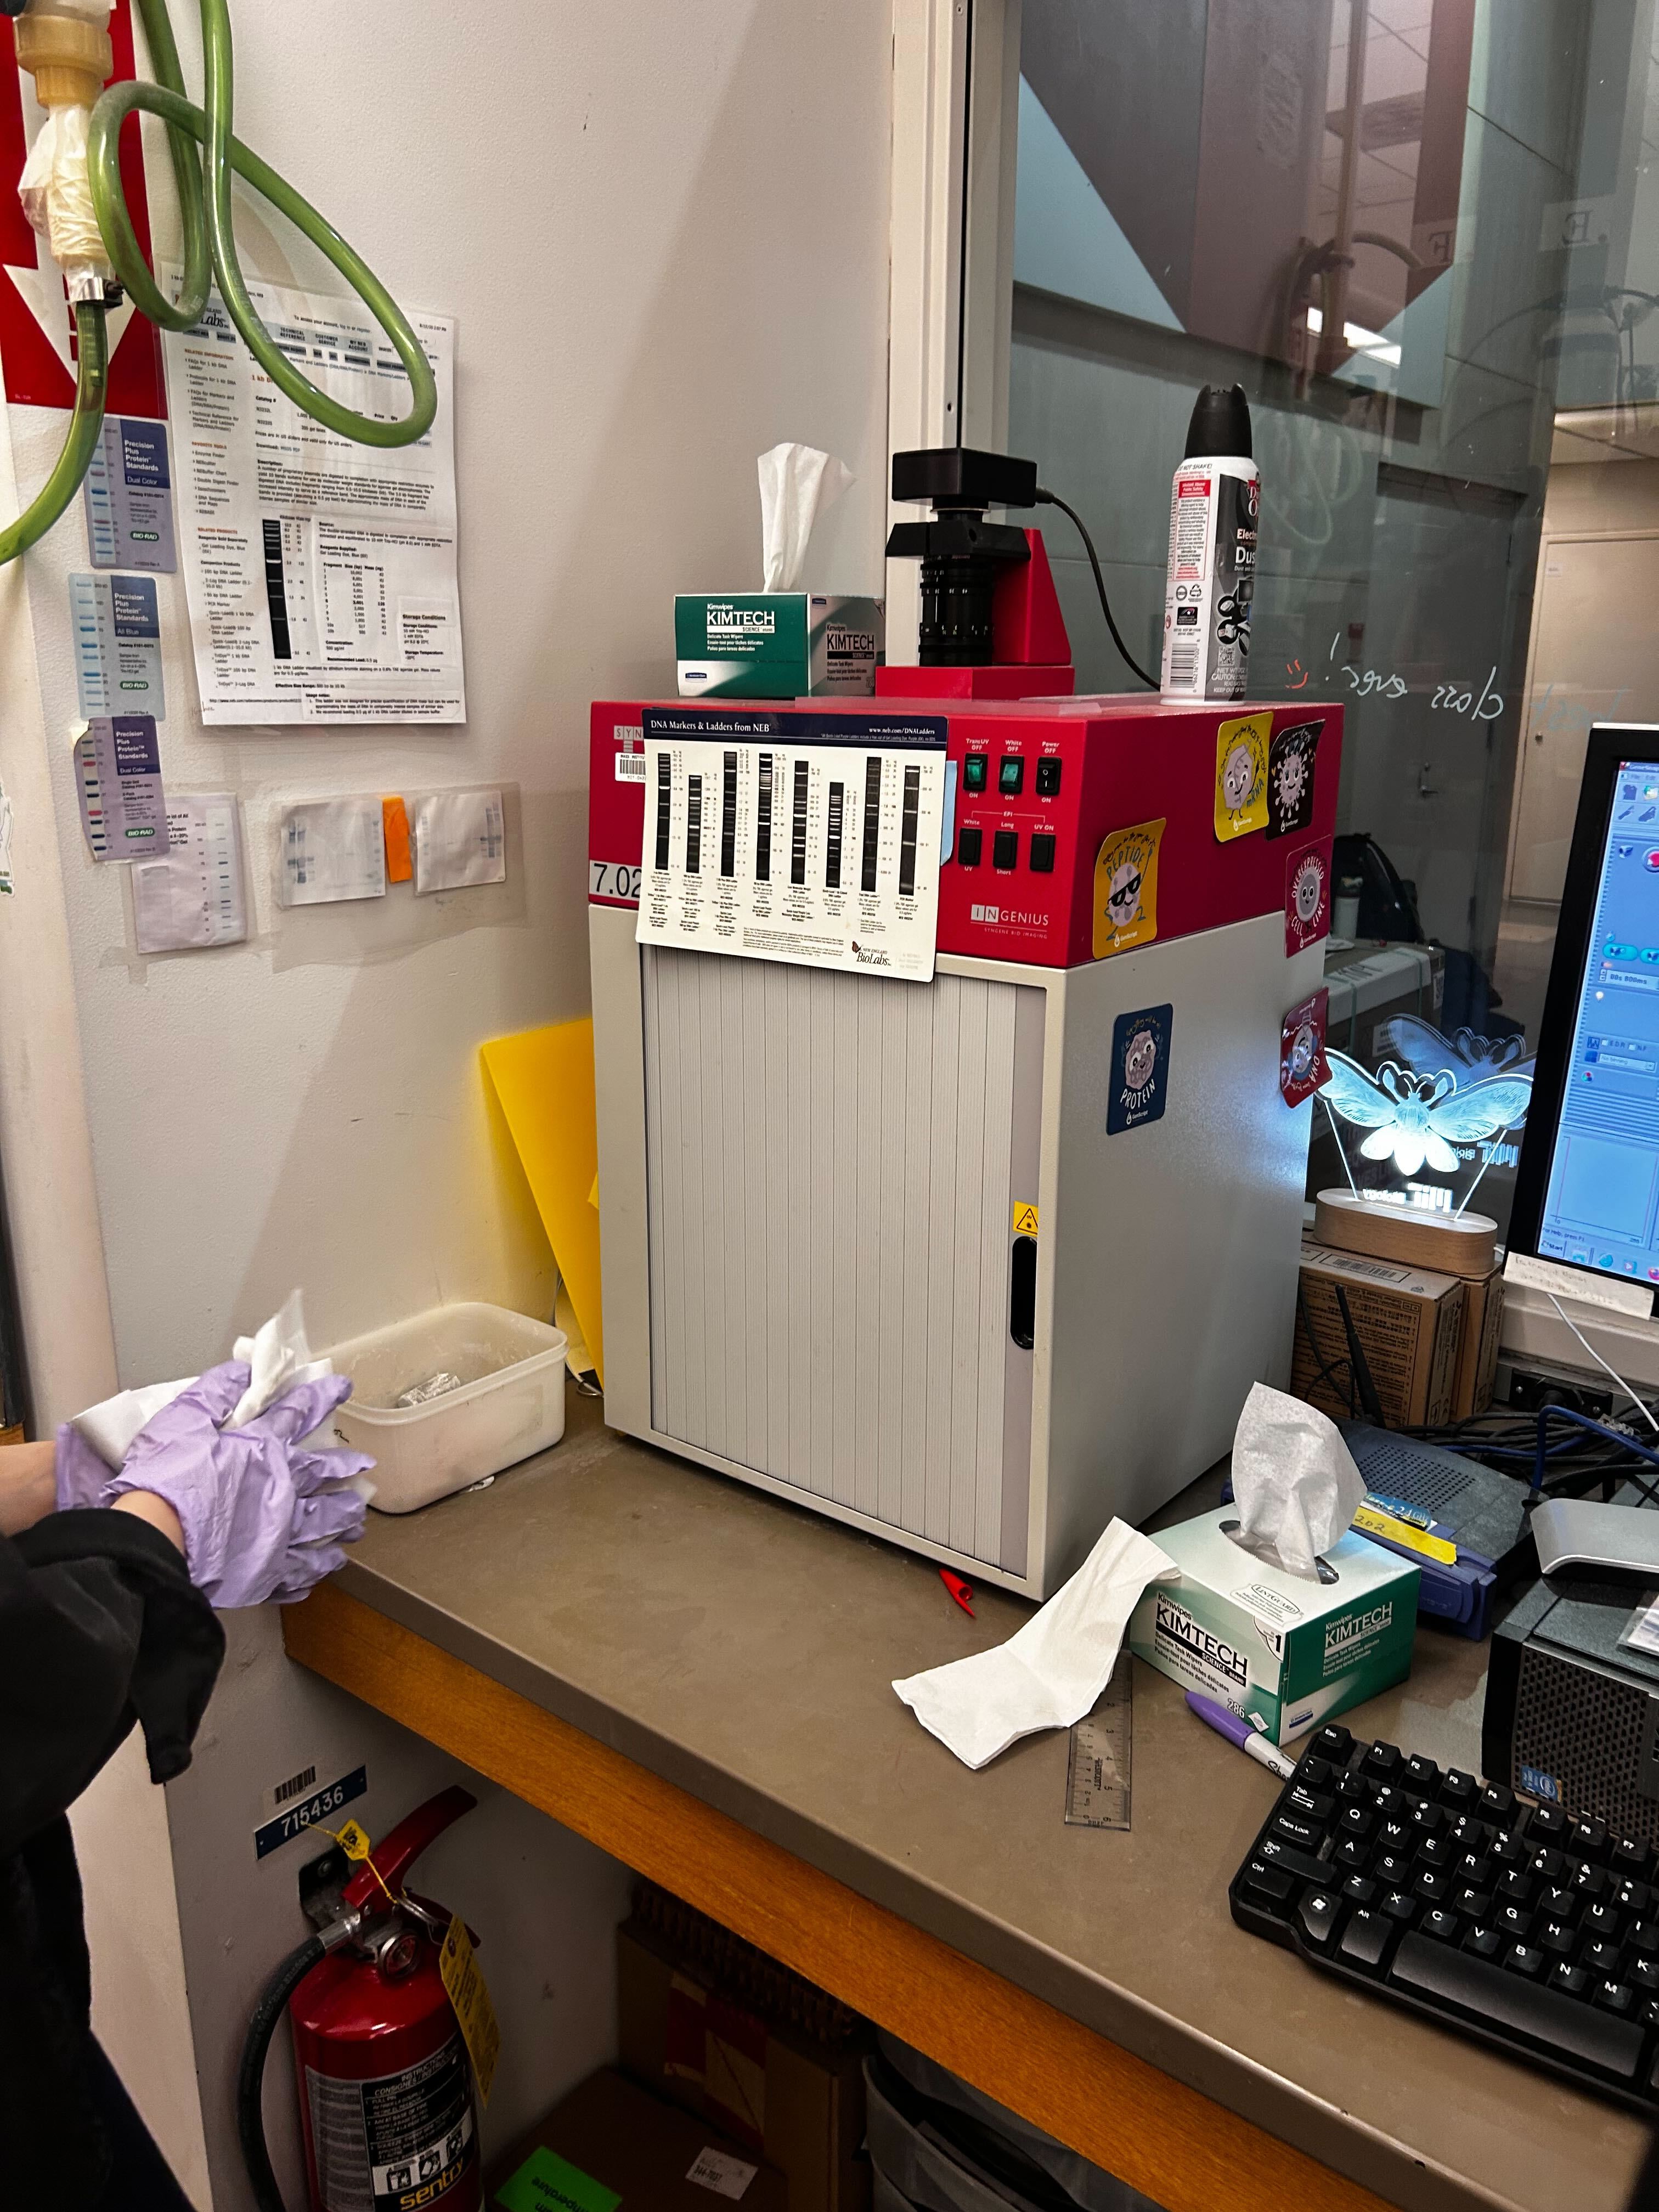
The gel imager.
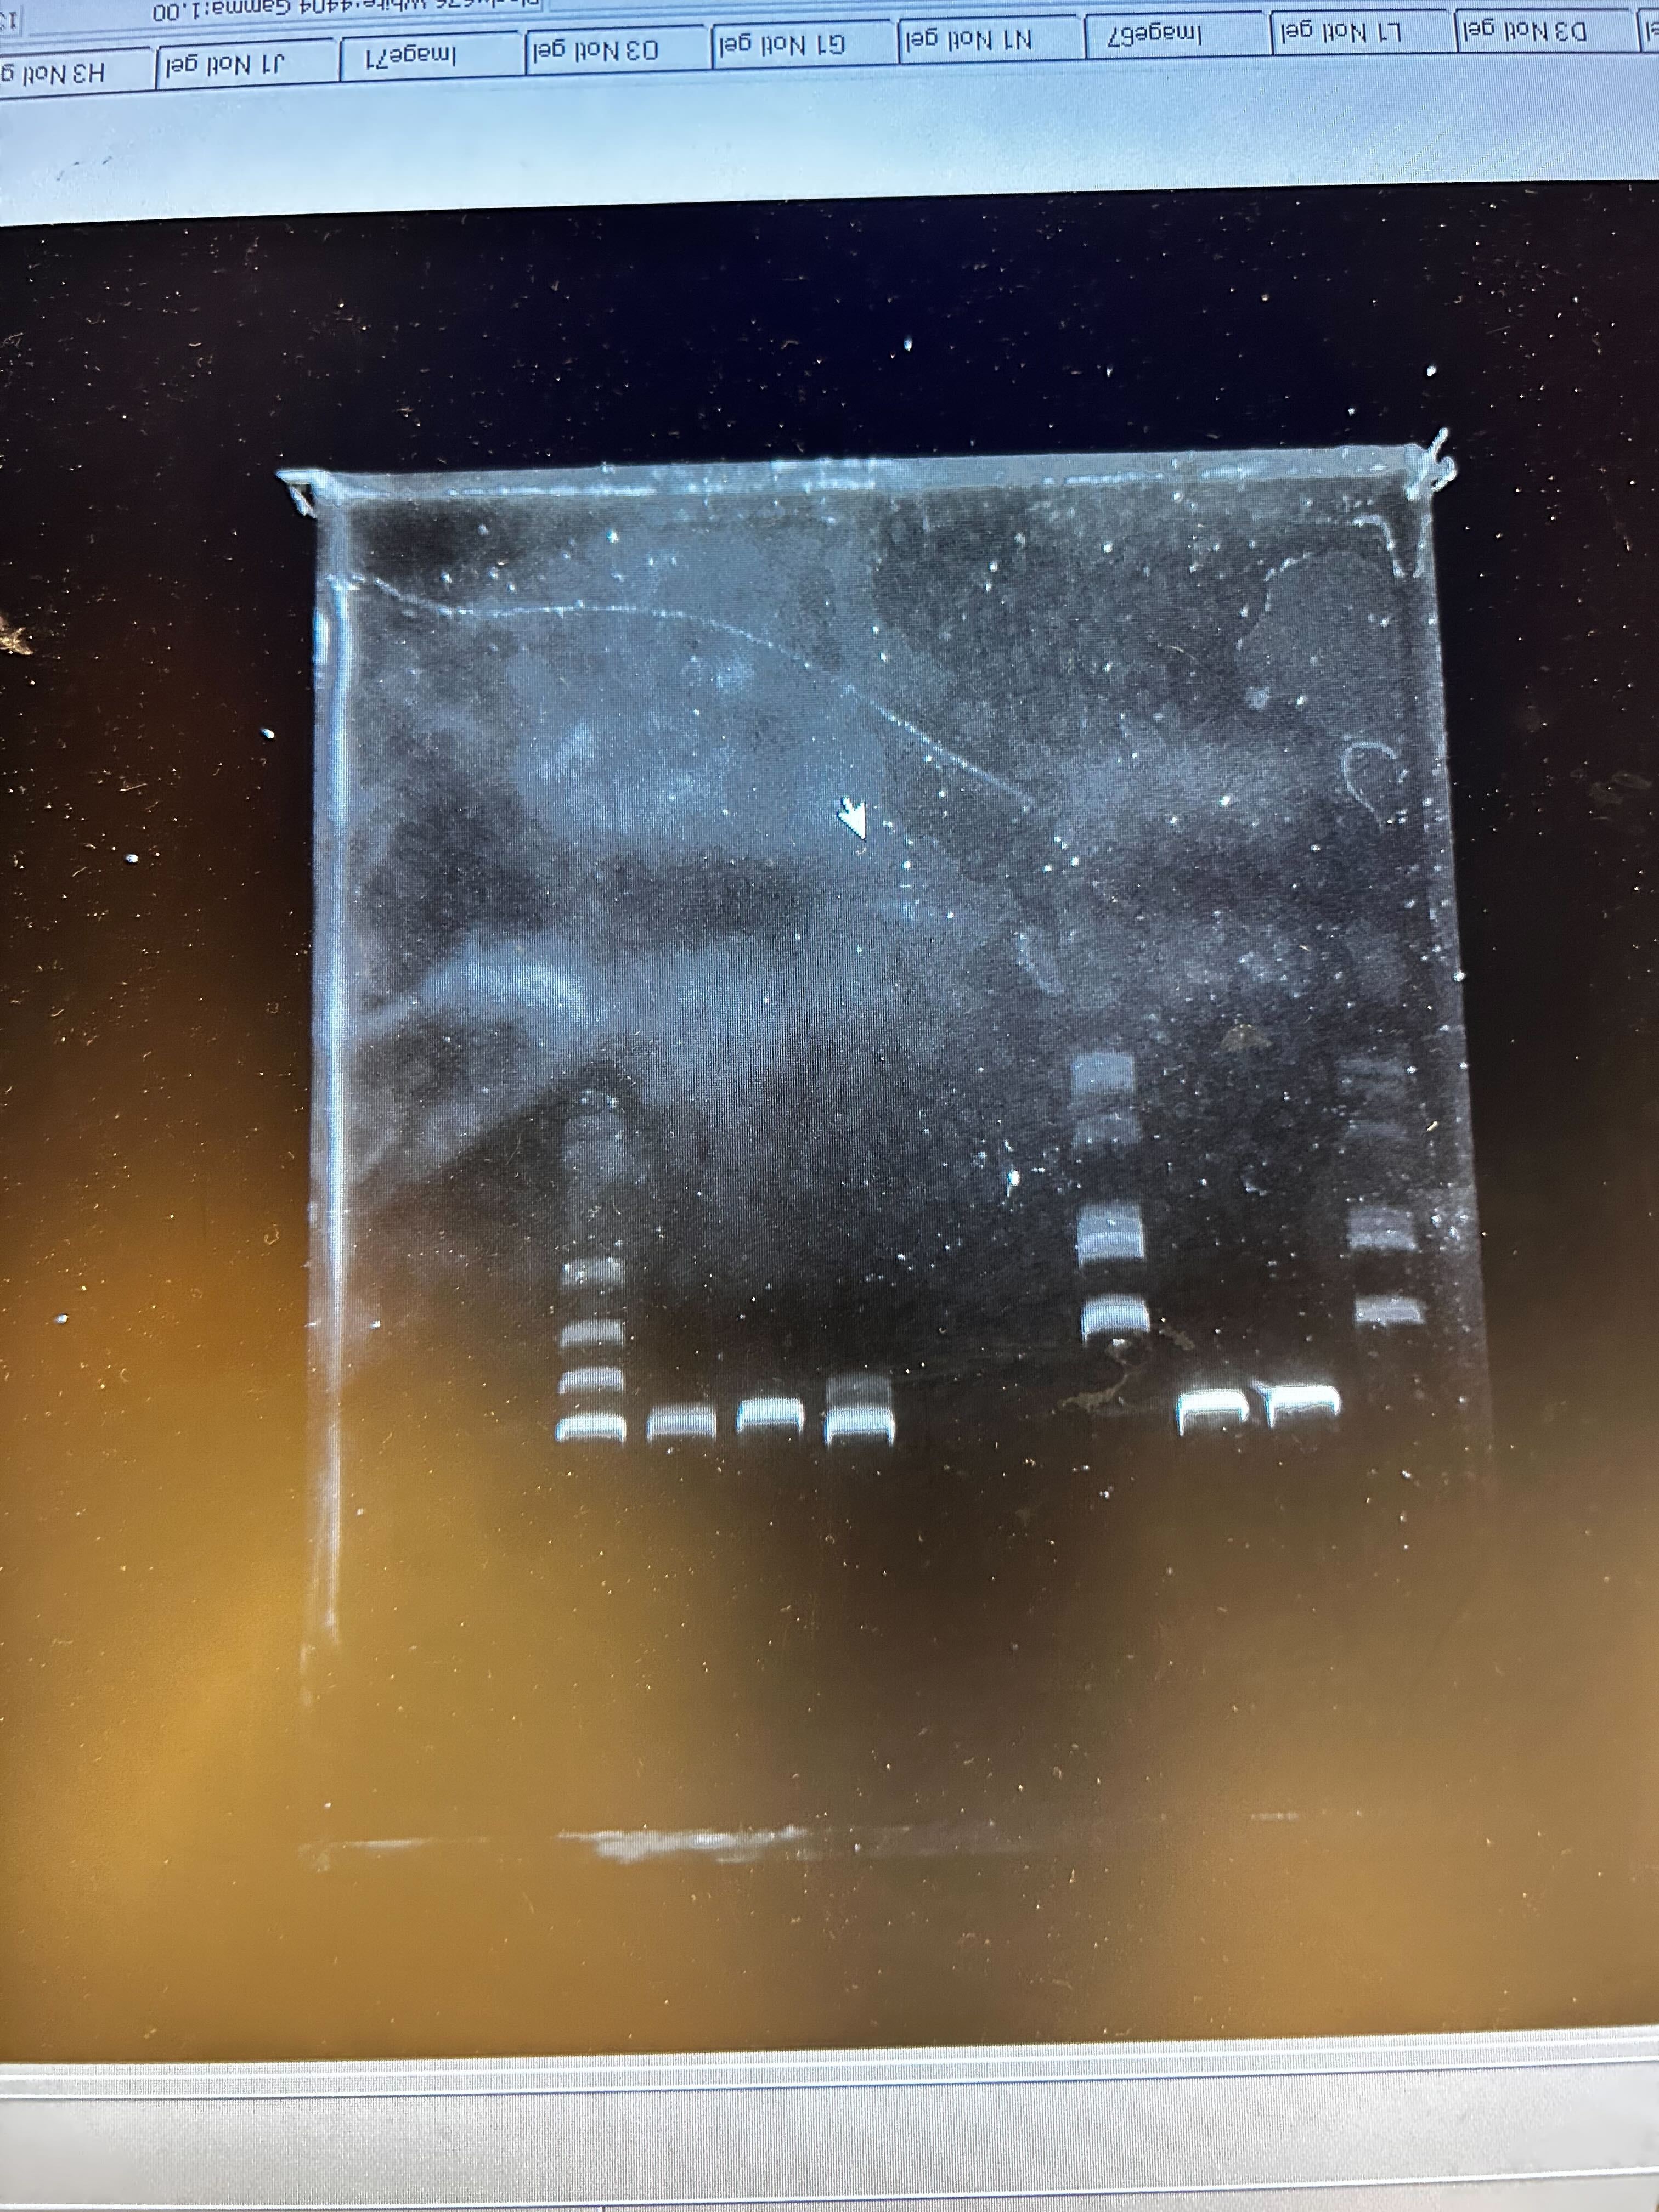
Result!
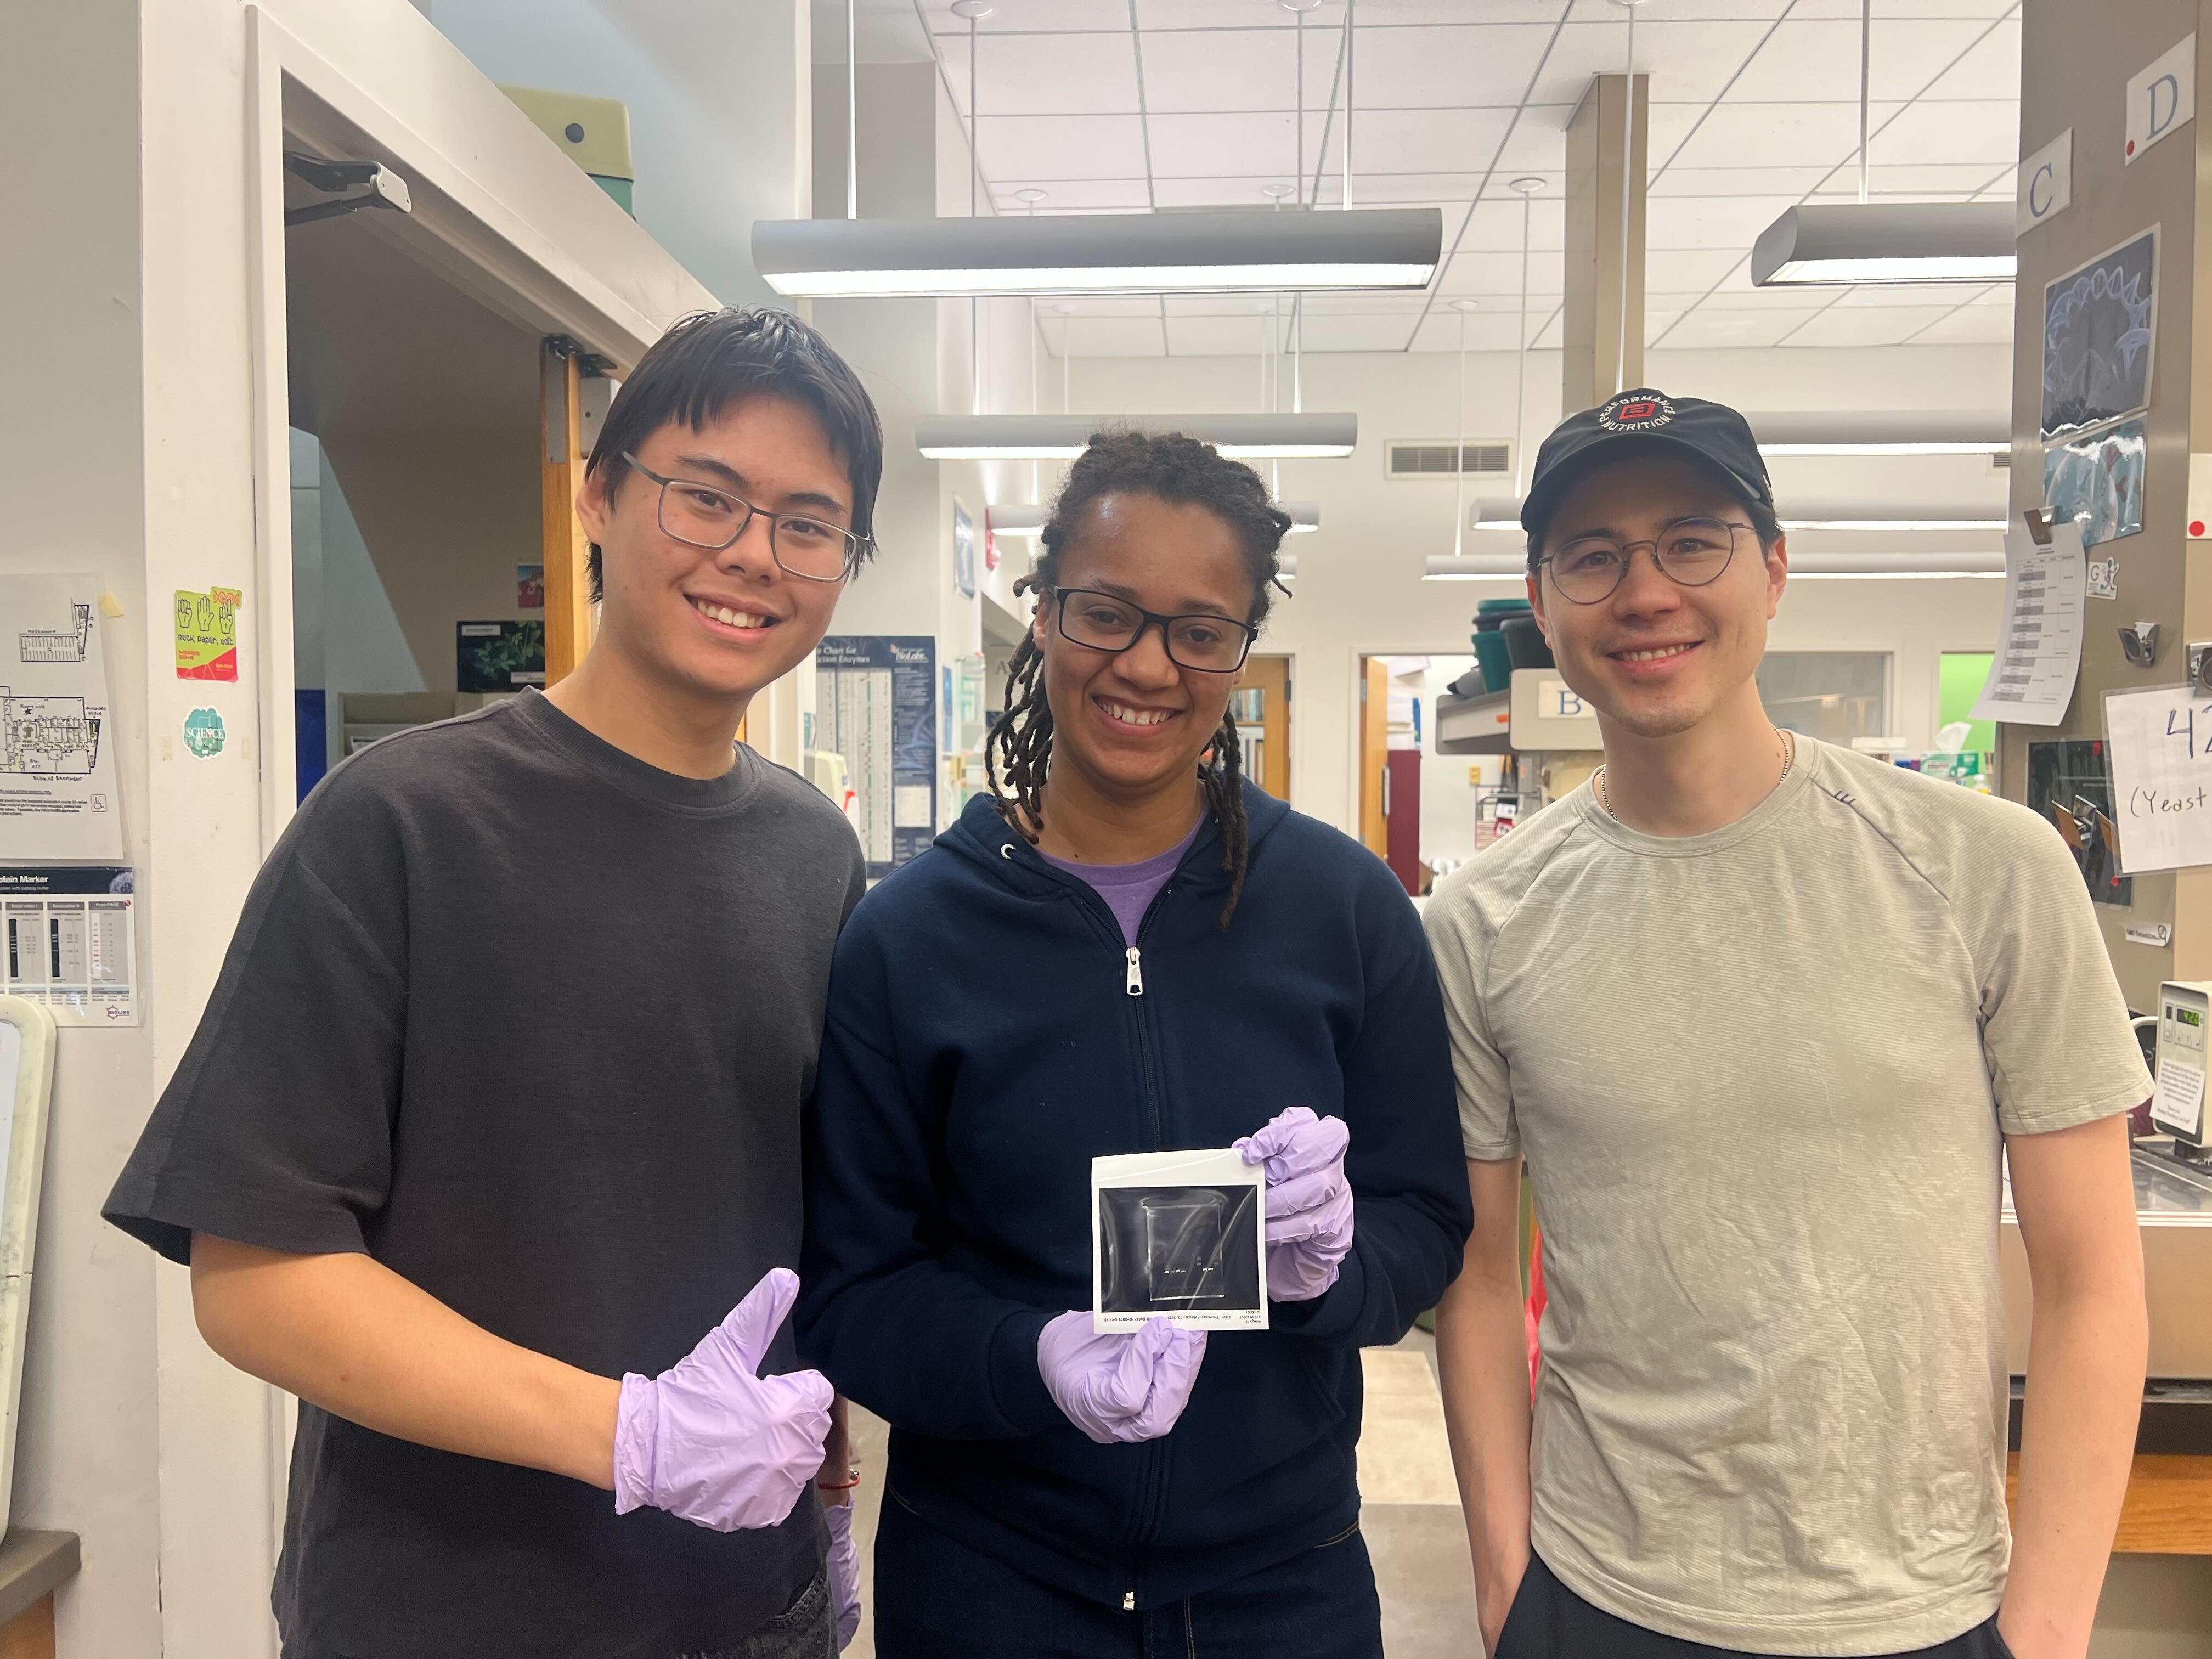
The team.
Week 3 Lab: Lab Automation
Opentrons Designs
I tried to push Opentrons to the limit and chose a fairly hard design: the Mitsudomoe, a traditional Japanese family crest (Kamon) associated with my family. The result didn’t come out particularly clean, but with higher resolution and non-sequential pipetting (for speed) it would be more tractable.
Reference design and Opentrons version:
Lab Automation
Find a published paper that uses Opentrons or another automation tool for a novel biological application.
The paper I chose is AssemblyTron: flexible automation of DNA assembly with Opentrons OT-2 lab robots, by Bryant et al., published in Synthetic Biology (2023). The authors developed an open-source Python package called AssemblyTron that connects j5 DNA assembly design software to an Opentrons OT-2 liquid handling robot, allowing users to go from a digital DNA design to a physically assembled construct with minimal hands-on work.
What makes this paper compelling is that it automates the entire Build step of the Design-Build-Test-Learn cycle, traditionally the most manual and error-prone part. AssemblyTron handles PCR setup (including calculating optimal annealing temperature gradients), DpnI digestion, and final multi-fragment assembly on the OT-2. The authors validated the system by performing Golden Gate assemblies and in vivo assemblies of four-fragment chromoprotein reporter plasmids, achieving fidelity comparable to manual assembly. They also demonstrated automated site-directed mutagenesis. The key takeaway is that affordable, open-source automation can make DNA assembly more reproducible, less wasteful, and accessible to labs without expensive biofoundry infrastructure.
What I intend to do with automation tools for my final project.
In general, I want to use my adaptive AI system for scientific discovery at a small scale, something realistic as a final project given the resources we have from Twist and Ginkgo Bioworks.
Idea 1: Promoter design for maximum expression. I would order oligos from Twist, clone them into reporters, and observe expression in E. coli. Fluorescence intensity would be the reward signal. Two rounds may be feasible.
Idea 2: In silico validation only. The most feasible version is to ditch the lab-in-the-loop entirely by performing validation in silico. This also allows much more complex protein designs since we are no longer constrained by what is physically feasible to test on the project budget.
Idea 3 (the dream version, not feasible in this timeframe). Use the system to discover higher-order transcription factor combinations that forward-program iPSCs into a target cell type. The computational engine uses Bayesian optimization to predict TF combinations, balancing exploration and exploitation based on experimental results. To handle the cloning overhead, I would outsource synthesis of polycistronic lentiviral transfer vectors to Ginkgo Bioworks’ Nebula platform, which algorithmically assembles the DNA and returns plasmids in a 96-well format. Each vector can carry 3 to 4 TFs linked by 2A peptides, and co-transduction with multiple vectors allows testing of even larger combinations.
The OT-2 would automate lentivirus production by dispensing transfection reagent into arrayed HEK293T packaging cells, harvesting viral supernatant, and transducing iPSC cultures. The robot would also handle the post-transduction media schedule. Because lentivirus integrates into the genome, TF expression is sustained throughout the differentiation window without repeated dosing. At the endpoint, high-content phenotypic imaging quantifies differentiation efficiency in each well, and the data feeds directly back into the Bayesian model to predict a more refined batch of TF cocktails for the next automated run.
This week we performed a Gibson Assembly to clone chromophore-mutant inserts into the mUAV backbone. A few photo highlights from the lab.
Setting up the PCR reactions: pipetting primers, template, and master mix into tubes.
Loading samples into the E-Gel EX Invitrogen cassette for gel electrophoresis.
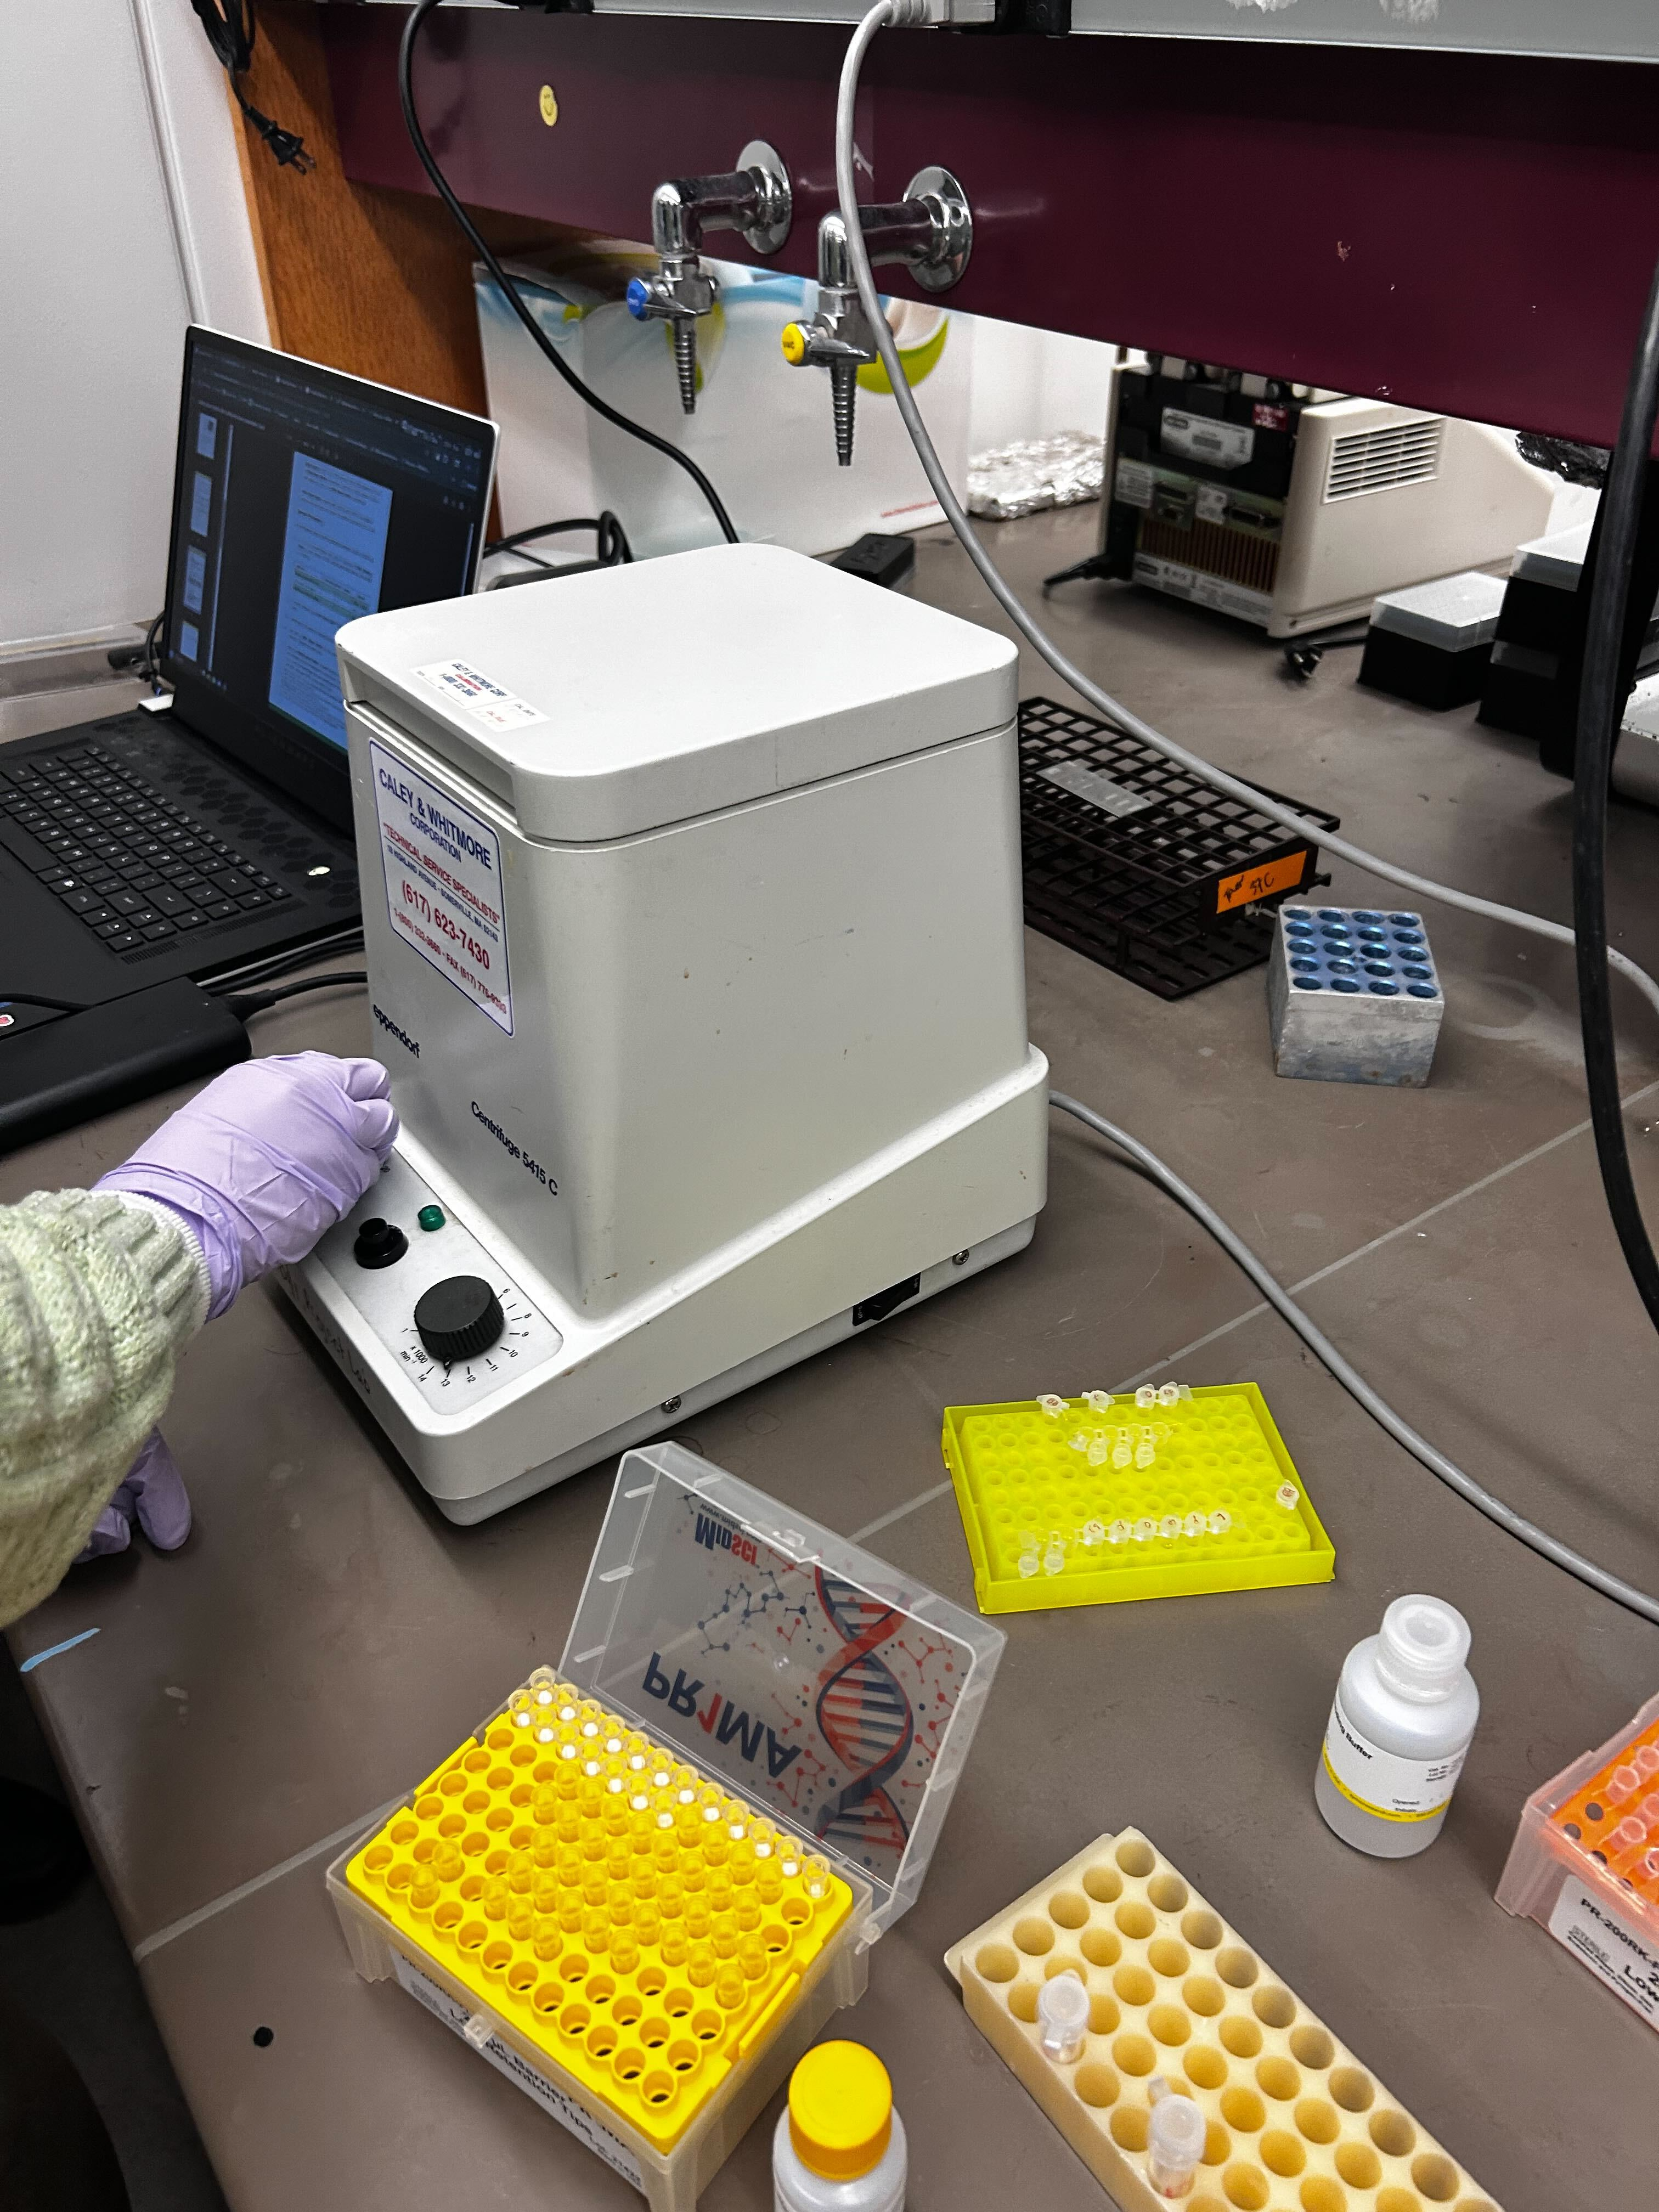
Miniprep station: spinning down cultures to extract plasmid DNA.
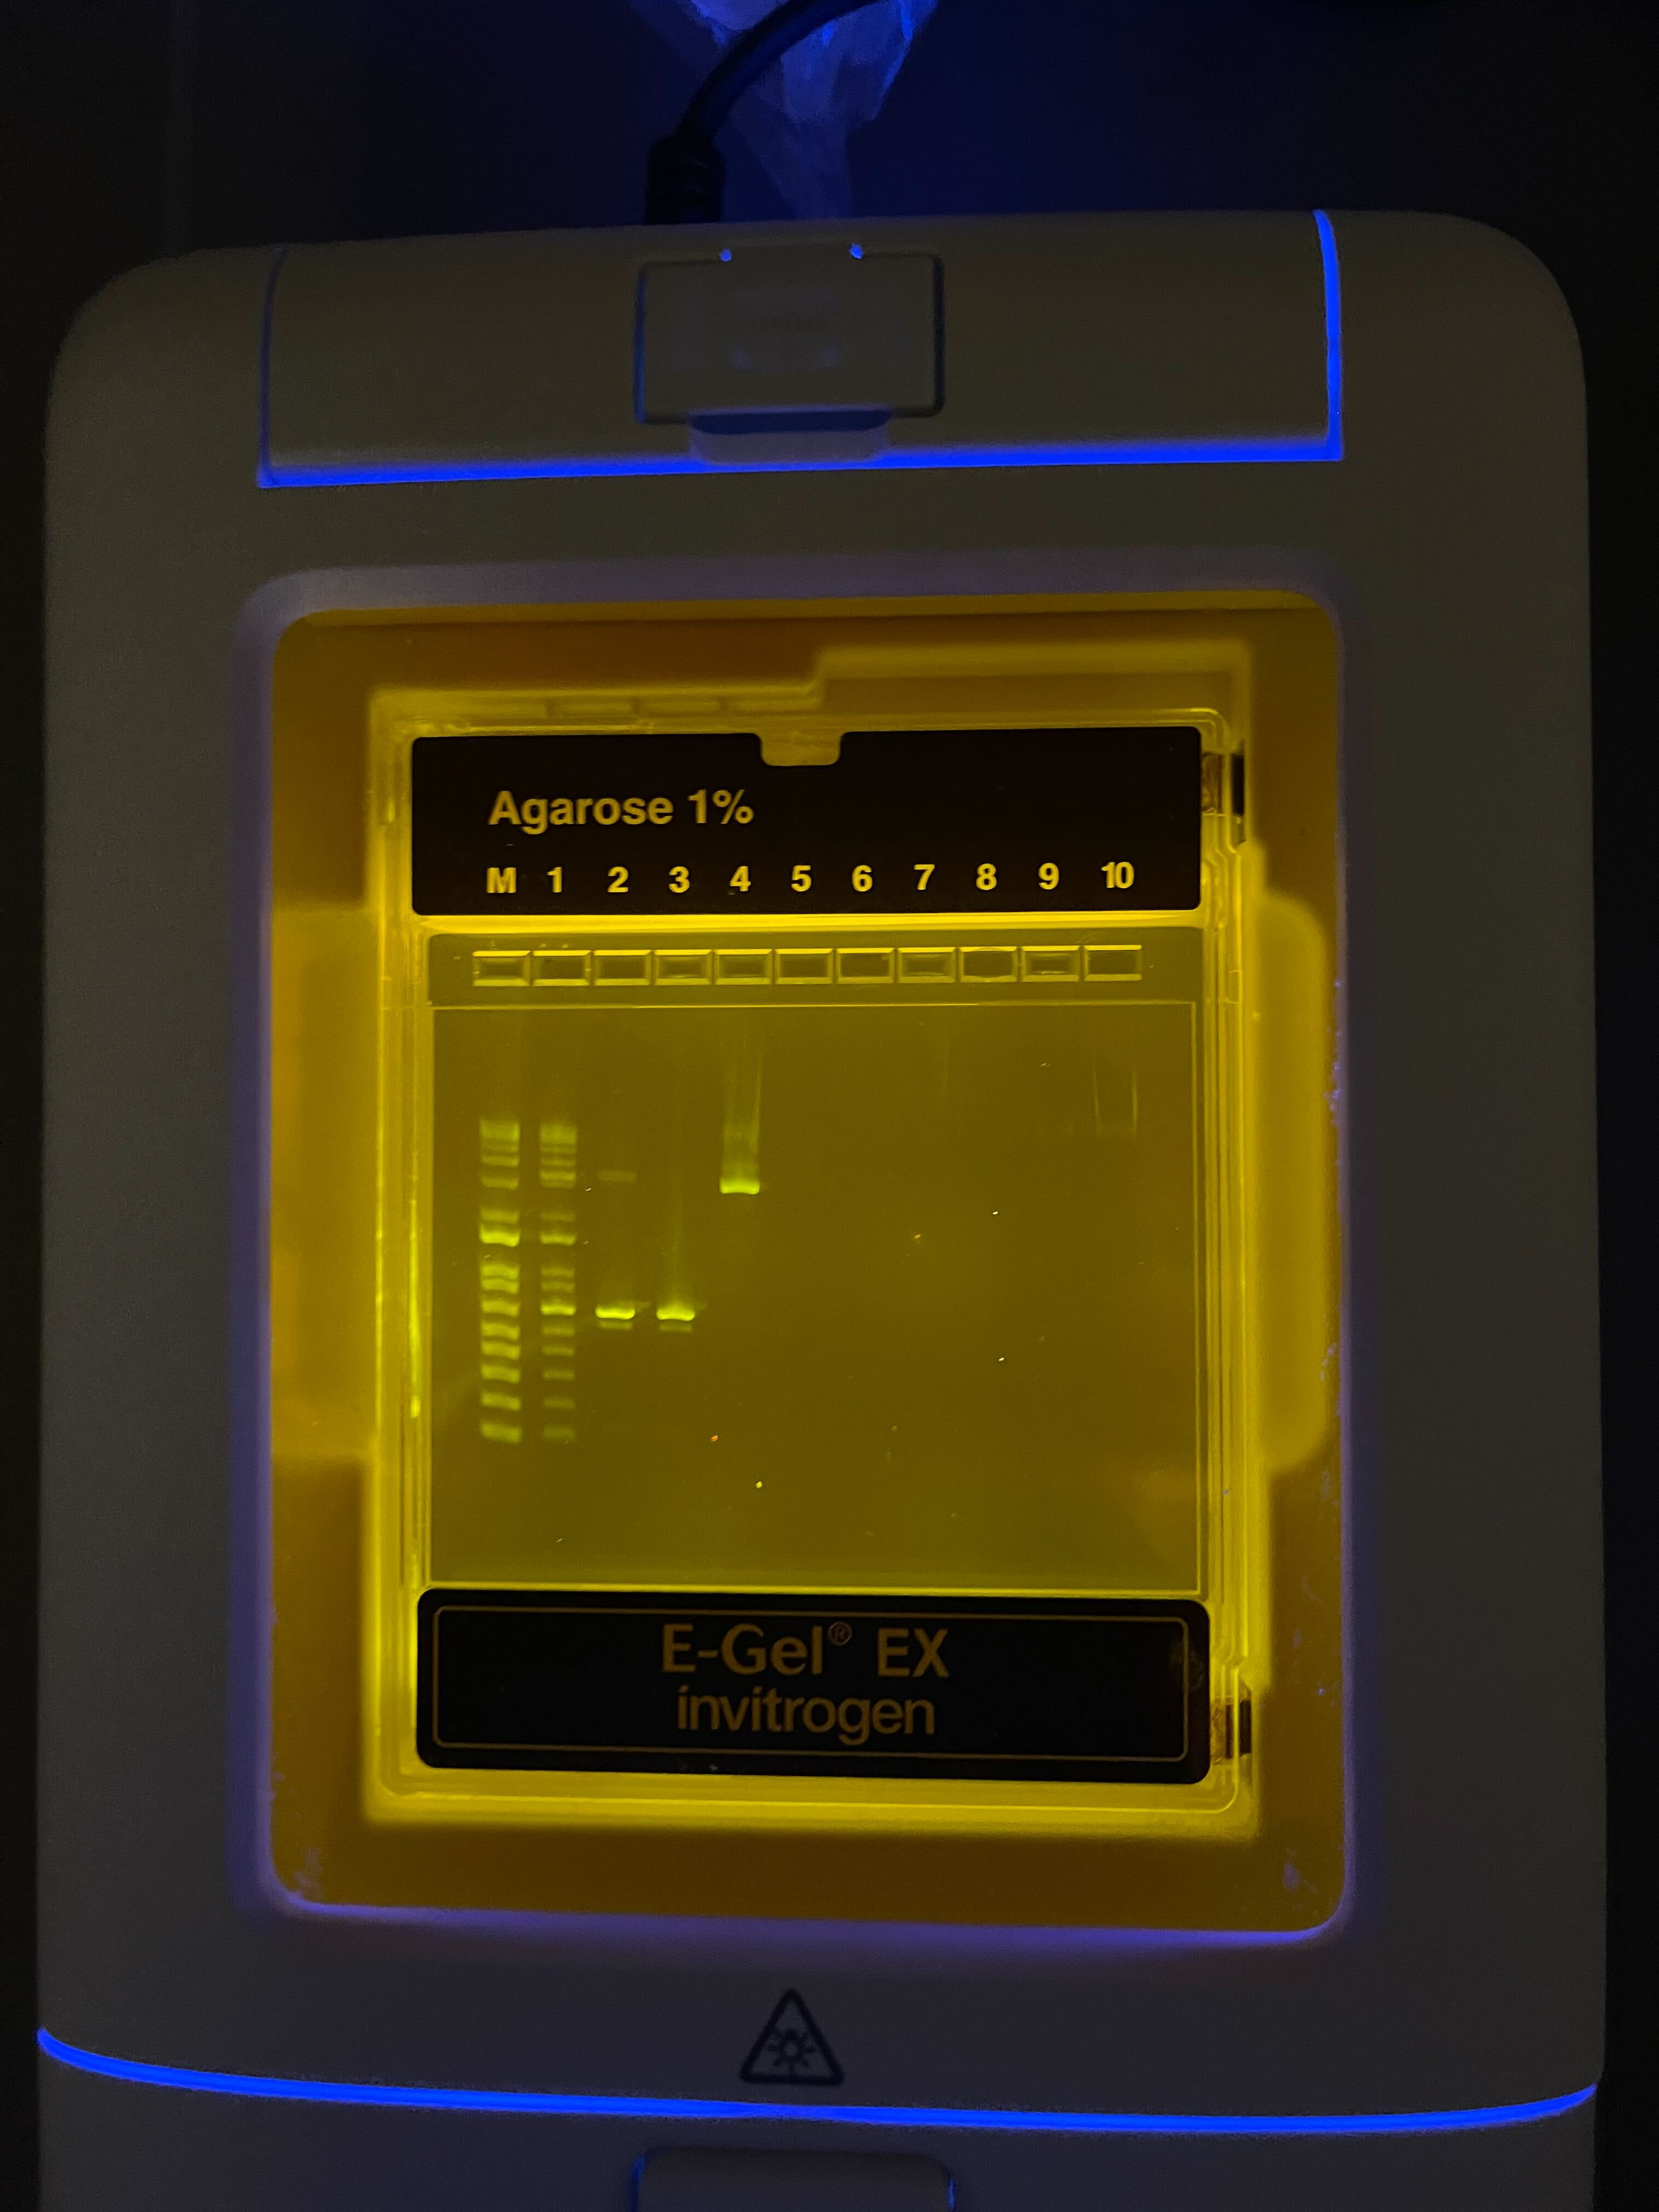
Gel results: checking PCR product sizes on the 1% agarose E-Gel.
Our gel after DpnI digestion and cleanup. Bands are visible in lanes 1 and 4.
Week 7 Lab: Genetic Circuits Part 2
This week we designed a 2-layer intracellular neural network circuit and simulated its behavior. Our team designed a comet. The heatmap of the circuit’s predicted output across X1 and X2 input space produced a comet-shaped gradient: high expression concentrated in the low-X1 / low-X2 corner, with a tail fading diagonally across the landscape.
Circuit design spreadsheet. Our poly-transfection mix with Csy4, CasE, mNeonGreen, and fluorescent markers.
Simulation output. The “comet” heatmap showing predicted mNeonGreen expression across X1 and X2 input doses.
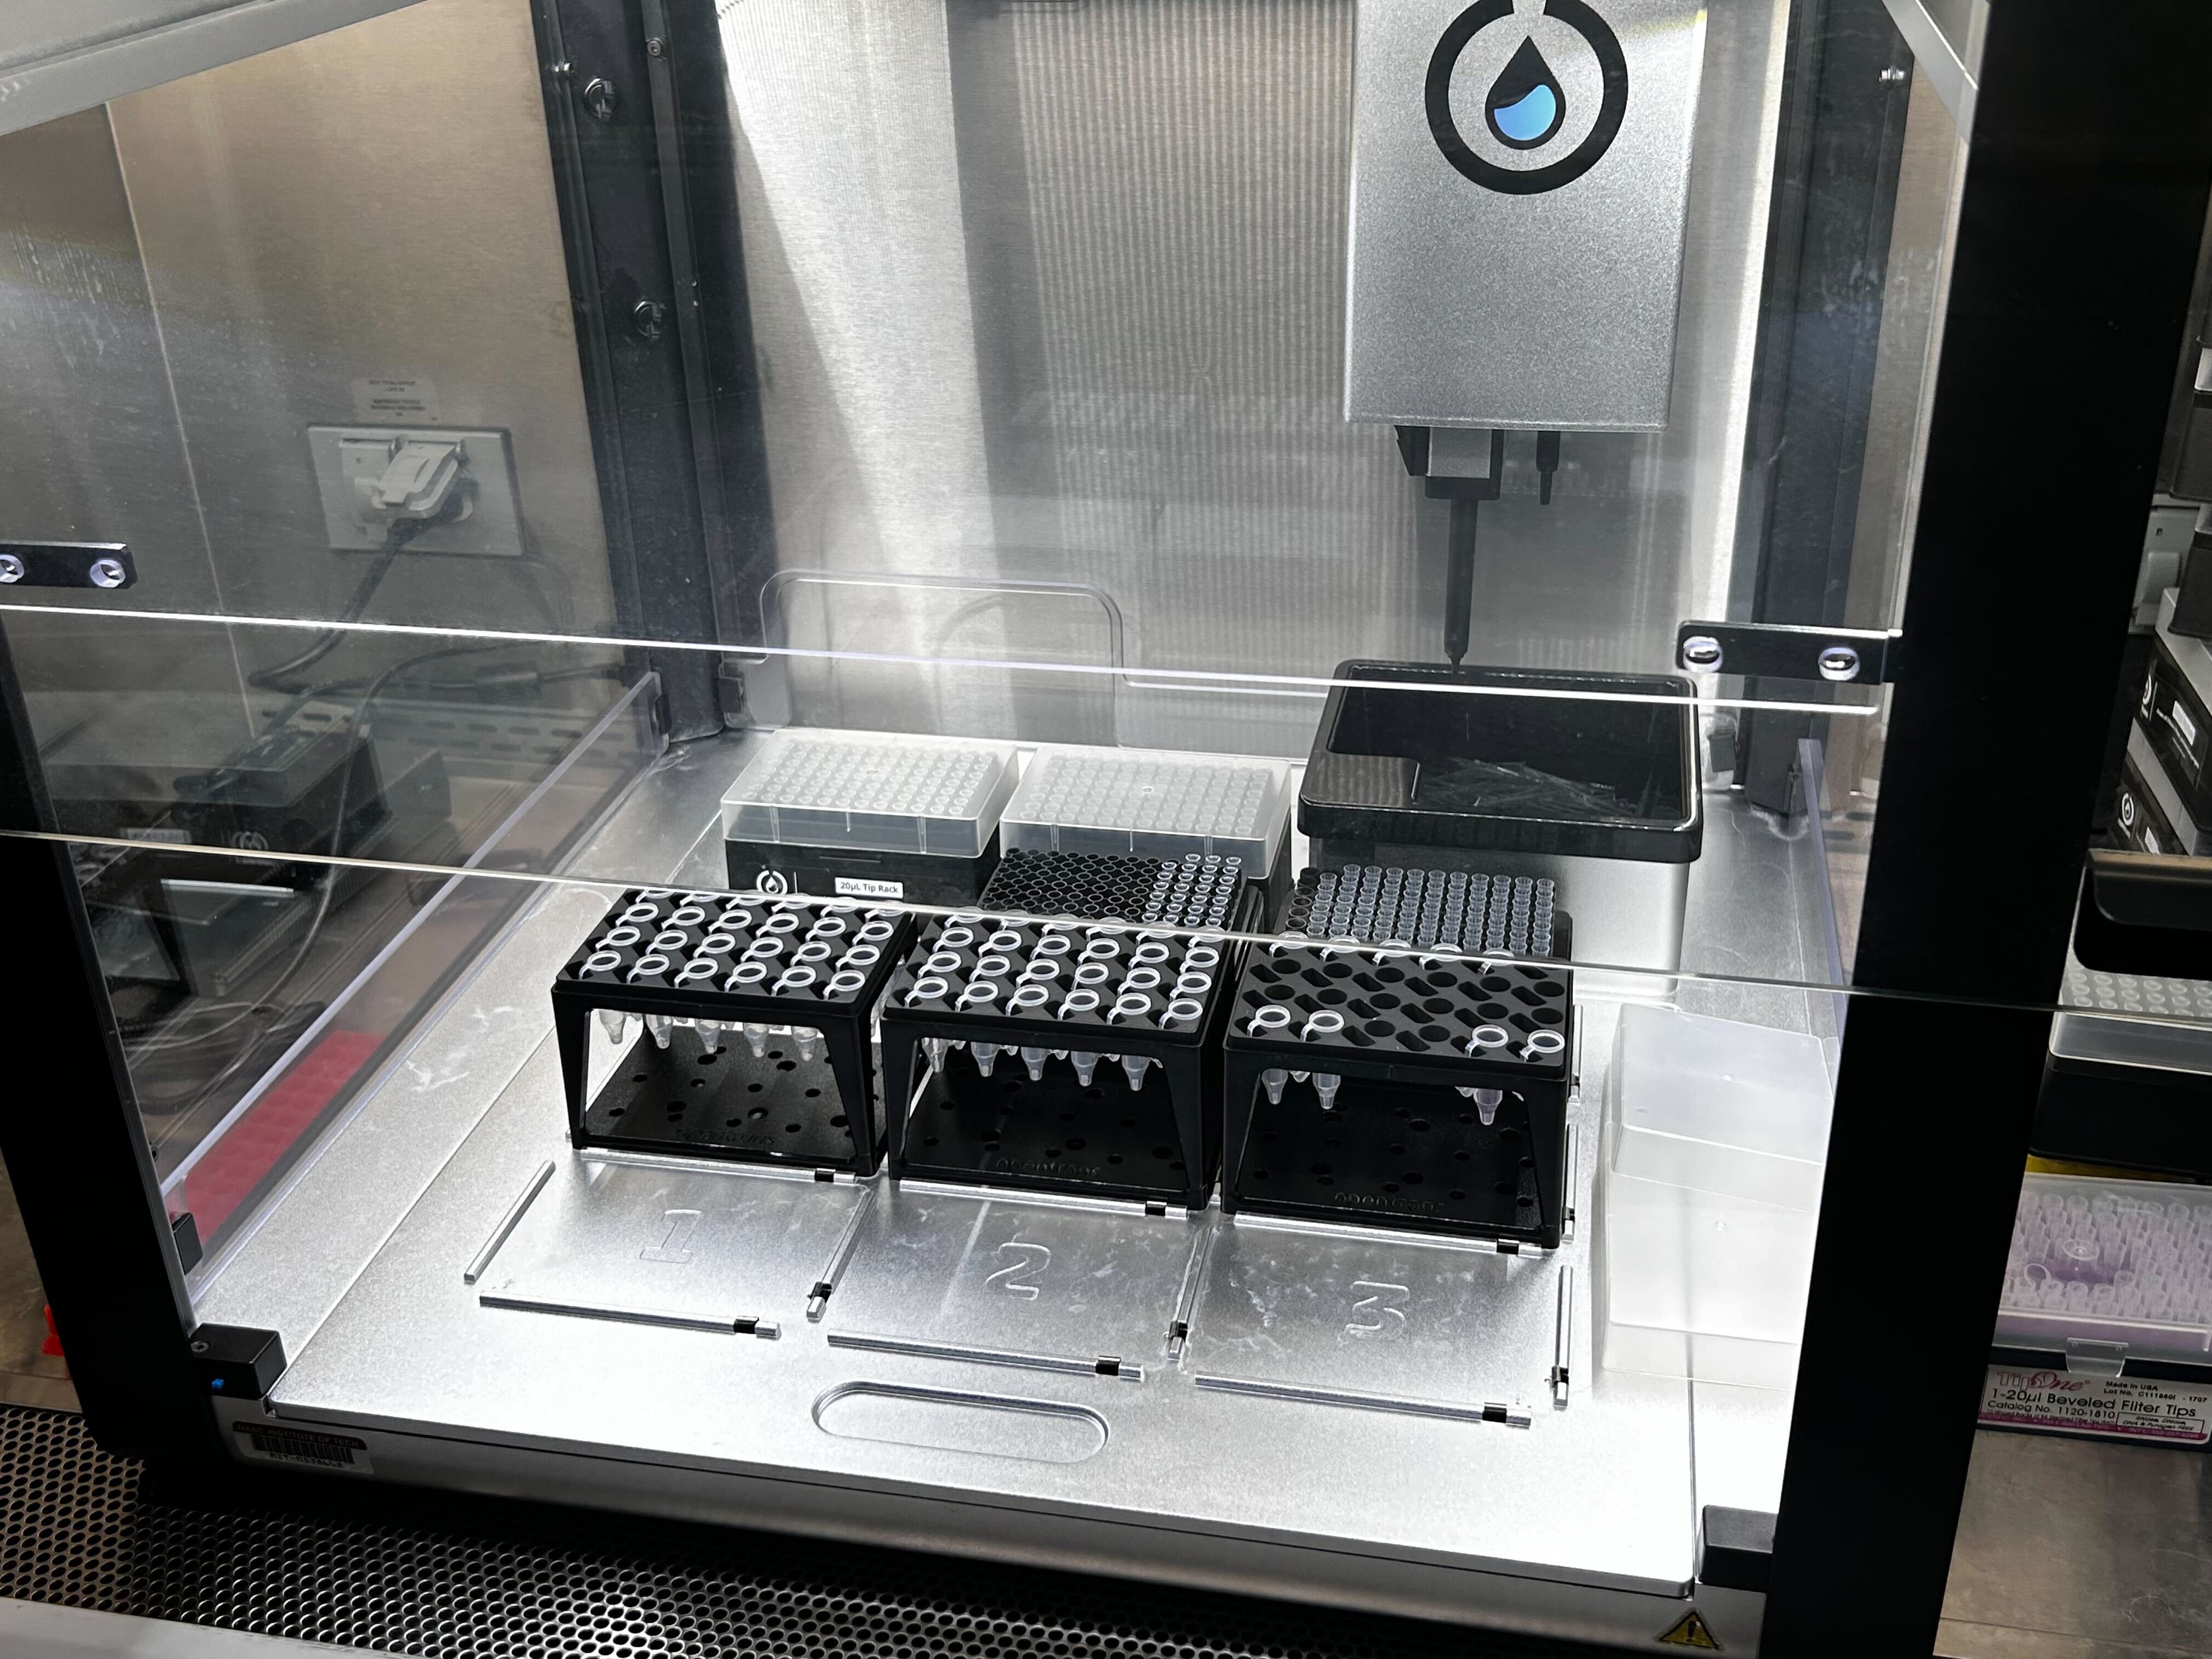
Opentrons deck. Loaded with tube racks and tip boxes for automated transfection mix preparation.
Week 9 Lab: Cell-Free Systems
Writeup pending.
Week 10 Lab: Advanced Imaging
Lab Day at Waters Immerse
Schematic of the Waters LC-MS instrument setup. Our roadmap for the day’s experiments.
The team suited up in lab coats and safety goggles at the Waters facility.
Benchside doodle. Someone’s artistic interpretation of the day’s science between runs.
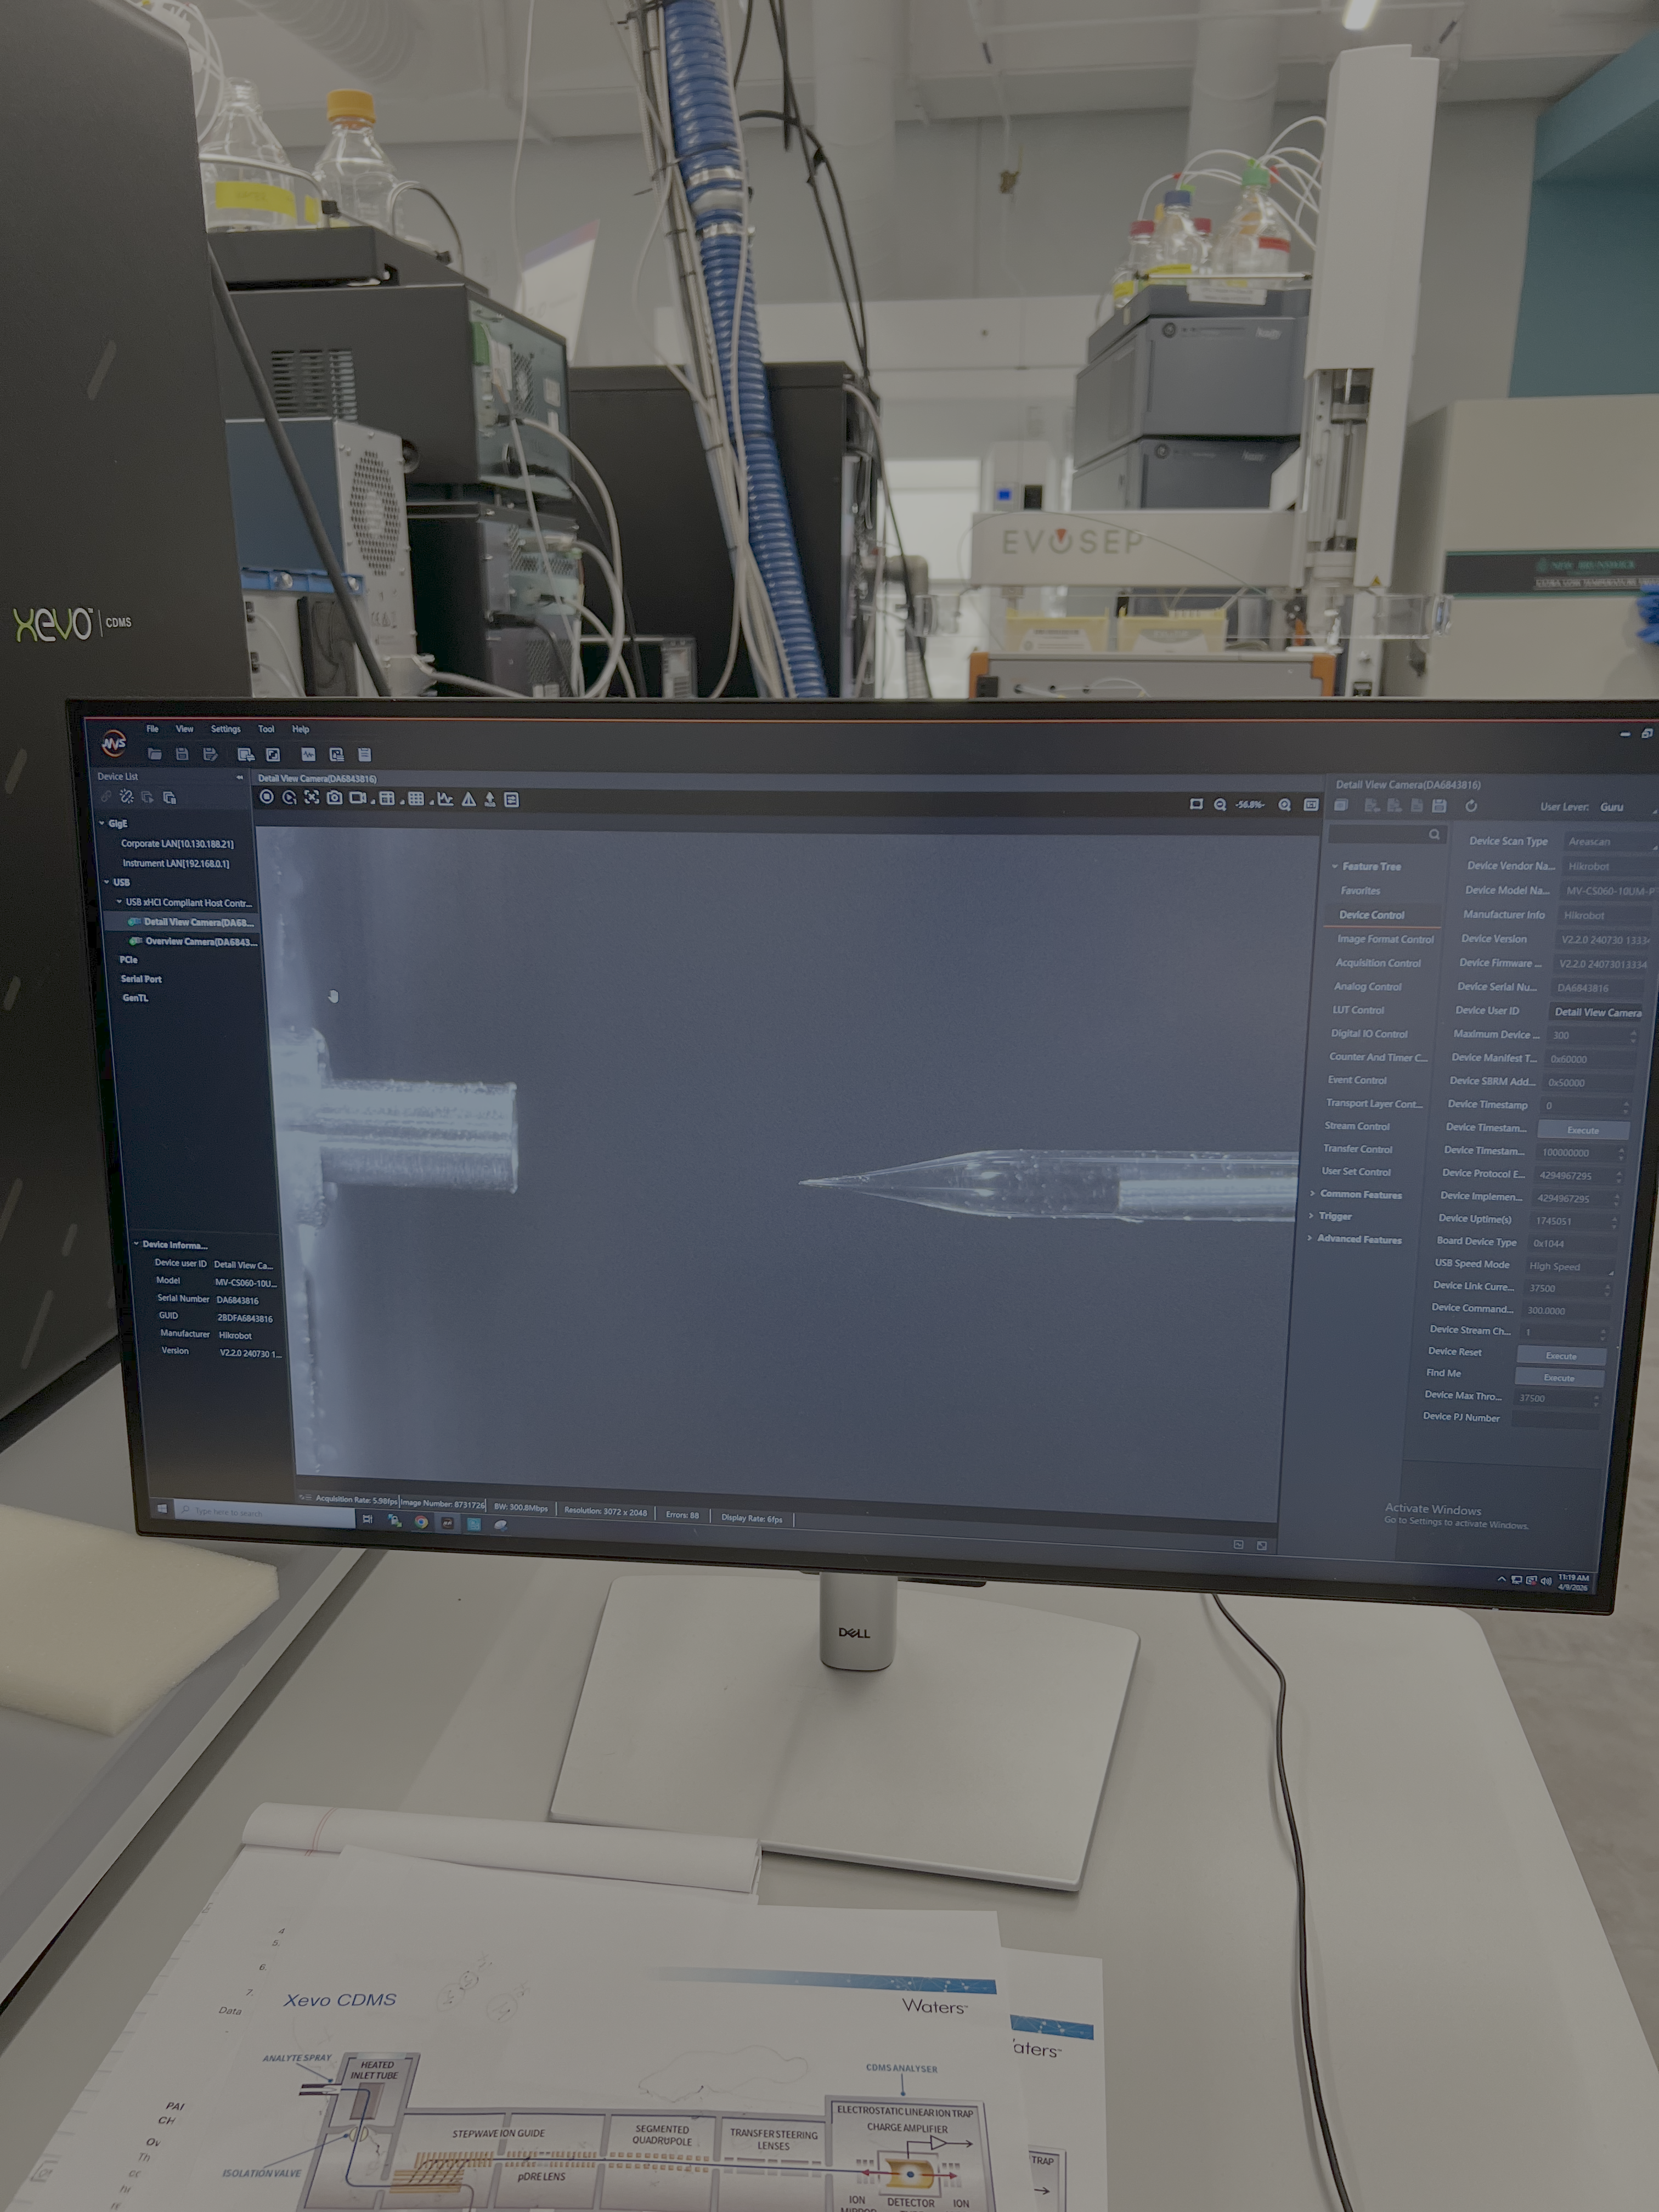
Live view of the mass spec software. Visualizing the capillary tip during a run on the Waters system.
AI-Designed Antimicrobial Peptide Cocktails Tested via Cell-Free Protein Synthesis Sean Murphy · MAS.885 Spring 2026
Abstract Antimicrobial resistance is on track to cause more than 10 million deaths per year by 2050, and the discovery pipeline for new small-molecule antibiotics has slowed sharply over the past two decades. Antimicrobial peptides (AMPs) are an attractive alternative class because they kill bacteria primarily by membrane disruption, a mechanism that is intrinsically harder for pathogens to evolve resistance against.
AI-Designed Antimicrobial Peptide Cocktails Tested via Cell-Free Protein Synthesis
Sean Murphy · MAS.885 Spring 2026
Abstract
Antimicrobial resistance is on track to cause more than 10 million deaths per year by 2050, and the discovery pipeline for new small-molecule antibiotics has slowed sharply over the past two decades. Antimicrobial peptides (AMPs) are an attractive alternative class because they kill bacteria primarily by membrane disruption, a mechanism that is intrinsically harder for pathogens to evolve resistance against.
The broad objective of this project is to ask whether modern AI peptide-design tools, paired with cell-free protein synthesis (CFPS), can be combined into a fast prototyping platform that not only identifies single-peptide hits, but also surfaces synergistic peptide cocktails. The hypothesis is that AMPs produced by mechanistically distinct generative models (a length-conditioned latent-space diffusion model trained on natural AMPs and a CLIP-based target-binder generator) will exhibit synergy when co-expressed, with the most pronounced synergy appearing in cross-method pairs that combine membrane-active generalists with target-directed binders.
To test this, the specific aims are:
Generate candidates with AMP-Diffusion, PepPrCLIP, and a MadSBM fallback strategy
Order 15 codon-optimized linear gene fragments from Twist
Express each peptide in BL21 Star DE3 lysate with GamS nuclease inhibitor to protect linear templates
Score crude lysates against E. coli ATCC 25922 and B. subtilis ATCC 6633 in a two-organism antimicrobial assay, then run pairwise co-expression on top hits and score synergy by an FICI-style metric
Project Aims
Aim 1 · Experimental Aim (this project)
Determine whether AI-designed antimicrobial peptides exhibit synergistic activity when co-expressed. The platform integrates three generative peptide-design tools, 15 codon-optimized Twist linear gene fragments, a Ginkgo Bioworks BL21 Star DE3 CFPS lysate supplemented with NEBExpress GamS Nuclease Inhibitor, and a dual-organism optical-density growth-inhibition assay scored against scrambled-peptide and Cecropin B controls. A primary single-peptide screen identifies hits, and a follow-on pairwise co-expression screen at half-dose scores synergy using an FICI-style fractional inhibition index calculated separately for each organism.
Aim 2 · Development Aim
Close the design, build, test loop by feeding measured single-peptide and pairwise activity data back into the generative models as a fine-tuning signal, producing a second wave of candidates conditioned on both predicted activity and predicted synergy partners. Practically this means:
Step
Action
i
Build a small labelled dataset (sequence → MIC-equivalent inhibition per organism, plus pairwise FICI labels)
ii
Parameter-efficient fine-tuning of AMP-Diffusion and a re-trained MiniCLIP scorer to bias toward in-house hit signatures
iii
Extend the assay panel to clinical isolates (drug-resistant E. coli, MRSA, A. baumannii) + a mammalian-cell cytotoxicity counter-screen
iv
Migrate from manual pipetting to Opentrons OT-2 / Ginkgo automation, raising throughput from ~100 to several hundred reactions per screen
Aim 3 · Visionary Aim
A personalized, on-demand antibiotic-cocktail design platform: a clinician submits a patient’s pathogen genome (or a culture resistance profile), a generative pipeline designs a custom cocktail targeting that strain’s essential proteins and membrane chemistry, the cocktail is expressed locally in a freeze-dried CFPS reaction, and the peptide mixture is administered as a same-day therapeutic. The cocktail approach addresses resistance directly: pathogens that mutate around one membrane-active peptide are far less likely to escape three simultaneously, each with a distinct mechanism. If achieved, this could reduce time-to-treatment for drug-resistant infections from months to days.
Background
Key References
Citation
Contribution to this project
Torres, M. D. T. et al. (2025) “AMP-Diffusion: Generative AI design of antimicrobial peptides,” Cell Biomaterials
Latent-space diffusion model (~16.5 M parameters) on ESM-2 embeddings, trained on 19,670 natural AMPs. Provides the generative backbone for Group A and the Group C fallback.
Bhat, S. et al. (2025) “PepPrCLIP: Target-directed de novo peptide binder design via contrastive language-image pretraining for proteins,” Science Advances
Frozen ESM-2 (650 M) encoder + contrastive “MiniCLIP” scorer that ranks ~100K Gaussian-perturbed candidates against a target. Used to design Group B binders against E. coli FtsZ and LpxC.
Novelty
#
Innovation
1
Two mechanistically distinct generative paradigms in the same Twist order. A generalist distribution-based sampler (AMP-Diffusion) and a target-directed contrastive ranker (PepPrCLIP) are combined head-to-head so that cross-method synergy can be tested against within-method synergy.
2
Linear Twist fragments straight into CFPS instead of plasmid cloning. Compresses design, build, test from weeks to days and makes the platform compatible with future on-demand / point-of-care use cases.
3
Cocktail design as a first-class objective. Rather than asking “which peptide is most potent?”, the platform asks “which combination is most potent at half-dose each?”, the relevant question for resistance-resistant therapeutics.
Why It Matters
The WHO estimates that drug-resistant infections cause ~1.27 million deaths each year today, projected to climb past 10 million per year by 2050 unless the discovery pipeline accelerates. The pharmaceutical industry has largely exited small-molecule antibiotic development because the economic returns are poor, so the gap is increasingly being filled by academic and government-funded efforts to find chemically distinct alternatives. AMPs are a particularly promising chemical class because their primary action (disrupting bacterial membranes) is harder for pathogens to evolve away from than enzyme-target binding, and peptide synthesis can be reprogrammed faster than small-molecule chemistry. If the methods developed here generalize, the broader contribution is a faster, cheaper, more modular antibiotic discovery workflow that can be rerun for each emerging resistant strain.
Ethical Considerations
This project sits at the intersection of three ethical concerns:
Concern
Mitigation
Dual-use biosecurity (generative tools could in principle design toxin-like peptides)
Twist orders pass SecureDNA screening; peptide pool filtered for cationic amphipathic AMP-like character; ATCC reference strains only (not clinical isolates)
PeptiVerse hemolysis, toxicity, and developability predictions on every candidate before ordering DNA; candidates flagged as likely RBC-toxic discarded
Responsible representation of preliminary data
Report negative results (e.g., the no-GamS validation run, the missing MadSBM inference code) with the same emphasis as positive results
Guiding principles: non-maleficence (do no harm, including by not enabling foreseeable misuse), responsibility (using the synthesis-screening infrastructure consciously and transparently), beneficence (adding to humanity’s antibiotic arsenal), and justice (cocktail-based on-demand antibiotic design must be paired with deployment strategies that reach low-income contexts).
Experimental Design
Peptide Panel
Group
Tool
Constructs
Purpose
A
AMP-Diffusion
AMP-D-01 through AMP-D-06
6 generalist AMPs, selected for diversity from ~2,000 candidates after physicochemical filtering
B
PepPrCLIP
PPC-FtsZ-01/02, PPC-LpxC-01/02
4 targeted binders against E. coli FtsZ (UniProt P0A9A6) and LpxC (UniProt P0A725)
C
AMP-Diffusion fallback
AMPD-ALT-01/02/03
3 additional diverse AMP-Diffusion candidates (MadSBM inference code unavailable)
All 15 constructs are ≥ 300 bp (Twist gene-fragment minimum), adapters off, codon-optimized for E. coli K-12, and screened against BsaI, BbsI, EcoRI, HindIII sites and ≥6 nt homopolymer runs.
Timeline
Week
Phase
Activities
Status
1
Computational
AMP-Diffusion (2,000 candidates, lengths 20/25/30/35) → physicochemical filter (charge +2..+9, hydrophobic ratio 0.30..0.70, no homopolymer ≥4) → greedy max-min Hamming selection. PepPrCLIP Quickstart on FtsZ + LpxC. PeptiVerse developability check. Codon-optimize and assemble cassettes.
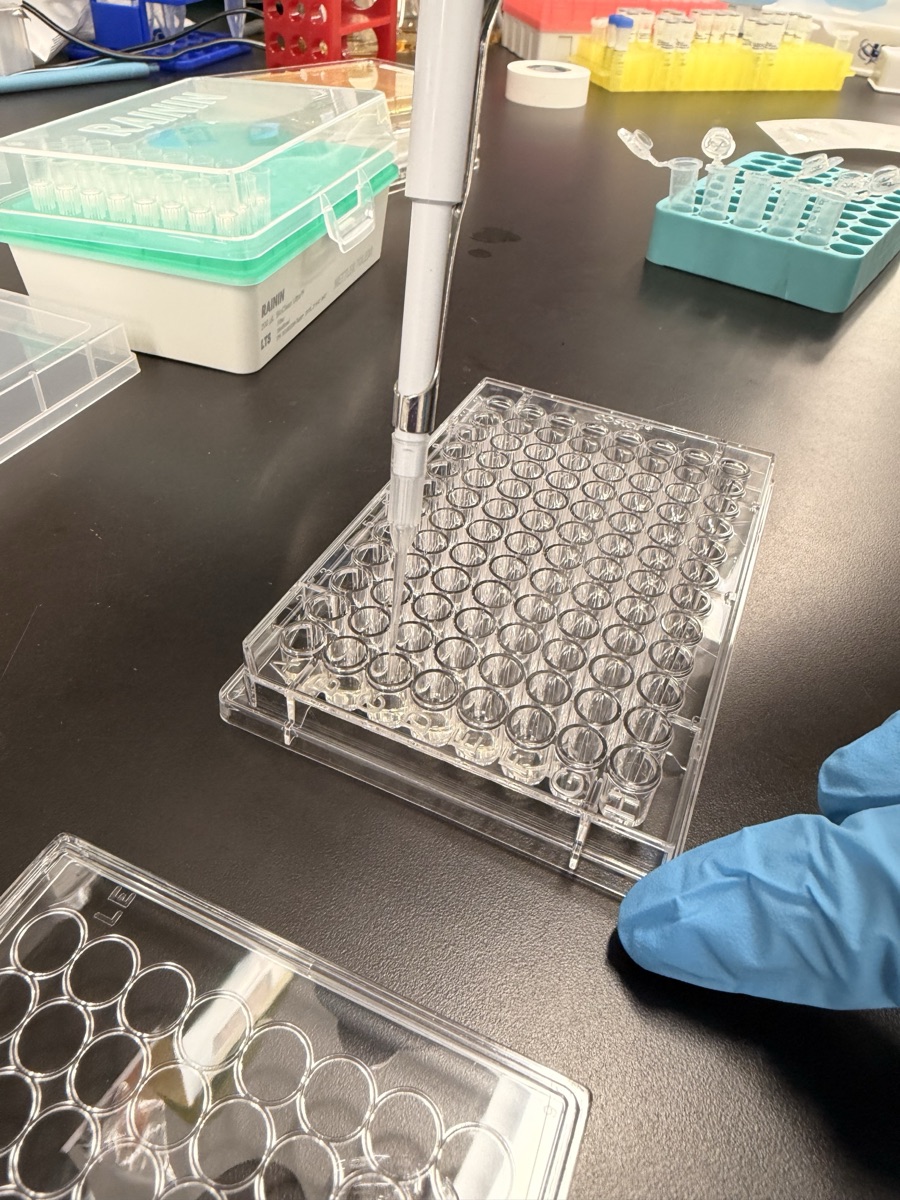
Receive fragments, resuspend to 10 ng/µL. Primary single-peptide CFPS screen: 15 constructs × 3 biological replicates × 2 organisms. 20 µL reactions, 50–100 ng linear template, GamS at 0.6 µg per 20 µL, 30 °C × 4 h. Transfer 5 µL crude lysate into 100 µL of ~5 × 10⁵ CFU/mL Mueller-Hinton culture. OD600 readout.
In progress
2
Bench validation
Pre-flight no-GamS control run for Group A vs E. coli.
Complete
3
Bench
Take top 5–6 hits; pairwise co-expression at half-dose (25–50 ng of each template per 20 µL); single-agent half-dose controls; dual-plate format.
Pending
3
Analysis
Compute FICI per pair per organism. FICI ≤ 0.5 = synergy; 0.5–1.0 = additive; >1.0 = indifference / antagonism. Flag cross-method vs within-method synergy.
Pending
4
Presentation
Repeat best hit/pair on a fresh CFPS batch; produce inhibition heatmaps, FICI grids, helical wheels for top hits; write final report.
Pending
Techniques Used
Category
Technique
Protein design
AMP-Diffusion (generative protein modeling), PepPrCLIP (target-directed peptide design), PeptiVerse (developability prediction), Benchling, models and notebooks, UniProt / NCBI databases
DNA design
DNA construct design, codon optimization, Twist linear gene-fragment ordering
Cell-free systems
BL21 Star DE3 CFPS lysate, T7 RNAP transcription, GamS-protected linear template reactions
Bioproduction
Chassis selection, bacterial culturing (E. coli ATCC 25922, B. subtilis ATCC 6633), Mueller-Hinton broth
Python / PyTorch inference and filtering scripts, Twist order generation
Bioethics
SecureDNA screening, PeptiVerse hemolysis filter, BSL-1 ATCC strains only
Two Techniques in Depth
Cell-Free Reactions
The entire bench phase is built around BL21 Star DE3 cell-free protein synthesis. Each Twist linear gene fragment is resuspended to 10 ng/µL and added at 50–100 ng to a 20 µL reaction containing lysate, reaction buffer, and NEBExpress GamS Nuclease Inhibitor (0.6 µg per 20 µL reaction). GamS is essential: it sequesters the RecBCD exonuclease in the crude lysate, which would otherwise degrade the linear DNA template within minutes. The no-GamS validation run (below) confirms that without it, peptides are not produced at detectable levels.
Reactions incubate at 30 °C for 4 h, then 5 µL of crude lysate is transferred directly into a 100 µL bacterial test well. No peptide purification step is needed because the assay tolerates lysate background, controlled for by the scrambled-Cecropin negative control. Using CFPS rather than plasmid-based in vivo expression compresses the design-build-test loop from weeks to days and decouples the peptide chemistry from any host-toxicity confounder, since the host that would normally express the AMP is not part of the assay.
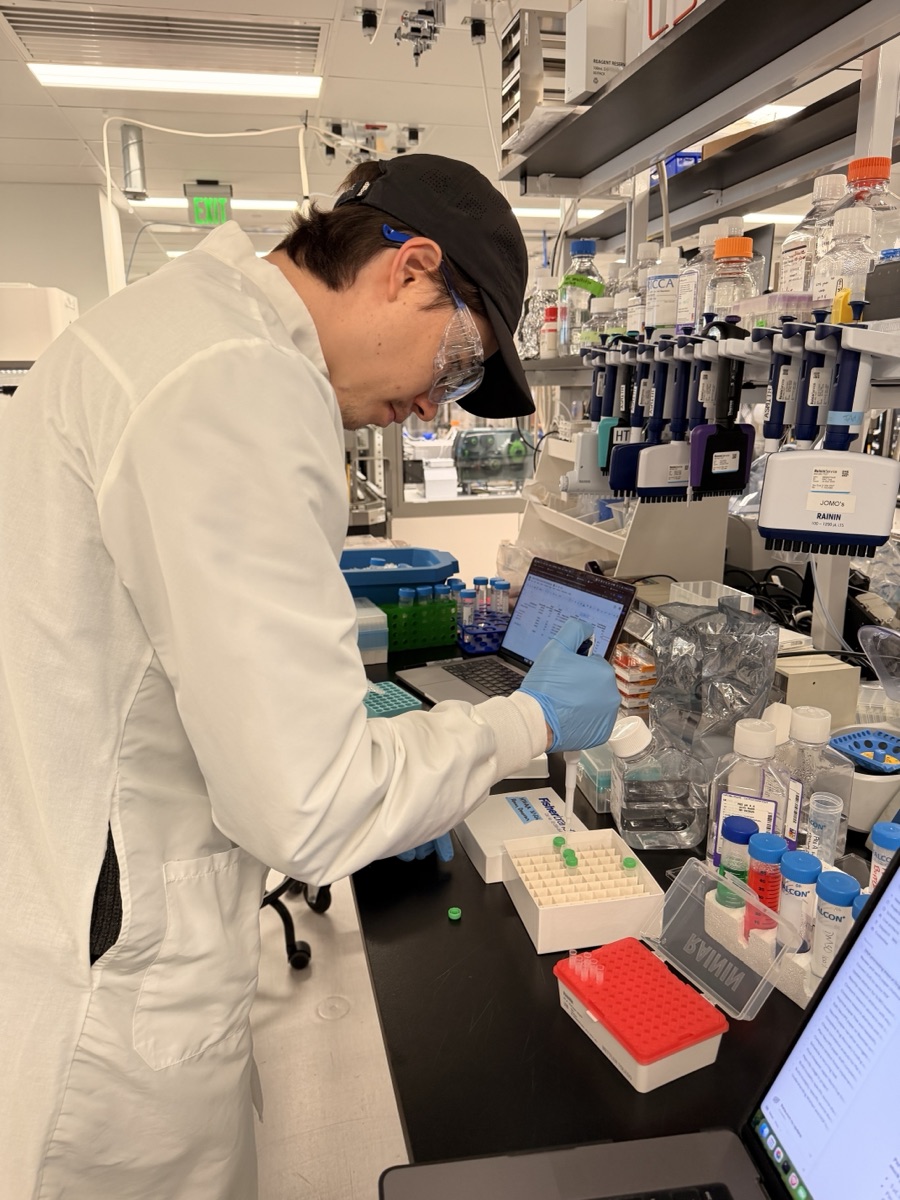
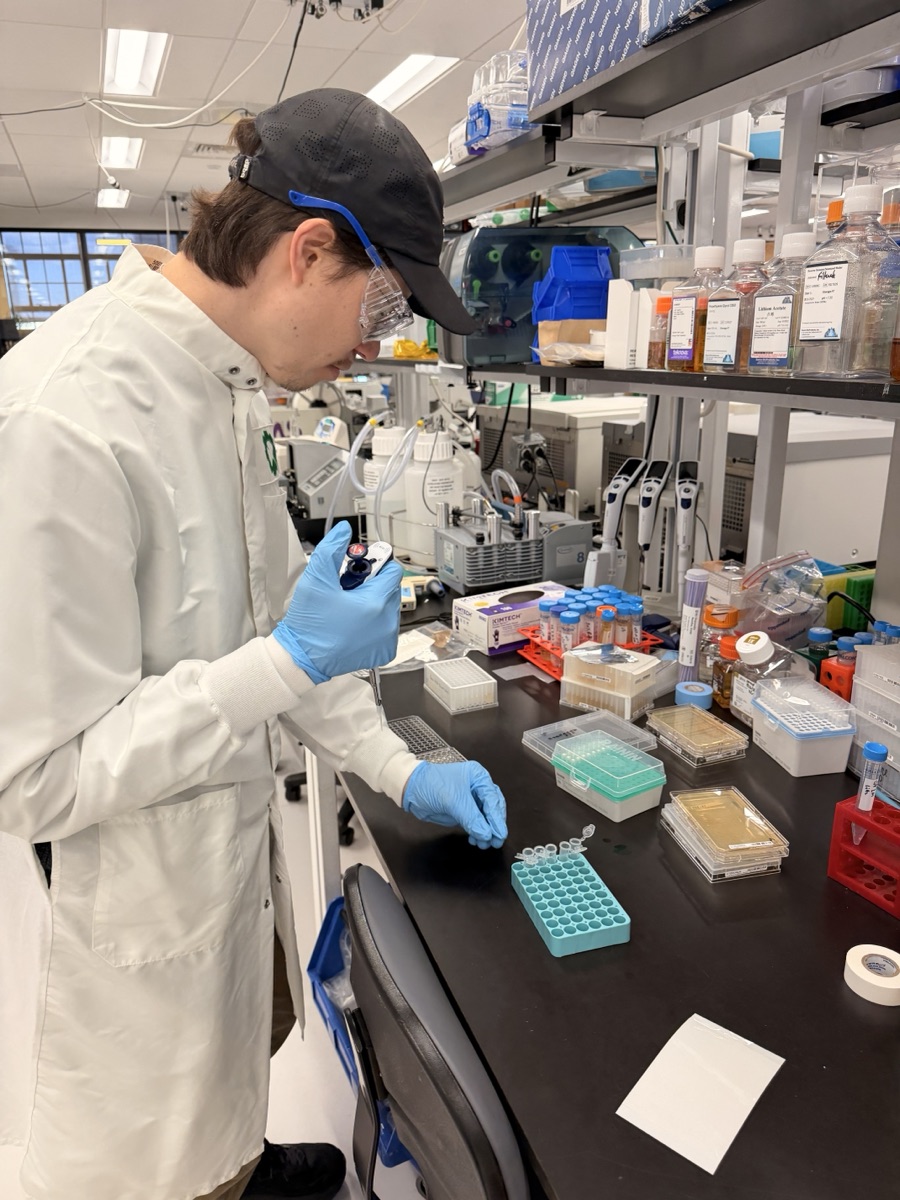
Setting up CFPS reactions at the bench.
Transferring template and reagents into reaction strips.
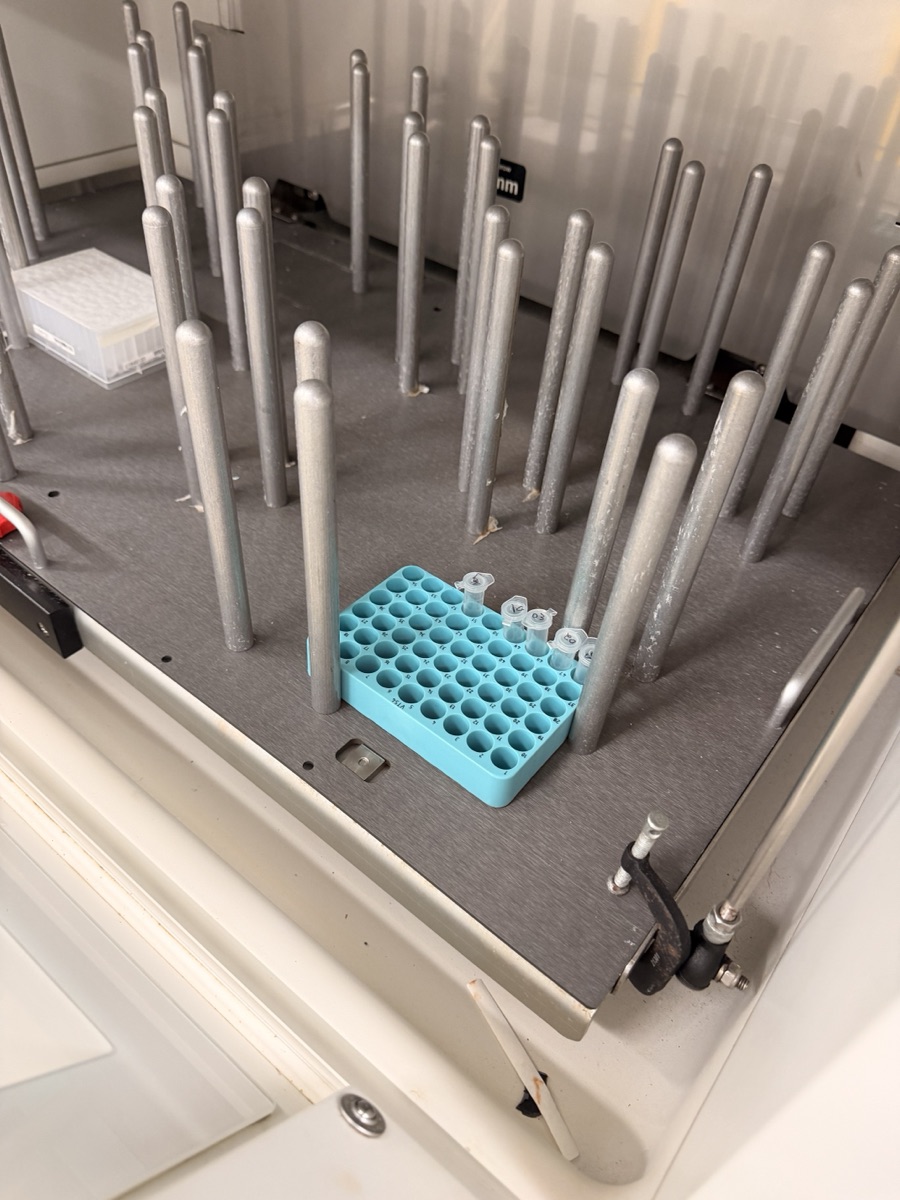
Incubator with rack ready for the 30 °C × 4 h CFPS step.
Spiking crude lysate into the bacterial test plate.
Protein Design (Generative Peptide Modeling)
Three AI tools were used in this project:
Tool
Role
Output
AMP-Diffusion (Torres et al., Cell Biomaterials 2025)
Latent-space diffusion model conditioned on length; produces broad-distribution AMP candidates
~2,000 candidates across lengths 20/25/30/35, filtered by net charge (+2..+9), hydrophobic ratio (0.30..0.70), homopolymer runs (<4). Top 6 most diverse selected for Group A + 3 fallback for Group C.
PepPrCLIP (Bhat et al., Science Advances 2025)
CLIP-based contrastive scorer that ranks a 100K Gaussian-perturbed peptide pool against a target
E. coli FtsZ (P0A9A6) and LpxC (P0A725) scored; top 2 diverse binders per target picked for Group B.
Run on all 13 designed peptides via the Gradio API. Hemolysis score < 0.5 required for every shipped construct.
All peptide ORFs were reverse-translated using a high-expression E. coli K-12 codon table, screened against common restriction sites and homopolymer runs, then padded out to 300 bp for Twist.
Industry Council Partners
Company
Contribution
Twist Bioscience
Supplier of the 15 linear gene fragments (the physical DNA inputs to the project)
Ginkgo Bioworks
Supplier of the BL21 Star DE3 CFPS lysate used to express every peptide
New England Biolabs
Supplier of NEBExpress GamS Nuclease Inhibitor (#P0774S), required to protect linear templates from RecBCD
ATCC
Supplier of E. coli ATCC 25922 and B. subtilis ATCC 6633 test strains
SecureDNA
Sequence screening pipeline that the Twist order passed through before synthesis
Results
What Has Been Validated
Two aspects of the project are validated so far:
Computational design pipeline. All three AI tools were stood up successfully and produced sequences that passed physicochemical and developability filters; the resulting 15 codon-optimized Twist constructs are documented in constructs/construct_details.csv and assembled in twist_orders/twist_order_batch1_FINAL.csv.
Bench workflow’s interpretive logic. Group A AMP peptides were expressed in BL21 Star DE3 lysate without GamS and assayed against E. coli ATCC 25922 as a negative-by-design control. The expectation was that the linear DNA would be chewed up by RecBCD before useful amounts of peptide could accumulate, so no antimicrobial activity should be visible above scrambled control. That expectation was met, which validates the necessity of GamS in subsequent runs and demonstrates that the assay correctly returns a null result when no functional peptide is produced.
No-GamS Validation Run, Quantitative Data
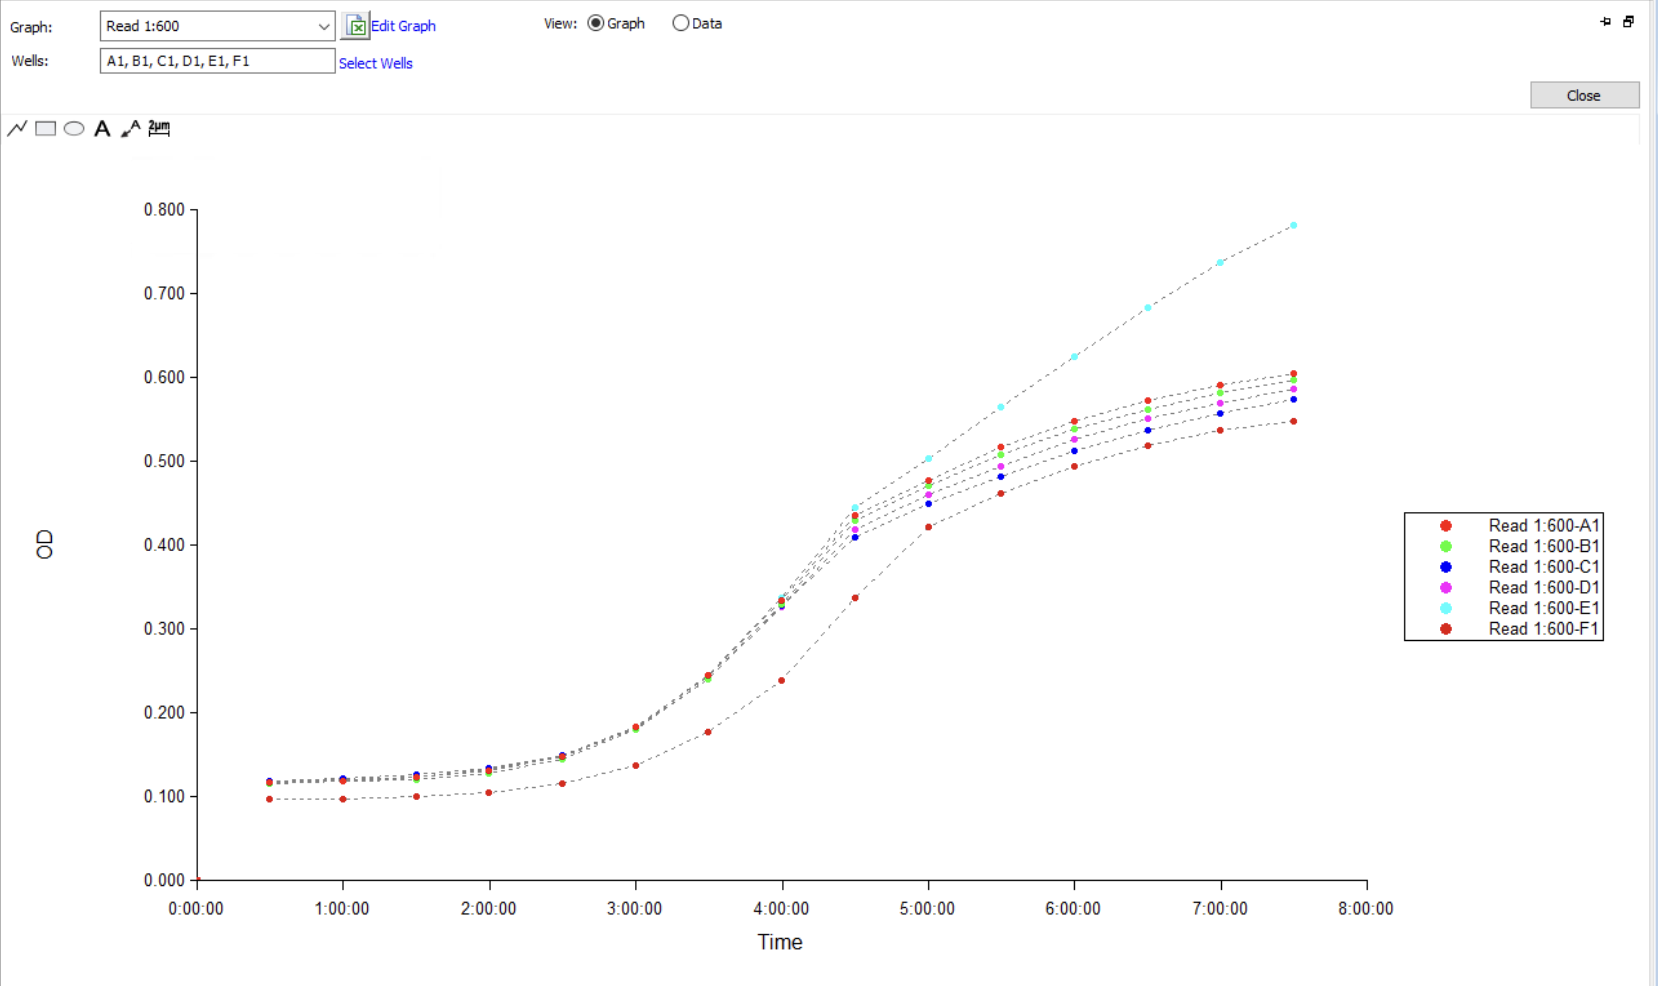
Wells A1 through F1 correspond to AMP-D-01 through AMP-D-06 spiked into E. coli ATCC 25922 in Mueller-Hinton broth at ~5 × 10⁵ CFU/mL starting density. OD600 read every 30 min for 7.5 h on the plate reader.
Figure 1. OD600 growth curves over 7.5 h for the no-GamS Group A validation run. Wells A1 through F1 correspond to AMP-D-01 through AMP-D-06 in CFPS reactions added to E. coli ATCC 25922 in Mueller-Hinton broth. All six wells show normal sigmoidal growth with no inhibition relative to one another, confirming that without GamS protection the linear DNA template is degraded by RecBCD before functional peptide accumulates.
Phase
Time
OD600
Lag
0–2 h
~0.10 (flat)
Exponential
2–5 h
Rising from ~0.10 to ~0.45
Stationary
5–7.5 h
Endpoint OD600 ≈ 0.55 (well F1) to ≈ 0.78 (well E1); wells A1, B1, C1, D1 clustered tightly between ≈ 0.55 and 0.61
The growth curves overlap heavily through lag and early-exponential phases and only diverge modestly in stationary phase, the normal pattern for untreated wells of the same strain. The key interpretive point is that no peptide well showed any reduction in E. coli growth relative to the others. The well that looks like an outlier (E1) is higher, not lower, which is the opposite of an antimicrobial signal. This is the expected null result. Without GamS, the linear template is degraded by RecBCD before functional peptide accumulates, so no antimicrobial activity is detectable, even though the bacteria are clearly viable and growing normally. The same plate reader, lysate prep, Twist fragments, and E. coli culture will be used for the +GamS run, so any growth suppression observed there can be attributed to peptide expression rather than to assay artifact.
Quantitative Expectations for the +GamS Phase
Metric
Target
Group A hits (≥50% inhibition vs scrambled)
≥ 2 of 6 against at least one organism
Group B hits (≥50% inhibition vs scrambled)
≥ 1 of 4 against E. coli (bias expected, since binders are designed against E. coli targets)
Positive control (Cecropin B)
Strong inhibition of E. coli, weak inhibition of B. subtilis (gram-selective)
Negative control (scrambled)
OD600 indistinguishable from lysate-only
Synergy screen
≥ 1 FICI ≤ 0.5 combination, with cross-method (Group A × Group B) pairs over-represented vs within-method pairs
Published CFPS-AMP studies typically report 30–70% growth inhibition for active AMPs versus scrambled controls.
Challenges and Limitations
Challenge
Status
Mitigation
MadSBM inference code not public
Encountered
Model weights are on HuggingFace (ChatterjeeLab/MadSBM) but no inference code or usage example was published. Rather than reverse-engineer a Schrödinger-bridge inference loop, fell back to a parallel AMP-Diffusion run maximizing Hamming distance from Group A picks. Loses the original spectrum-broadening hypothesis but preserves the cocktail-synergy hypothesis, which is the project’s main scientific question.
Linear template degradation by RecBCD in CFPS lysate
Mitigated
NEBExpress GamS Nuclease Inhibitor (NEB #P0774S) added at 0.6 µg per 20 µL reaction. Validated by the deliberately-no-GamS Group A run (Figure 1).
Modest yield of short peptides in CFPS
Anticipated
Strong E. coli RBS + codon-optimized ORFs + 3 biological replicates per construct. Fallback: scale CFPS reaction volume from 20 µL to 50 µL.
15-peptide pilot, generalizability
Acknowledged
Framed explicitly as a feasibility study, not a clinical pre-screen. Cross-method vs within-method pairs are built-in controls, making the central synergy assumption directly testable.
~0.6 µg per 20 µL reaction; required for linear DNA protection
Ginkgo BL21 Star DE3 CFPS kit (~100 reactions)
$200–$500
Provided through HTGAA / Ginkgo. Confirmed available.
E. coli ATCC 25922 + B. subtilis ATCC 6633 strains
$80–$140
ATCC standard reference strains
Mueller-Hinton broth + agar plates
$60–$100
Standard microbiology consumables
96-well clear flat-bottom plates (×2 per screen)
$40–$80
One plate per assay organism
Filter tips, microcentrifuge tubes, pipettes
$50–$120
Shared lab stock
GPU compute (L40S × ~20 h for all AI runs)
$30–$60
Cloud GPU credits
TOTAL (estimated range)
$890–$1,528
Within the $2,000 project ceiling
References
Reference
Use in this project
Torres, M. D. T., Mohanty, A., Chatterjee, P., de la Fuente-Nunez, C., et al. (2025). AMP-Diffusion: Generative AI design of antimicrobial peptides. Cell Biomaterials.
Generative backbone for Groups A and C
Bhat, S., Palepu, K., Chatterjee, P., et al. (2025). PepPrCLIP: Target-directed de novo peptide binder design via contrastive language-image pretraining for proteins. Science Advances.
Target-binder generation for Group B
Goel, V. & Chatterjee, P. (2026). Minimal-Action Discrete Schrödinger Bridge Matching (MadSBM). arXiv:2601.22408 / ICLR 2026. Weights on HuggingFace: ChatterjeeLab/MadSBM; no inference code available.
Originally intended for Group C; replaced by AMP-Diffusion fallback
Zhang, A., Chatterjee, P., et al. (2026). PeptiVerse: A unified platform for therapeutic peptide developability prediction. bioRxiv, DOI: 10.64898/2025.12.31.697180. Hosted at huggingface.co/spaces/ChatterjeeLab/PeptiVerse.
Hemolysis, solubility, toxicity filter
Sun, Z. Z., Hayes, C. A., Shin, J., et al. (2013). Protocols for implementing an Escherichia coli-based TX-TL cell-free expression system for synthetic biology. JoVE 79, e50762.
GamS-based linear DNA protection protocol
World Health Organization (2024). Global Antimicrobial Resistance Surveillance Report.
UniProt: P0A9A6 (FtsZ, E. coli K-12) and P0A725 (LpxC, E. coli K-12)
PepPrCLIP target inputs
ATCC: ATCC 25922 (E. coli) and ATCC 6633 (Bacillus subtilis subsp. spizizenii)
Test strains for dual-organism antimicrobial assay
Twist Bioscience Gene Fragment specifications
300 bp minimum, adapters off
Group Final Project
Homeworks
Subsections of Homeworks
Week 1 HW: Principles and Practices
The application I want to build
I want to develop a closed-loop pipeline for peptide engineering that uses Feynman–Kac (FK) steering to control diffusion-based protein generation at inference time. The goal is to go beyond zero-shot prediction and instead build an automated engineering cycle that repeatedly:
uses FK steering to bias the next round of generative sampling toward better candidates without retraining the underlying diffusion model.
This is inspired by the FK-steering approach, which wraps a diffusion-based protein generator with a sampling scheme so trajectories are continuously reweighted toward user-defined rewards. In our case, the reward is the experimental readout itself.
Why peptides?
Peptides are a good choice for this project because they are fast to synthesize and test, which makes them compatible with iterative lab loops. Many peptide properties we care about (solubility, stability, expression, off-target behavior) are hard to optimize from prediction alone, so a wet-lab loop is attractive. Functionally, peptides can serve as binders, inhibitors, diagnostic reagents, or modular parts in synthetic biology pipelines.
Milestones
Horizon
Goal
Class MVP
Learn the wet-lab steps for this pipeline and complete at least one full design–build–test cycle.
Medium term
Compare FK steering against simple finetuning and reinforcement learning baselines.
Long term
Use this framework to discover therapeutic proteins.
Governance and policy goals
Closed-loop design could be repurposed to create harmful biomolecules. Governance should reduce the probability of both deliberate misuse and accidental creation of dangerous function. The overarching goal is therefore misuse prevention, broken down into three sub-goals:
Ensure the system does not optimize toward harmful or restricted targets and functions.
Reduce the chance that hazardous sequences are synthesized without review.
Maintain audit trails and responsible-use norms.
Three governance options
I propose three governance actions spanning institutional review, synthesis controls, and logging infrastructure.
Option 1: Institutional Review
Aspect
Details
Purpose
Add structured risk assessment before synthesis, target changes, or new reward functions in academic protein design projects.
Lightweight review gates and good record-keeping practices are sufficient for most academic work.
Risks
May push students to under-report; if too strict, could slow down R&D.
Option 2: Synthesis Controls
Aspect
Details
Purpose
Require synthesis vendors to perform functional or homology-based screening of orders.
Design
Institutions only purchase from vendors who screen orders and verify customer identity.
Assumptions
Sequence screening can be done well enough to meaningfully reduce risk.
Risks
Screening must be highly accurate to catch edge cases; missed cases could have severe consequences.
Option 3: Logging Infrastructure
Aspect
Details
Purpose
Create a secure, shared database that tracks when AI tools generate protein designs.
Design
Built-in logging of AI tool usage with cross-referencing against synthesis orders.
Assumptions
Confidentiality and transparency can be balanced.
Risks
Hacking risk, plus tension with sensitive intellectual property.
Scoring
Does the option:
Option 1
Option 2
Option 3
Enhance Biosecurity
• By preventing incidents
2
1
2
• By helping respond
1
2
1
Foster Lab Safety
• By preventing incidents
1
2
3
• By helping respond
1
2
1
Protect the environment
• By preventing incidents
2
2
3
• By helping respond
2
2
1
Other considerations
• Minimizing costs and burdens to stakeholders
2
2
2
• Feasibility
1
2
3
• Not impede research
1
2
1
• Promote constructive applications
1
2
2
Prioritization and tradeoffs
In order of priority:
Option 1 (Institutional Review). This option can be implemented the fastest. MIT already has the safety infrastructure (IBC, EHS) to build on. As a leading institution in AI protein design, MIT can set standards that others follow, and a well-designed lightweight review process could become a widely adopted model.
Option 2 (Synthesis Controls). The existing federal framework provides a strong template (vendor screening, customer verification, reporting requirements), but it depends on industry cooperation beyond MIT’s control. MIT can contribute by researching better screening algorithms and influencing government gold standards.
Option 3 (Logging Infrastructure). If this project becomes a widely used system, tracking who designed what becomes relatively easy. The system has to be designed extremely carefully to be scalable, secure, transparent, and yet confidential.
Tradeoffs
Speed vs. safety
Open science vs. closed science
Transparency vs. confidentiality
Key uncertainties
How manageable it is to manually gate research directions.
How well screening actually works against deliberate misuse.
How feasible it is to design a logging system everyone is satisfied with.
Reflection on this week
Unfortunately, I was ill this week and was unable to attend class.
Week 2 HW: DNA Read, Write, & Edit
Gel Electrophoresis Designs
A pattern in the style of Paul Vanouse’s Latent Figure Protocol
I created an image of Mount Fuji with clouds in the sky. The image is inverted to make the figure easier to see.
Note: We worked in groups during lab this week, so the design we ran on the gel was different from the one above.
DNA Design Challenge
The protein
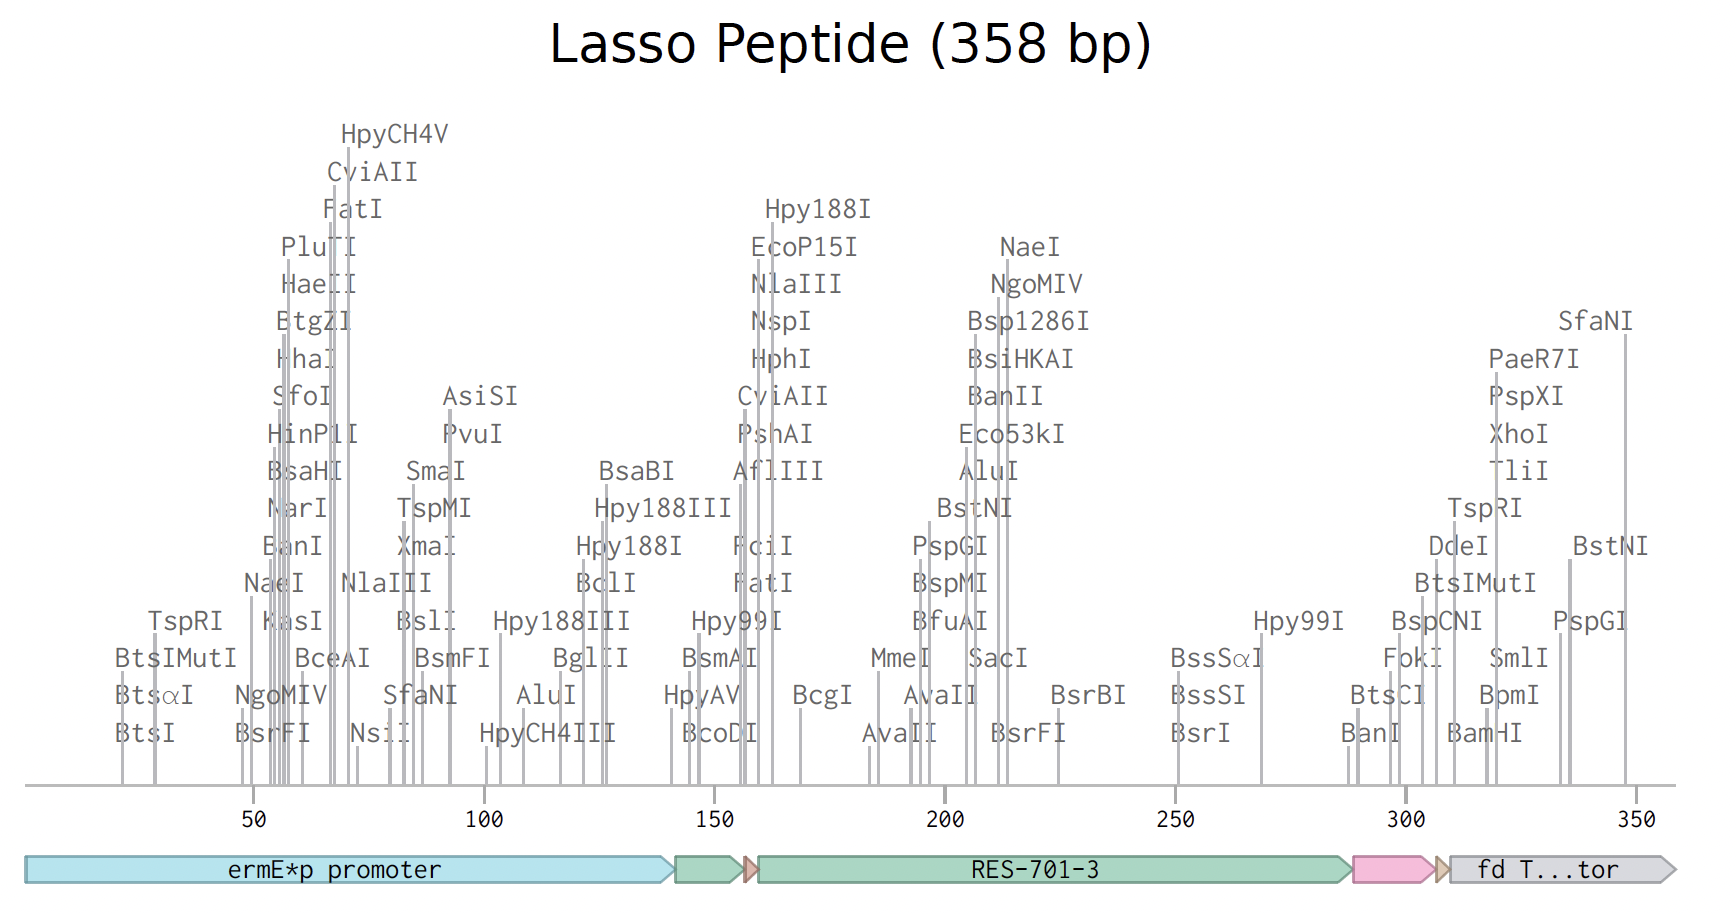
RES-701-3 is a tiny natural protein made by soil bacteria (Streptomyces). It belongs to a family called lasso peptides, named because the structure looks like a lasso or slipknot: the tail of the protein threads through a loop, creating a knot that is extremely hard to unravel.
This knotted shape makes lasso peptides unusually tough. They resist digestive enzymes, heat, and harsh chemical environments. These are properties that most proteins lack, and that make lasso peptides attractive as potential drugs.
RES-701-3 blocks a receptor on the surface of blood vessel cells called the endothelin type B receptor (ETB). The endothelin system controls blood vessel tightening and relaxation, and it becomes dysregulated with age, contributing to high blood pressure and vascular disease. RES-701-3 acts as an inverse agonist: it blocks the receptor and pushes it toward a state less active than its resting baseline.
In nature, the bacterium makes this peptide in two parts:
Section
Sequence
Leader
MSDITLTPMDLLDLDELAAGGGRSTARE
Core
GNWHEPEIDGWNPHGW
An enzyme cleaves the core away from the leader to produce the active peptide.
Different species use different codons preferentially, and have abundant matching tRNAs for those codons. RES-701-3 comes from Streptomyces, which strongly prefers codons rich in G and C. Twist offers a Streptomyces coelicolor codon optimization profile.
It’s also worth noting that Shihoya et al. (2025) used Streptomyces venezuelae and reported the highest yields to date. In a real drug development setting, that organism might be a better choice.
The codon-optimized variant for the leader and core together:
A Shine–Dalgarno (SD) sequence, AAGGAG, is a good RBS for Streptomyces with leader peptides. It is positioned 6 to 10 nucleotides upstream of the start codon, so we use a 7-nucleotide spacer downstream and add CGACG upstream:
CGACGAAGGAGACAC
Start codon
The standard ATG.
Coding sequence
Both the leader and core peptide sequences in tandem.
His tag
A short stretch of six histidines that lets you fish the protein out of a mixture using a nickel column. In practice, a His tag is not a great choice for RES-701-3, because it would interfere with binding to the ETB receptor.
CACCACCACCACCACCAC
Stop codon
TGA is the preferred stop codon in Streptomyces because it is GC-rich, matching the organism’s overall DNA composition. (For comparison, the typical stop codon in many organisms is TAA.)
Terminator
The fd terminator from a bacteriophage, commonly used in Streptomyces expression vectors.
GGATCCAAACTCGAGTAAGGATCTCCAGGCATCAAATAAAACGAAAGGC
Reagents
To produce the mature peptide we also need three biosynthetic enzymes: LasB1, LasB2, and LasC. LasB1 binds the leader and delivers the precursor to LasB2, which cuts the leader off; LasC then closes the lasso ring on the core. These enzymes are not easy to order, and the highest-yield expression host (S. venezuelae) is also less common, so RES-701-3 is probably not the most practical target for class.
Twist DNA Synthesis Order
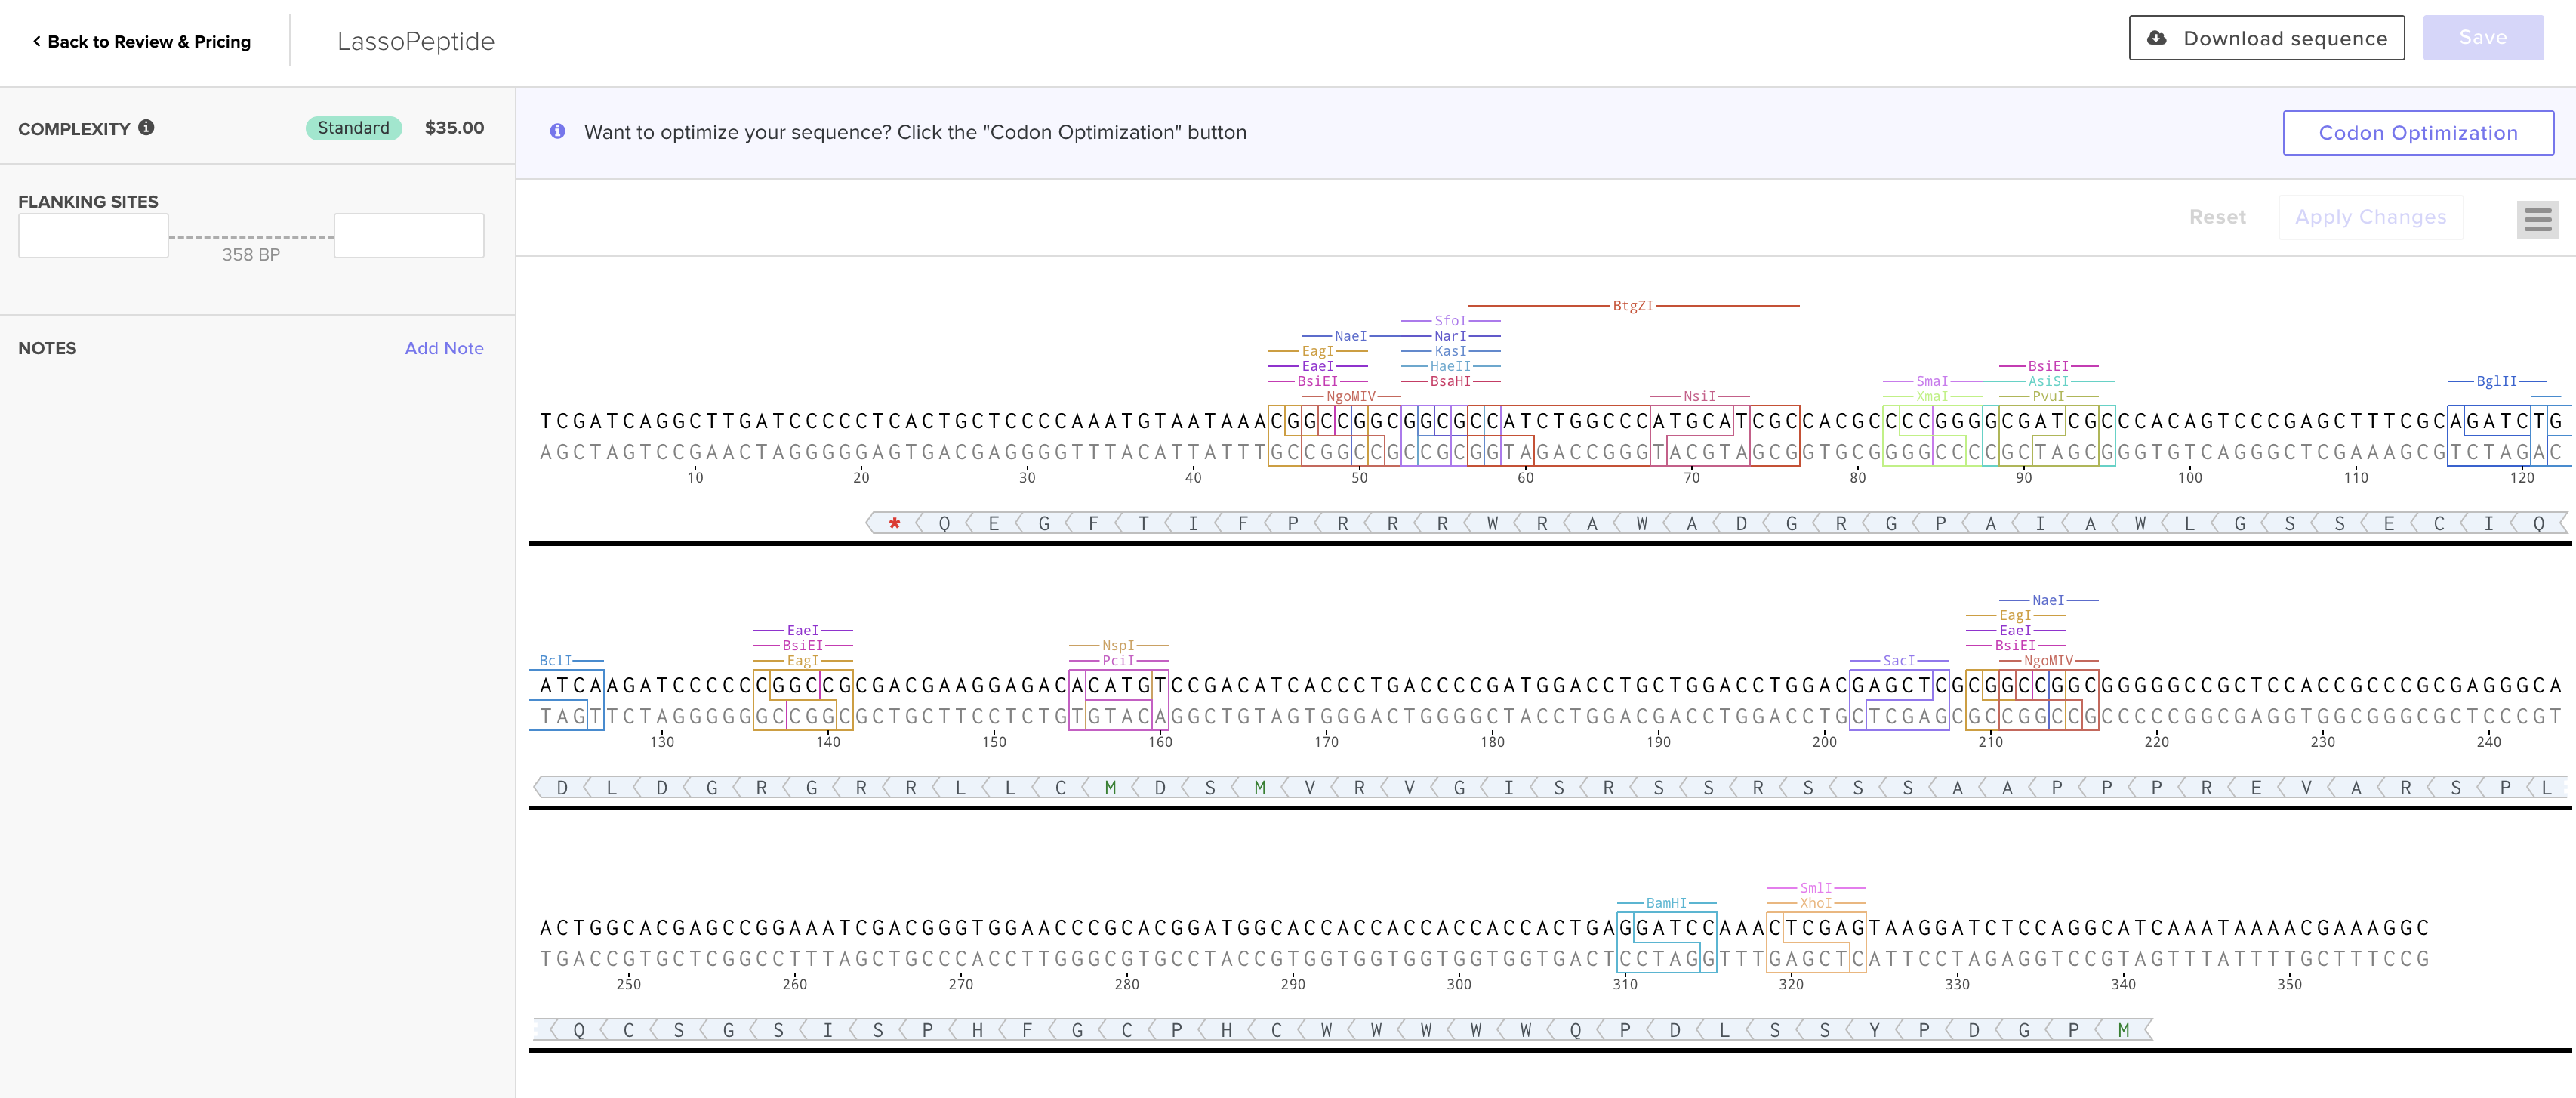
The lasso peptide order has been prepared. Below is the expression cassette in Benchling.
I used gene fragments rather than a clonal gene because the standard cloning vectors are designed for E. coli, not Streptomyces.
DNA Read / Write / Edit
5.1 DNA Read
What DNA would you sequence, and why?
I would sequence the whole genomes of all ~6,000 mammalian species. The largest current collection is the Zoonomia project, with around 250 whole genomes plus maximum-lifespan data for most of those species. Expanding this to cover all mammals, paired with their lifespan records, would let us train models that identify DNA patterns predictive of how long a species can live. More genomes means better predictions about which parts of DNA are linked to longevity.
What sequencing technology, and why?
Illumina short-read sequencing (second generation). It produces highly accurate short reads (~150–300 bp) and is well suited to spotting small genetic differences between species.
Generation
Second generation. First-generation Sanger sequencing reads one fragment at a time and is too slow and expensive for whole genomes. Second-generation methods sequence millions of short fragments in parallel, which is fast and cheap.
Input and preparation
The input is genomic DNA extracted from tissue or blood samples. Essential preparation steps:
DNA extraction. Isolate high-quality DNA from the biological sample.
Fragmentation. Break the DNA into smaller pieces.
Adapter ligation. Attach short known sequences to the ends of each fragment so the sequencer can recognize and process them.
PCR amplification. Make many copies of each fragment to boost the signal.
Quality check. Verify the library is the right size and concentration before loading onto the sequencer.
Essential steps and base calling
Fragmented DNA is bound to a glass flow cell, amplified into clusters, and sequenced one base at a time. In each cycle, a fluorescently labeled nucleotide is added; a camera captures which color fires at each cluster (each of the four bases has a different color), and the machine records the base. The process repeats hundreds of times to read out each fragment.
Output
Digital sequence files (typically FASTQ) containing millions of reads of A, T, C, and G along with quality scores indicating the confidence of each base call. These reads are assembled and aligned computationally to reconstruct each species’ genome.
5.2 DNA Write
What would you synthesize, and why?
I would use the trained models from the sequencing analysis to predict specific DNA sequences associated with high maximum lifespan, then synthesize those predicted longevity-linked sequences (specific gene variants or regulatory elements found in long-lived species like bowhead whales or naked mole-rats) so they can be tested in cell cultures or animal models. The goal is to move from computational prediction to experimental validation: do these DNA sequences actually promote cellular health and longevity?
Technology choices
Oligonucleotide synthesis (Twist Bioscience): for short to medium DNA fragments (up to a few thousand base pairs). Chemical synthesis on microchips runs many sequences in parallel, making it fast and affordable.
Gibson Assembly or Golden Gate Assembly: for stitching shorter synthesized fragments into larger constructs using enzymes that join DNA pieces seamlessly.
Essential steps
Sequence design. Use computational models to design target sequences, optimizing codon usage for the target organism and avoiding problematic features (long repeats, extreme GC content).
Oligonucleotide synthesis. Short single-stranded DNA pieces (oligos, ~50–200 bases) are built base by base on a solid support. Each cycle adds one nucleotide.
Assembly. Overlapping oligos are combined and joined enzymatically into longer double-stranded fragments (a few hundred to a few thousand bp).
Cloning. The assembled fragments are inserted into a circular DNA carrier (plasmid vector) and introduced into bacteria, which copy the DNA as they grow.
Verification. The final constructs are sequenced to confirm they are correct.
Large construct assembly. Verified fragments are stitched together using Gibson or Golden Gate assembly to create larger constructs.
Limitations
Speed. Synthesizing and assembling long constructs (>10 kb) can take weeks.
Accuracy. Chemical synthesis introduces errors at roughly 1 in 200 bases per oligo. Errors are corrected through screening and verification, but this adds time and cost.
Scalability. Very long or repetitive sequences are hard to synthesize; oligos may misassemble or fold in unwanted ways. Sequences with extreme GC content are also harder to build reliably.
5.3 DNA Edit
What would you edit, and why?
I would edit specific genes in model organisms (such as mice) to replace native sequences with the longevity-associated variants identified above. For example, if the model predicts that a particular DNA-repair gene variant is linked to longer lifespan in mammals, I would edit a mouse to carry that variant and test whether swapping in these “long-life” variants extends lifespan or improves age-related outcomes like cancer resistance or cellular repair.
Technology choice
CRISPR-Cas9. It is the most precise, versatile, and widely used genome-editing tool available. It works at specific genomic locations in living cells and organisms, including mammalian systems like mice.
Essential steps
Target selection. Identify the exact genomic location to edit.
Guide RNA design. Design a short RNA matching the target site.
Cutting. Cas9, guided by the RNA, binds the matching DNA site and creates a double-strand break.
Repair. The cell’s repair machinery fixes the break. If a DNA template carrying the desired sequence is provided, the cell can use it as a blueprint via homology-directed repair.
Screening. Edited cells are sequenced to confirm the desired change.
Inputs
Category
Components
Design
Target DNA sequence, custom guide RNA, donor template DNA flanked by sequences matching the cut site.
Molecular
Cas9 protein or mRNA, synthesized guide RNA, donor template DNA, delivery reagents.
Biological
Target mouse cells.
Limitations
Off-target edits. The guide RNA can bind similar sites elsewhere, causing unintended cuts.
Low HDR efficiency. Only a fraction of edited cells carry the precise desired change, requiring extensive screening.
Delivery. Getting CRISPR components into every target cell efficiently, especially in living animals, is still difficult, and some tissues are harder to reach than others.
Week 3 HW: Lab Automation
My Opentrons designs, post-lab questions, and three early-stage project ideas all live in the Week 3 lab writeup.
Week 4 HW: Protein Design
Part A: Conceptual Questions
Why do beta-sheets tend to aggregate?
A beta-strand forms when a protein’s backbone (the repeating NH–Cα–CO chain shared by every amino acid) stretches into a nearly flat zigzag. When two or more strands line up next to each other and link through hydrogen bonds (an N–H on one strand pairs with a C=O on the neighbor), you get a beta-sheet.
The strands on the outer edges still have a full row of exposed N–H and C=O groups, which lets another strand dock and extend the sheet, and so on. That is the structural reason beta-sheets are prone to aggregation.
What forces pull sheets together?
Hydrophobic effect (the biggest driver). In a beta-strand, side chains stick out alternately above and below the sheet. Many side chains are hydrophobic, so two sheets stack with their greasy faces inward.
Hydrogen bonding (gives the structure regularity). Each strand that joins the sheet edge contributes roughly one H-bond per residue. Individually, H-bonds in water are not enormously strong (breaking one with a neighbor just lets you form one with water instead), but across a strand of ten or more residues they add up meaningfully.
Van der Waals packing (stabilizes stacked sheets). These forces are weaker and shorter-range, arising from temporary, fluctuating dipoles.
Part B: Protein Analysis and Design
Briefly describe the protein you selected and why you selected it.
I chose a monoclonal antibody for several reasons:
It can target specific proteins on cell surfaces with extreme precision, directly applicable to therapeutics.
It can recruit the immune system (via its Fc region) to destroy tagged cells, combining specificity with immune effector functions.
It can be engineered with ML and computational methods for improved binding affinity and reduced immunogenicity.
It is highly specific to its target with fewer off-target effects compared to small-molecule drugs.
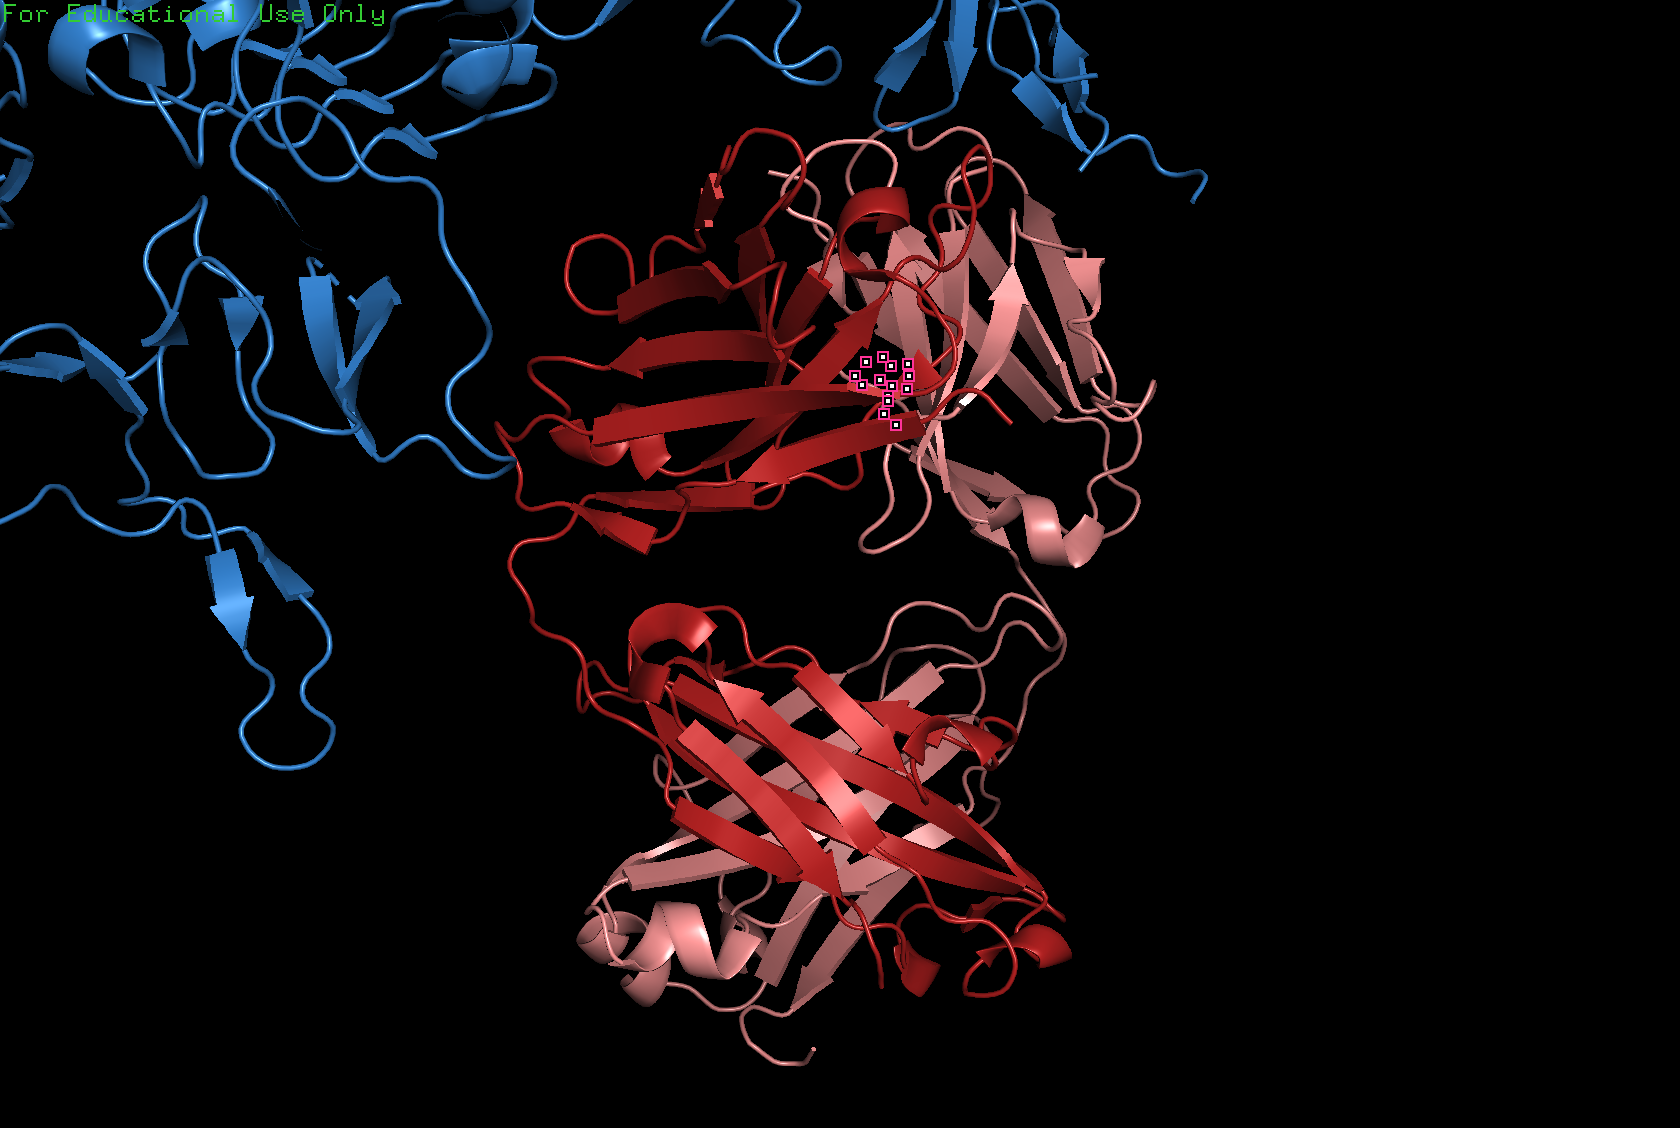
For this exercise I selected trastuzumab, famous for revolutionizing the treatment of HER2-positive breast cancer. It is a humanized IgG1 monoclonal antibody that binds the extracellular domain IV of HER2 (human epidermal growth factor receptor 2), blocking receptor dimerization and the downstream signaling that drives tumor growth.
How long is it? What is the most frequent amino acid?
The full trastuzumab IgG has two heavy chains (449 aa each) and two light chains (214 aa each), for a total of ~1,326 amino acids and ~148 kDa.
The crystal structure (PDB: 1N8Z) contains only the Fab fragment (the antigen-binding portion):
How many protein sequence homologs are there for your protein?
Because trastuzumab is a humanized antibody with conserved IgG1 framework regions, BLAST returns a very large number of homologs (antibodies share roughly 70–90% identity in their framework regions). A BLAST search of the heavy chain Fab against UniProt returns over 250 homologs. The variable CDR (complementarity-determining region) loops are what give trastuzumab its HER2 specificity.
When was the structure solved? Is it a good quality structure?
Good quality means good resolution. Smaller is better; the benchmark is 2.70 Å.
2.52 Å (good quality, better than the 2.70 Å benchmark)
Are there any other molecules in the solved structure apart from protein?
Yes. In addition to the three unique protein chains (light chain A, heavy chain B, HER2 extracellular domain C), the structure contains:
Molecule
Description
Copies
NAG
2-acetamido-2-deoxy-β-D-glucopyranose (N-linked glycosylation sugar attached to HER2)
2
SO4
Sulfate ion
1
Does your protein belong to any structure classification family?
Yes. The overall complex is classified in the PDB under TRANSFERASE. The trastuzumab Fab itself belongs to the Immunoglobulin superfamily.
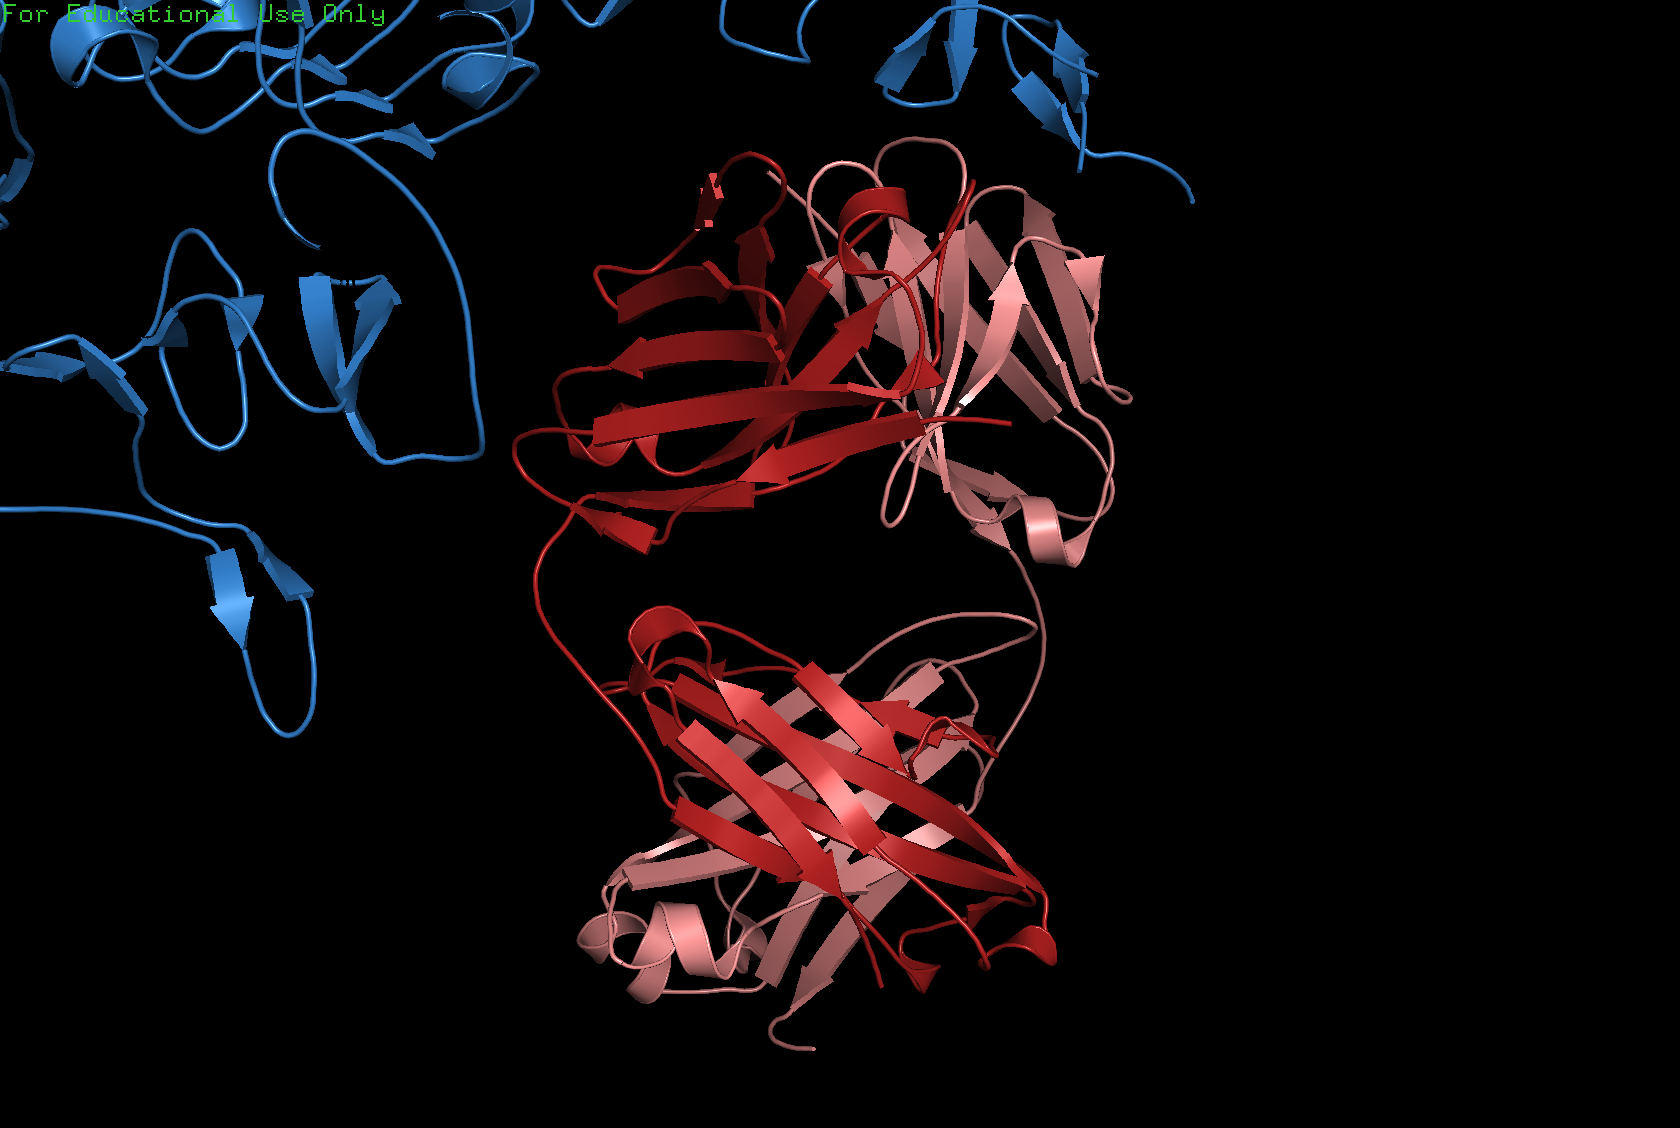
Visualize the protein as cartoon, ribbon, and ball-and-stick.
Cartoon
Ribbon
Ball and stick
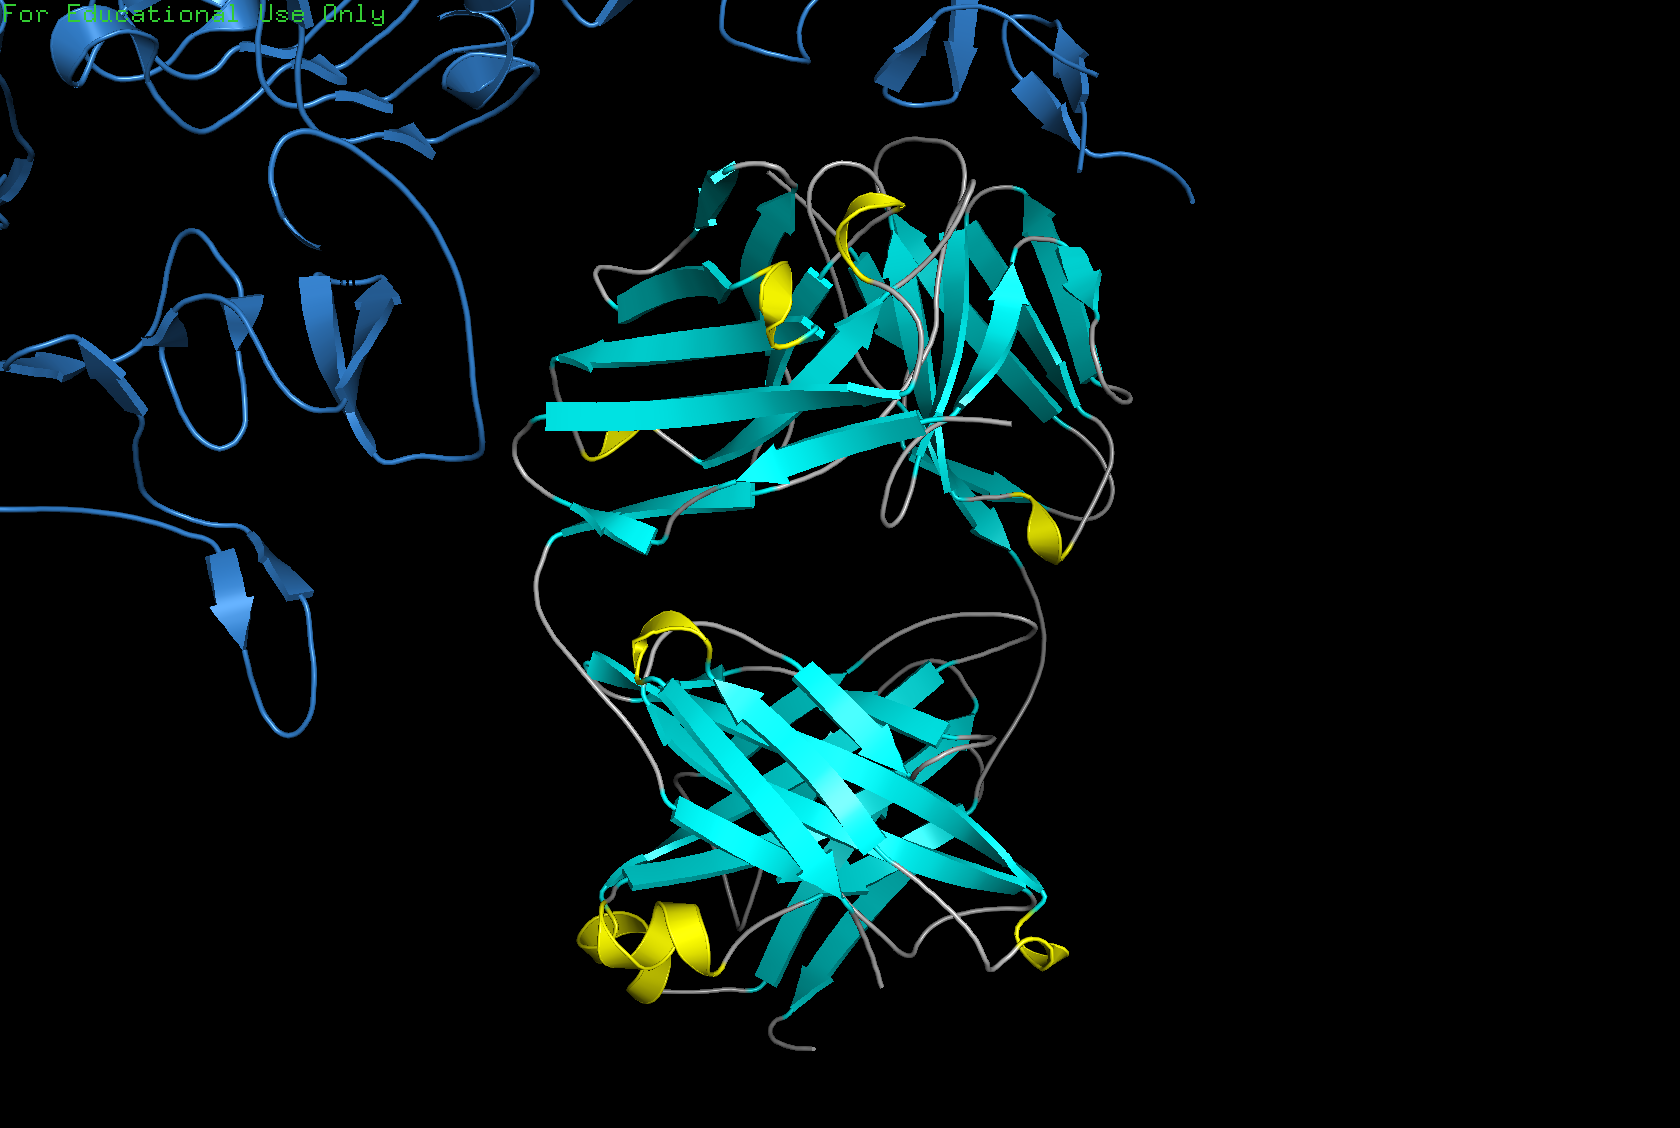
Color the protein by secondary structure. Does it have more helices or sheets?
The structure has more sheets than helices: 215 atoms in sheets vs. 30 atoms in helices.
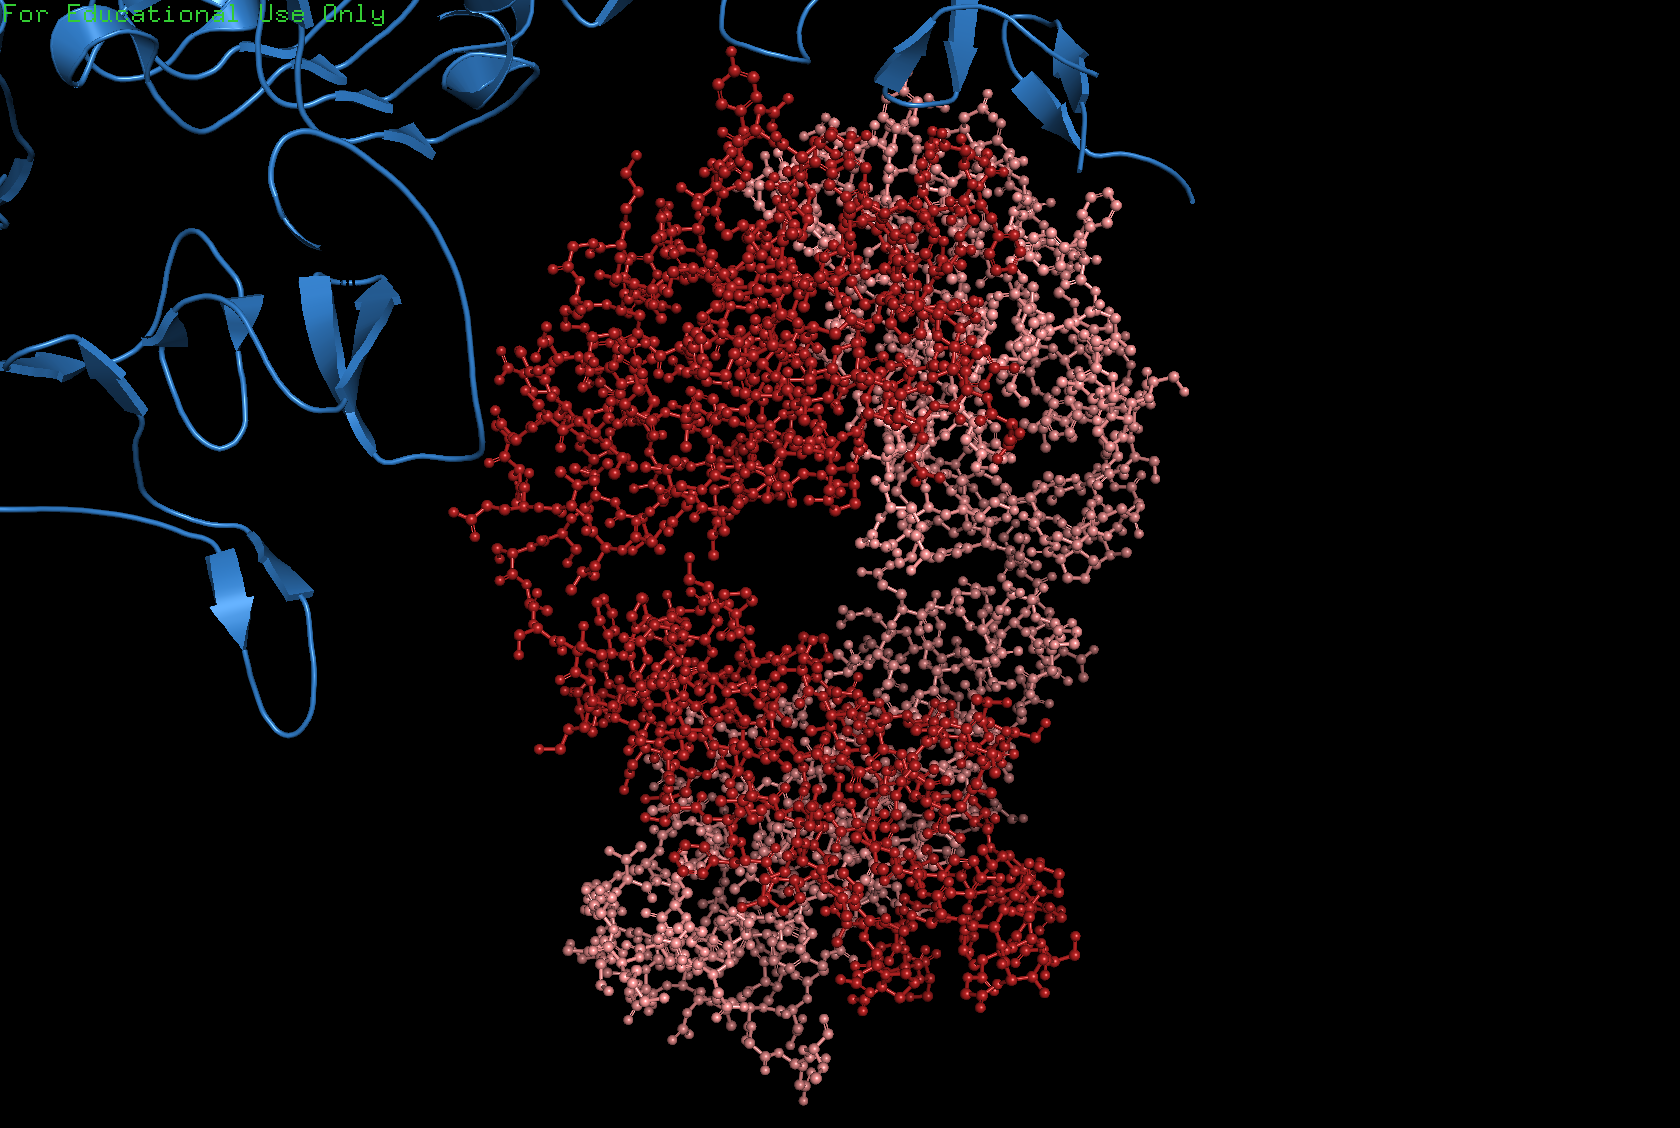
Color the protein by residue type. What can you tell about the distribution of hydrophobic vs. hydrophilic residues?
Generally, proteins have a hydrophobic core and a hydrophilic surface, and trastuzumab follows this pattern. The immunoglobulin fold is a beta sandwich where:
Hydrophobic residues (orange) point inward.
Hydrophilic residues (blue) point outward.
This is hard to see in the visualization because the inward and outward surfaces are not so distinct. The CDR loops, which are the tips that contact HER2, are mixed: aromatic hydrophobics (Trp, Tyr) provide shape complementarity, while polar and charged residues form hydrogen bonds and salt bridges with the antigen.
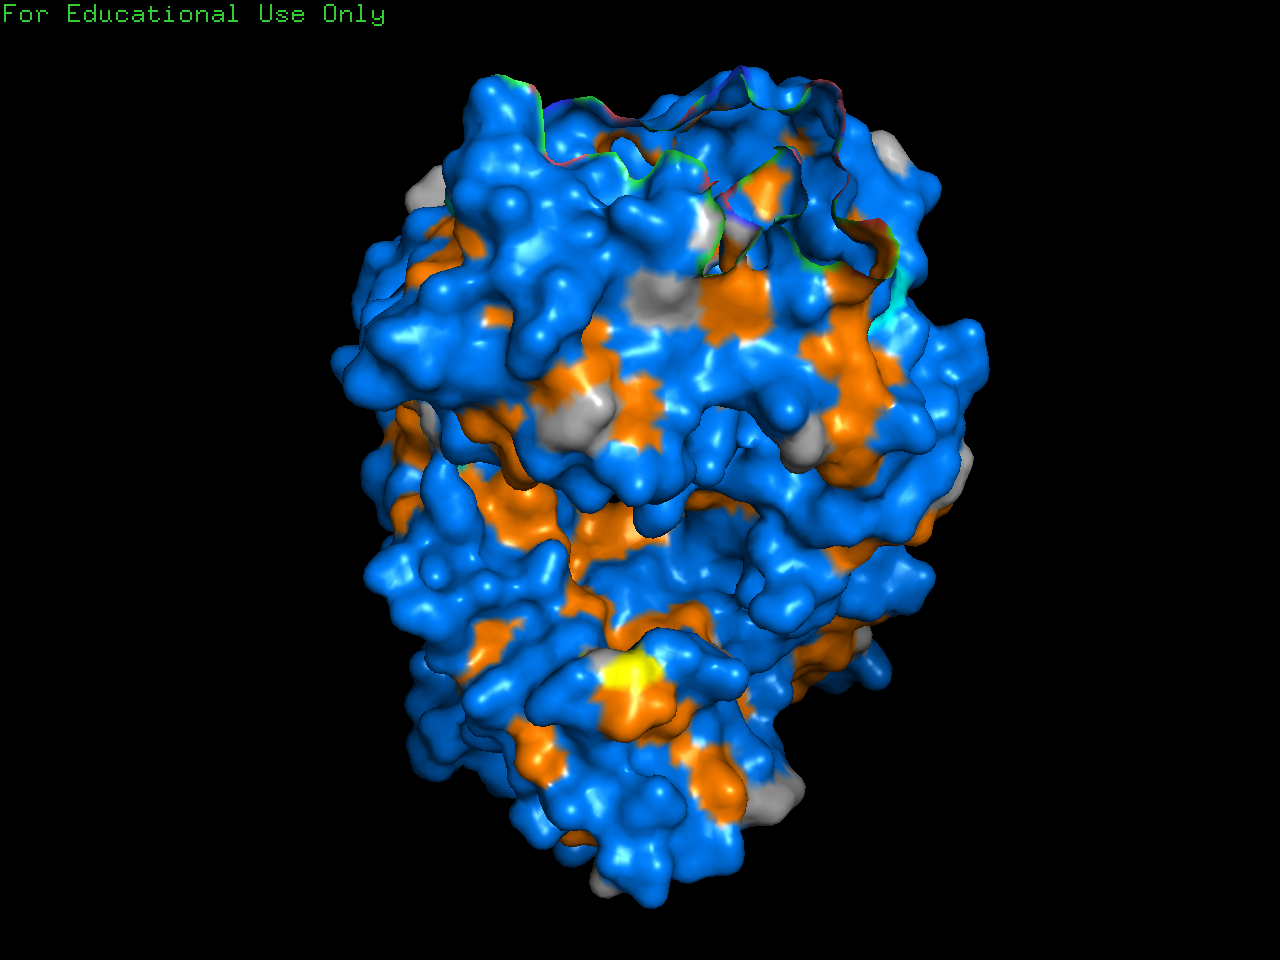
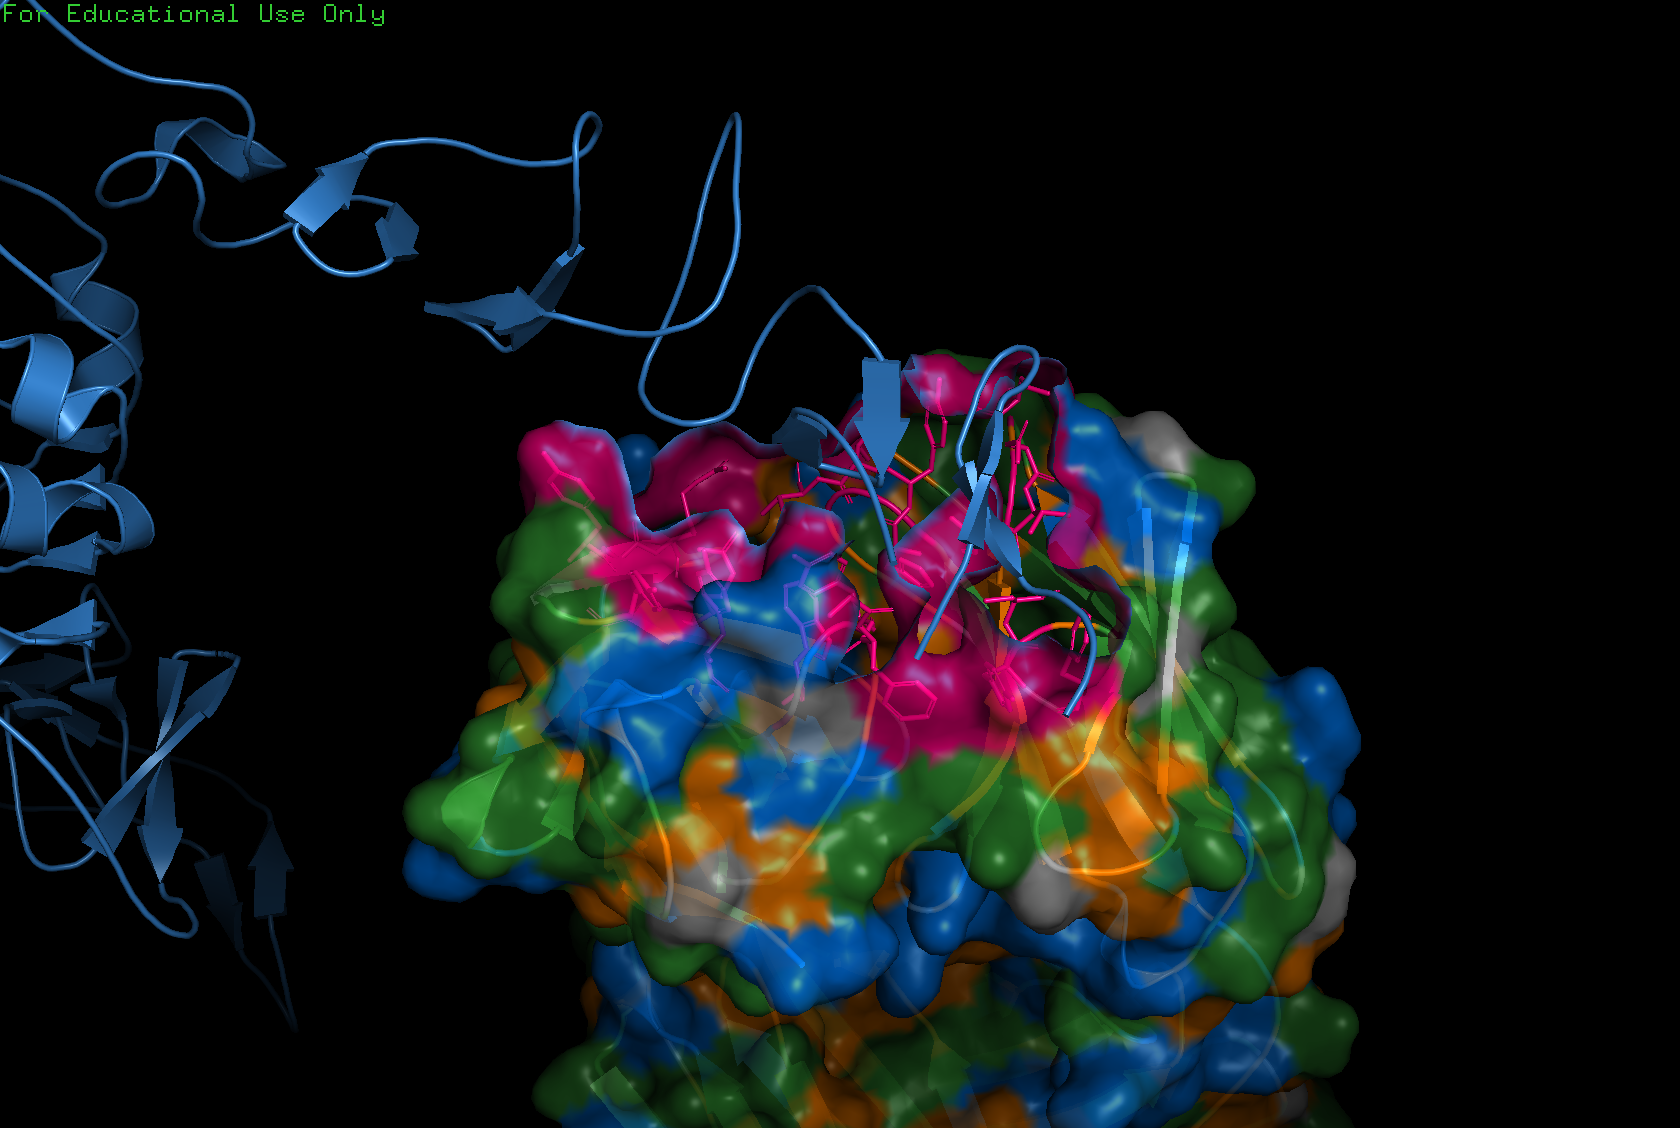
Visualize the surface of the protein. Does it have any holes (binding pockets)?
Yes, binding pockets are visible on the surface.
Part C: ML-Based Protein Design Tools
For this exercise I chose 6M0J, the SARS-CoV-2 Spike Receptor Binding Domain.
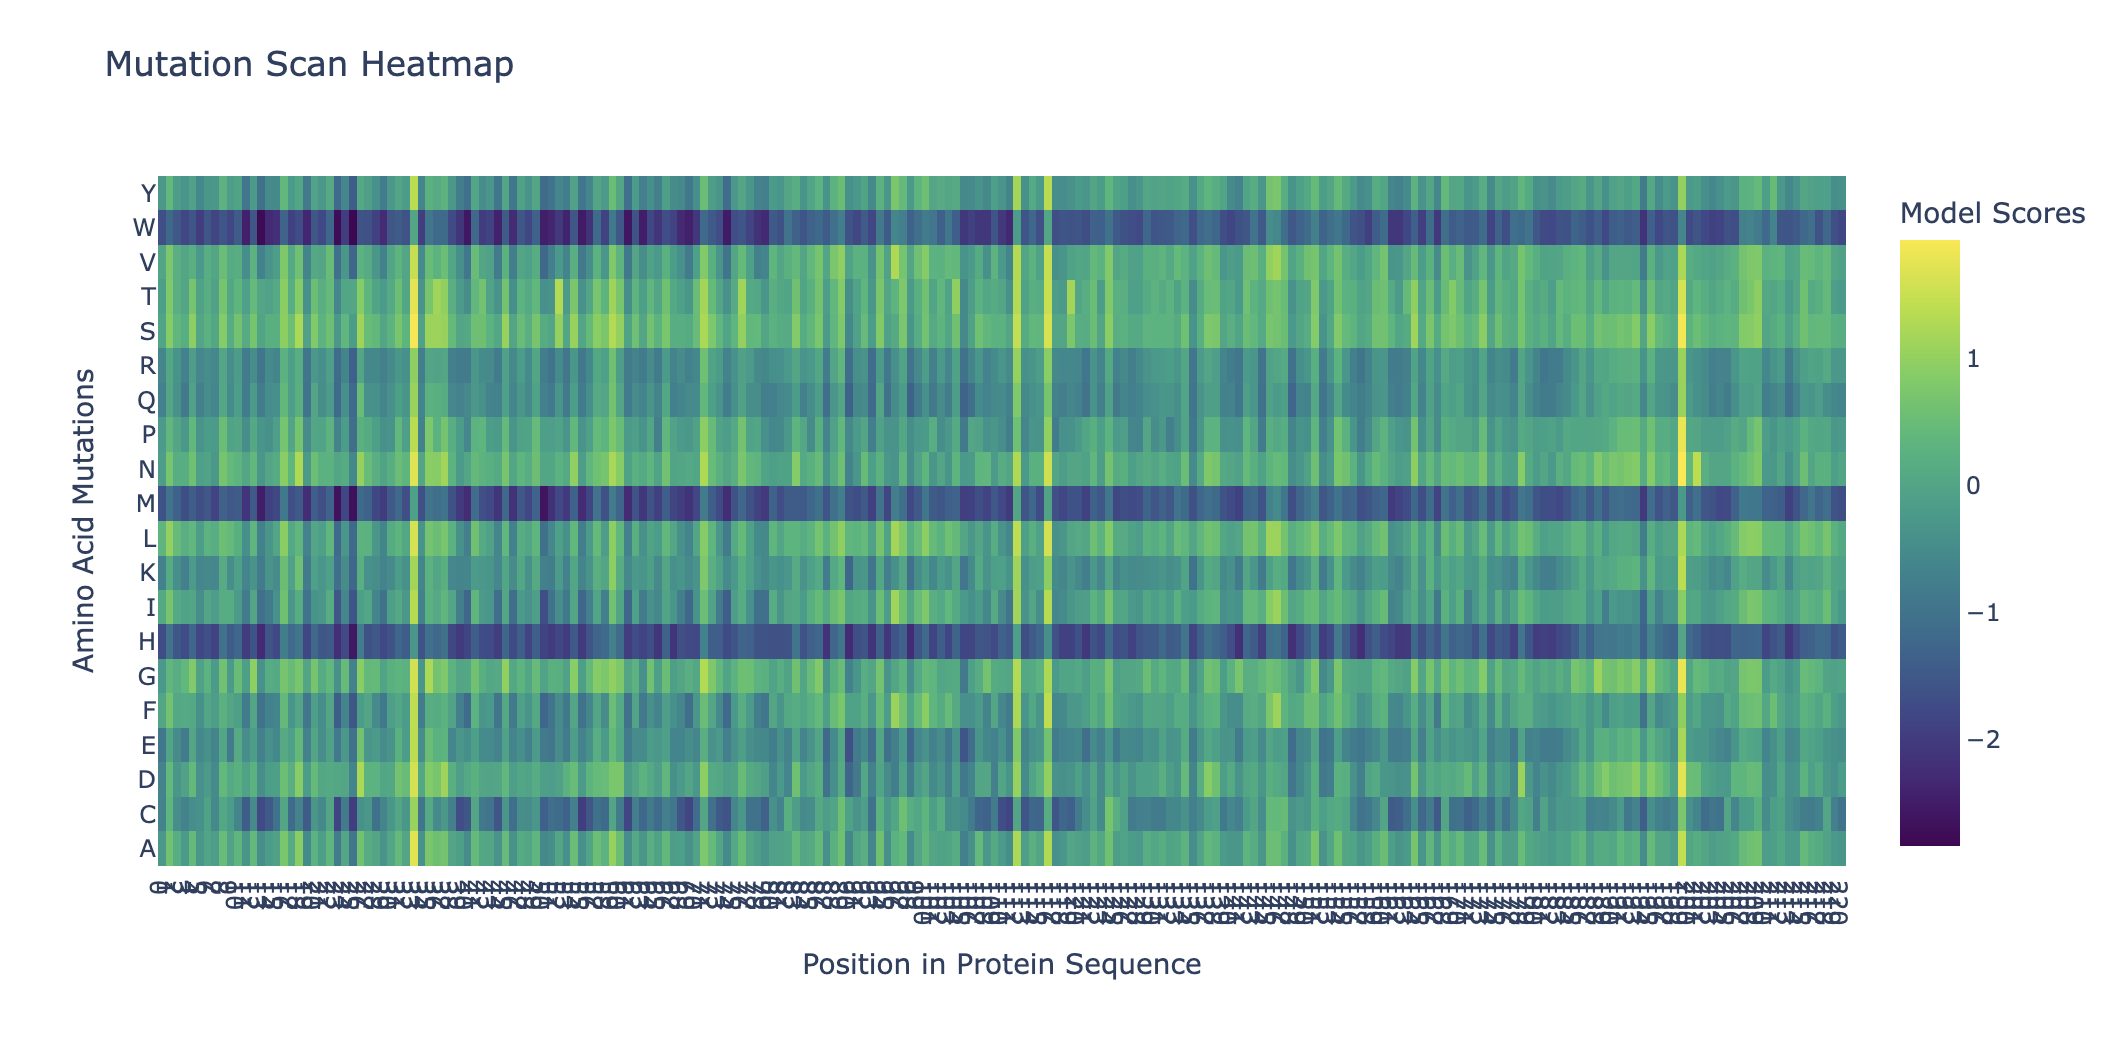
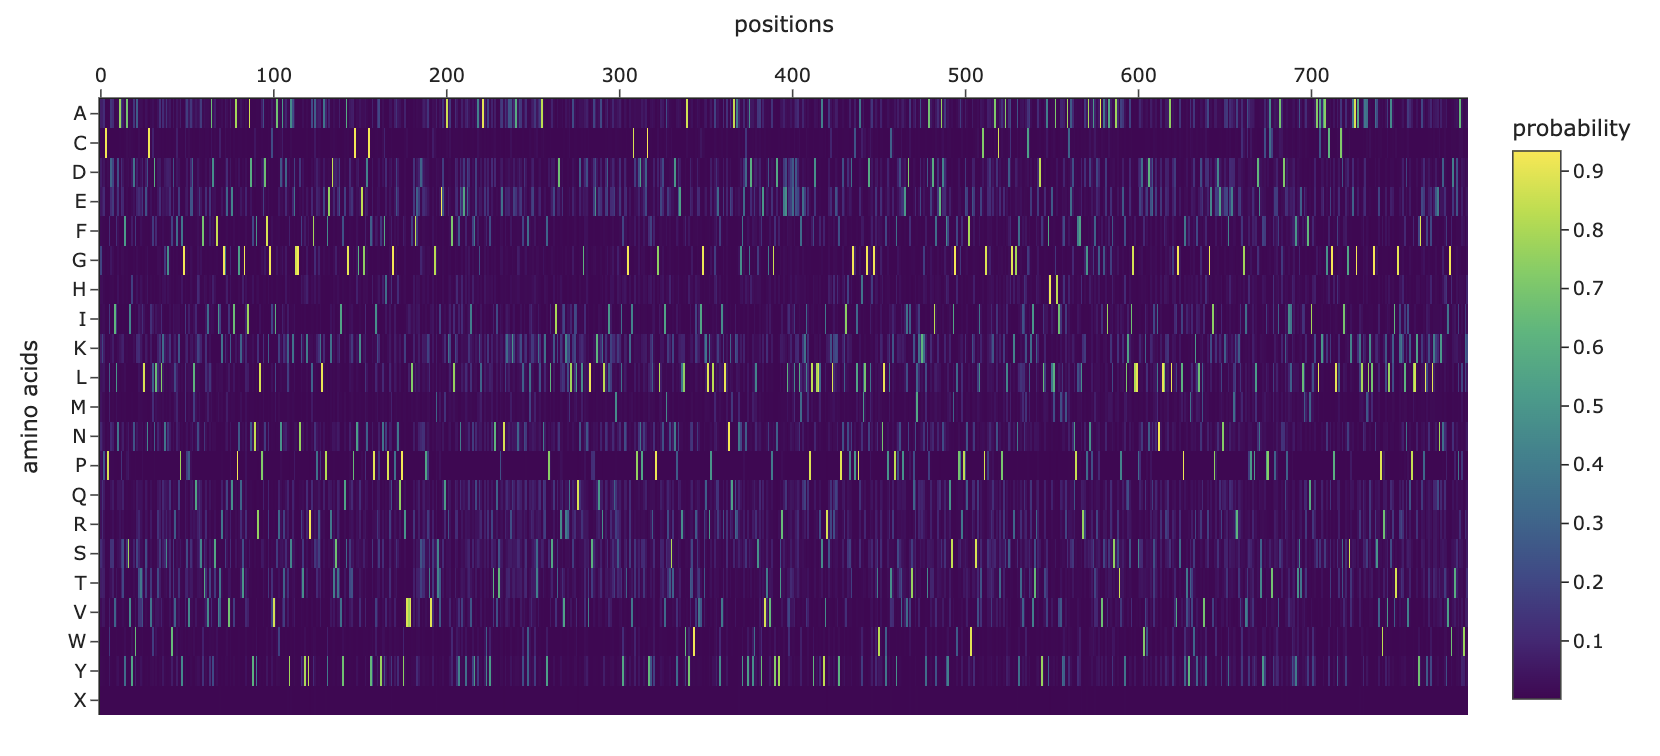
Deep Mutational Scans
Can you explain any particular pattern?
Horizontal patterns (rows): the rows for tryptophan (W), histidine (H), and methionine (M) are consistently darker across nearly all positions. These are large, bulky, or chemically complex amino acids that are difficult to accommodate at arbitrary positions without disrupting the fold. Small, simple amino acids like alanine or serine are more easily tolerated, so their rows appear lighter.
Vertical patterns (columns): the most striking pattern is the dark purple stripes at specific positions. These correspond to cysteine residues, which form the disulfide bonds that hold the shape together so it can bind the human ACE2 receptor. Because ESM2 learned from millions of sequences that these cysteines are almost never substituted in nature, it heavily penalizes any mutation at those positions. The darkest scores appear when cysteine is mutated to something like tryptophan or proline, which would not only break the disulfide bond but also create additional structural problems.
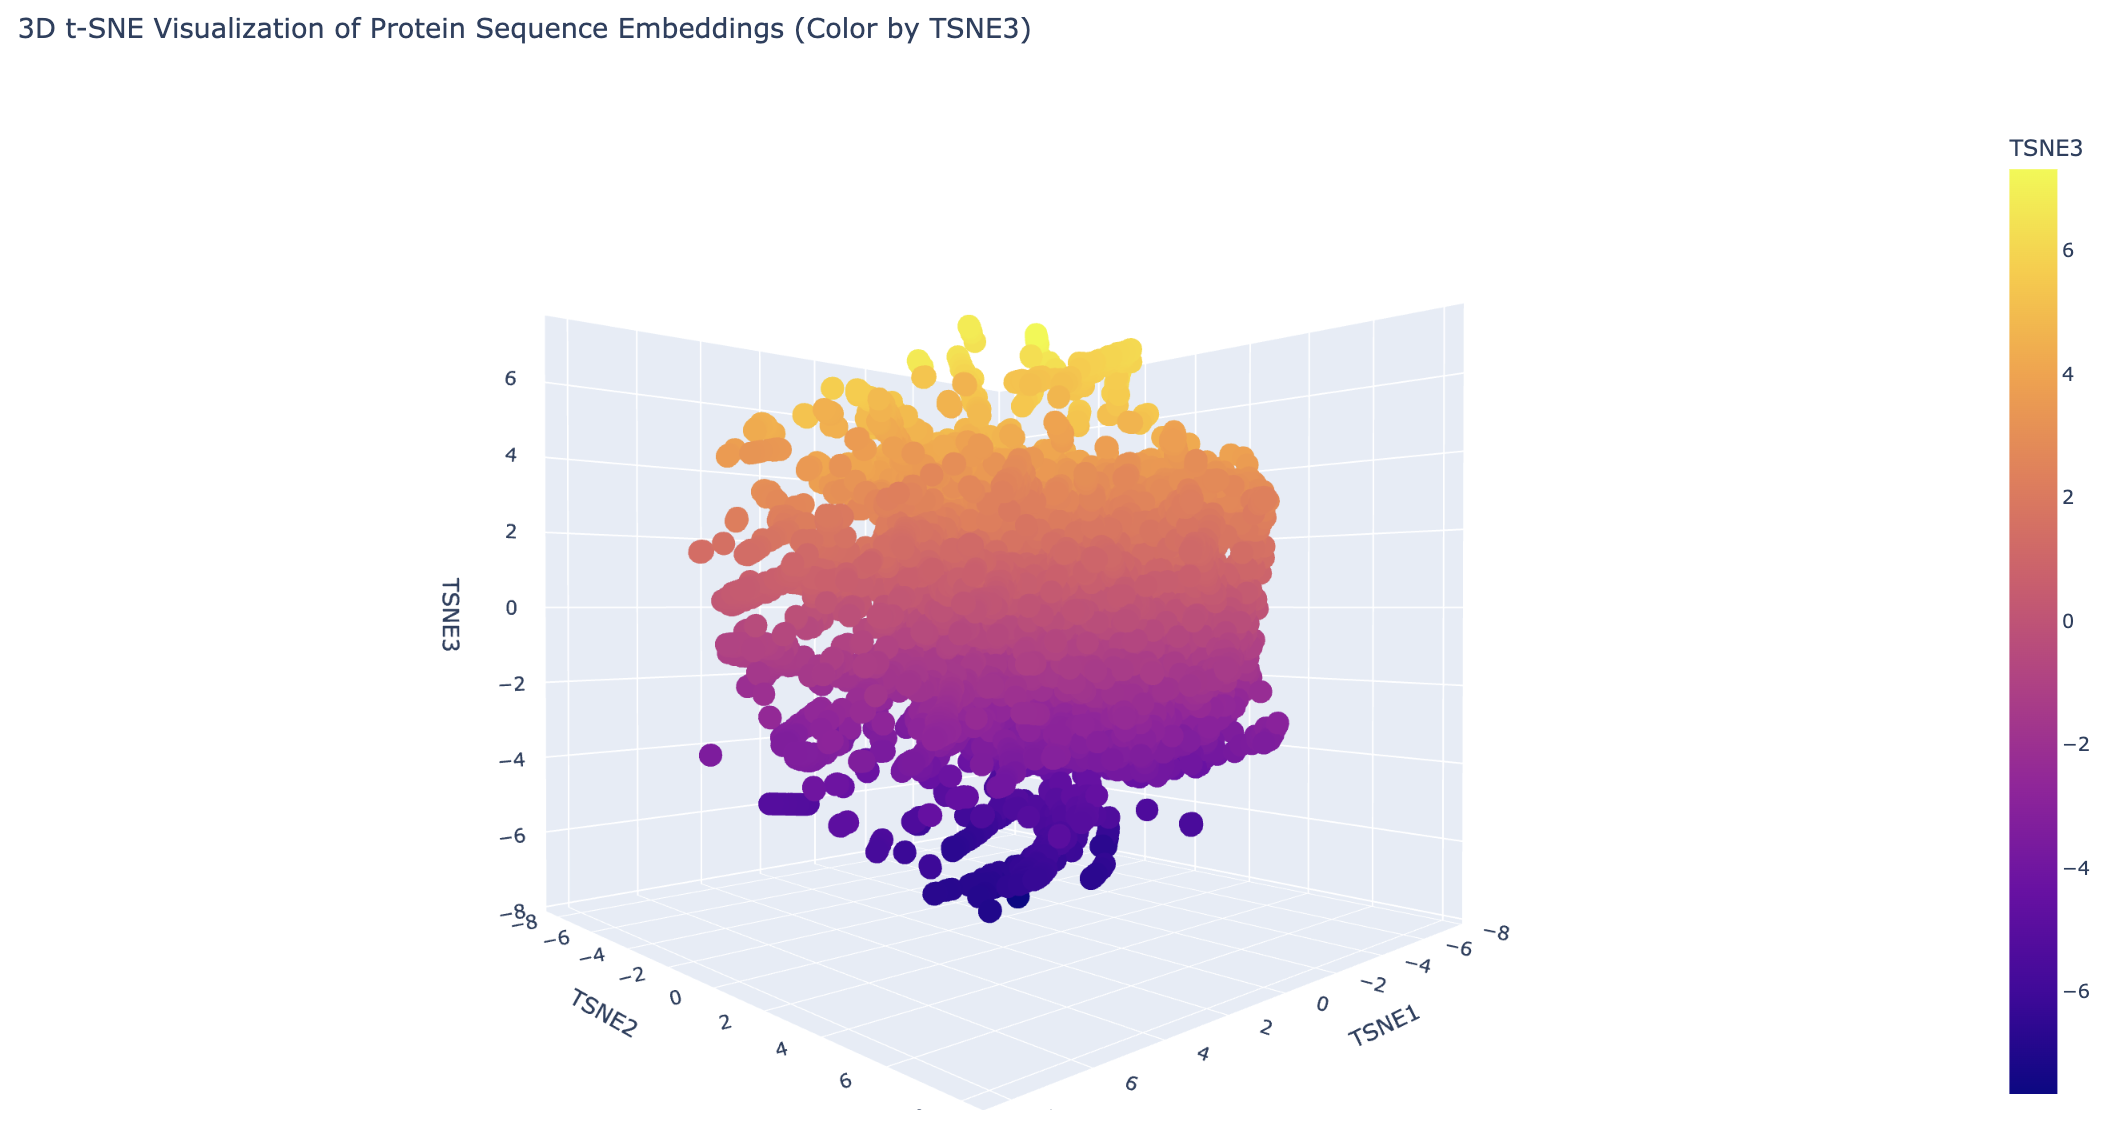
Latent Space Analysis
Do the formed neighborhoods approximate similar proteins?
Generally the proteins are clustered tightly. There are a few distinct clusters on the edges, which likely share a common evolutionary ancestor.
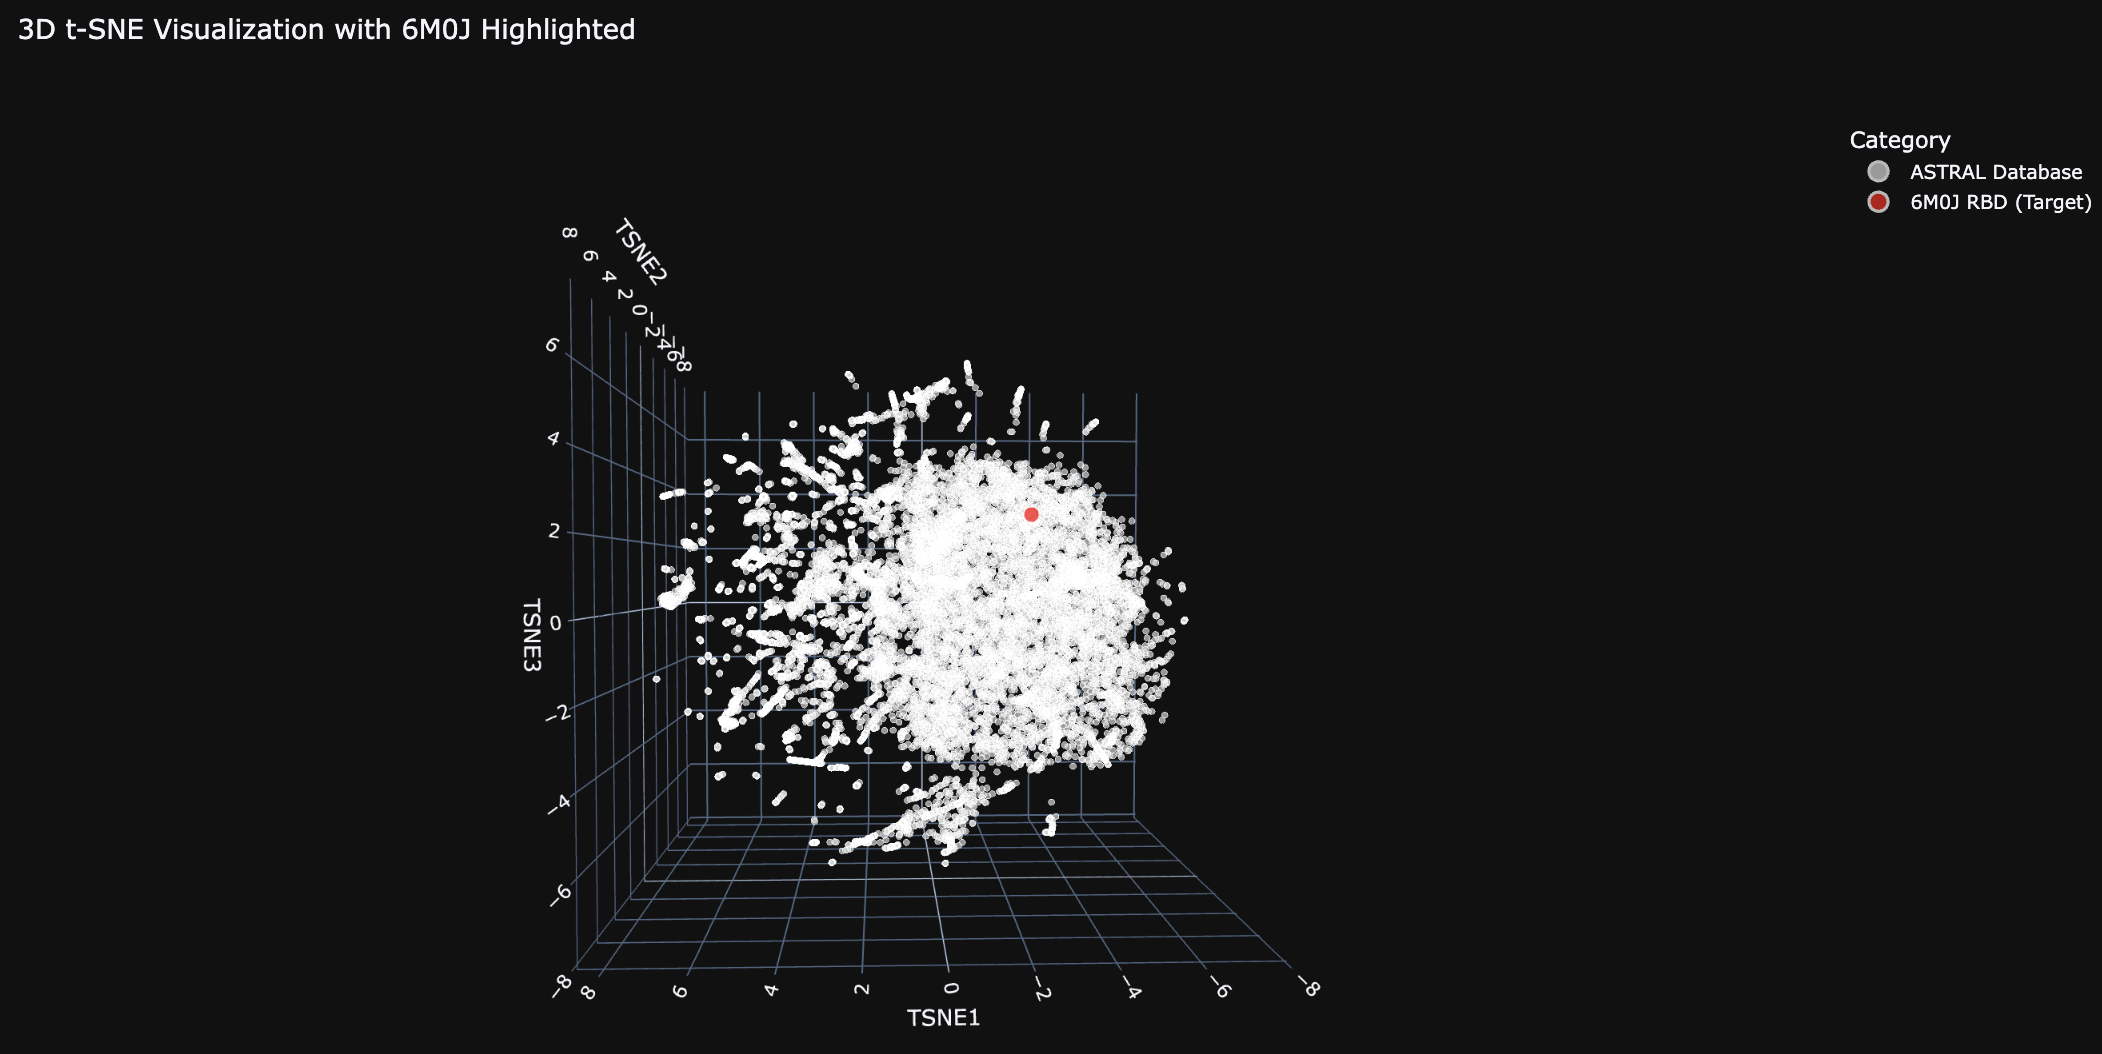
Place your protein in the resulting map.
The 6M0J protein falls within the main cluster.
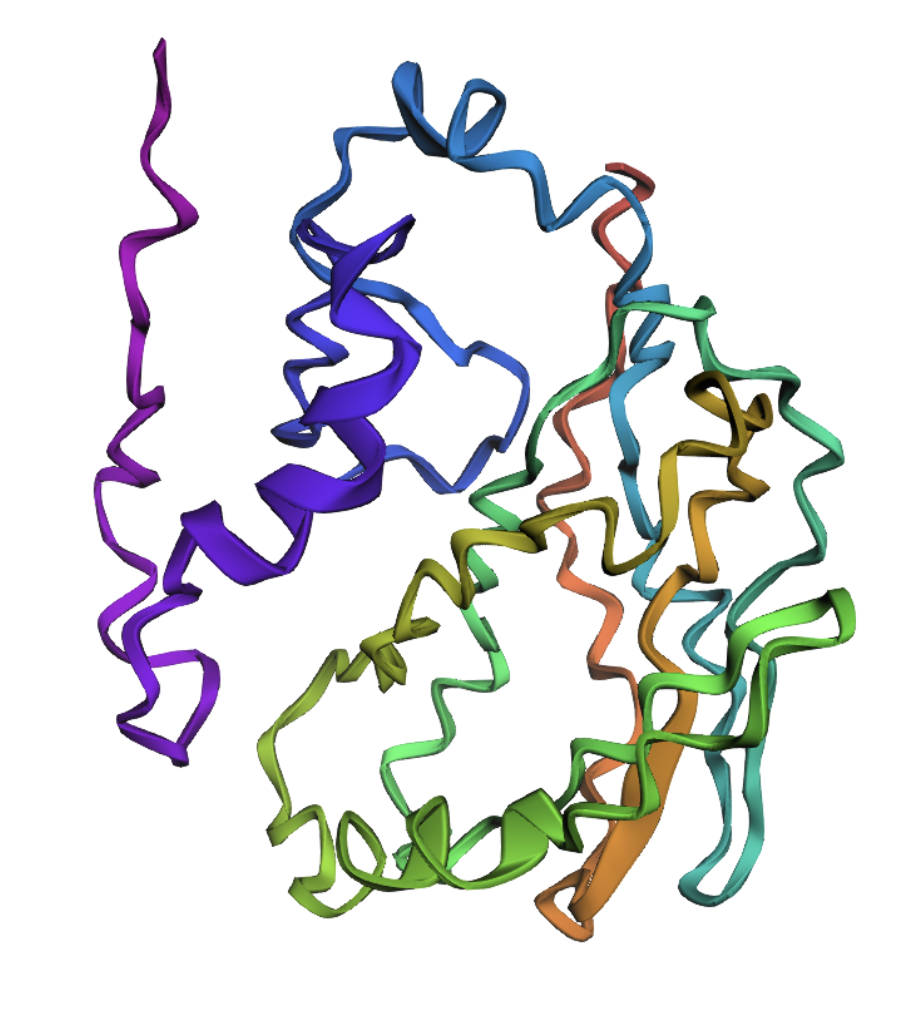
Folding a Protein
Fold your protein with ESMFold. Do the predicted coordinates match your original structure?
Metric
Score
Interpretation
pLDDT (local confidence, 0–100)
25.516
Low. Local structure unlikely to match the true structure.
pTM (global fold confidence, 0–1)
0.129
Low. Global topology prediction unreliable.
This is likely because the 6M0J viral protein is normally part of a much larger Spike protein complex. The SARS-CoV-2 Spike RBD is unstable on its own.
Try changing the sequence. Is your protein structure resilient to mutations?
The original protein is not very resilient given its poor pLDDT and pTM scores. After redesign with ProteinMPNN, the structure became much more stable:
Metric
Original
After ProteinMPNN
pLDDT
25.516
92.095
pTM
0.129
0.881
Note: while the structural metrics improved dramatically, the redesigned protein could be functionally incorrect. Stability does not guarantee biological activity.
Inverse Folding
Compare the predicted sequence vs. the original.
Roughly half of the original amino acids were preserved. This is typical for ProteinMPNN, which optimizes the sequence for the target backbone rather than mimicking the native sequence.
Metric
Original
ProteinMPNN
Energy score
1.3747
0.8107
In ProteinMPNN, a lower score suggests the new sequence is potentially more stable or a better fit for the target backbone. This matches the pLDDT and pTM improvements above.
Input this sequence into ESMFold and compare to your original.
As noted above, the predicted structure after ProteinMPNN has higher pLDDT and pTM than the original.
Bacteriophage Engineering
For this exercise I worked with Alayah Hines and Terry Luo.
Computational Engineering of the MS2 Lysis Protein (L)
The MS2 L protein is a 75-amino-acid polypeptide that lyses E. coli by an incompletely understood mechanism. Its C-terminal transmembrane (TM) domain inserts into the cytoplasmic membrane and oligomerizes, depolarizing the membrane and triggering host autolytic enzymes to degrade the murein layer. Recessive, conservative missense mutations clustered around a conserved LS dipeptide strongly imply that L engages an unidentified host protein target rather than simply disrupting the bilayer. The dispensable N-terminal domain binds the chaperone DnaJ (with solved PDB structures), modulating lysis timing; removing it causes lysis ~20 minutes earlier. No experimental structure of L exists.
Goals:
Stabilize L for more robust membrane accumulation.
Accelerate lysis by bypassing DnaJ-dependent regulatory timing and improving delivery of functional L to the membrane.
Because the downstream lytic target is unknown, we do not attempt to enhance per-molecule toxicity at the point of target engagement. We focus on removing regulatory brakes and increasing the supply of functional protein.
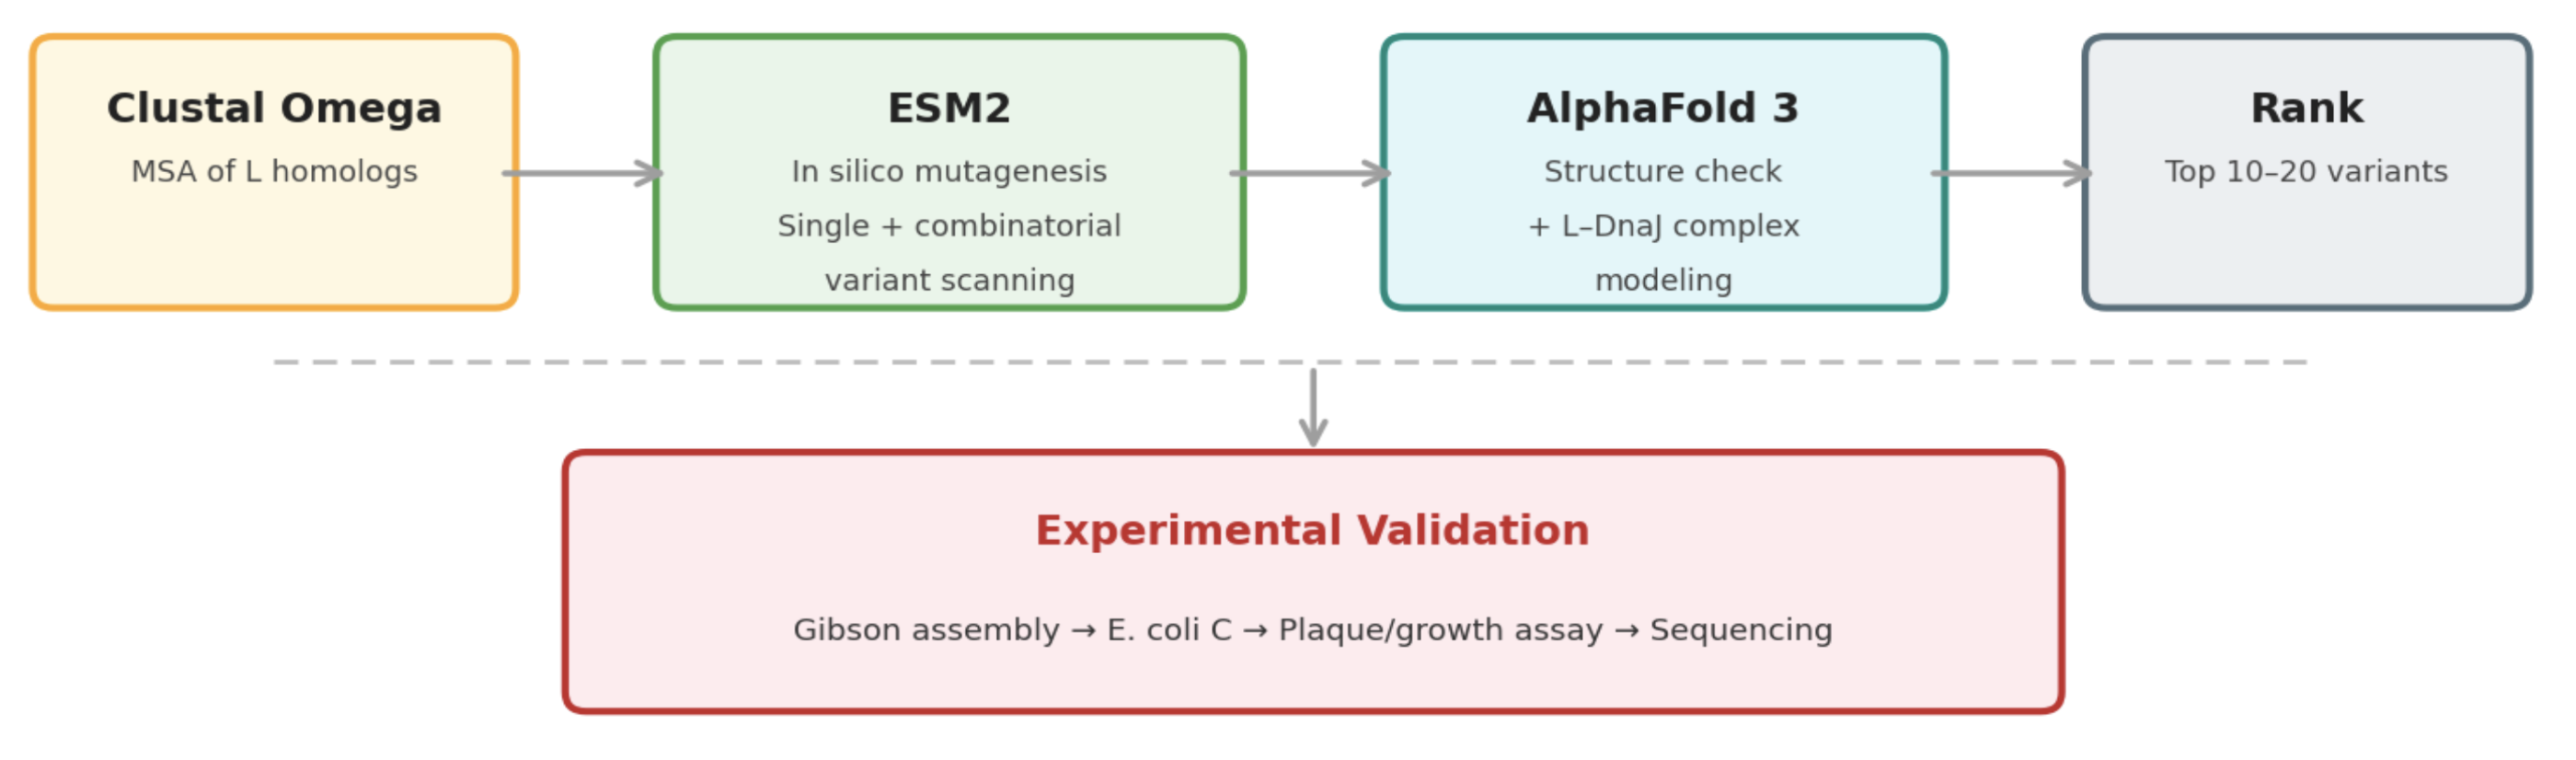
Pipeline: Three Tools, Each Non-Redundant
Clustal Omega (Conservation Map). Align L homologs across Leviviridae (MS2, f2, R17, GA, PP7, AP205, PRR1, M12, KU1, JP34). Conserved C-terminal residues (especially the LS motif) are presumed to mediate the unknown heterotypic interaction and are excluded from mutation. This map constrains all downstream design.
ESM2 + Deep Combinatorial Scanning (Fitness Oracle). Score every single-point mutation by log-likelihood change. Increases at mutable positions indicate stabilizing substitutions (Goal 1). N-terminal scanning identifies mutations that disrupt DnaJ binding (Goal 2). A strict preservation rule applies near the LS motif: mutations are evaluated for maintenance of wild-type fitness, not improvement. The genetics show that even conservative changes there cause recessive loss of function. Pairwise combinatorial scanning (~2M pairs) captures epistatic synergies at mutable positions.
AlphaFold 3 (Structural Filter + Complex Model). Predicts variant structures as a sanity check (does the TM helix survive?) and models the L–DnaJ complex to verify that N-terminal truncations and mutations disrupt the regulatory interface. Used as a filter, not a design engine. The PAE matrix identifies confident interface contacts.
Ranking
Composite score: ESM2 log-likelihood gain (stability) + conservation preservation (all essential residues intact) + AF3-predicted DnaJ-binding disruption (for timing bypass). The top 10 to 20 variants advance to experimental validation.
Why Not More Tools?
ProteinMPNN is excluded because it is trained on crystallized globular PDB proteins, not predicted structures of disordered membrane peptides. Compute is instead invested in combinatorial ESM2 depth.
Pitfalls
No experimental structure. All structural reasoning rests on AF3 predictions for a challenging target. Mitigated by treating AF3 as a filter and cross-referencing against the conservation map.
Unknown lytic target. The central limitation. We cannot optimize target-binding affinity for an unidentified partner; engineering is restricted to upstream properties (stability, membrane delivery, DnaJ bypass).
Autolysin bottleneck. If the lysis rate is limited by host autolytic enzyme activity rather than L accumulation, stabilization gains may show diminishing returns. The plaque assay will reveal this.
Pipeline Schematic
Week 5 HW: Protein Design Part 2
Part A: SOD1 A4V Peptide Binder Design
Superoxide dismutase 1 (SOD1) is a cytosolic antioxidant enzyme that converts superoxide radicals into hydrogen peroxide and oxygen. In its native state it forms a stable homodimer and binds copper and zinc. Mutations in SOD1 cause familial Amyotrophic Lateral Sclerosis (ALS). The A4V mutation (alanine to valine at residue 4) leads to one of the most aggressive forms of the disease. The mutation subtly destabilizes the N-terminus, perturbs folding energetics, and promotes toxic aggregation.
The goal here is to design short peptides that bind mutant SOD1, then decide which ones are worth advancing toward therapy, using three models: PepMLM, PeptiVerse, and moPPIt.
Generate four 12-mer binders with PepMLM and record perplexity scores
Four 12-residue peptides were generated using PepMLM-650M conditioned on the SOD1 A4V mutant sequence, alongside the known binder FLYRWLPSRRGG.
Peptide ID
Sequence
Source
Perplexity
1
WRYYVAAVRWGE
generated
21.23
2
WRSPPVGVEHKA
generated
22.21
3
WLYYPVGAELKE
generated
16.06
4
WHSGVVVLALKA
generated
13.84
5
FLYRWLPSRRGG
known binder
20.64
Lower pseudo-perplexity indicates higher model confidence. Peptide 4 (WHSGVVVLALKA, PPL = 13.84) shows the highest PepMLM confidence, followed by Peptide 3 (WLYYPVGAELKE, PPL = 16.06). Both outperform the known binder (PPL = 20.64), suggesting the model considers them plausible binders. All four generated peptides begin with Trp (W), suggesting a strong N-terminal preference for aromatic anchoring to SOD1.
Evaluate binders with AlphaFold3
All five peptide–SOD1 complexes were submitted to AlphaFold Server (fold date: 2026-03-09). Each job modeled the SOD1 A4V monomer (154 residues, chain A) with one 12-mer peptide (chain B). Results are stored in peptides/af3_results/.
Peptide
ipTM (best)
Binding Location
Surface/Buried
Notes
WRYYVAAVRWGE
0.31
Dimer interface / β-barrel
Surface-bound
PAE 9.07 Å, moderate confidence
WRSPPVGVEHKA
0.36
Extended surface groove
Surface-bound
Second-best ipTM, extended conformation
WLYYPVGAELKE
0.24
β-barrel region
Surface-bound
PAE 10.81 Å, lowest confidence
WHSGVVVLALKA
0.48
Dimer interface pocket
Partially buried
Best model: PAE 4.97 Å, well-defined binding
FLYRWLPSRRGG
0.31
β-barrel / dimer interface
Surface-bound
Known binder, PAE 8.60 Å
ipTM values range from 0.24 to 0.48 across the five complexes. While all fall below the 0.6 threshold typically considered high-confidence for protein–peptide interactions, they show meaningful differentiation among candidates.
Peptide 4 (WHSGVVVLALKA, ipTM = 0.48) clearly stands out: its ipTM exceeds the known binder FLYRWLPSRRGG (0.31) by 55%, and its PAE of 4.97 Å is roughly half that of the next-best model, indicating a well-resolved binding pose at the dimer interface pocket. It is also the only one predicted to be partially buried, suggesting tighter engagement.
Peptide 2 (WRSPPVGVEHKA, ipTM = 0.36) ranks second structurally, adopting an extended conformation along a surface groove. Peptides 1 and 5 tie at ipTM = 0.31, with Peptide 1 localizing to the dimer interface / β-barrel region and Peptide 5 (the known binder) similarly positioned. Peptide 3 (WLYYPVGAELKE, ipTM = 0.24) has the weakest structural prediction despite its moderate PepMLM perplexity (16.06), with a high PAE (10.81 Å) indicating uncertain binding geometry.
Notably, none of the five peptides bind near the N-terminus where the A4V mutation resides (position 4). All predicted binding sites localize to the dimer interface or β-barrel region, suggesting these peptides may act through general fold stabilization or dimer modulation rather than direct mutation-site engagement.
Evaluate therapeutic properties with PeptiVerse
Peptide
Source
PPL
Binding Affinity (pKd)
Solubility
Hemolysis
Net Charge (pH 7)
MW (Da)
WRYYVAAVRWGE
generated
21.23
7.021 (Medium)
1.000
0.093
+0.77
1555.7
WRSPPVGVEHKA
generated
22.21
4.826 (Weak)
1.000
0.013
+0.85
1362.5
WLYYPVGAELKE
generated
16.06
5.722 (Weak)
1.000
0.033
-1.23
1467.7
WHSGVVVLALKA
generated
13.84
6.055 (Weak)
1.000
0.079
+0.85
1279.5
FLYRWLPSRRGG
known binder
20.64
5.968 (Weak)
1.000
0.047
+2.76
1507.7
ipTM vs. PeptiVerse affinity. AlphaFold3 structural confidence and PeptiVerse-predicted affinity disagree on the top candidate. Peptide 4 (WHSGVVVLALKA) dominates structurally (ipTM = 0.48, PAE = 4.97 Å) but has only moderate predicted affinity (pKd = 6.055, “Weak”). Conversely, Peptide 1 (WRYYVAAVRWGE) has the best PeptiVerse affinity (pKd = 7.021, “Medium binding”) but an unremarkable ipTM of 0.31. This divergence likely reflects the fact that PeptiVerse predicts binding strength from sequence features while AF3 models 3D structural complementarity. The two views are complementary.
PepMLM perplexity vs. ipTM. These two metrics show better agreement. Peptide 4 ranks first in both (PPL = 13.84, ipTM = 0.48), supporting its candidacy from two independent perspectives. The correlation is imperfect: Peptide 3 ranks second by PepMLM (PPL = 16.06) but last by AF3 (ipTM = 0.24), so low perplexity does not guarantee a well-resolved pose.
Therapeutic safety. All five peptides are predicted to be fully soluble (probability = 1.000) and non-hemolytic (all below 0.10). No candidates present safety red flags. Peptide 2 (WRSPPVGVEHKA) has the lowest hemolysis risk (0.013) but also the weakest binding (pKd = 4.826).
Physicochemical properties. Net charges range from -1.23 to +2.76 at pH 7, all within reasonable bounds for cell-penetrating peptides. The known binder has the highest positive charge (+2.76), consistent with its arginine-rich C-terminus. Molecular weights are in the 1280–1556 Da range, typical for 12-mers.
Top candidate to advance: Peptide 4 (WHSGVVVLALKA), with Peptide 1 (WRYYVAAVRWGE) as a strong alternative.
Peptide 4 has the best PepMLM confidence (PPL = 13.84) and the best AlphaFold3 structural prediction by a wide margin (ipTM = 0.48, PAE = 4.97 Å). Two independent methods (sequence-based PepMLM and structure-based AF3) agree that this peptide has the most credible interaction with SOD1. Its predicted binding at the dimer interface pocket, where it is partially buried, suggests a geometrically specific interaction rather than nonspecific surface adhesion. While its PeptiVerse-predicted affinity is moderate (pKd = 6.055), the structural evidence from AF3 provides stronger support for a real binding event. It is fully soluble, non-hemolytic (0.079), and has the lowest molecular weight (1279.5 Da) among the candidates.
Peptide 1 (WRYYVAAVRWGE) remains a compelling alternative: it has the strongest predicted binding affinity (pKd = 7.021, the only “Medium binding” peptide), excellent safety properties, and a moderate ipTM (0.31). If PeptiVerse affinity predictions are weighted more heavily than AF3 structural models, Peptide 1 would be the preferred choice.
For experimental validation, both peptides merit testing: Peptide 4 as the structurally favored lead, Peptide 1 as the affinity-favored alternative.
Generate optimized peptides with moPPIt
The moPPIt model (discrete flow matching with multi-objective gradient guidance) was used to generate 11 peptides targeting the SOD1 A4V mutant. Target motifs were set to residues 1–15 (N-terminus, near the A4V mutation) and residues 49–54 (dimer interface near the EFGDN loop). Peptide length was 12 amino acids. Objective weights were [1, 1, 1, 4, 4, 2], so affinity and motif specificity were prioritized 4×. Results are in peptides/moPPIt/sod1_moppit_results.csv.
Peptide
Hemolysis
Non-Fouling
Half-Life
Affinity
Motif
Specificity
QKRRLLSLPVFK
0.902
0.602
0.80
6.00
0.478
0.622
YPPCAYYWQATD
0.929
0.587
3.42
7.10
0.563
0.686
SIVKTGVTFLTK
0.920
0.186
1.81
6.38
0.584
0.699
PPLIHRWYAATM
0.922
0.321
3.49
6.30
0.444
0.660
EEQVVKRIKVGP
0.953
0.736
0.68
6.54
0.580
0.679
CVQNKKPTFLII
0.911
0.497
1.56
6.14
0.668
0.647
LKKKIREFLKLG
0.952
0.561
1.16
6.19
0.512
0.660
YDPLPCAWTPTH
0.935
0.726
2.69
6.57
0.482
0.699
KPFVFFAKTEIM
0.932
0.130
1.41
6.25
0.589
0.538
PTWVIETKKKFR
0.979
0.611
2.30
5.73
0.609
0.667
GPKGWTGKQCFI
0.888
0.711
2.07
7.00
0.474
0.635
Hemolysis: probability of being non-hemolytic (higher is safer). Affinity: predicted binding score (higher is stronger). Motif: fraction of binding at target residues (higher means more on-target).
All 11 peptides show high predicted hemolysis scores (0.89–0.98), indicating low hemolytic risk. Affinity predictions span 5.73 to 7.10, with YPPCAYYWQATD (7.10) and GPKGWTGKQCFI (7.00) showing the strongest predicted binding. Half-lives vary considerably (0.68–3.49 hours), with PPLIHRWYAATM (3.49 h) and YPPCAYYWQATD (3.42 h) the most stable.
Top moPPIt candidates
Category
Peptide
Highlights
Highest affinity
YPPCAYYWQATD
Affinity 7.10, half-life 3.42, specificity 0.686
Best motif targeting
CVQNKKPTFLII
Strongest on-target binding (motif 0.668)
Best therapeutic profile
EEQVVKRIKVGP
Highest non-hemolytic (0.953), best non-fouling (0.736), strong affinity (6.54)
Design philosophy. PepMLM generates peptides via masked language modeling conditioned on the target sequence: it learns what peptide “looks right” next to SOD1 based on evolutionary patterns. moPPIt uses discrete flow matching with explicit multi-objective gradient guidance: it actively optimizes for binding affinity, motif specificity, and therapeutic properties simultaneously.
Binding specificity. PepMLM peptides are generated without any notion of where on SOD1 they should bind. moPPIt peptides are explicitly guided toward residues 1–15 and 49–54 via the BindEvaluator motif score, with a specificity penalty that discourages off-target binding.
Sequence composition. PepMLM peptides all start with W (tryptophan), suggesting a strong bias for aromatic N-terminal anchors. moPPIt peptides are more diverse: no single residue dominates, and compositions vary based on the objective trade-offs the sampler explores.
Affinity. moPPIt’s highest-affinity peptide (YPPCAYYWQATD, 7.10) is comparable to PepMLM’s best (WRYYVAAVRWGE, 7.02 via PeptiVerse). However, moPPIt consistently produces peptides in the 6.0–7.1 range, while PepMLM has more variance (4.8–7.0), suggesting moPPIt’s affinity guidance is effective.
Solubility tradeoff. PepMLM peptides all have perfect predicted solubility (1.000). Some moPPIt peptides sacrifice solubility (SIVKTGVTFLTK non-fouling = 0.186, KPFVFFAKTEIM = 0.130) in favor of higher affinity. This reflects the multi-objective nature: aggressive affinity optimization can push sequences toward hydrophobic compositions.
Evaluation before clinical advancement
In silico
Molecular dynamics simulations of peptide–SOD1 complexes (starting from AF3 structures) to assess binding stability.
Binding free energy calculations (MM/PBSA or MM/GBSA) for ranking.
Aggregation prediction (AGGRESCAN, TANGO).
In vitro
Surface plasmon resonance (SPR) or isothermal titration calorimetry (ITC) to measure actual Kₓ against A4V SOD1.
Hemolysis assay with human red blood cells.
Serum stability to validate half-life predictions.
ThT fluorescence and aggregation assays to test whether the peptide inhibits A4V SOD1 aggregation.
Cell-based
Cell viability (MTT/MTS) to confirm non-cytotoxicity.
Cell-penetrating peptide assessment, since SOD1 is cytosolic.
Co-immunoprecipitation to confirm peptide–SOD1 interaction in cellular context.
Efficacy testing in the SOD1-G93A transgenic ALS mouse model.
Standard safety pharmacology panel.
The key bottleneck for peptide therapeutics is typically delivery (cell penetration plus proteolytic stability), not binding affinity. Strategies to address this include D-amino acid substitution, cyclization, stapling, and conjugation to cell-penetrating peptide motifs.
Part B: BRD4 Drug Discovery with Boltz Lab
Tutorial designed by Geoffrey Smith, Boltz Lab.
Target: BRD4 (Bromodomain-containing protein 4), an epigenetic reader and validated oncology target. BRD4 is a member of the BET (Bromodomain and Extra-Terminal) family. It recognizes acetylated lysine residues on histone tails and recruits transcriptional machinery to gene promoters, driving expression of oncogenes including c-Myc. Dysregulated BRD4 activity is implicated in haematological malignancies, solid tumours, and inflammatory disease.
Reference: Filippakopoulos P. et al. Selective inhibition of BET bromodomains.Nature468, 1067–1073 (2010). Crystal structure: PDB 3MXF.
How confidently Boltz-2 places the ligand in the binding site.
> 0.7 reliable; > 0.8 high confidence
Optimization Score
0–1
Relative affinity ranking for a congeneric series.
Use for relative ranking
Structure Confidence
0–1
Confidence in the predicted structure.
> 0.8 high confidence
All three metrics need to be high to trust a prediction.
Run Boltz-2 predictions for the Hit, Lead, and JQ1
Compound
Binding Confidence
Optimization Score
Structure Confidence
Hit
0.43
0.22
0.93
Lead
0.74
0.27
0.98
JQ1
0.96
0.44
0.98
Does Binding Confidence increase from hit to clinical candidate?
Yes, Binding Confidence increases monotonically across the drug discovery progression: Hit (0.43) → Lead (0.74) → JQ1 (0.96). This is exactly what we would expect: each optimization stage adds chemical features that improve shape complementarity and specific interactions with the BRD4 acetyl-lysine binding pocket. The Hit (stripped back core) contains only the minimal thienodiazepine scaffold with no substituents to make specific contacts, so Boltz-2 has low confidence in placing it. The Lead adds a triazole and carboxylic acid that mimic the acetyl-lysine pharmacophore, roughly doubling the Binding Confidence. JQ1 adds the chlorophenyl group and tert-butyl ester, filling the WPF shelf and ZA channel of the bromodomain pocket and pushing Binding Confidence to 0.96, well above the 0.8 high-confidence threshold.
Structure Confidence is high for all three compounds (0.93–0.98), indicating that the protein structure itself is well-predicted regardless of the ligand. This makes sense since BRD4 is a well-characterized, rigid globular domain.
Inspect the predicted binding pose for JQ1
JQ1 scores 0.96 Binding Confidence with 0.98 Structure Confidence, indicating a highly reliable predicted pose. Key binding interactions, expected from the known crystal structure (PDB 3MXF):
The triazole ring and methyl group occupy the acetyl-lysine recognition site, forming a hydrogen bond with the conserved asparagine (N140) in the BC loop. This is the hallmark interaction of BET bromodomain inhibitors.
The chlorophenyl ring packs against the WPF shelf (W81, P82, F83), providing hydrophobic anchoring.
The tert-butyl ester group extends into the ZA channel, contributing additional hydrophobic contacts and shape complementarity.
The thienodiazepine core sits at the mouth of the pocket, bridging the ZA and BC loops.
Compare the Optimization Scores
The Optimization Scores track the same progression: Hit (0.22) → Lead (0.27) → JQ1 (0.44). JQ1’s score (0.44) is roughly 63% higher than the Lead’s (0.27), reflecting the substantial affinity gain from adding the chlorophenyl and tert-butyl ester groups. The Hit-to-Lead jump is more modest (0.22 → 0.27, ~23%), consistent with the triazole and acid adding some specific contacts but not yet achieving full pocket occupancy.
Using the categorization thresholds, JQ1 falls squarely in the high confidence binder range (Binding Confidence > 0.80, Opt. Score > 0.40). The Lead sits at moderate confidence (0.74, 0.27, both within the 0.65–0.80 and 0.25–0.40 ranges). The Hit falls in the low confidence / non-binder category (0.43, 0.22), consistent with its role as an unoptimized screening hit.
1K virtual screen
A design project was created in Boltz Lab using PDB 3MXF (BRD4 bromodomain 1 co-crystallized with JQ1) as the structural template. JQ1 was specified as the molecular probe to define the acetyl-lysine binding pocket. The platform automatically detected the binding site from the JQ1 co-crystal pose, identifying key pocket residues: the WPF shelf (W81, P82, F83), BC loop (N140), and ZA channel. Project ID: VS-BRD4WO-5P52.
A virtual screen of 993 AI-designed small molecules was generated from the Enamine REAL chemical space with Drug-Like filtering. All compounds were scored by Boltz-2 against the BRD4 binding pocket.
Score distributions across the library
Metric
Min
Max
Mean
Binding Confidence
0.07
0.85
0.30
Optimization Score
0.00
0.48
0.23
Structure Confidence
> 0.84
> 0.96
~0.92
The vast majority of compounds cluster at low Binding Confidence (< 0.40), consistent with the expectation that random chemical space sampling yields few genuine binders. Structure Confidence remains high throughout (> 0.84), indicating that the protein structure predictions are reliable regardless of ligand quality.
Top 5 compounds by Binding Confidence
Rank
ID
Binding Confidence
Opt. Score
SMILES
1
SM-AQ8GBD73
0.85
0.35
Cc1cc(-c2cc(C)c(Cl)c(C)c2)cc(C)c1O
2
SM-VP5CRXFK
0.84
0.25
CN1Cc2c(NC(=O)c3cccnc3)cccc2C1=O
3
SM-2MZLAGQT
0.80
0.48
Cc1nc2c(cc1C(=O)Nc1cnn(CC(C)(C)O)c1C)c(C)nn2C
4
SM-G95H15CR
0.76
0.20
CCC(=O)N(C)c1ccc2c(c1)CN(C)C2
5
SM-1ASUYQAA
0.74
0.34
CCN(C(=O)C(C)C)c1ccc(Cl)cc1F
Categorize the results and benchmark against JQ1
Category
Criteria
Count
% of library
High confidence binders
BC > 0.80, OS > 0.40
1
0.1%
Moderate confidence
BC 0.65–0.80, OS 0.25–0.40
13
1.3%
Low confidence / non-binders
BC < 0.65, OS < 0.25
979
98.6%
The reference compounds validate the scoring system:
Compound
Category
JQ1
High confidence binder (0.96 / 0.44)
Lead
Moderate confidence (0.74 / 0.27)
Hit
Low confidence (0.43 / 0.22)
The sole high-confidence AI hit:
ID
Binding Confidence
Opt. Score
Structure Confidence
SMILES
SM-2MZLAGQT
0.80
0.48
0.92
Cc1nc2c(cc1C(=O)Nc1cnn(CC(C)(C)O)c1C)c(C)nn2C
SM-2MZLAGQT contains a pyridazine-pyrazole core with multiple methyl groups and an amide linker to a neopentyl alcohol. Structurally distinct from JQ1, but it shares nitrogen-rich heterocyclic character.
How does JQ1 rank alongside the AI-generated library?
JQ1 scores BC = 0.96, OS = 0.44, substantially outperforming every AI-generated compound on Binding Confidence. By BC alone, JQ1 ranks #1 by a wide margin (0.96 vs. the next-best AI compound SM-AQ8GBD73 at 0.85). No AI-generated molecule approaches JQ1’s level of binding confidence.
However, SM-2MZLAGQT (the only high-confidence AI hit) achieves a higher Optimization Score (0.48) than JQ1 (0.44). This is notable: the Optimization Score reflects relative affinity ranking within a congeneric series, and SM-2MZLAGQT’s higher OS suggests it may achieve comparable or slightly better binding affinity despite lower structural confidence in its predicted pose.
Compound
BC Rank
OS Rank
BC
OS
JQ1 (benchmark)
1
2
0.96
0.44
SM-2MZLAGQT
4
1
0.80
0.48
SM-AQ8GBD73
2
6
0.85
0.35
SM-VP5CRXFK
3
—
0.84
0.25
JQ1 is not the top compound by Optimization Score, but it dominates Binding Confidence. This is expected: JQ1 is a highly optimized clinical candidate with known high-affinity binding to BRD4, whereas the AI compounds are generated from general chemical space without iterative medicinal chemistry optimization.
How do the top scoring binders compare in binding pose to JQ1?
The top-scoring AI compound SM-2MZLAGQT (Cc1nc2c(cc1C(=O)Nc1cnn(CC(C)(C)O)c1C)c(C)nn2C) contains a fused pyridazine-pyrazole bicyclic core decorated with methyl groups and an amide-linked pyrazole bearing a neopentyl alcohol. Compared with JQ1’s thienodiazepine scaffold:
Shared pharmacophoric features
Both molecules feature nitrogen-rich heterocyclic cores capable of occupying the acetyl-lysine recognition site and forming hydrogen bonds with N140.
Multiple methyl substituents in both compounds provide hydrophobic contacts with the pocket walls.
Both have molecular weights in the drug-like range (SM-2MZLAGQT ~314 Da vs. JQ1 ~457 Da).
Key structural differences
JQ1 uses a thienodiazepine (7-membered ring with sulfur), while SM-2MZLAGQT uses a pyridazine-pyrazole (two fused 6+5 rings with nitrogen).
JQ1’s chlorophenyl group fills the WPF shelf. SM-2MZLAGQT lacks an equivalent aromatic group, which may explain its lower Binding Confidence.
JQ1’s tert-butyl ester extends into the ZA channel; SM-2MZLAGQT’s neopentyl alcohol (CC(C)(C)O) may partially mimic this interaction but with a hydroxyl instead of an ester.
SM-2MZLAGQT is more compact and lacks the extended hydrophobic features that give JQ1 its high shape complementarity.
The second-highest BC compound, SM-AQ8GBD73 (Cc1cc(-c2cc(C)c(Cl)c(C)c2)cc(C)c1O), is a simple biaryl phenol with chlorine and methyl substitution, structurally much simpler than JQ1. Its high BC (0.85) but moderate OS (0.35) suggests it may sit in the pocket with good shape complementarity but lack the specific pharmacophoric interactions (N140 hydrogen bond, ZA channel occupancy) that drive high affinity.
Selectivity analysis: BRD4 vs. BRD2
This analysis was not performed. A selectivity screen against BRD2 (PDB 5UEN) would require re-running the top-scoring compounds from the BRD4 screen against the BRD2 bromodomain structure and comparing Binding Confidence and Optimization Scores across the two targets. Compounds scoring highly for BRD4 but poorly for BRD2 would indicate selectivity, a desirable property for reducing off-target effects, since BRD4 and BRD2 share highly conserved acetyl-lysine binding pockets. JQ1 itself is a pan-BET inhibitor (binds BRD2, BRD3, and BRD4), so identifying BRD4-selective compounds from the AI screen would represent a potential advantage over the benchmark.
DnaJ independence. L-protein folds and functions without requiring DnaJ.
Faster or more efficient lysis. Reduces the window for E. coli to acquire resistance.
Higher L-protein expression. Increases the amount of functional protein produced.
Approach. ESM-2 mutational scanning, experimental mutant data from PMC5775895, and conservation analysis via pBLAST + ClustalOmega were integrated to design five mutant L-protein sequences.
Generate mutational effect scores with ESM-2
The ESM-2 protein language model (650M parameters) was run on the 75-residue L-protein sequence. For each position, all 19 alternative amino acid substitutions were scored by computing the log-likelihood ratio (LLR = mutant log-probability minus wild-type log-probability). Results are saved in ms2/mutation_scores.csv (1,425 mutations across 75 positions).
Metric
Value
Total mutations scored
1,425
Positions
75
Soluble region (1–40)
760 mutations
Transmembrane region (41–75)
665 mutations
Positive LLR (predicted beneficial)
400 (28.1%)
Negative LLR (predicted deleterious)
1,025 (71.9%)
Top 10 highest-scoring substitutions:
Mutation
LLR
Region
C29R
+3.64
Soluble
K50P
+3.56
TM
C29P
+3.17
Soluble
C29Q
+3.06
Soluble
C29S
+3.04
Soluble
K50L
+2.96
TM
C29K
+2.76
Soluble
C29L
+2.74
Soluble
C29A
+2.55
Soluble
C29T
+2.52
Soluble
Two positions dominate the positive LLR landscape: C29 (cysteine at position 29 in the soluble domain) and K50 (lysine at position 50 in the TM domain). ESM-2 strongly prefers substituting the cysteine at position 29, likely because free cysteines are rare in most proteins and the model considers them destabilizing. K50 scores highly because the model views a charged residue in a hydrophobic TM context as unfavorable. The most strongly disfavored mutations are all at the initiator methionine (M1).
Review the experimental mutant data
Experimental mutant data was obtained from PMC5775895 and is stored in ms2/L-Protein Mutants - Sheet1.csv. The dataset contains 139 entries representing 82 unique mutations across 49 positions in the L-protein.
Category
Count
Total entries
139
Unique mutations
82
Missense mutations
100 (59 unique)
Stop codon mutations
39
Missense with lysis = 1 (functional)
35 (19 unique)
Missense with lysis = 0 (non-functional)
65 (40 unique)
Soluble domain (residues 1–40). This region is remarkably tolerant of mutation. Substitutions at R18, R19, R20 (the arginine-rich region) all retain lysis activity despite dramatically changing the charge profile (R18G, R18I, R19H, R19S, R20L, R20W; all lysis = 1). Positions 23 (K→E) and 25 (E→V, E→G, E→D) are also fully tolerant. Notable exceptions: M1 (initiator Met, essential), P6L (lysis = 0), Q8L (lysis = 0), Y39H (lysis = 0). C29R retains lysis, and C29 itself appears to be non-essential for function despite moderate conservation.
Transmembrane domain (residues 41–75). Far less tolerant. Most substitutions abolish lysis. K50 is functionally critical: all four tested substitutions (K50E, K50I, K50N, K50Q) show lysis = 0, yet the protein is still expressed (protein level = 1 for most), indicating that K50 is required for the lysis mechanism itself, not for protein stability. Proline substitutions in the TM helix are generally lethal (L48P, L56P, L57P, L60P all lysis = 0). Rare functional TM mutations include L44P and A45P; prolines at the TM boundary are tolerated, possibly because they sit at the helix-membrane interface. Positions 49–53 (S49, K50, F51, T52, N53) form a particularly intolerant stretch.
Does the experimental data correlate with the language model scores?
The ESM-2 LLR scores show no meaningful correlation with experimental lysis outcomes.
Test
Result
Point-biserial correlation
rₓ₋ = -0.041, p = 0.757
Mann–Whitney U
U = 421, p = 0.511
Mean LLR for lysis = 1 (functional)
-0.560
Mean LLR for lysis = 0 (non-functional)
-0.433
The correlation is essentially zero and far from statistical significance. If anything, the slight negative trend (functional mutations have marginally lower LLR) contradicts the expected direction. The Mann–Whitney U test confirms that the LLR distributions for functional and non-functional mutations are not distinguishable.
Of the 59 matched mutations, ESM-2 predictions agree with experiment in approximately 30 cases (roughly 50%), no better than random.
What does this say about ESM-2 for the L-protein?
ESM-2’s evolutionary signal does not capture the functional constraints of the L-protein. Several factors explain this:
Extreme sequence rarity. The L-protein is a 75-residue protein encoded by an overlapping reading frame in the MS2 genome. It has very few homologs in sequence databases (only 2–3 close relatives, fr and M12, plus a handful of distantly related levivirus lysis proteins). ESM-2 was trained on millions of sequences, and its effectiveness depends on having sufficient evolutionary depth. The L-protein’s shallow phylogenetic tree gives the model little signal to leverage.
Unusual evolutionary constraints. Because the lysis gene overlaps the coat protein and replicase genes, its evolution is constrained by the reading frames of two other genes. The selective pressures captured in ESM-2’s training reflect these overlapping constraints, not the intrinsic functional requirements of the L-protein itself.
Non-standard function. The L-protein is a single-pass transmembrane toxin whose function (membrane disruption) may not follow the same structure–function relationships ESM-2 captures well for globular enzymes.
The protein-level correlation is equally absent (r = 0.039, p = 0.768), confirming that ESM-2 does not predict expression or stability for this protein either.
Where does the model succeed and where does it fail?
Where ESM-2 succeeds
Strongly deleterious mutations at conserved positions. M1I and M1T (LLR = -6.13 and -5.63) are correctly predicted as non-functional. The initiator methionine is universally conserved and essential. Similarly, I42N (LLR = -1.43, lysis = 0) and I46N (LLR = -1.43, lysis = 0) in the transmembrane domain are correctly identified; replacing hydrophobic residues with polar asparagine disrupts TM helix packing.
Proline substitutions in the TM helix. L48P (LLR = -2.31), L56P (LLR = -1.22), L56H (LLR = -2.11), L57P (LLR = -0.42), and L60P (LLR = -0.84) all correctly receive negative LLR and experimentally show no lysis. ESM-2 recognizes that proline is incompatible with alpha-helical transmembrane segments.
Where ESM-2 fails
The arginine-rich soluble region (R18, R19, R20). R18G (LLR = -1.02), R18I (-1.37), R19H (-1.03), R19S (-0.30), R20L (-0.23), and R20W (-2.30) are all predicted deleterious, yet every one permits lysis. This is because the soluble N-terminal domain (residues 1–40) is largely dispensable for lysis activity; the amino-terminal half of the protein can tolerate extensive mutation as long as the transmembrane domain is intact. ESM-2 cannot distinguish “conserved for overlapping gene constraints” from “conserved for L-protein function.”
Position K50 in the TM domain. K50E (LLR = +0.50), K50I (+2.41), K50N (+0.86), and K50Q (+0.78) all receive positive or near-positive LLR scores, yet all four experimentally show no lysis. K50 is a charged “snorkeling” lysine in the TM domain that is apparently critical for membrane disruption. ESM-2 interprets this unusual charged residue in a hydrophobic context as unfavorable, when in fact it is functionally essential.
The failure pattern is region-dependent. Per-region analysis shows a slight positive trend in the soluble domain (rₓ₋ = +0.134) but a slight negative trend in the transmembrane domain (rₓ₋ = -0.166). ESM-2 is marginally better at predicting outcomes in the soluble domain but actively misleading in the transmembrane domain, likely because the functional rules for single-pass TM toxins differ from the evolutionary patterns in ESM-2’s training set.
Conservation analysis via pBLAST + ClustalOmega
A pBLAST search of the L-protein sequence identified 10 levivirus lysis protein homologs: fr (CAA33137), M12 (AAF19634), GA (CAA27498), JP34 (AAA72211), KU1 (AAF67675), BZ13 (ACT66727), Hgal1 (YP007237174), C1 (YP007237128), PP7 (NP042306), and PRR1 (YP717670). These were aligned with ClustalOmega and conservation scores were computed per position (ms2/conservation_scores.csv, ms2/alignment.fasta).
The alignment spans 11 sequences (MS2 L-protein + 10 homologs). Not all sequences cover every position; the N-terminal and C-terminal regions have variable sequence coverage (2–11 sequences per position).
Highly conserved positions (conservation ≥ 0.80):
Position
Residue
Conservation
Shannon Entropy
Region
1
M
1.00
0.00
Soluble
2
E
1.00
0.00
Soluble
3
T
1.00
0.00
Soluble
4
R
1.00
0.00
Soluble
9
S
0.80
0.72
Soluble
12
T
0.80
0.72
Soluble
29
C
0.82
0.68
Soluble
46
I
0.82
0.87
TM
48
L
0.82
0.87
TM
64
I
0.88
0.54
TM
69
T
0.88
0.54
TM
70
L
0.88
0.54
TM
73
L
1.00
0.00
TM
75
T
1.00
0.00
TM
The first four residues (METR) are universally conserved across all homologs. C29 (conservation = 0.82) is notable as the only cysteine in the protein and is highly conserved despite ESM-2 strongly favoring its substitution, highlighting a disconnect between evolutionary conservation and model preferences.
Highly variable positions (conservation ≤ 0.30):
Position
Residue
Conservation
Most common AA
Region
6
P
0.20
P
Soluble
17
N
0.30
M
Soluble
18
R
0.18
G
Soluble
19
R
0.09
L
Soluble
25
E
0.27
K
Soluble
26
D
0.18
E
Soluble
28
P
0.27
L
Soluble
30
R
0.18
S
Soluble
37
T
0.27
R
Soluble
41
L
0.27
W
TM
43
F
0.27
A
TM
50
K
0.30
D
TM
53
N
0.30
S
TM
56
L
0.30
S
TM
74
L
0.29
P
TM
The soluble domain (positions 1–40) shows a gradient: the first four residues are perfectly conserved, then conservation drops substantially in the R18–R20 arginine-rich region (0.09–0.38) and the E25–P28 stretch (0.18–0.27). The transmembrane domain (positions 41–75) has a mix of well-conserved structural residues (I46, L48, I64, T69, L70, L73, T75) and highly variable positions (L41, F43, K50, N53, L56), suggesting that TM helix geometry is maintained but specific side chains can vary.
Design 5 mutant variants
The variants below were selected by integrating three data sources: ESM-2 LLR scores (predicted mutational effect), conservation analysis (10 levivirus lysis protein homologs aligned via ClustalOmega), and experimental lysis data (59 characterized mutations). Selection criteria: positive LLR, non-conserved position (conservation < 0.8), and experimentally supported where available.
Charge reversal (positive K to negative E) in the soluble domain’s basic region near the DnaJ interaction interface. Position 23 is moderately conserved but shows high entropy (2.05), indicating tolerance for diverse amino acids across levivirus lysis proteins. The K→E substitution replaces the most common residue at this position with a negatively charged alternative, potentially altering the electrostatic interaction surface with DnaJ. Experimentally confirmed to retain lysis activity.
Target goal
DnaJ independence. Charge reversal at the chaperone interaction surface may weaken DnaJ binding while the protein retains lysis function through an alternative folding pathway.
0.273 (highly variable; most common AA at this position is K, not E)
Criteria met
3/3
Rationale
Position 25 is poorly conserved (0.273); across the 11-sequence alignment this site shows K, E, A, I, R, D, and others, indicating minimal functional constraint. The E→G substitution removes a bulky charged side chain and introduces maximum backbone flexibility. Experimentally confirmed functional.
Target goal
Higher expression. Glycine at this unconstrained position may improve co-translational folding efficiency and reduce dependence on chaperone-assisted folding.
No direct data for K50P. Caution: K50E, K50I, K50N, and K50Q all show lysis = 0, indicating K50 may be functionally essential.
Conservation status
0.300 (variable; most common AA at this position is D)
Criteria met
2/3 (positive LLR, non-conserved; no direct experimental data)
Rationale
ESM-2 assigns the highest LLR to this mutation because K50 is a charged residue in a hydrophobic TM context, and the model strongly prefers hydrophobic alternatives. However, this represents a known ESM-2 blind spot: K50 appears to be a functionally critical “snorkeling” lysine whose charge is required for membrane disruption. This variant is included as a hypothesis-testing candidate: if K50P retains lysis, it would demonstrate that the helix-breaking property of proline can substitute for the charge-based mechanism.
Target goal
Faster / more efficient lysis. If functional, the proline-induced helix kink could create a more aggressive membrane disruption geometry. This is the highest-risk, highest-reward variant.
No direct data for K50L. Same caution as Variant 3: four other K50 substitutions are non-functional.
Conservation status
0.300 (variable)
Criteria met
2/3 (positive LLR, non-conserved)
Rationale
Leucine is the most common residue in alpha-helical TM segments and represents the “default” hydrophobic substitution. Unlike the proline in Variant 3, leucine maintains helix geometry. This variant tests whether the loss of K50’s charge alone abolishes lysis or whether the specific chemistry of K50E/I/N/Q is what fails. Together, Variants 3 and 4 test two hypotheses: (3) can a structural perturbation compensate for charge loss; (4) is any uncharged residue tolerated?
Target goal
Faster / more efficient lysis. If the TM domain can function with a fully hydrophobic helix, this would indicate that membrane insertion efficiency can compensate for the loss of charge-mediated disruption.
Same position as Variant 2 (E25G) but with a different substitution strategy. While E25G maximizes flexibility, E25V introduces a branched hydrophobic side chain. This provides a paired comparison at a known-tolerant position: flexibility (G) vs. hydrophobicity (V). Position 25 is adjacent to the conserved C29 (conservation = 0.818), so mutations here probe the boundary between the variable N-terminal region and the more constrained core. Both E25G and E25V are experimentally confirmed functional.
Target goal
DnaJ independence. Replacing the charged glutamate with hydrophobic valine at the soluble-domain surface creates a local hydrophobic patch that may reduce the protein’s requirement for DnaJ-mediated folding assistance.
Summary
Variant
Mutation
Region
LLR
Conservation
Exp. Lysis
Target Goal
1
K23E
Soluble
+0.289
0.545
Yes
DnaJ independence
2
E25G
Soluble
+0.251
0.273
Yes
Higher expression
3
K50P
TM
+3.561
0.300
No data*
Faster lysis
4
K50L
TM
+2.956
0.300
No data*
Faster lysis
5
E25V
Soluble
+0.152
0.273
Yes
DnaJ independence
* Other K50 substitutions (E, I, N, Q) experimentally show no lysis.
Caveats
K50 risk. Variants 3 and 4 target position K50, where 4/4 tested mutations are non-functional. These are hypothesis-testing variants, not safe bets. Lower-risk TM alternatives include L44P (lysis = 1, LLR = -1.84) or A45P (lysis = 1, LLR = -0.43), though these have negative ESM-2 scores.
Position redundancy. The design includes two mutations at position 25 and two at position 50. This enables paired comparisons (flexibility vs. hydrophobicity at pos 25; helix-breaking vs. helix-maintaining at pos 50) but reduces position diversity.
ESM-2 limitations for L-protein. As documented in the correlation analysis, ESM-2 LLR scores do not predict lysis outcomes for this protein (rₓ₋ = -0.041). The conservation analysis and experimental data were therefore weighted more heavily in the final selection.
Week 6 HW: Genetic Circuits Part 1
Components of the Phusion High-Fidelity PCR Master Mix
Phusion HF PCR Master Mix is a pre-made 2× formulation that contains several key components:
Phusion DNA Polymerase. A high-fidelity, thermostable polymerase fused to a processivity-enhancing domain. Its error rate is roughly 50× lower than Taq polymerase, which is critical when accurate amplification is required (as in this mutagenesis lab, where only intentional mismatches should be introduced).
dNTPs. Deoxyribonucleotide triphosphates (dATP, dTTP, dGTP, dCTP); the raw building blocks that the polymerase uses to synthesize new DNA strands.
MgCl&sub2;. Provides magnesium ions, an essential cofactor for polymerase activity that also influences primer annealing stringency.
HF Buffer. Maintains optimal pH and salt conditions for the enzyme. The “HF” designation indicates an optimized formulation for high-fidelity amplification across a broad range of templates. Some versions also include detergents and stabilizers that help the enzyme tolerate common inhibitors.
The master mix format reduces pipetting steps and the chance of contamination: you only need to add template, primers, and water.
Factors that determine primer annealing temperature during PCR
The annealing temperature is typically set 2 to 5°C below the lower melting temperature ($T_m$) of the two primers in a pair. Several factors set the optimal temperature:
Primer length. Longer primers generally have higher $T_m$ because more hydrogen bonds stabilize the duplex.
GC content. G–C pairs form three hydrogen bonds vs. two for A–T pairs, so primers with higher GC content (ideally 40 to 60%) have higher $T_m$.
Salt and cation concentration. Mg²+ and monovalent cations stabilize DNA duplexes; higher concentrations raise the effective $T_m$.
Mismatches. The color forward primers in this lab carry intentional mismatches at the chromophore region. Mismatches destabilize binding and effectively lower $T_m$, which is why the insert fragment PCR uses a lower annealing temperature (53°C) than the backbone PCR (57°C).
Primer concentration. Higher concentrations shift the equilibrium toward annealing.
Secondary structure in primer or template. Hairpins and self-dimers compete with proper annealing. The protocol recommends checking for these and keeping Gibbs free energy above −10 kcal/mol.
PCR vs. restriction digest for making linear DNA
Both PCR and restriction enzyme digestion produce linear DNA fragments, but they work through fundamentally different mechanisms.
Protocol differences
Restriction digestion is simpler. You mix DNA with the enzyme(s) in the appropriate buffer, incubate (often 37°C for 1 hour), and the enzyme cuts at its recognition sequence. PCR requires designing primers, setting up a reaction with polymerase and dNTPs, and running a thermocycling program with denaturation, annealing, and extension steps. PCR takes about 90 minutes.
Output differences
Restriction enzymes cut at fixed, naturally occurring (or engineered) recognition sites, so you have no flexibility about exactly where the cut happens unless you have previously cloned in a new site. PCR lets you amplify any arbitrary region defined by your primer binding sites, giving complete control over fragment boundaries. PCR also amplifies: you go from a tiny amount of template to millions of copies. Restriction digestion only cuts what is already there, so you need more starting material.
Mutagenesis capability
A key advantage of PCR is that primers can introduce mutations. The color forward primers in this lab contain intentional mismatches at the chromophore site, so the amplified product carries the desired mutation. Restriction enzymes cannot introduce new sequence; they only cut existing sequence.
When to use each
Method
Preferable when
Restriction digestion
Well-placed unique sites already exist in the plasmid; you want a simple and fast workflow; you need to avoid the risk of polymerase errors accumulating over many cycles. Standard for traditional cloning into multiple cloning sites.
PCR
You need to amplify from a small amount of template, define custom fragment boundaries, introduce mutations, or add overhangs for assembly methods like Gibson.
In this lab, PCR is the right choice because we need to introduce chromophore mutations and add overlapping ends for Gibson assembly. Restriction digestion alone could not accomplish either.
Verifying readiness for Gibson cloning
Several verification steps are important:
Overlapping ends. Gibson assembly requires 20 to 40 bp of complementary sequence between adjoining fragments. Confirm that your primer design creates these overlaps correctly: each primer’s 5′ overhang should be complementary to the end of the adjacent fragment.
DpnI digestion. After PCR, treating with DpnI destroys the methylated parental template plasmid, ensuring only your newly synthesized, unmethylated PCR products go into the Gibson reaction. Without this step, background colonies from intact template would confound results.
DNA purification. The Zymo Clean & Concentrator step removes primers, dNTPs, polymerase, and buffer salts that could interfere with the Gibson assembly enzymes.
Concentration measurement. Use Nanodrop or Qubit to verify DNA concentration (above ~30 ng/μL) so that the proper 2:1 insert-to-vector molar ratio is achievable.
Gel electrophoresis. A diagnostic gel confirms that fragments are the expected size. An unexpected band could indicate mispriming, non-specific amplification, or an incorrect primer design.
Sequence verification. Confirm correct orientation (5′ to 3′) and that overlaps match between fragments to prevent assembly failures.
How plasmid DNA enters E. coli during transformation
This lab uses chemical (heat-shock) transformation with chemically competent DH5α cells. These cells have been pre-treated with calcium chloride, which neutralizes the negative charges on both the cell membrane and the DNA, reducing electrostatic repulsion and allowing DNA to associate with the cell surface.
Step
What happens
Ice incubation (30 min)
DNA–cell complexes form at the membrane.
Heat shock at 42°C (45 s)
Thermal imbalance transiently opens pores in the membrane; the temperature jump also creates a concentration gradient that drives DNA into the cell by diffusion.
Return to ice (5 min)
Helps reseal the membrane and stabilize the cells.
Recovery in SOC at 37°C (1 h)
Cells repair their membranes, begin replicating, and start expressing antibiotic resistance from the plasmid.
When plated on selective media containing chloramphenicol, only cells that successfully took up and are expressing the plasmid will survive and form colonies.
Another assembly method: Golden Gate
Golden Gate Assembly is a one-pot, one-step cloning method that uses Type IIS restriction enzymes (most commonly BsaI or BbsI) to create seamless, scarless assemblies of multiple DNA fragments. Unlike conventional restriction enzymes that cut within their recognition site, Type IIS enzymes cut at a defined distance outside their recognition sequence, so the recognition site can be positioned to be removed from the final product.
This allows the designer to specify custom 4-bp sticky-end overhangs at each junction, enabling ordered, directional assembly of many fragments simultaneously. The reaction is run as a thermocycling protocol alternating between the restriction enzyme’s optimal temperature (~37°C) and the ligase’s optimal temperature (~16°C), which drives the equilibrium toward the correctly assembled product, since correctly ligated junctions no longer contain the enzyme recognition site and cannot be re-cut. Golden Gate can efficiently assemble 10+ fragments in a single reaction, making it particularly powerful for combinatorial library construction or modular cloning systems like MoClo and PhytoBricks.
Compared to Gibson, which uses sequence homology overlaps and works best with 2 to 6 fragments, Golden Gate offers more precise control over junction sequences and higher efficiency with many fragments. It does require that the Type IIS recognition site not appear internally in any fragment.
How Golden Gate works (step by step)
Comparing Golden Gate to Gibson (from this lab)
Gibson
Golden Gate
Junction chemistry
20–40 bp homologous overlaps
4-bp custom sticky-end overhangs
Reaction format
Isothermal, 50°C
Thermocycling between 37°C and 16°C
Enzymes
Exonuclease + polymerase + ligase
Type IIS RE + ligase
Sweet spot
2–3 fragments (like this chromophore lab)
10+ fragments in defined order
Why it works
Overlaps drive assembly
Junctions remove the recognition site, blocking re-cutting
Modeling Golden Gate in Benchling
Below is the completed Golden Gate assembly with a pink insert.
Asimov Kernel
Create a repository and notebook
Explore the bacterial demos repo
I explored the devices in the Bacterial Demos repo to understand how the parts work together by running the Simulator on various examples and reading the “Info” panel for each.
Recreate the Repressilator
I recreated the Repressilator in a blank Construct using parts from the Characterized Bacterial Parts repository, then confirmed the simulation matched the reference Repressilator in the Bacterial Demos repo.
Build three custom constructs
For each construct I describe the intended function, run the simulator, and share the results. Where the results don’t match expectations, I speculate on why and adjust simulator settings to recover the expected outcome.
Construct 1.
Construct 2.
Construct 3.
Week 7 HW: Genetic Circuits Part 2
Part 1: Intracellular Artificial Neural Networks (IANNs)
Advantages of IANNs over Boolean genetic circuits
IANNs offer three advantages over Boolean genetic circuits.
Graded signaling. They operate on continuous intracellular signals rather than discrete ON/OFF states, enabling weighted summation, nonlinear activation, and universal function approximation. Weiss-coauthored neuromorphic circuits demonstrated these capabilities through analog computation, soft majority voting, and ternary switching in living cells.
Tunable decision boundaries. Effective weights and biases can be adjusted by modifying stoichiometry, promoter strength, or recognition-site placement; no topological redesign is required. The PERSIST endoRNase system illustrates this: the same RNase acts as a repressor or activator depending on whether the target site is in the 5′ UTR or 3′ UTR.
Greater expressive power. Multilayer IANNs can represent smooth classifiers and nonlinearly separable response surfaces that Boolean truth tables cannot efficiently encode.
A useful application
An autonomous cell-state classifier for stem-cell differentiation would be a strong use case. The IANN would integrate sensors for an endothelial-intermediate RNA signature ($x_1$), residual pluripotency ($x_2$), and off-target lineage markers ($x_3$), computing a weighted sum
$$z = w_1 x_1 - w_2 x_2 - w_3 x_3 + b$$
passed through a nonlinear output node that drives a fluorescent reporter or a differentiation factor. Weiss and colleagues used endoRNase-mediated miRNA sensors in a similar fashion to monitor cell-state transitions and guide multistep hiPSC differentiation toward a hematopoietic lineage.
Limitations:
Resource loading in mammalian cells (Weiss 2020 showed competing modules can reduce unregulated gene expression by up to 70%).
RNase saturation and cross-cleavage at high enzyme ratios, as observed in PERSIST cascades.
Stochastic weight variation across cells from poly-transfection.
The 650 ng total-DNA constraint imposed by the class protocol, which the supplied two-layer design already saturates.
Single-layer IANN diagram
The diagram below shows an intracellular single-layer perceptron where the X1 input is DNA encoding the Csy4 endoribonuclease and the X2 input is DNA encoding a fluorescent protein output whose mRNA is regulated by Csy4. (Tx: transcription; Tl: translation.)
Multilayer IANN diagram
The diagram below shows a two-layer intracellular perceptron built from the supplied parts.
Layer
Function
Layer 1
Input DNA X1 encodes Csy4. Csy4 protein cleaves the Csy4 recognition site on the hidden-layer transcript (Csy4_rec_CasE), repressing it and producing the hidden-node output H = CasE.
Layer 2
CasE protein acts on the CasE recognition site in the output transcript (CasE_rec_mNeonGreen), repressing it to produce the fluorescent output Y = mNeonGreen.
Both RNase links are drawn as repression to match the supplied single-layer example. In PERSIST-style designs, the sign of each edge can be inverted by repositioning the recognition site from a 5′-UTR OFF configuration to a 3′-UTR ON configuration.
In the provided spreadsheet, this design corresponds to:
X1 = Csy4 + mKO2
X2 = Csy4_rec_CasE + eBFP2
Bias = CasE_rec_mNeonGreen
It consumes the full 650 ng class DNA limit.
Part 2: Fungal Materials
Examples of existing fungal materials
Most fungal materials are mycelium-based.
Product
Use
Notes
Mycelium packaging (Ecovative, used by Dell)
Styrofoam replacement
Made by inoculating agricultural waste with fungal spores and molding it into custom shapes.
Mycelium leather (MycoWorks, Bolt Threads Mylo)
Leather replacement
Roughly 70% less water and 68% lower greenhouse gas emissions than cattle leather.
Construction and insulation panels
Building materials
Fire-resistant, with favorable thermal conductivity and sound absorption.
Compostable foams (Ecovative)
Packaging, padding
Fungal protein foods (Mycorena)
Food
Common advantages over traditional counterparts: biodegradability, use of waste feedstocks, reduced environmental impact.
Common disadvantages: limited mechanical performance (mycelium compressive strength is around 0.1 to 0.2 MPa vs. 17 to 28 MPa for concrete), moisture susceptibility, batch-to-batch variability, scaling difficulties, and (in the case of leather substitutes) cost issues that have forced some manufacturers to shut down.
Why genetically engineer fungi?
Engineering targets in fungi include:
Modifying cell-wall biosynthetic genes (chitin synthase, alpha-glucan synthase, acetyltransferases) to tune material properties at the genome level.
Activating silent secondary-metabolite gene clusters via synthetic transcription factors or heterologous expression in hosts like Aspergillus oryzae.
Embedding synthetic gene circuits into mycelium to create stimulus-responsive living materials.
Advantages over bacteria for synthetic biology
Eukaryotic post-translational machinery. Glycosylation, disulfide bonds, and proteolytic processing are needed for functional human therapeutic proteins.
High secretion capacity. Filamentous fungi secrete 10 to 1,000× more protein than bacterial hosts.
Native handling of complex gene clusters. Fungi harbor secondary-metabolite pathways with large intron-containing gene clusters that bacterial systems cannot properly express.
3D growth. Mycelium grows into three-dimensional networks usable directly as structural materials. No bacterial system offers this.
Lignocellulosic feedstocks. Fungi thrive on waste streams that most bacteria cannot degrade.
Tradeoffs. Slower growth, less well-characterized genetics, and a synthetic biology toolkit that remains less mature than what is available for E. coli. Recent efforts like the Fungal Modular Cloning Toolkit (96 standardized parts for filamentous fungi) are narrowing this gap.
The library comprises 80 unique 20-nt T7 promoter-spacer variants (positions +1 to +20), each paired with three reporters (sfGFP, mCherry, NanoLuc), yielding 240 test constructs plus 9 controls (dead-promoter negatives, no-RBS negatives, and synonymous codon-variant sfGFP controls).
Spacers are drawn from five design categories:
Published reference variants (WT T7, T7Max, T7c62, T7#4).
Systematic ITS mutagenesis at positions +1 to +6.
RBS / translation-efficiency variants.
Context-interaction variants designed to produce reporter-dependent expression differences.
Random space-filling variants for unbiased landscape coverage.
Construct architecture
All constructs are designed as linear DNA fragments:
5'-[59 bp buffer]-[T7 consensus promoter]-[20 nt variable spacer]-[reporter CDS]-[T7 terminator]-[59 bp buffer]-3'
Total lengths range from ~720 bp (NanoLuc) to ~920 bp (sfGFP). The 59-bp flanking buffers protect against residual RecBCD exonuclease activity in the BL21 Star lysate, per Ginkgo’s recommendation of 50 to 80 bp padding for linear DNA templates in their cell-free system. Constructs will be synthesized as linear gene fragments (e.g., via Twist Bioscience) and used directly as CFPS templates at 15 to 20 nM, with no plasmid cloning.
Week 9 HW: Cell Free Systems
Part 1: Cell-Free Protein Synthesis
Advantages of CFPS over in vivo expression
Cell-free protein synthesis (CFPS) removes the constraint of keeping a living cell alive. In a normal in vivo expression experiment, every design choice has to be compatible with growth, metabolism, membrane integrity, and host viability. In CFPS, the transcription and translation machinery is retained, but the cell itself is gone, so the reaction becomes an open biochemical system that can be directly tuned. DNA concentration, magnesium and potassium levels, redox state, chaperones, cofactors, detergents, lipids, noncanonical amino acids, and energy substrates can all be adjusted without worrying about whether the host will survive.
That open format gives two major advantages.
Rapid prototyping. I can test many DNA templates, promoter or RBS designs, or reaction conditions in parallel in a few hours, instead of building and transforming strains.
Tighter experimental control. Every important variable is directly set by the user rather than indirectly filtered through cellular regulation. If translation drops, I can alter Mg²+ or template concentration immediately. If a membrane protein aggregates, I can add nanodiscs or detergent directly to the reaction.
Cases where CFPS is especially beneficial
Case
Why CFPS helps
Toxic proteins
Pore-forming toxins, nucleases, and strong metabolic enzymes often kill or stress living hosts; in CFPS there is no cell viability to protect.
Membrane proteins
These misfold, aggregate, or overload the membrane insertion machinery in vivo. In CFPS, membrane mimics (liposomes, nanodiscs, mild detergents) can be added directly.
Rapid circuit prototyping
Gene circuits, biosensors, and promoter libraries can be screened much faster without cloning into cells and waiting for growth.
Noncanonical chemistry
CFPS is well suited for adding isotope labels, unnatural amino acids, or unusual cofactors that may be hard for living cells to tolerate or import.
Main components of a CFPS system
A typical cell-free expression reaction has several core parts:
Component
Role
Cell extract or purified Tx/Tl machinery
The engine of the system. Crude lysates from E. coli, wheat germ, insect, or mammalian cells contain ribosomes, tRNAs, aminoacyl-tRNA synthetases, translation factors, and many metabolic enzymes. PURE systems supply these as purified components rather than as crude extract.
DNA or mRNA template
Encodes the protein of interest. DNA must include promoter, ribosome binding site or Kozak sequence, coding sequence, and a terminator or polyadenylation signal appropriate to the system.
Amino acids
Building blocks used by ribosomes to make the protein.
Nucleotides (ATP, GTP, CTP, UTP)
Required for transcription and many steps of translation and energy transfer.
Energy source and regeneration system
Protein synthesis consumes large amounts of ATP and GTP, so the reaction needs both an initial pool and a recycling mechanism.
Salts and cofactors
Magnesium and potassium are particularly important for ribosome function, RNA folding, and enzyme activity. Spermidine, folate derivatives, and reducing agents may also be needed.
Buffer system
Maintains pH and ionic environment.
Accessory additives
Chaperones, disulfide bond isomerases, detergents, nanodiscs, liposomes, RNase inhibitors, protease inhibitors, or crowding agents, depending on the target protein.
In short, CFPS reconstitutes the minimum biochemical environment needed for transcription and translation, then tunes that environment for the target protein or circuit.
Why energy regeneration is critical
Protein synthesis is extremely energy-intensive. ATP is required for tRNA charging and many upstream metabolic steps; GTP is consumed during translation initiation, elongation, and translocation. In a closed reaction, the energy pool is depleted quickly, and inhibitory byproducts such as inorganic phosphate accumulate. If ATP collapses, transcription slows, translation stalls, and yield drops sharply even if all other components are present.
A common practical solution is a phosphoenolpyruvate (PEP) + pyruvate kinase regeneration system. ATP is consumed during the reaction and converted to ADP. Pyruvate kinase then transfers the high-energy phosphate from PEP back onto ADP, regenerating ATP continuously. This setup is simple, fast, and effective for short to medium CFPS reactions.
In my experiment I would pair PEP regeneration with optimization of magnesium and phosphate balance, because even a good energy donor can fail if phosphate buildup poisons the reaction. For longer reactions I would also consider slower-burning substrates such as 3-phosphoglycerate, glucose, or maltodextrin, which often improve longevity by releasing energy more gradually.
Prokaryotic vs. eukaryotic CFPS
Feature
Prokaryotic CFPS
Eukaryotic CFPS
Common source
E. coli lysate or PURE
Wheat germ, insect, rabbit reticulocyte, or mammalian lysate
Speed and cost
Fast and inexpensive
Slower and more expensive
Yield
Often very high for simple proteins
Lower to moderate, but better for complex proteins
PTMs
Limited
Better support for folding, disulfides, and some post-translational modifications
Secreted proteins, receptors, antibodies, and other eukaryotic targets
A prokaryotic system is best when the goal is speed, low cost, and high yield for proteins that do not require elaborate post-translational processing. To produce sfGFP I would choose an E. coli CFPS system: sfGFP folds well in bacterial conditions, does not need glycosylation, can be produced quickly at high yield, and gives a direct fluorescent readout of productive expression.
A eukaryotic system is preferable when the protein requires a eukaryotic folding environment, disulfide bond formation, microsomal insertion, or other processing steps. To produce human erythropoietin (EPO) I would choose a mammalian or insect-derived CFPS system: EPO is a secreted human glycoprotein whose activity and stability depend on proper eukaryotic folding and post-translational processing. An E. coli lysate could make the polypeptide but would be much less likely to produce a properly folded, functional therapeutic-like product.
Designing a CFPS experiment for a membrane protein
I would design the experiment around co-translational insertion into a membrane mimic, rather than expressing the protein into free solution and hoping it folds afterward. As a concrete example, I would use an E. coli CFPS system to express the bacterial potassium channel KcsA with a C-terminal GFP tag for rapid screening. The reaction would include preassembled nanodiscs made from MSP1D1 scaffold protein and a POPC:POPG lipid mixture, because KcsA is far more likely to remain soluble and native-like if it inserts into a bilayer during translation.
The main challenges:
Challenge
What goes wrong
Aggregation
Hydrophobic transmembrane segments precipitate in aqueous solution.
Misfolding
Even if the protein is made, it may not adopt the correct conformation or oligomeric state.
Poor membrane insertion
The reaction may produce full-length protein that never enters a lipid environment.
Reaction inhibition
Detergents, excess DNA, or incorrect salt balance can reduce overall translation efficiency.
To address these, I would screen a matrix of conditions:
Nanodiscs vs. small liposomes vs. mild detergents (DDM, LMNG).
Low vs. moderate DNA concentration.
25, 30, and 37°C reaction temperatures.
Magnesium concentration and potassium glutamate concentration.
I would measure three outputs: total protein made, soluble or membrane-associated fraction, and functional activity after reconstitution. Total yield can be checked by SDS-PAGE or in-gel GFP fluorescence. Membrane insertion can be assessed by co-migration with nanodisc fractions or flotation assays. Function can be tested with a potassium flux assay after purification or direct reconstitution. The best condition is not simply the one with the most protein, but the one that gives the highest amount of correctly inserted, functional channel.
Three reasons for low CFPS yield
Poor template design or template quality. A weak promoter, a poorly matched RBS, degraded DNA, or problematic secondary structure in the coding sequence can hurt both transcription and translation. Troubleshooting: check DNA quality, compare plasmid vs. linear template, redesign the 5′ UTR, and test a stronger promoter or codon-optimized construct.
Incorrect reaction chemistry. CFPS depends sensitively on magnesium, potassium, pH, and energy balance. A reaction that is slightly off can collapse even with all components present. Troubleshooting: run a small DOE varying Mg²+, K+, DNA concentration, and energy substrate, while using a known positive control (e.g. sfGFP) to determine whether the issue is the reaction mixture or the target itself.
Protein instability, aggregation, or degradation. Some proteins fold poorly, are protease-sensitive, or precipitate as they are made. Troubleshooting: lower reaction temperature, shorten reaction time, add chaperones, add protease inhibitors, or include membrane mimics or redox helpers if the target is a membrane protein or disulfide-rich protein.
Low yield is usually not caused by one single factor. In practice, I would troubleshoot in the order template quality → reaction chemistry → protein-specific folding issues, because that sequence separates general reaction failure from target-specific failure.
Part 2: Design of a Useful Synthetic Minimal Cell
1. Pick a function and describe it.
I would design a synthetic minimal cell (SMC) that senses theophylline and, in response, activates a nearby engineered probiotic bacterium. The idea is to convert a small molecule that the bacterium does not naturally monitor into a standard bacterial induction signal.
Layer
Element
Function
User-controlled activation of a probiotic gene program.
Input
Theophylline.
SMC output
IPTG release.
Hybrid system output
sfGFP in E. coli Nissle 1917 (proof of principle); a therapeutic payload in a future version.
This function could not be realized by cell-free Tx/Tl alone without encapsulation. If IPTG were simply mixed into a bulk cell-free reaction, it would diffuse directly to the bacteria and there would be no gated actuator step. The membrane compartment is what lets the SMC store the output signal until the input molecule triggers pore formation.
It could be realized by a genetically modified natural cell, but that would require engineering a living probiotic to directly sense theophylline and carry the entire logic internally. The synthetic-cell version is more modular: the same probiotic responder could be paired with many different SMC sensors just by swapping the sensing module.
The desired outcome is that the probiotic turns on only when theophylline is present, giving an external chemical control knob over bacterial behavior without permanently hard-wiring the sensing logic into the living cell.
2. Components
Component
Design choice
Rationale
Membrane
POPC:cholesterol vesicle, optionally stabilized with DSPE-PEG2000
Stable phospholipid compartment that can hold small molecules and support pore insertion.
Tx/Tl source
E. coli cell-free expression system
Fast, inexpensive, compatible with bacterial riboswitch control.
Input sensing module
Theophylline-responsive riboswitch upstream of pore gene
Theophylline is membrane-permeable and the riboswitch can directly control translation.
Output release module
Alpha-hemolysin pore
Allows stored IPTG to exit only after the sensor is activated.
Encapsulated cargo
IPTG, amino acids, nucleotides, salts, energy substrate, cell-free enzymes
IPTG is the communication signal; the rest are required for expression of the pore.
Receiver cell
E. coli Nissle carrying a LacI-regulated reporter plasmid
Converts released IPTG into an easily measured bacterial response.
I would use a bacterial Tx/Tl system rather than a mammalian one, because the key regulatory element here is a small-molecule riboswitch and the output is just pore formation and inducer release. No mammalian glycosylation or nuclear machinery is needed.
The SMC communicates with the environment in two steps:
Theophylline diffuses across the vesicle membrane and binds the riboswitch, turning on pore synthesis.
Alpha-hemolysin inserts into the vesicle membrane and releases encapsulated IPTG, which then diffuses to the surrounding probiotic cells and activates their lac-regulated gene circuit.
3. Experimental details
Lipids and genes
Lipids: POPC, cholesterol, DSPE-PEG2000.
Tx/Tl system:E. coli S30 extract or PURE.
Energy system: 3-phosphoglycerate or PEP-based ATP regeneration.
Synthetic-cell gene:Staphylococcus aureushla encoding alpha-hemolysin, controlled by a theophylline riboswitch.
Encapsulated small-molecule cargo: IPTG.
Responder-cell genes: constitutive lacI plus sfGFP under PlacUV5 or Ptac in E. coli Nissle 1917.
Measurement strategy
I would measure function primarily through the GFP output of the responder bacteria. In the presence of theophylline, the SMC should synthesize alpha-hemolysin, release IPTG, and induce bacterial GFP. The cleanest readout would be flow cytometry or plate-reader fluorescence of the E. coli Nissle reporter strain.
Key controls:
No theophylline.
No hla DNA.
SMCs without encapsulated IPTG.
Responder bacteria without the lac-regulated reporter.
If needed, IPTG release could also be confirmed indirectly by comparing fluorescence kinetics, or directly by chemical assay of the supernatant.
Part 3: Freeze-Dried Cell-Free Systems in Materials
One-sentence pitch
I propose a soft-robotic skin with embedded freeze-dried cell-free microcapsules that detect damage, generate a visible warning signal, and locally produce a crosslinking enzyme to help seal small tears.
How it works
The robotic skin would contain patterned microcapsules loaded with freeze-dried cell-free reactions, a DNA template for a visible chromoprotein, and a DNA template for microbial transglutaminase. These capsules would be embedded inside an elastomer layer that also contains a thin repair hydrogel rich in crosslinkable residues. When the skin is punctured or torn, a built-in water reservoir or ambient moisture rehydrates the damaged region and activates the local cell-free reactions. The chromoprotein marks the damaged area for easy inspection, while transglutaminase crosslinks the repair layer and helps slow crack growth or fluid leakage long enough for replacement.
Societal challenge / market need
Soft robots are increasingly used in medical devices, warehouse automation, and search-and-rescue environments, but their compliant materials are vulnerable to small tears, abrasion, and puncture. Today, many failures are only discovered after performance drops or a leak becomes severe. A self-reporting, partially self-sealing skin would reduce downtime, improve safety, and make soft robots more practical in environments where immediate maintenance is difficult.
Addressing CFPS limitations
I would address activation and stability by storing the reactions in trehalose-stabilized, vacuum-sealed microcapsules laminated inside the material until damage occurs. Water-triggering is actually useful here, because damage can be coupled to capsule rupture or exposure to a local hydration layer. The one-time-use limitation can be handled by making the sensing-and-repair elements modular and replaceable, like sacrificial patches in high-strain regions. For long shelf life, the material would use oxygen and moisture barrier films so the cell-free modules stay dormant until needed.
Part 4: Mock Genes in Space Proposal
1. Background
Long-duration missions may depend on dried DNA templates for on-demand production of medicines, enzymes, and diagnostics. Space radiation and temperature cycling could damage these templates and reduce the reliability of cell-free manufacturing. I want to test how well lightweight shielding preserves the functional expression capacity of stored DNA. This matters because future crews will need compact, stable biotechnology systems far from Earth, and it is scientifically interesting because it directly connects the space environment to the survival of usable genetic information.
2. Molecular or genetic target
Plasmid DNA encoding sfGFP under a T7 promoter, plus the T7-promoter-to-sfGFP junction as a PCR integrity marker.
3. How the target relates to the challenge
If spaceflight damages the promoter or coding sequence, BioBits should produce less GFP even when the same amount of DNA is added. Measuring fluorescence therefore converts DNA integrity into a simple functional readout. By comparing shielded and unshielded templates, I can test whether stored genetic instructions remain usable for future in-space biomanufacturing and biosensing.
4. Hypothesis
DNA stored behind lightweight, hydrogen-rich shielding will retain higher functional expression capacity than unshielded DNA after space exposure.
The goal is to compare practical storage strategies for preserving genetic templates that could later be used in cell-free systems aboard spacecraft. This hypothesis is based on the fact that ionizing radiation causes strand breaks and base damage, while hydrogen-rich materials can reduce secondary particle damage more effectively than many denser materials. A functional BioBits readout is especially useful because a template may still be amplifiable by PCR yet perform poorly in transcription or translation.
5. Experimental plan
I would test freeze-dried plasmid aliquots stored in three conditions: unshielded, polyethylene-shielded, and aluminum-shielded, with matched ground controls.
Step
Tool
Purpose
Rehydration and expression
BioBits
Read GFP output at fixed time points.
Integrity check
miniPCR, amplifying the T7–sfGFP region from the same samples
Confirm whether the template is amplifiable.
Detection
P51 Molecular Fluorescence Viewer
Measure GFP fluorescence.
Fresh plasmid serves as a positive control; no-DNA reactions serve as negative controls.
Week 10 HW: Advanced Imaging
Homework: Final Project
Q1. What aspects of your project will you measure?
This project has four distinct measurable outputs that span computational filtering, protein expression, antimicrobial activity, and drug synergy:
Peptide physicochemical properties (computational, pre-synthesis). During AI candidate selection I will measure charge, amphipathicity, and hydrophobic moment of ~2,000 AMP-Diffusion candidates, as well as CLIP binding scores for PepPrCLIP candidates against E. coli FtsZ and LpxC targets. PeptiVerse provides predicted hemolysis probability, solubility, and toxicity scores for all final candidates.
Bacterial growth inhibition ($\text{OD}_{600}$). This is the core experimental measurement. After expressing each peptide via cell-free protein synthesis, I will read optical density at 600 nm on both E. coli ATCC 25922 and B. subtilis ATCC 6633 plates after overnight incubation. Each peptide’s $\text{OD}_{600}$ is compared to the scrambled-peptide negative control to calculate percent growth inhibition, producing a 2D activity matrix (peptide $\times$ organism).
Fractional Inhibitory Concentration Index (FICI) for synergy. For the top 5 to 6 active peptides, I will measure $\text{OD}_{600}$ of co-expressed pairs (both DNA templates at half-dose in one CFPS reaction) vs. each peptide expressed alone at half-dose. FICI classifies each pair as synergistic ($\leq 0.5$), additive ($0.5$ to $1.0$), or indifferent / antagonistic ($> 1.0$). This measurement directly answers the central hypothesis about whether cross-method AMP pairs are more synergistic than within-method pairs.
Gram-selectivity profiles. Running every peptide against both organisms generates a selectivity ratio (% inhibition on E. coli vs. B. subtilis). This is especially important for Group C constructs; if MadSBM becomes available, the 25%, 50%, and 75% interpolants between magainin-2 (gram-negative) and HNP-1 (gram-positive) should show a measurable shift in this ratio.
Q2. Describe all elements you would like to measure and how.
Computational measurements are performed before any wet lab work. AMP-Diffusion generates ~2,000 candidate sequences at lengths 20, 25, 30, and 35 amino acids. I filter these programmatically by physicochemical properties (removing sequences with unfavorable charge, low amphipathicity, or homopolymer runs) and select the top 6 diverse candidates plus 3 fallbacks. PepPrCLIP ranks ~100K candidates per target by CLIP binding score; I take the top 2 per target. PeptiVerse runs as a HuggingFace web app and returns developability predictions per peptide.
$\text{OD}_{600}$ growth inhibition assay. Standard broth microdilution. I dilute overnight cultures of each organism to ~5 × 10⁵ CFU/mL in Mueller–Hinton broth, dispense 100 µL per well of a 96-well flat-bottom plate, then add 5 µL of crude CFPS reaction to each well. After overnight incubation at 37°C, I read absorbance at 600 nm using a plate reader. Three biological replicates per construct (45 reactions for 15 constructs, plus 9 control reactions) enable statistical comparison. The same CFPS reactions are split across two plates (one per organism) so expression variability is controlled between the two bacterial targets.
Synergy measurement uses the same $\text{OD}_{600}$ readout but with modified CFPS input: two DNA templates at half-dose (25 to 50 ng each) in a single 20 µL reaction, alongside single-agent half-dose controls. I then calculate FICI from the resulting inhibition values, separately for each organism. Cross-method pairings (e.g., AMP-Diffusion generalist + PepPrCLIP targeted binder) are prioritized because they test the central synergy hypothesis most directly.
Gram-selectivity measurement is a derived metric; no separate experiment is needed. By reading the same CFPS reactions against both organisms in parallel, every peptide’s selectivity ratio falls out of the primary screen automatically.
Q3. Technologies
Cell-free protein synthesis (CFPS). The Ginkgo Bioworks E. coli cell-free kit (BL21 Star DE3 lysate, T7 RNA polymerase-driven) is the expression platform. Linear Twist gene fragments serve directly as templates, with no cloning required. Each construct carries a T7 promoter, strong RBS, the codon-optimized peptide ORF, and a T7 terminator. NEBExpress GamS Nuclease Inhibitor (NEB #P0774S) is added at ~0.6 $\mu\text{g}$ per 20 $\mu\text{L}$ reaction to protect linear DNA from RecBCD exonuclease degradation in the crude lysate. Reactions run at 30°C for 4 hours.
Synthetic gene fragments (Twist Bioscience). 15 linear DNA constructs ($\geq 300$ bp each, padded with inert flanking sequence to meet Twist’s minimum) are ordered as gene fragments. This is DNA synthesis, not cloning; the fragments arrive ready for direct use in CFPS.
$\text{OD}_{600}$ plate reader (spectrophotometry). A standard microplate reader measuring optical density at 600 nm is the primary analytical instrument. It quantifies bacterial growth in 96-well format, enabling high-throughput comparison of all peptides and combinations across both organisms in a single read.
AI/ML peptide design tools. AMP-Diffusion (diffusion-based generative model for antimicrobial peptide sequences), PepPrCLIP (CLIP-based peptide design using the 650M-parameter ESM-2 protein language model, run on Google Colab with GPU), and potentially MadSBM (latent-space interpolation between known AMPs). These are the computational technologies that generate the candidate peptides before any synthesis.
Codon optimization. Selected peptide sequences are reverse-translated and codon-optimized for E. coli expression (using IDT or Benchling codon optimization tools) to maximize translational efficiency in the BL21-derived CFPS lysate.
Standard microbiology (Mueller–Hinton broth microdilution). This CLSI-standard antimicrobial susceptibility testing method uses the two reference strains E. coli ATCC 25922 and B. subtilis ATCC 6633, both standard quality-control organisms for susceptibility testing, in 96-well format.
Part I: Molecular Weight
Q1. Theoretical molecular weight of eGFP
The full eGFP construct (247 amino acids, including the C-terminal LE linker and $\text{His}_6$ tag) was submitted to ExPASy ProtParam:
The average molecular weight (28,006.60 Da) is the reference value used below for accuracy calculations. This theoretical value does not account for eGFP chromophore maturation, which removes approximately 20 Da (one water loss + one oxidation) via autocatalytic cyclization of residues Thr65–Tyr66–Gly67. The mature chromophore mass would be closer to $28{,}006.60 - 20.03 \approx 27{,}986.57$ Da.
Q2. Molecular weight from the LC-MS charge state envelope
In electrospray ionization, a protein of mass $M$ carrying $z$ protons (each of mass $H = 1.00728$ Da) appears at:
$$\frac{m}{z} = \frac{M + z \cdot H}{z}$$
For two adjacent peaks where Peak A has charge $z$ and Peak B has charge $z - 1$:
$$z = \frac{(m/z)_B - H}{(m/z)_B - (m/z)_A}$$
and then:
$$M = z \left[\left(\frac{m}{z}\right)_A - H\right]$$
Worked example, using the peaks at $m/z$ = 903.7148 (Peak A) and 933.8044 (Peak B):
This is relative to the average theoretical mass from ProtParam. Compared to the monoisotopic mass (27,988.96 Da), the error drops to $|27{,}984.0 - 27{,}988.96|/27{,}988.96 \approx 177$ ppm. Accounting for the ~20 Da chromophore maturation ($M_\text{theory,mature} \approx 27{,}986.6$ Da), agreement improves to roughly 90 ppm. The remaining discrepancy is well within the expected accuracy of intact-protein ESI-MS deconvolution.
Q3. Charge state from the zoomed-in peak
Whether the charge state can be read directly from a single peak depends on mass resolving power. For eGFP at $z \approx 30$, adjacent isotope peaks in the isotopic envelope are separated by:
Resolving this requires $R = m/z / \Delta \approx 1{,}000 / 0.033 \approx 30{,}000$. If the instrument (e.g., Orbitrap) achieves this resolution, the isotope peaks are resolved and the charge state can be determined by:
$$z = \frac{1.003}{\text{spacing between adjacent isotope peaks}}$$
If the zoomed-in inset shows resolved isotope peaks with spacing $\sim$0.033 Da, then $z = 1.003/0.033 \approx 30$, confirming the charge state directly.
If the instrument resolution is insufficient (e.g., a low-resolution QTOF), the isotope peaks merge into a single broad hump and the charge state cannot be determined from that peak alone, so the adjacent-charge-state method (Q2) must be used instead.
Part II: Secondary and Tertiary Structure
Q1. Native vs. denatured protein conformations in MS
In denatured ESI-MS (Figure 2, top panel), the protein is unfolded by organic solvent and acid. The extended chain exposes many basic residues (Lys, Arg, His) to solution, each of which can accept a proton. This produces a broad charge state distribution at high charge states ($z \approx 27$ to $37$ for eGFP), so the peaks appear at relatively low $m/z$ values (~750 to 1050). The wide, multi-peak envelope is a hallmark of a disordered, extended conformation.
In native ESI-MS (Figure 2, bottom panel), the protein is sprayed from a near-physiological buffer (typically ammonium acetate, pH ~7). The protein remains compactly folded, burying most ionizable side chains in its interior. This results in fewer, lower charge states ($z \approx 9$ to $11$ for eGFP), so the peaks appear at high $m/z$ values (~2500 to 3100). The narrow charge state distribution (often only two or three peaks) reflects the compact, globular conformation.
Key insight: the charge state distribution is a proxy for protein conformation. Compact → fewer charges → higher $m/z$. Unfolded → more charges → lower $m/z$.
Q2. Charge state in the native mass spectrum at ~2800 m/z
Yes. At $m/z \approx 2800$ for a protein of mass ~28,000 Da, the charge state is:
Counting approximately 10 isotope peaks per 1 Da interval, or measuring the spacing directly and computing $z = 1.003 / \Delta$, confirms $z = 10$. Resolving this spacing requires $R = 2800 / 0.10 = 28{,}000$, which is achievable on modern Orbitrap and FT-ICR instruments.
As a consistency check: $(28{,}006.6 + 10 \times 1.007)/10 = 2{,}801.7$ $m/z$, which matches the observed peak position.
Part III: Peptide Mapping
Q1. Number of Lysines (K) and Arginines (R) in eGFP
The eGFP construct contains 20 Lysines (K) and 6 Arginines (R), for a total of 26 tryptic cleavage sites.
Using ExPASy PeptideMass with trypsin (cleaves after K and R, no missed cleavages), the 26 cleavage sites produce 27 tryptic peptides.
Of these 27, 19 peptides have a monoisotopic $[\text{M+H}]^+ > 500$ Da and are likely to be detected by LC-MS. The remaining 8 are very small (1 to 4 residues) and typically fall below the practical detection or retention limit.
Approximately 19 to 21 peaks, depending on the intensity threshold and whether closely spaced doublets (e.g., 1.80 / 1.85 and 3.53 / 3.59) are counted as one or two.
Q4. Does the peak count match the predicted peptide count?
The counts roughly agree but are not identical. We predicted 19 peptides with $[\text{M+H}]^+ > 500$ Da and observe ~19 to 21 chromatographic peaks. The differences arise from:
Very small peptides not detected. R (175 Da), QK (275 Da), TR (276 Da), IR (288 Da), and a few other small fragments elute in the void volume or fall below the detection limit.
Co-elution. Peptides with similar hydrophobicity may co-elute and appear as a single peak.
Modifications or partial cleavages. Oxidized or miscleaved forms can produce extra peaks.
Overall, the observed ~19 to 21 peaks are consistent with the predicted 19 detectable tryptic peptides.
Q5. Identify the peptide in Figure 5b
The dominant peak in Figure 5b is at $m/z = 525.76712$. A second peak is visible at $m/z = 1050.52438$.
The relationship between these two peaks reveals the charge:
The 525.767 peak is the doubly charged $[\text{M+2H}]{2+}$ ion, and the 1050.524 peak is the singly charged $[\text{M+H}]{+}$ ion. Therefore $z = 2$.
$$[\text{M+H}]^+ = z \times (m/z) - (z-1) \times H = 2 \times 525.76712 - 1 \times 1.00728 = \mathbf{1050.527 ;\text{Da}}$$
Confirmed by the direct singly charged peak at $m/z = 1050.524$ Da.
Q6. Identify the peptide and calculate ppm accuracy
Comparing the observed $[\text{M+H}]^+ = 1050.527$ Da against PeptideMass output, the match is peptide FEGDTLVNR (residues 115–123), with a predicted monoisotopic $[\text{M+H}]^+ = 1050.5214$ Da.
Both values represent excellent mass accuracy, typical of Orbitrap instruments (specification $\leq 5$ ppm).
Q7. Sequence coverage from peptide mapping
From Figure 6, 88% of the eGFP sequence was identified with high confidence. The unconfirmed 12% corresponds primarily to the very small tryptic fragments (R, QK, TR, IR) that are too small to be retained or detected, and possibly the large 41-residue peptide HNIEDGSVQLAD...SALSK, which may have had poor chromatographic recovery.
Part IV: KLH Oligomers by CDMS
Identify the KLH oligomeric species (Figure 7)
Keyhole limpet hemocyanin (KLH) is built from two subunit types: a 7-functional-unit (7FU) monomer of 340 kDa and an 8-functional-unit (8FU) monomer of 400 kDa. These assemble into decamers and higher-order multimers.
CDMS Peak (MDa)
Assignment
Expected Mass
Calculation
Match
3.4
7FU Decamer
3.40 MDa
$10 \times 340;\text{kDa}$
exact
4.01
8FU Decamer
4.00 MDa
$10 \times 400;\text{kDa}$
0.3%
8.33
8FU Didecamer
8.00 MDa
$20 \times 400;\text{kDa}$
4.1%
12.67
8FU 3-Decamer
12.00 MDa
$30 \times 400;\text{kDa}$
5.6%
8FU 4-Decamer
16.00 MDa
$40 \times 400;\text{kDa}$
not visible
The 7FU Decamer ($10 \times 340 = 3{,}400$ kDa) matches the 3.4 MDa peak precisely. The 8FU Didecamer ($20 \times 400 = 8{,}000$ kDa) corresponds to the ~8.33 MDa peak, and the 8FU 3-Decamer ($30 \times 400 = 12{,}000$ kDa) corresponds to the ~12.67 MDa peak. The slight upward mass shifts in the didecamer and 3-decamer peaks likely reflect associated solvent, salt, or lipid.
The 8FU 4-Decamer ($40 \times 400 = 16{,}000$ kDa = 16.0 MDa) is not clearly visible on the spectrum, suggesting it is either absent from this preparation, present at very low abundance, or beyond the measured mass range.
Additional peaks visible in Figure 7 at ~0.79 and ~1.52 MDa likely correspond to sub-decameric fragments (dimers and tetramers of 7FU or 8FU subunits).
Part V: Did I Make GFP?
Property
Theoretical
Observed (Intact LC-MS)
PPM Error
Molecular weight (kDa)
28.007
~27.984
~820
Peptide mapping coverage
100%
88%
—
Peptide FEGDTLVNR $[\text{M+H}]^+$ (Da)
1050.5214
1050.5270
~5
Conclusion: Yes. The intact mass agrees with the theoretical eGFP mass to within ~820 ppm (largely explained by GFP chromophore maturation, which removes ~20 Da and is not reflected in the ProtParam theoretical value). The tryptic peptide map confirms 88% of the amino acid sequence with sub-5 ppm peptide mass accuracy. Together, the intact mass and sequence-level peptide coverage provide strong orthogonal confirmation that the expressed protein is eGFP.
Week 11 HW: Bioproduction & Cloud Labs
Cell-Free Protein Synthesis Lab
Q1. Roles of each component in the 20-hour NMP-Ribose-Glucose master mix
E. coli lysate
BL21 (DE3) Star Lysate. Provides the core transcription / translation machinery (ribosomes, tRNAs, aminoacyl-tRNA synthetases, initiation, elongation, and release factors, and metabolic enzymes). The “Star” strain carries an RNase E mutation that stabilizes mRNA, and the (DE3) lysogen supplies T7 RNA Polymerase for high-level transcription from T7 promoters.
Salts and buffer
Component
Role
Potassium glutamate
Supplies $\text{K}^+$ ions that are critical for ribosome assembly, tRNA binding, and translation fidelity. Glutamate is the preferred counter-ion because $\text{Cl}^-$ inhibits many lysate enzymes.
HEPES-KOH pH 7.5
Zwitterionic buffer that holds the reaction near physiological pH, preventing acidification as glycolysis and ATP hydrolysis generate protons over the long incubation.
Magnesium glutamate
$\text{Mg}^{2+}$ is an essential cofactor for RNA polymerase, ribosomes (stabilizes rRNA tertiary structure and the small/large subunit interface), and virtually every NTP-using enzyme in the system.
Potassium phosphate (mono : dibasic, 1.6 : 1)
Provides inorganic phosphate ($\text{P}_\text{i}$) that feeds substrate-level phosphorylation in glycolysis to regenerate ATP from ADP. The dibasic : monobasic ratio sets the buffering pH.
Energy and nucleotide system
Component
Role
Ribose
Phosphorylated by ribokinase to ribose-5-phosphate, which feeds the pentose phosphate pathway and serves as a precursor for nucleotide salvage and regeneration of NTPs from NMPs.
Glucose
Primary carbon and energy source. Glycolysis converts it to pyruvate, generating ATP and NADH that drive sustained energy regeneration over the 20-hour reaction.
AMP, CMP, UMP
Nucleoside monophosphate precursors that endogenous kinases (NMP and NDP kinases) phosphorylate to ATP, CTP, and UTP for transcription. Cheaper and more stable than supplying NTPs directly.
GMP
Listed at 0 mM in this recipe. GTP is instead generated from guanine via the salvage pathway, avoiding the cost of GMP and reducing inhibitory phosphate accumulation.
Guanine
Converted to GMP by HPT (hypoxanthine / guanine phosphoribosyltransferase) using PRPP, then phosphorylated to GTP for transcription and translation. GTP powers initiation, elongation, and release.
Translation mix (amino acids)
Component
Role
17 amino acid mix
Supplies 17 of the 20 proteinogenic amino acids used as substrates by aminoacyl-tRNA synthetases to charge tRNAs for protein synthesis.
Tyrosine (pH 12)
Tyrosine is poorly soluble near neutral pH, so it is prepared in a high-pH stock and added separately to keep it in solution at the correct concentration.
Cysteine
Added separately because cysteine readily oxidizes to cystine (and forms disulfides), so it requires its own fresh stock to deliver reduced, usable amino acid into the reaction.
Additives
Nicotinamide is a precursor for $\text{NAD}^+ / \text{NADH}$ regeneration via the salvage pathway. $\text{NAD}^+$ is essential for the GAPDH step of glycolysis, which is required for ATP regeneration from glucose during the long incubation.
Backfill
Nuclease-free water brings the reaction to final volume while ensuring no contaminating RNases or DNases degrade the DNA template, mRNA, or tRNAs during the extended incubation.
Q2. Differences between the 1-hour PEP/NTP and 20-hour NMP-Ribose-Glucose master mixes
The PEP/NTP system is engineered for speed: it directly supplies the four high-energy NTPs (ATP, GTP, CTP, UTP) plus phosphoenolpyruvate (PEP-Mono) and maltodextrin as fast-discharging energy donors, giving an immediate burst of transcription and translation that runs out within ~1 hour. The NMP-Ribose-Glucose system instead supplies cheap low-energy precursors (NMPs, ribose, glucose, guanine) and lets the lysate’s native metabolism (glycolysis fueled by phosphate buffer and $\text{NAD}^+$ regenerated from nicotinamide) slowly regenerate NTPs over ~20 hours, trading peak rate for sustained yield, lower cost, and avoidance of inhibitory byproducts like accumulated phosphate. As a result, the 1-hour mix also relies on extra small-molecule boosters (spermidine, DMSO, cAMP, NAD, folinic acid) to maximize a short burst, while the 20-hour mix’s design philosophy is metabolic self-sufficiency for long-running, sustainable protein production.
Q3. Properties of the six fluorescent proteins that affect CFPS
sfGFP (superfolder GFP)
Engineered specifically for rapid, robust folding (maturation ~14 min) even when fused to misfolded partners, which makes it nearly ideal for CFPS where lysate chaperone capacity is limited. Like all Aequorea-lineage GFPs, however, chromophore maturation requires molecular oxygen, so sealed or anaerobic reaction wells will cap final fluorescence regardless of how much protein is translated.
mRFP1
A first-generation monomeric DsRed derivative with slow, two-step oxygen-dependent maturation (on the order of ~1 hour or more), so a substantial fraction of translated mRFP1 in a short cell-free run will be present but non-fluorescent. It is also moderately acid-sensitive ($\text{p}K_a \approx 4.5$) and the dimmest of the six (low quantum yield, ~0.25). Both pH drift and incomplete maturation can suppress readout.
mKO2
A monomeric coral (Fungia) FP with reasonably fast maturation (~30 to 60 min) and good photostability, but it is acid-sensitive ($\text{p}K_a \approx 5.5$). As glycolysis acidifies the CFPS reaction over 36 hours, mKO2 fluorescence is progressively quenched even if protein levels keep rising. Like all Anthozoa-derived FPs, its red-shifted chromophore requires a second oxidation step that consumes $\text{O}_2$.
mTurquoise2
Aequorea-lineage cyan FP with the highest quantum yield among CFPs (~0.93), fast maturation, and excellent pH stability ($\text{p}K_a \approx 3.1$). Per-molecule readout is very strong and largely insensitive to reaction acidification. Folding is efficient in E. coli lysate, making it one of the most forgiving reporters for cell-free conditions.
mScarlet-I
A synthetic-template monomeric red FP whose “I” variant trades a small drop in quantum yield for dramatically faster maturation (~36 min vs. ~174 min for mScarlet), which is critical in CFPS where signal accumulation should track translation rather than lag behind it. It is still $\text{O}_2$-dependent (two-step Anthozoa-type chromophore) and benefits from sustained energy regeneration over long incubations.
Electra2
A 2022 blue FP derived from mRuby3 (Anthozoa / eqFP611 lineage), engineered via dual bacterial+mammalian screening for high intracellular brightness and efficient folding in the E. coli cytoplasm. This is directly relevant to lysate-based CFPS. It inherits the two-step oxygen-dependent maturation of its Anthozoa parent, so $\text{O}_2$ availability and incubation time both gate final readout.
Q4. Hypothesis: improving mRFP1 readout over a 36-hour reaction
Variable
Change
Protein
mRFP1
Reagent change
Increase HEPES-KOH (pH 7.5) from 45 mM to ~80 mM (matching the 1-hour PEP/NTP mix).
Secondary tweak
Slightly raise magnesium glutamate from 7.0 mM toward ~8 to 9 mM.
Rationale and expected effect. mRFP1’s two limiting properties in CFPS are slow oxygen-dependent maturation and moderate acid sensitivity. Over 36 hours, glycolysis of the supplied glucose and ribose accumulates pyruvate, lactate, and inorganic phosphate, dropping the reaction pH. This both quenches the existing mRFP1 chromophore (acid pKₐ ≈ 4.5) and slows the late oxidation step of chromophore maturation, which proceeds best near neutral pH. Raising HEPES nearly doubles buffering capacity, keeping the reaction close to pH 7.5 deep into the incubation. That preserves fluorescence of already-matured mRFP1 and gives the slow-maturing fraction the neutral-pH window it needs to finish oxidizing. The small magnesium bump offsets the extra Mg²⁺ chelation imposed by the higher buffer and phosphate concentrations, keeping ribosomes and NMP / NDP kinases active so translation continues feeding new mRFP1 molecules into the maturation pipeline through the full 36 hours rather than stalling at hour 10 to 15.
Proposed control. Test the elevated-HEPES condition against mTurquoise2 (pH-stable, fast-maturing) in parallel. If the hypothesis is correct, the buffer boost should help mRFP1 substantially more than mTurquoise2, isolating the pH / maturation effect from a generic translation-yield effect.