Week 10:Advanced Imaging & Measurement Technology
Final Project
- Please identify at least one (ideally many) aspect(s) of your project that you will measure. It could be the mass or sequence of a protein, the presence, absence, or quantity of a biomarker, etc.
For my “Sentinel Microbes” project, which aims to detect foreign pathogens in the gut, the most critical aspect to measure is the quantitative expression of the reporter protein. When the engineered microbes encounter a specific pathogen (like Salmonella), they trigger a genetic circuit to produce a visual signal. I need to measure the concentration and identity of this protein to confirm that the “Detected!” signal is accurate and strong enough to be noticed.
- Please describe all of the elements you would like to measure, and furthermore describe how you will perform these measurements.
I plan to measure three main elements:
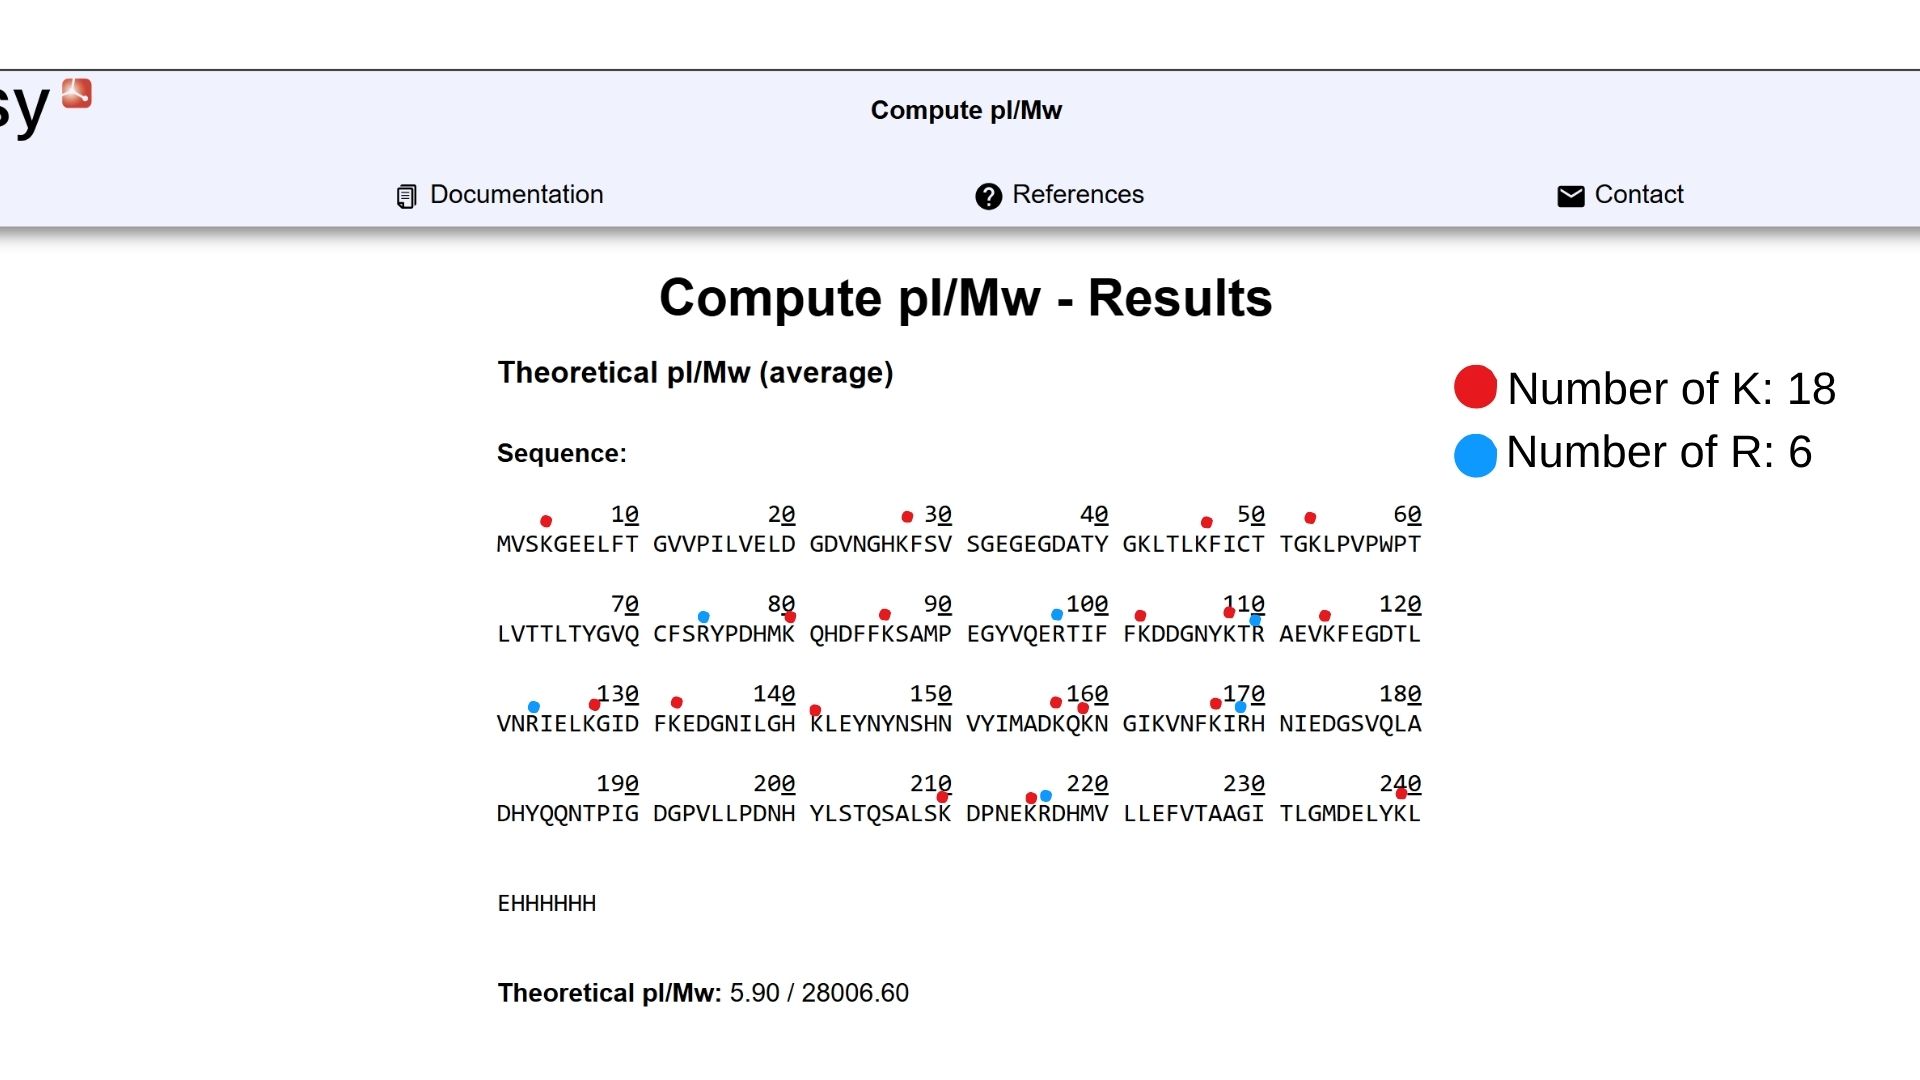
  - Reporter Protein Fidelity: To ensure the microbe is producing the exact reporter protein (e.g., eGFP) without mutations, I will measure its molecular weight.

 - Detection Sensitivity: I will measure the threshold concentration of the pathogen needed to activate the reporter. This is done by exposing the microbes to varying amounts of the "foreign substance" and recording the output intensity.

- Kill-Switch Efficiency: I will measure the degradation of the microbe's DNA and the presence of "toxin" peptides once the detection task is complete to verify that the biocontainment system worked.
What are the technologies you will use (e.g., gel electrophoresis, DNA sequencing, mass spectrometry, etc.)? Describe in detail.
Mass Spectrometry (Waters Xevo G3 QTof MS): I will use LC-MS to perform Intact Mass Analysis and Peptide Mapping. This provides the “molecular fingerprint” of the reporter proteins and ensures they are correctly synthesized in the harsh gut environment.
Fluorometry (Microplate Readers): This technology will be used to quantify the fluorescence intensity of the reporter signals, allowing me to calibrate the sensitivity of the biosensor.
Opentrons Automation: I will utilize the Opentrons OT-2 robot to automate the sampling and serial dilutions of pathogens. This ensures that my measurements are highly reproducible and that the simulated gut environment is precisely controlled.
DNA Sequencing (NGS): I will use sequencing to monitor the stability of the synthetic genetic circuits within the microbes over multiple generations to prevent “genetic drift.”
Waters Part I — Molecular Weight
Waters Part II — Secondary/Tertiary structure
- Based on learnings in the lab, please explain the difference between native and denatured protein conformations. For example, what happens when a protein unfolds? How is that determined with a mass spectrometer? What changes do you see in the mass spectrum between the native and denatured protein analyses (Figure 2)? The primary difference between native and denatured protein conformations is the accessibility of ionizable residues.
Native proteins are tightly folded, meaning most of the basic amino acid residues are buried inside the protein core and cannot be easily protonated.
When a protein unfolds (denatures), it loses its 3D structure and becomes an open, linear chain. This exposes many more residues to the solvent, allowing them to pick up more positive charges. In a mass spectrometer, this is determined by observing the charge state distribution. In Figure 2, the denatured protein (top) shows peaks at much lower m/z values compared to the native protein (bottom). This shift occurs because m/z is an inverse relationship; as the charge (z) increases due to unfolding, the m/z ratio decreases. Additionally, the denatured state shows a much broader distribution of peaks because the unfolded chain can exist in many different charge states.
- Zooming into the native mass spectrum of eGFP from the Waters Xevo G3 QTof MS (see Figure 3), can you discern the charge state of the peak at ~2800 m/z? What is the charge state? How can you tell?
Yes, I can discern the charge state of the peak at ~2800 m/z by analyzing the isotopic spacing shown in the zoomed-in inset of Figure 3.To determine the charge state (z), I look at the distance between the individual isotope peaks. In the inset, the peaks are approximately 0.1 m/z units apart (for example, moving from 2545.03 to 2545.13). Since isotopes of a protein differ by approximately 1 Dalton (1 Da) in mass, we use the formula: - Delta m/z ={1}/{z} Given that the spacing (Delta m/z) is 0.1, the calculation is 0.1 = 1/z, which results in z = 10. Therefore, the charge state of this protein peak is +10.
Waters Part III — Peptide Mapping - primary structure Assignees for this section
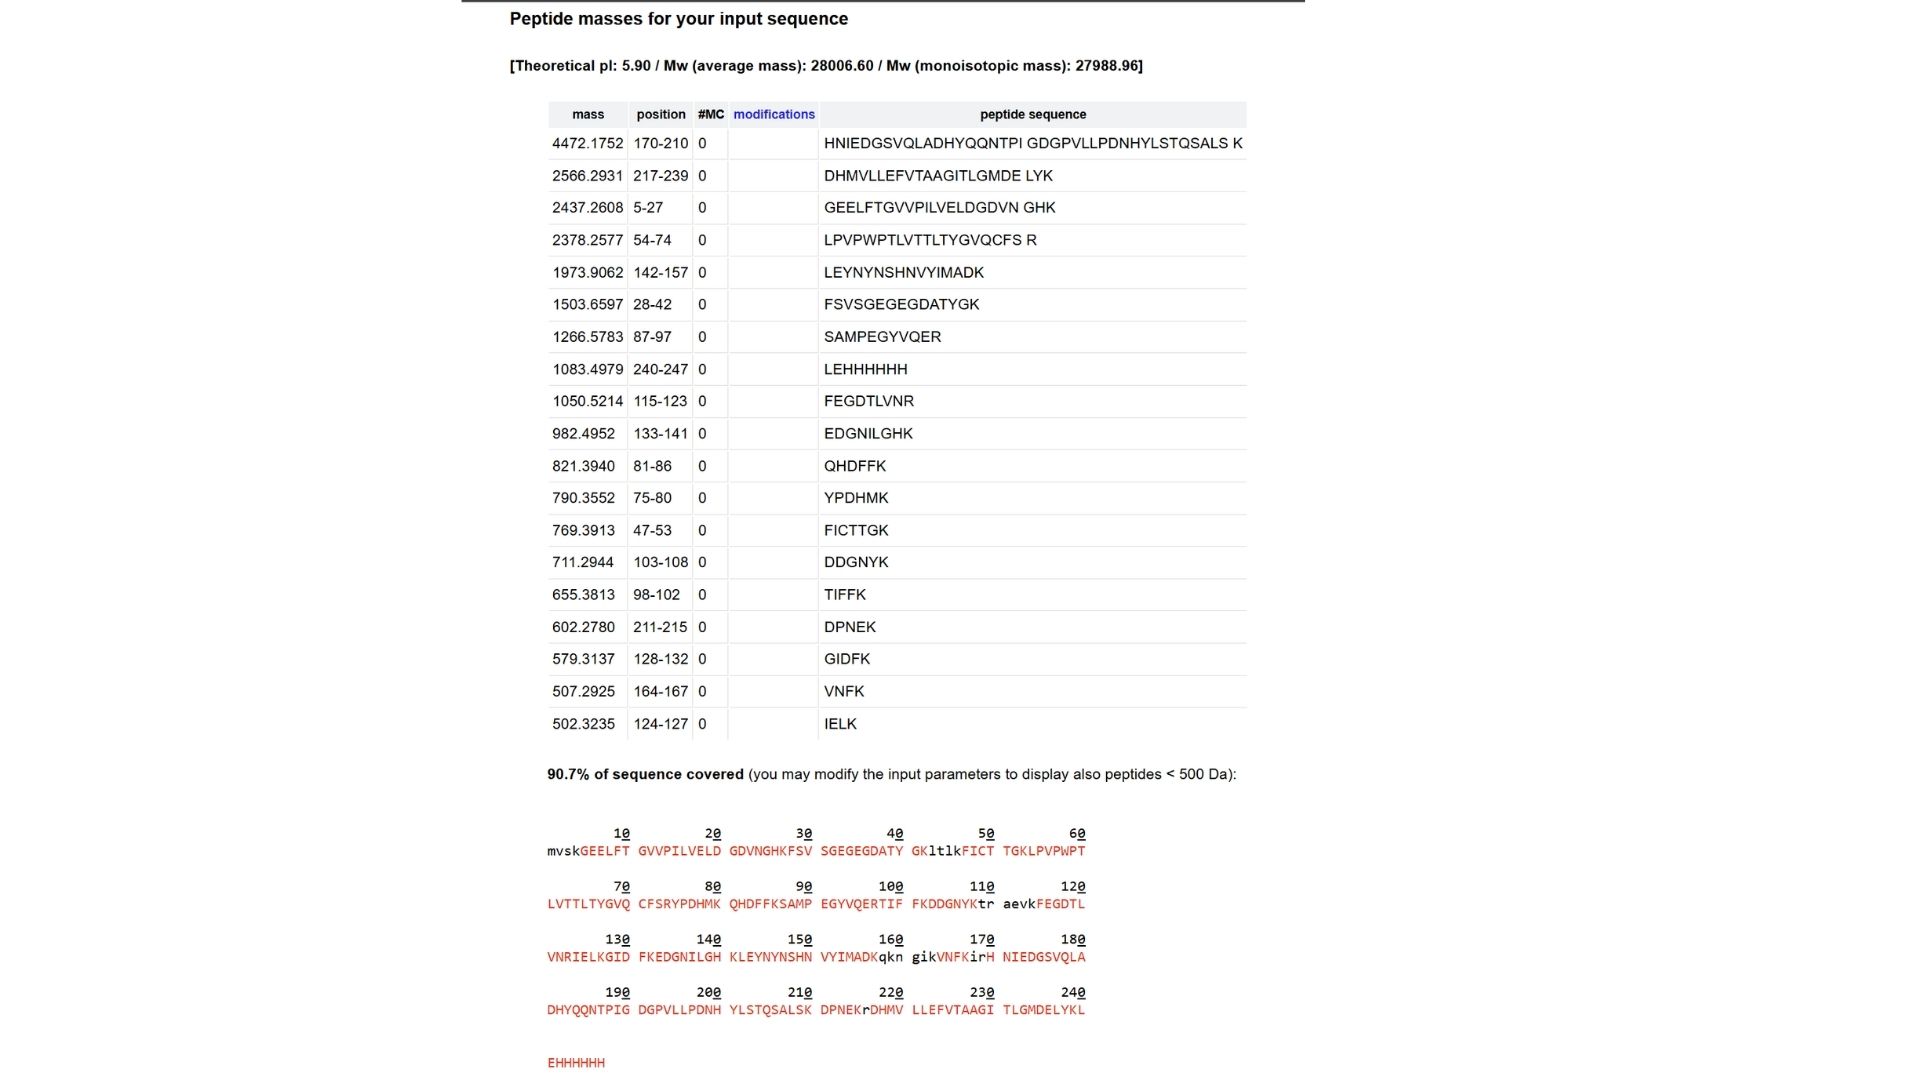
Based on the LC-MS data for the Peptide Map data generated in lab (please use Figure 5a as a reference) how many chromatographic peaks do you see in the eGFP peptide map between 0.5 and 6 minutes? You may count all peaks that are >10% relative abundance.
Looking at Figure 5a, between the retention times of 0.5 and 6 minutes, I can identify approximately 15 to 17 chromatographic peaks that are above 10% relative abundance.
Assuming all the peaks are peptides, does the number of peaks match the number of peptides predicted from question 2 above? Are there more peaks in the chromatogram or fewer?
Usually, the number of observed peaks is fewer than the total number of predicted peptides from the PeptideMass tool. This is because some peptides might be too small to be retained, some may co-elute (come out at the same time), and some may not ionize well in the mass spectrometer.
- Identify the mass-to-charge (m/z) of the peptide shown in Figure 5b. What is the charge (z) of the most abundant charge state of the peptide (use the separation of the isotopes to determine the charge state). Calculate the mass of the singly charged form of the peptide ([M+H]) based on its m/z and z.
- m/z of the most abundant peak: According to Figure 5b, the most abundant peak is at 525.76712.
- Charge state (z): Looking at the inset, the isotopic spacing is 0.5 m/z units (525.76 to 526.25). Using the formula Delta m/z = 1/z, we find that z = 2.
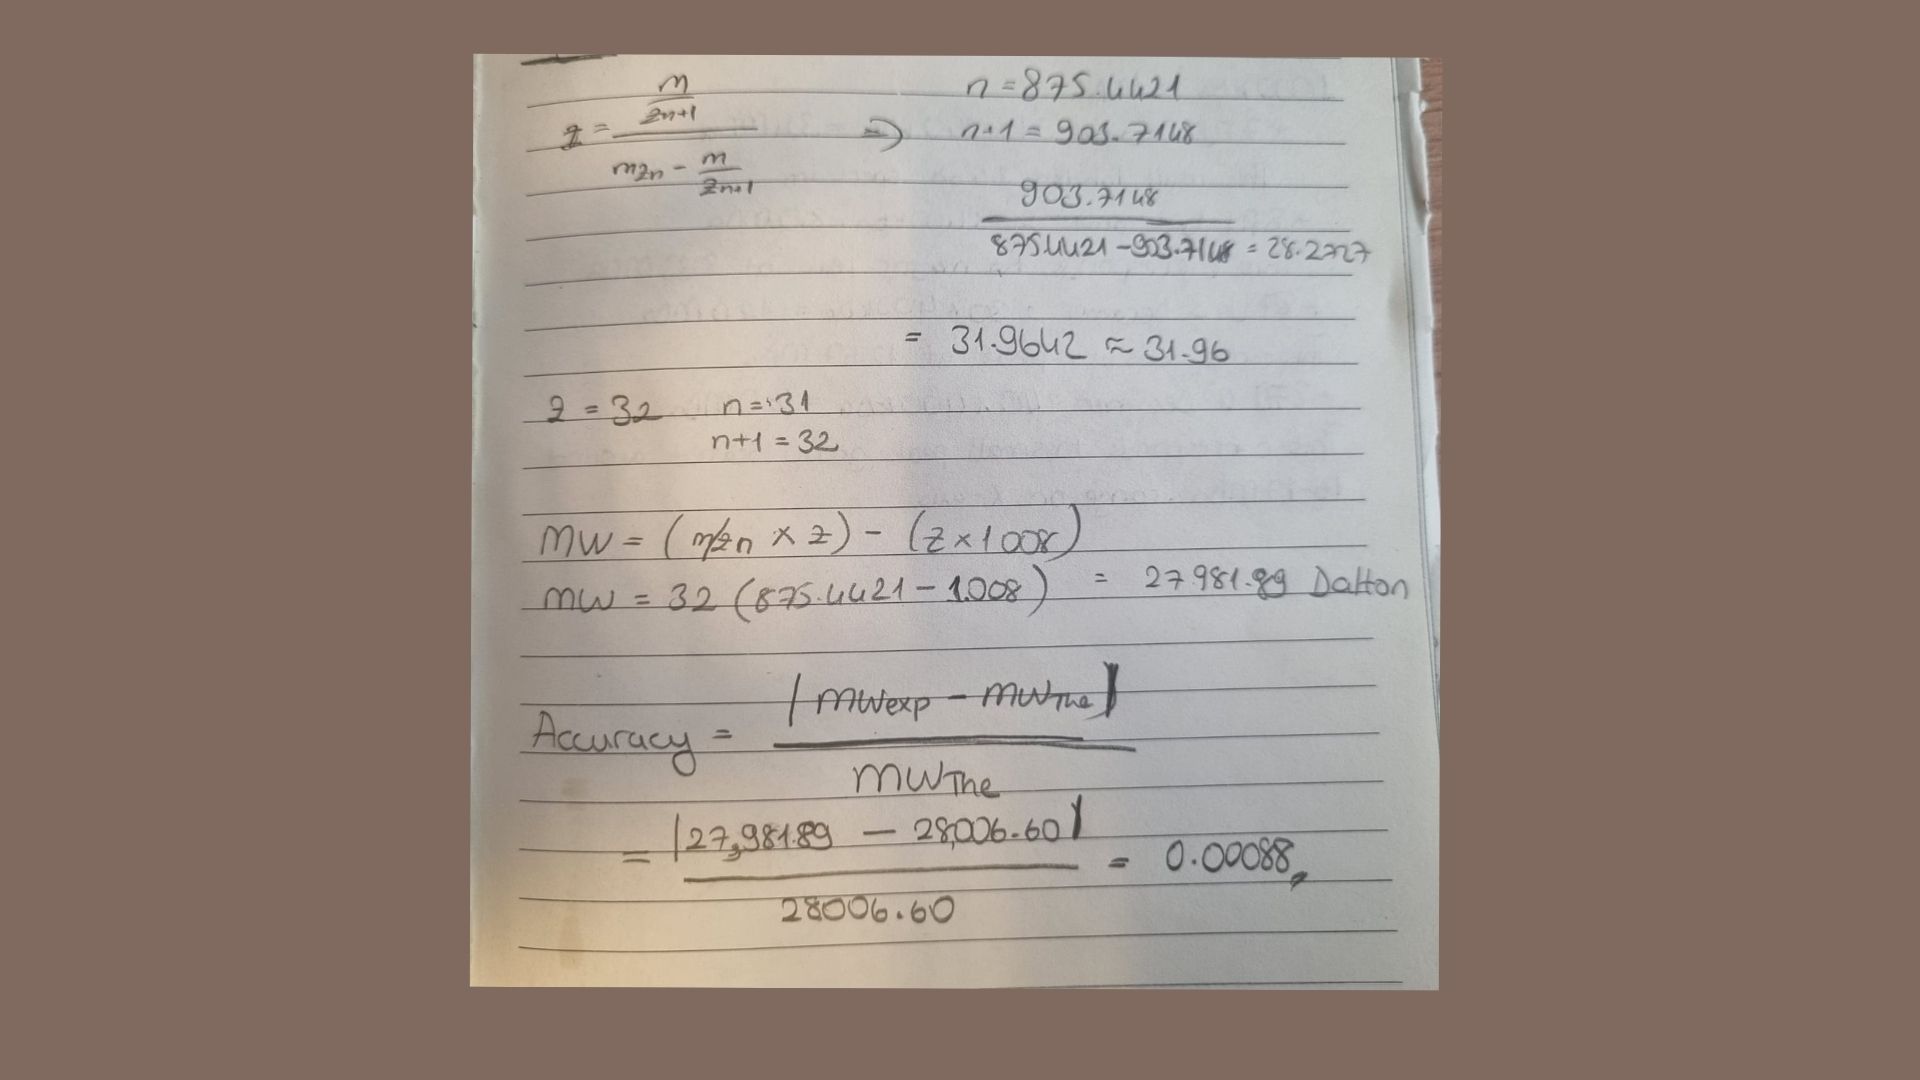
- Calculation of singly charged mass ([M+H]⁺):To find the [M+H] (where z=1), we first find the neutral mass (M) and add one proton. Neutral Mass (M) = (Observed\ m/z \times z) - (z \times 1.008)$$M = (525.76712 \times 2) - (2 \times 1.008) = 1051.53424 - 2.016 = 1049.51824 Da. So, $[M+H]^+ = 1049.51824 + 1.008 = 1050.52624\ Da.
Identify the peptide based on comparison to expected masses in the PeptideMass tool. What is mass accuracy of measurement? Please calculate the error in ppm. (Recall that Accuracy Formula)
By comparing the calculated mass (1050.52 Da) to the PeptideMass results, this matches the eGFP peptide sequence: “LPDNHYLSTQSALSK”. And ppm calculation is:7.6ppm.
What is the percentage of the sequence that is confirmed by peptide mapping? (see Figure 6)
Based on Figure 6, the amino acid coverage map shows that 88% of the eGFP sequence is confirmed by the peptide mapping data.
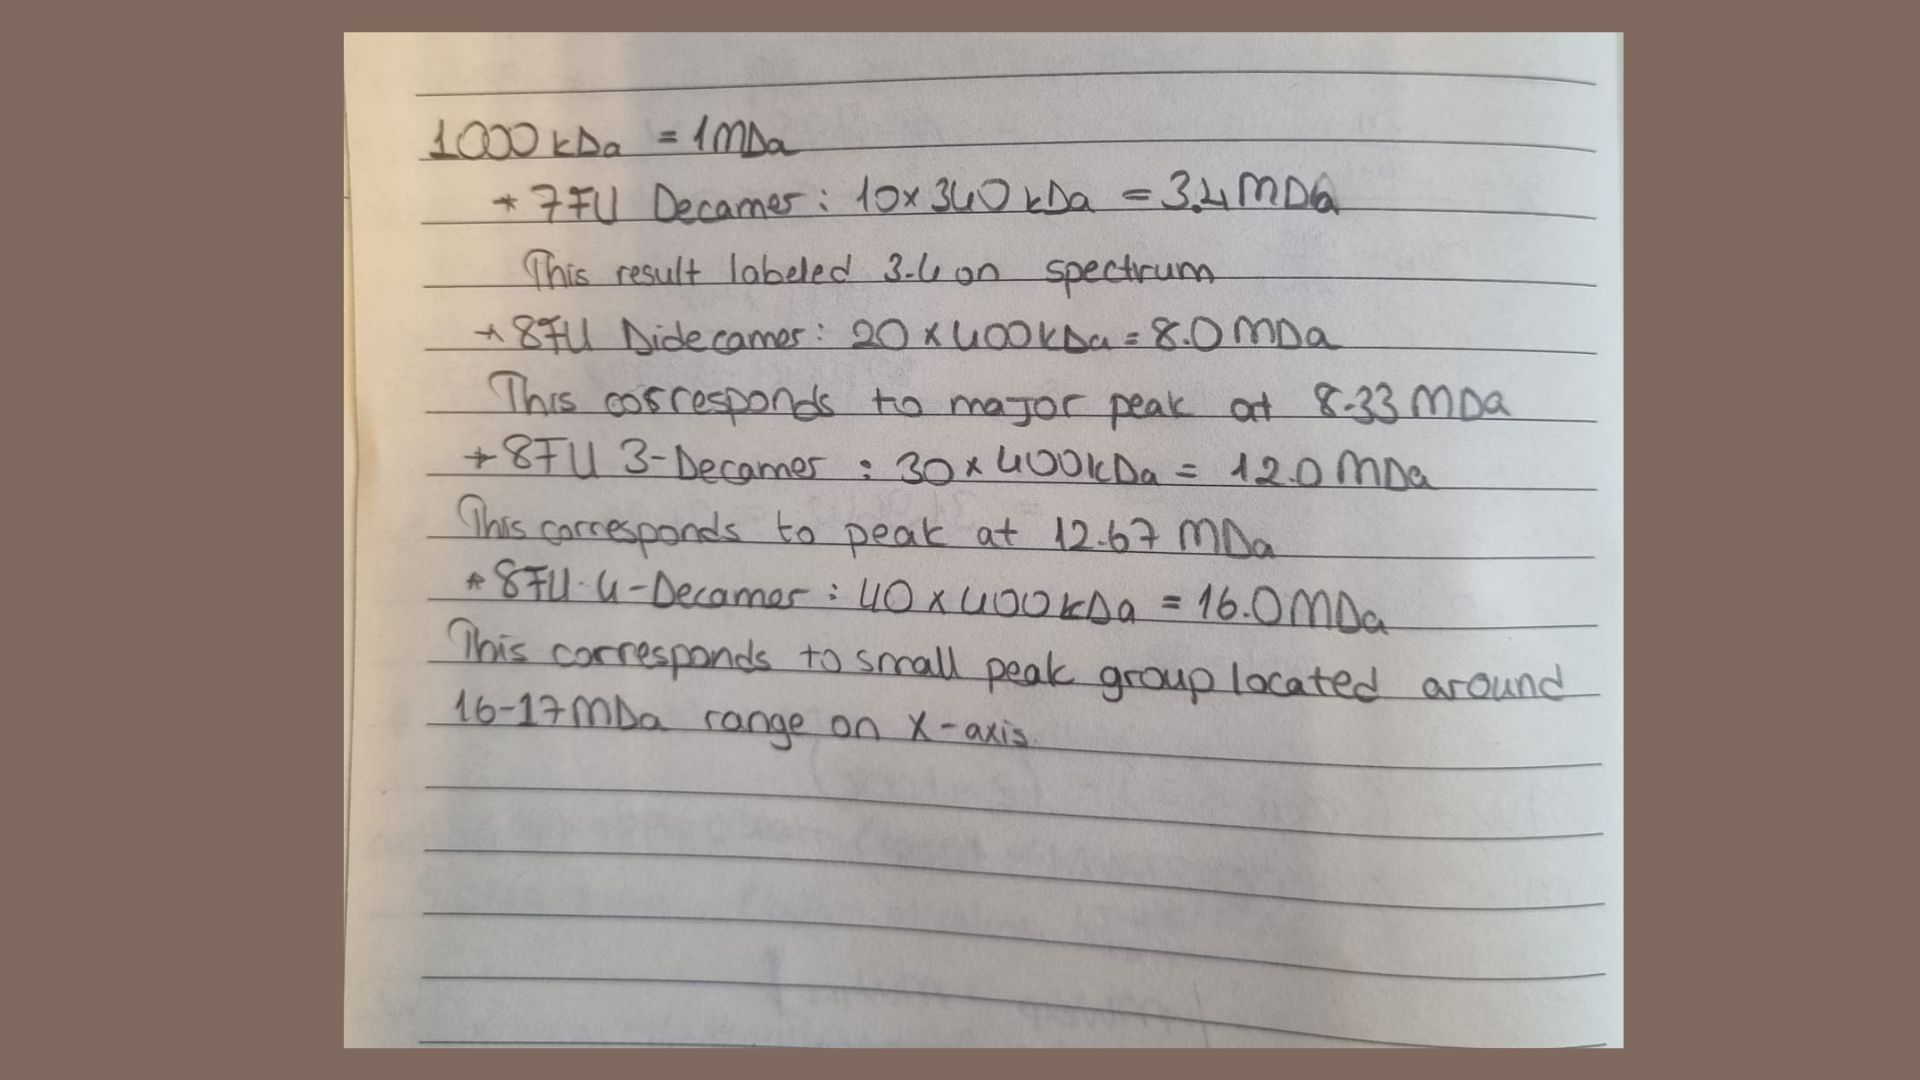
Waters Part IV — Oligomers
To identify the oligomeric species, we multiply the subunit mass by the number of units in the complex and match them with the peaks on the CDMS spectrum (Figure 7).
Waters Part V — Did I make GFP?
| Theoritical | Observed/ Measured on the Intact LC-MS | ppm Mass Error | |
|---|---|---|---|
| Molecular Weight | 27.935 kDa | 27.981 kDa | 1600 ppm |