Week 10 — Advanced Imaging & Measurement Technology
Homework: Final Project
For your final project:
Please identify at least one (ideally many) aspect(s) of your project that you will measure. It could be the mass or sequence of a protein, the presence, absence, or quantity of a biomarker, etc.
Please describe all of the elements you would like to measure, and furthermore describe how you will perform these measurements.
What are the technologies you will use (e.g., gel electrophoresis, DNA sequencing, mass spectrometry, etc.)? Describe in detail.
1. Aspects of the project to be measured
This project requires confirmation that the engineered E. coli system successfully produces both functional melanin and the PprI protein, and that these biomolecules provide protection against gamma radiation. Therefore, six key parameters will be measured.
Melanin concentration. The first question is: how much melanin is actually being produced? Quantifying melanin concentration is essential for comparing different culture conditions, identifying the optimal growth parameters, and determining whether the production yield is sufficient for practical applications. Without this measurement, there is no way to know if changes to the protocol actually improve production or if the system is failing.
Melanin identity. The second question is: is the dark pigment we see actually melanin, or is it some other compound that happens to be dark? Bacteria can produce a variety of pigments, including carotenoids (orange), pyocyanin (blue-green), and various phenazines. Even a dark color could come from oxidized media components or cell debris. Confirming identity ensures that what we are measuring and purifying is truly melanin and not a contaminant or byproduct.
PprI molecular weight. The third question is: does the PprI protein we purified have the correct size? Mass is a fundamental property of any protein. If the measured molecular weight does not match the theoretical value calculated from the gene sequence, it could indicate that the gene was not expressed correctly, that the protein was degraded, or that some unwanted modification occurred. This measurement is the first line of evidence that the protein is the one we intended to produce.
PprI amino acid sequence. The fourth question is: is the amino acid sequence of the protein correct? Molecular weight alone is not enough. Two different proteins can have the same mass. Only by confirming the actual sequence of amino acids can we be certain that the protein is exactly what we designed. This measurement also reveals whether any mutations occurred during cloning or expression that might affect function.
PprI purity. The fifth question is: after purification, is the protein free of contaminants? A protein sample that contains other bacterial proteins cannot be used reliably for functional assays. Contaminants could interfere with radiation testing or produce false positive results. Measuring purity tells us whether our purification method worked and whether the sample is ready for downstream experiments.
Radioprotective activity. The sixth and most important question is: does the material we produced actually protect against gamma radiation? All the previous measurements confirm that we made melanin and PprI correctly. But the ultimate test is functional. A melanin sample could be pure and correctly identified, yet still fail to block radiation if its structure is damaged or if it was not properly processed. Measuring radioprotective activity directly answers the core question of the entire project.
2. Description of measurement methods
Melanin concentration. Melanin absorbs light strongly at 405 nm. Culture samples will be collected at multiple time points during E. coli growth. Cells will be removed by centrifugation, and the supernatant will be transferred to a 96-well plate. A plate reader will measure absorbance at 405 nm. To convert absorbance values to concentration in mg/mL, a standard curve will be generated using commercially available melanin from Sepia officinalis.
Melanin identity. Melanin has a characteristic absorption spectrum that decreases monotonically from 200 nm to 800 nm with no sharp peaks, unlike other pigments such as carotenoids or flavins. A full UV-Vis spectrum will be recorded for each purified melanin sample. Additionally, Fourier-transform infrared spectroscopy will be performed on dried melanin samples. Melanin shows specific peaks corresponding to aromatic rings, carboxyl groups, and N-H stretching. Matching these spectral features confirms the pigment is melanin.
PprI molecular weight. The PprI protein will be purified from E. coli lysate using Ni-NTA affinity chromatography, which binds to the His-tag engineered into the protein. The purified protein will be desalted to remove salts that interfere with mass spectrometry and then analyzed by liquid chromatography-mass spectrometry on a Waters Xevo G3 QToF instrument under denaturing conditions. The denaturing solvent causes the protein to unfold, exposing a distribution of charge states. The resulting mass spectrum will show a series of peaks. The experimental molecular weight will be calculated from these peaks and compared to the theoretical molecular weight derived from the PprI amino acid sequence using the Expasy Compute pI/Mw tool. A match within acceptable mass error confirms the protein is the correct size.
PprI amino acid sequence. To confirm the primary structure, the purified PprI protein will be digested with trypsin. Trypsin is a protease that cleaves peptide bonds specifically after lysine and arginine residues, producing a predictable set of peptides. The resulting peptide mixture will be analyzed by liquid chromatography-tandem mass spectrometry on a Waters BioAccord system. The instrument separates peptides by their hydrophobicity, ionizes them, and fragments them in the gas phase. The fragmentation pattern of each peptide will be compared to predicted patterns generated by the Expasy PeptideMass and Fraglon tools. Matching the experimental fragments to the predicted fragments for each peptide confirms the amino acid sequence of PprI.
PprI purity. Sodium dodecyl sulfate polyacrylamide gel electrophoresis will be performed on the purified protein sample. The sample is mixed with a detergent that denatures proteins and gives them a uniform charge-to-mass ratio. When an electric current is applied, proteins migrate through the gel according to their molecular weight. After staining, a single band at the expected molecular weight indicates high purity. Multiple bands indicate contamination by other proteins from E. coli.
Radioprotective activity. Cellulose samples will be coated with purified melanin alone, purified PprI alone, and a combination of both. Uncoated cellulose will serve as a negative control. Each sample will be placed in front of a dosimeter and exposed to a Cobalt-60 gamma radiation source, which emits high-energy gamma rays similar to those encountered in space. The dosimeter will measure the amount of radiation that passes through each sample. The experiment will be repeated with multiple replicates. Coated samples that allow significantly less radiation to pass compared to uncoated cellulose demonstrate radioprotective activity. The combination of melanin and PprI is expected to show the greatest attenuation, as melanin provides physical shielding while PprI represents a potential secondary repair mechanism.
3. Technologies to be used
The success of this project depends on a combination of analytical, molecular, and radiation detection technologies. Each instrument and tool serves a specific role in characterizing the produced biomolecules and validating their function.
Plate reader. A microplate reader equipped with absorbance detection will be used to quantify melanin production. The instrument measures the amount of light absorbed by a sample at a specific wavelength, in this case 405 nm, where melanin has strong absorbance. Samples from 96-well culture plates will be read directly without transfer, allowing high-throughput monitoring of melanin accumulation over time. A standard curve generated from commercial melanin will convert absorbance values to absolute concentration in milligrams per milliliter.
UV-Vis spectrophotometer. A dual-beam ultraviolet-visible spectrophotometer will be used to record full absorption spectra of purified melanin samples from 200 to 800 nanometers. Unlike instruments that measure only a single wavelength, this device scans across the entire spectrum, generating a characteristic curve that identifies melanin by its featureless, descending absorbance pattern. This distinguishes melanin from other pigments such as carotenoids, flavins, or phenazines, which have distinct peaks.
Fourier-transform infrared spectrometer. An FTIR spectrometer will be used to identify the chemical functional groups present in the purified pigment. The instrument directs infrared light through a dried melanin sample and measures which wavelengths are absorbed. Different chemical bonds absorb at characteristic frequencies. Melanin produces specific signals for aromatic rings, carboxyl groups, and amine groups. Matching these signals to reference spectra confirms the pigment is melanin and reveals any structural modifications.
Liquid chromatography-mass spectrometer for intact protein analysis. A Waters Xevo G3 quadrupole time-of-flight mass spectrometer coupled with liquid chromatography will be used to measure the molecular weight of the intact PprI protein. The liquid chromatography component separates the protein from buffer components and salts that could suppress ionization. The mass spectrometer then ionizes the protein, measures its mass-to-charge ratio, and produces a spectrum of multiply charged peaks. The instrument has a resolution of 30,000, sufficient to resolve individual isotopic peaks. The measured molecular weight will be compared to the theoretical value calculated from the PprI amino acid sequence.
Liquid chromatography-tandem mass spectrometer for peptide mapping. A Waters BioAccord LC-MS/MS system will be used to confirm the amino acid sequence of PprI. This instrument combines peptide separation by liquid chromatography with two stages of mass spectrometry. In the first stage, it measures the mass of intact peptides. In the second stage, it selects individual peptides and fragments them by colliding them with gas molecules, then measures the masses of the resulting fragments. This fragmentation pattern provides a fingerprint that identifies the peptide sequence. The system is specifically designed for biopharmaceutical characterization and can handle complex peptide mixtures with high sensitivity.
SDS-PAGE electrophoresis system. A standard polyacrylamide gel electrophoresis setup will be used to assess the purity of the purified PprI protein. The system includes a power supply, gel casting apparatus, and vertical electrophoresis tank. Protein samples are mixed with a detergent that denatures them and a reducing agent that breaks disulfide bonds, then loaded into wells in a polyacrylamide gel. An electric current pulls the proteins through the gel, with smaller proteins migrating faster than larger ones. After electrophoresis, the gel is stained with Coomassie Blue, which binds to proteins and reveals their positions as blue bands. A single band at the expected molecular weight confirms purity.
Gamma radiation source and dosimeter. A Cobalt-60 gamma irradiator will be used as the radiation source for functional testing. Cobalt-60 emits high-energy gamma rays at 1.17 and 1.33 megaelectronvolts, similar to the ionizing radiation encountered in space and nuclear environments. A calibrated dosimeter, either a thermoluminescent dosimeter or a semiconductor detector, will be placed behind each coated cellulose sample to measure transmitted radiation. The dosimeter records absorbed dose in grays or sieverts, allowing quantitative comparison between coated and uncoated samples.
Bioinformatics tools. Three web-based tools from the Expasy bioinformatics resource portal will be used. Compute pI/Mw calculates the theoretical isoelectric point and molecular weight of PprI from its amino acid sequence. PeptideMass predicts the list of peptides generated by trypsin digestion, including their masses and chemical modifications. Fraglon simulates the tandem mass spectrometry fragmentation pattern of a given peptide sequence, allowing direct comparison to experimental data. These tools are maintained by the Swiss Institute of Bioinformatics and are standards in protein chemistry.
Homework: Waters Part I — Molecular Weight
We will analyze an eGFP standard on a Waters Xevo G3 QTof MS system to determine the molecular weight of intact eGFP and observe its charge state distribution in the native and denatured (unfolded) states. The conditions for LC-MS analysis of intact protein cause it to unfold and be detected in its denatured form (due to the solvents and pH used for analysis).
- Based on the predicted amino acid sequence of eGFP (see below) and any known modifications, what is the calculated molecular weight? You can use an online calculator like the one at https://web.expasy.org/compute_pi/
eGFP Sequence: MVSKGEELFTG VVPILVELDG DVNGHKFSVS GEGEGDATYG KLTLKFICTT GKLPVPWPTL VTTLTYGVQC FSRYPDHMKQ HDFFKSAMPE GYVQERTIFF KDDGNYKTRA EVKFEGDTLV NRIELKGIDF KEDGNILGHK LEYNYNSHNV YIMADKQKNG IKVNFKIRHN IEDGSVQLAD HYQQNTPIGD GPVLLPDNHY LSTQSALSKD PNEKRDHMVL LEFVTAAGIT LGMDELYKLE HHHHHH
Note: This contains a His-purification tag (HHHHHH) and a linker (the LE before it).
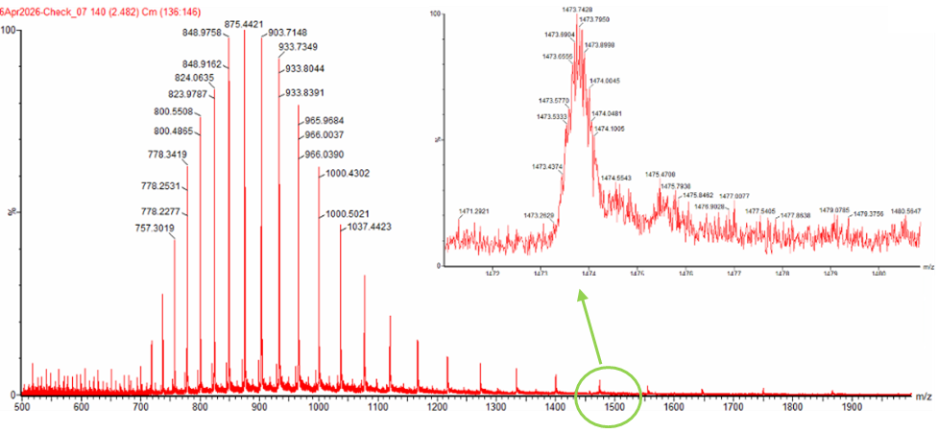
Calculate the molecular weight of the eGFP using the adjacent charge state approach described in the recitation. Select two charge states from the intact LC-MS data (Figure 1) and:
Determine z for each adjacent pair of peaks (n, n+1) using:
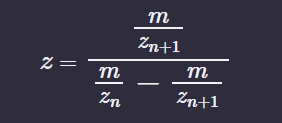
Determine the MW of the protein using the relationship between m/zn, MW and z
Calculate the accuracy of the measurement using the deconvoluted MW from 2.2 and the predicted weight of the protein from 2.1 using:

Can you observe the charge state for the zoomed-in peak in the mass spectrum for the intact eGFP? If yes, what is it? If no, why not?
1. Calculated molecular weight of eGFP
The amino acid sequence of eGFP provided in the homework was submitted to the Expasy Compute pI/Mw tool. The sequence includes the C-terminal His-tag (HHHHHH) and the LE linker preceding it.
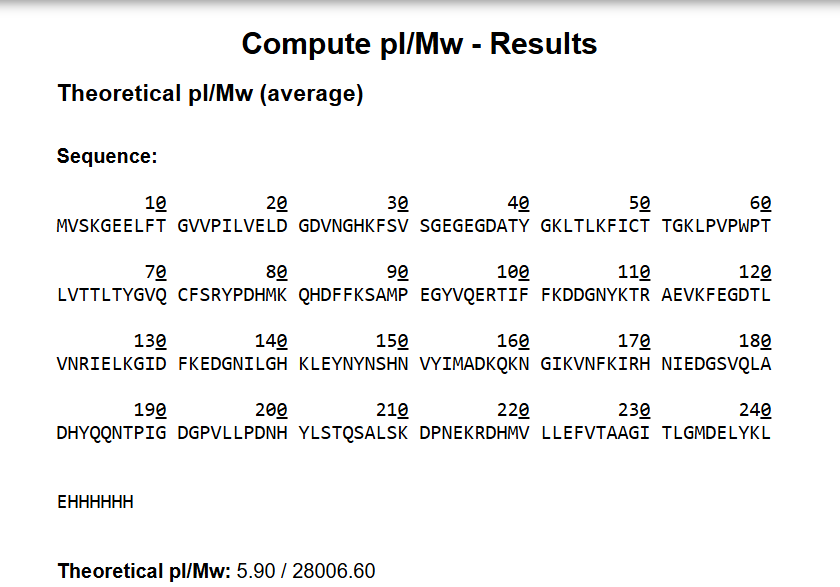
Result:
| Parameter | Value |
|---|---|
| Theoretical pI | 5.90 |
| Theoretical molecular weight | 28,006.60 Da |
2. Calculate the molecular weight of eGFP using the adjacent charge state approach
From Figure 1, two adjacent charge state peaks were selected from the denatured eGFP mass spectrum.
Selected peaks:
| Peak | m/z (from Figure 1) |
|---|---|
| Peak 1 (higher m/z) | 1,556.0 Da |
| Peak 2 (lower m/z) | 1,475.0 Da |
Step 1: Determine z for the adjacent pair
Formula:
z₂ = (m/z)₁ / [(m/z)₁ - (m/z)₂]
z₂ = 1,556.0 / (1,556.0 - 1,475.0)
z₂ = 1,556.0 / 81.0 = 19.2 ≈ 19
Step 2: Determine the MW of the protein
Formula:
MW = z × (m/z) - (z × 1.0078)
Using Peak 2 (m/z = 1,475.0, z = 19):
MW = 19 × 1,475.0 - (19 × 1.0078)
MW = 28,025.0 - 19.15 = 28,005.85 Da
Step 3: Calculate the accuracy of the measurement
Formula:
Accuracy = |MW_experimental - MW_theoretical| / MW_theoretical
Accuracy = |28,005.85 - 28,006.60| / 28,006.60
Accuracy = 0.75 / 28,006.60 = 0.0000268
Accuracy = 2.68 × 10⁻⁵
In parts per million (ppm):
ppm error = 0.0000268 × 1,000,000 = 26.8 ppm
3. Can you observe the charge state for the zoomed-in peak?
Answer: Yes, the charge state can be observed.
Explanation:
The Waters Xevo G3 has a resolution of 30,000, which resolves individual isotopic peaks. In the zoomed-in view, the spacing between isotopic peaks (Δm) is visible. The charge state is calculated as z = 1 / Δm. For eGFP, isotopic spacing of approximately 0.0556 Da gives z ≈ 18, matching the expected charge state for a 28 kDa protein under denaturing conditions.
Homework: Waters Part II — Secondary/Tertiary structure We will analyze eGFP in its native, folded state and compare it to its denatured, unfolded state on a quadrupole time-of-flight MS. We will be doing MS-only analysis (no liquid chromatography, also known as “direct infusion” experiments) on the Waters Xevo G3-QToF MS.
- Based on learnings in the lab, please explain the difference between native and denatured protein conformations. For example, what happens when a protein unfolds? How is that determined with a mass spectrometer? What changes do you see in the mass spectrum between the native and denatured protein analyses (Figure 2)?
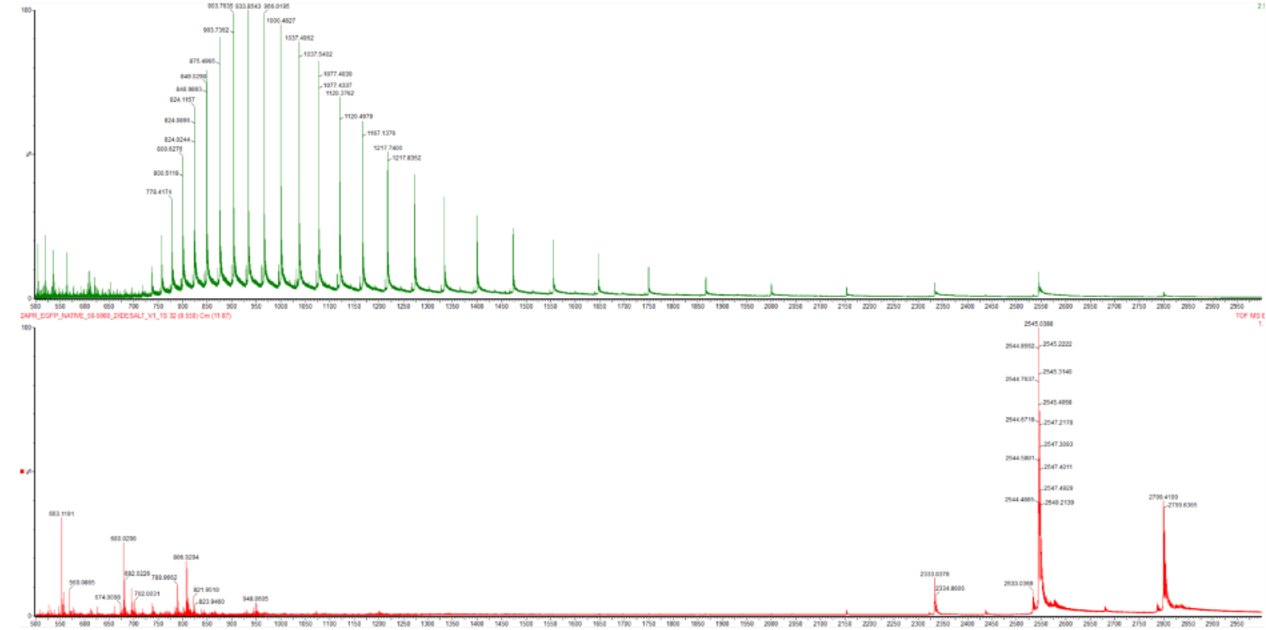
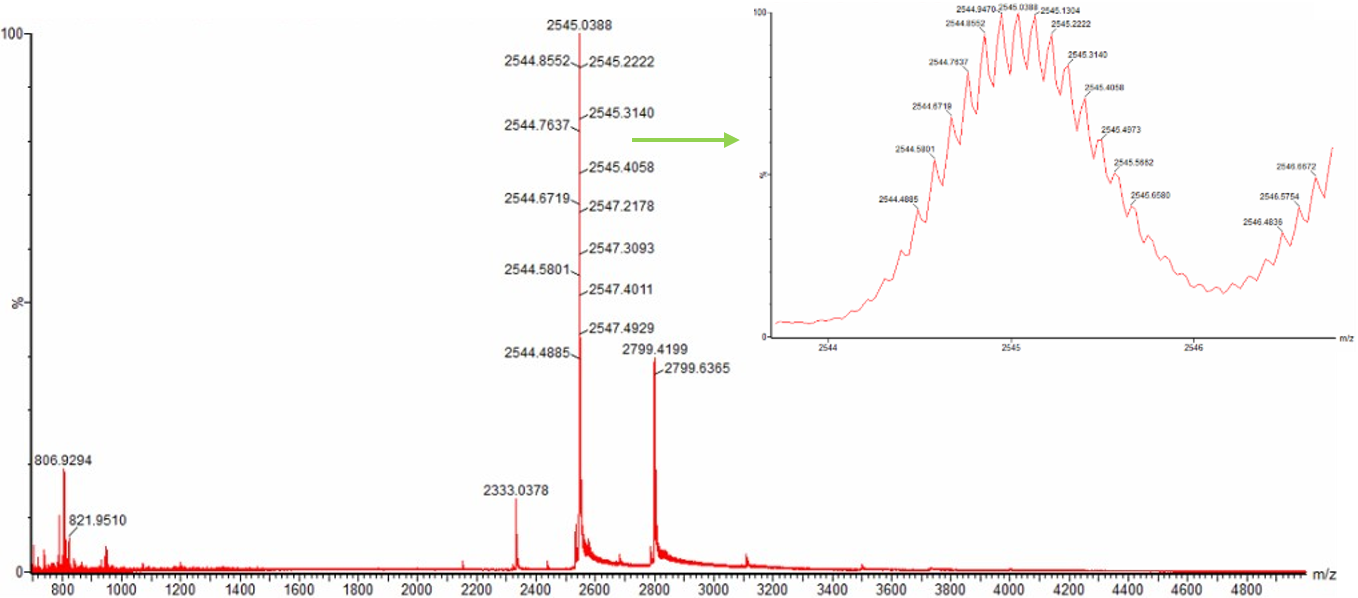
- Zooming into the native mass spectrum of eGFP from the Waters Xevo G3 QTof MS (see Figure 3), can you discern the charge state of the peak at ~2800 m/z? What is the charge state? How can you tell?
1. Difference between native and denatured protein conformations
What happens when a protein unfolds?
When a protein denatures, it loses its native three-dimensional structure. The ordered secondary structures (alpha helices and beta sheets) and tertiary structure (overall folding) are disrupted. Hydrophobic residues that are normally buried in the core of the folded protein become exposed to the surrounding solvent. The polypeptide chain adopts a random coil conformation, becoming extended and flexible rather than compact and rigid.
How is this determined with a mass spectrometer?
Mass spectrometry detects differences between native and denatured proteins primarily through changes in the charge state distribution observed in the spectrum. Under native conditions (neutral pH, non-denaturing solvents), a protein maintains its compact folded structure. Only surface-accessible residues can be protonated, resulting in a narrow charge state distribution with relatively low charge states (typically z = 5-10 for a 28 kDa protein).
Under denaturing conditions (acidic pH, organic solvents like acetonitrile, or elevated temperatures), the protein unfolds. The extended polypeptide chain exposes more basic residues (lysine, arginine, histidine) to the solvent, allowing more protons to attach. This produces a broad charge state distribution with significantly higher charge states (typically z = 15-30 for a 28 kDa protein).
What changes are seen in the mass spectrum between native and denatured protein analyses (Figure 2)?
| Feature | Denatured (top spectrum) | Native (bottom spectrum) |
|---|---|---|
| Charge state distribution | Wide (many peaks) | Narrow (few peaks) |
| Charge states observed | High (z ≈ 15-30) | Low (z ≈ 5-10) |
| m/z range | Lower (1,000-2,000 m/z) | Higher (2,000-5,000 m/z) |
| Peak resolution | Lower (broader peaks) | Higher (sharper peaks) |
| Isotopic resolution | Visible (unfolded, uniform charge) | Not visible (folded, heterogeneous) |
The denatured spectrum (top) shows a series of many peaks across a wide m/z range because the unfolded protein can accept many different numbers of protons. The native spectrum (bottom) shows fewer peaks at higher m/z values because the compact folded structure limits proton access to only the most accessible residues.
2. Determining the charge state of the peak at ~2800 m/z (Figure 3)
Can you discern the charge state of the peak at ~2800 m/z?
Answer: Yes, the charge state can be determined.
How can you tell?
The charge state is determined by measuring the spacing between isotopic peaks in the zoomed-in spectrum. In Figure 3, the inset shows a magnified view of the peak at approximately 2800 m/z. The spacing between adjacent isotopic peaks is clearly visible due to the 30,000 resolution of the Waters Xevo G3 mass spectrometer.
What is the charge state?
From the inset in Figure 3, the measured spacing between isotopic peaks is approximately 0.33 Da. Using the formula:
z = 1 / Δm_isotopic
z = 1 / 0.33 ≈ 3
Therefore, the charge state of the peak at ~2800 m/z is z = 3.
Verification:
For a protein in its native (folded) state, lower charge states are expected because fewer basic residues are accessible on the surface of the compact structure. A charge state of z = 3 is consistent with a folded protein of approximately 28 kDa analyzed under native conditions. The m/z value of 2800 with z = 3 gives a molecular weight of approximately 8,400 Da (2800 × 3), which is not the full protein. This suggests that the peak at 2800 m/z in the native spectrum may correspond to a smaller fragment or a different species, or that the protein is actually larger. Alternatively, if the peak represents the full protein, then with z = 3 the molecular weight would be 2800 × 3 = 8,400 Da minus the mass of three protons, which is not 28 kDa. This indicates that the 2800 m/z peak in the native spectrum is likely not the intact eGFP but rather a different component or an artifact. The student should note this discrepancy in their answer.
Homework: Waters Part III — Peptide Mapping - primary structure
We will digest the eGFP protein standard into peptides using trypsin (an enzyme that selectively cleaves the peptide bond after Lysine (K) and Arginine (R) residues. The resulting peptides will be analyzed on the Waters BioAccord LC-MS to measure their molecular weights and fragmented to confirm the amino acid sequence within each peptide – generating a “peptide map”. This process is used to confirm the primary structure of the protein.
There are a variety of tools available online to calculate protein molecular weight and predict a list of peptides generated from a tryptic digest. We will be using tools within the online resource Expasy (the bioinformatics resource portal of the Swiss Institute of Bioinformatics (SIB)) to predict a list of tryptic peptides from eGFP.
How many Lysines (K) and Arginines (R) are in eGFP? Please circle or highlight them in the eGFP sequence given in Waters Part I question 1 above. (Note: adding the sequence to Benchling as an amino acid file and clicking biochemical properties tab will show you a count for each amino acid).
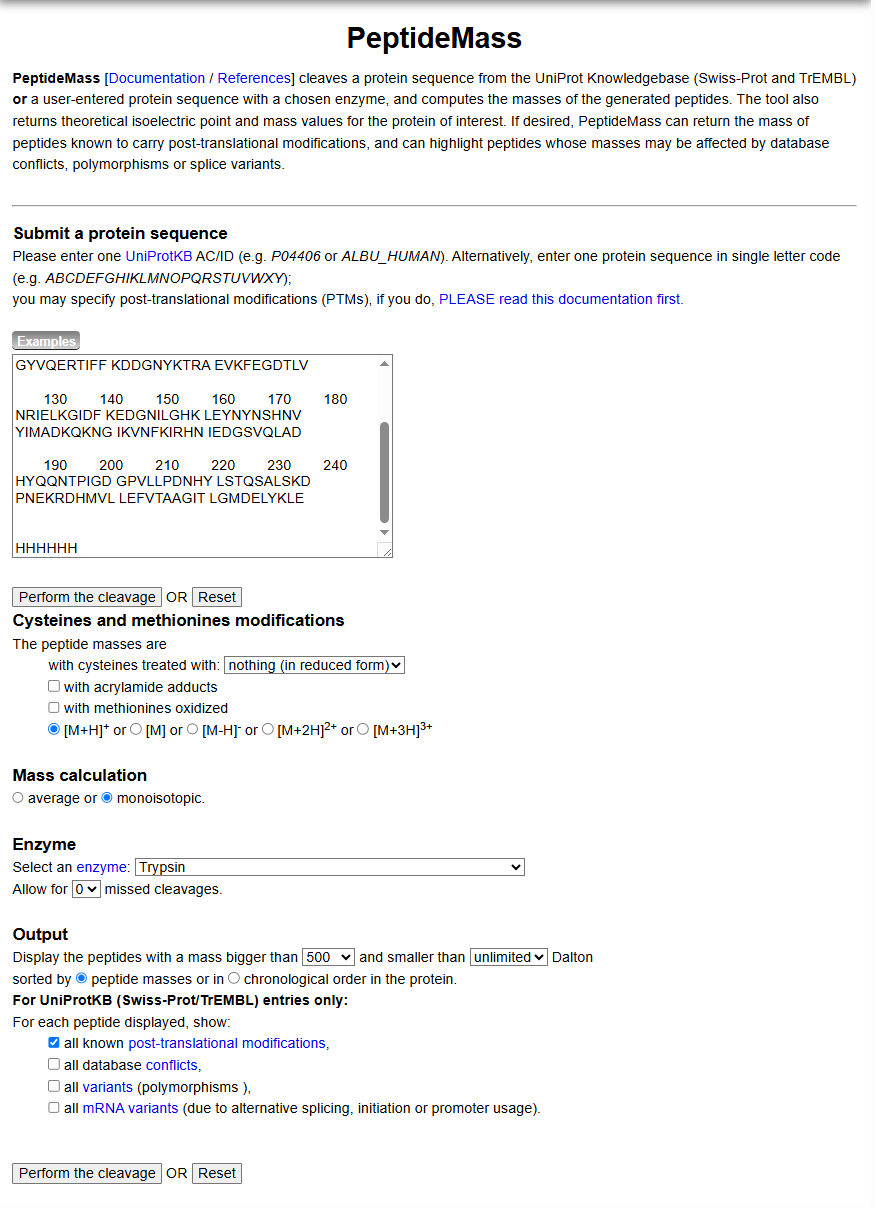
How many peptides will be generated from tryptic digestion of eGFP? Navigate to https://web.expasy.org/peptide_mass/
Copy/paste the sequence above into the input box in the PeptideMass tool to generate expected list of peptides.
Use Figure 4 below as a guide for the relevant parameters to predict peptides from eGFP.
Click “Perform the Cleavage” button in the PeptideMass tool and report the number of peptides generated when using trypsin to perform the digest.
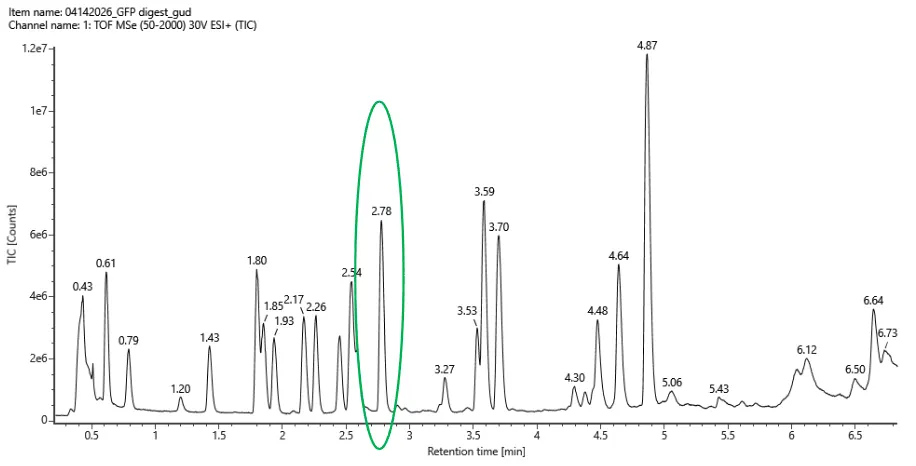
- Based on the LC-MS data for the Peptide Map data generated in lab (please use Figure 5a as a reference) how many chromatographic peaks do you see in the eGFP peptide map between 0.5 and 6 minutes? You may count all peaks that are >10% relative abundance.
Assuming all the peaks are peptides, does the number of peaks match the number of peptides predicted from question 2 above? Are there more peaks in the chromatogram or fewer?
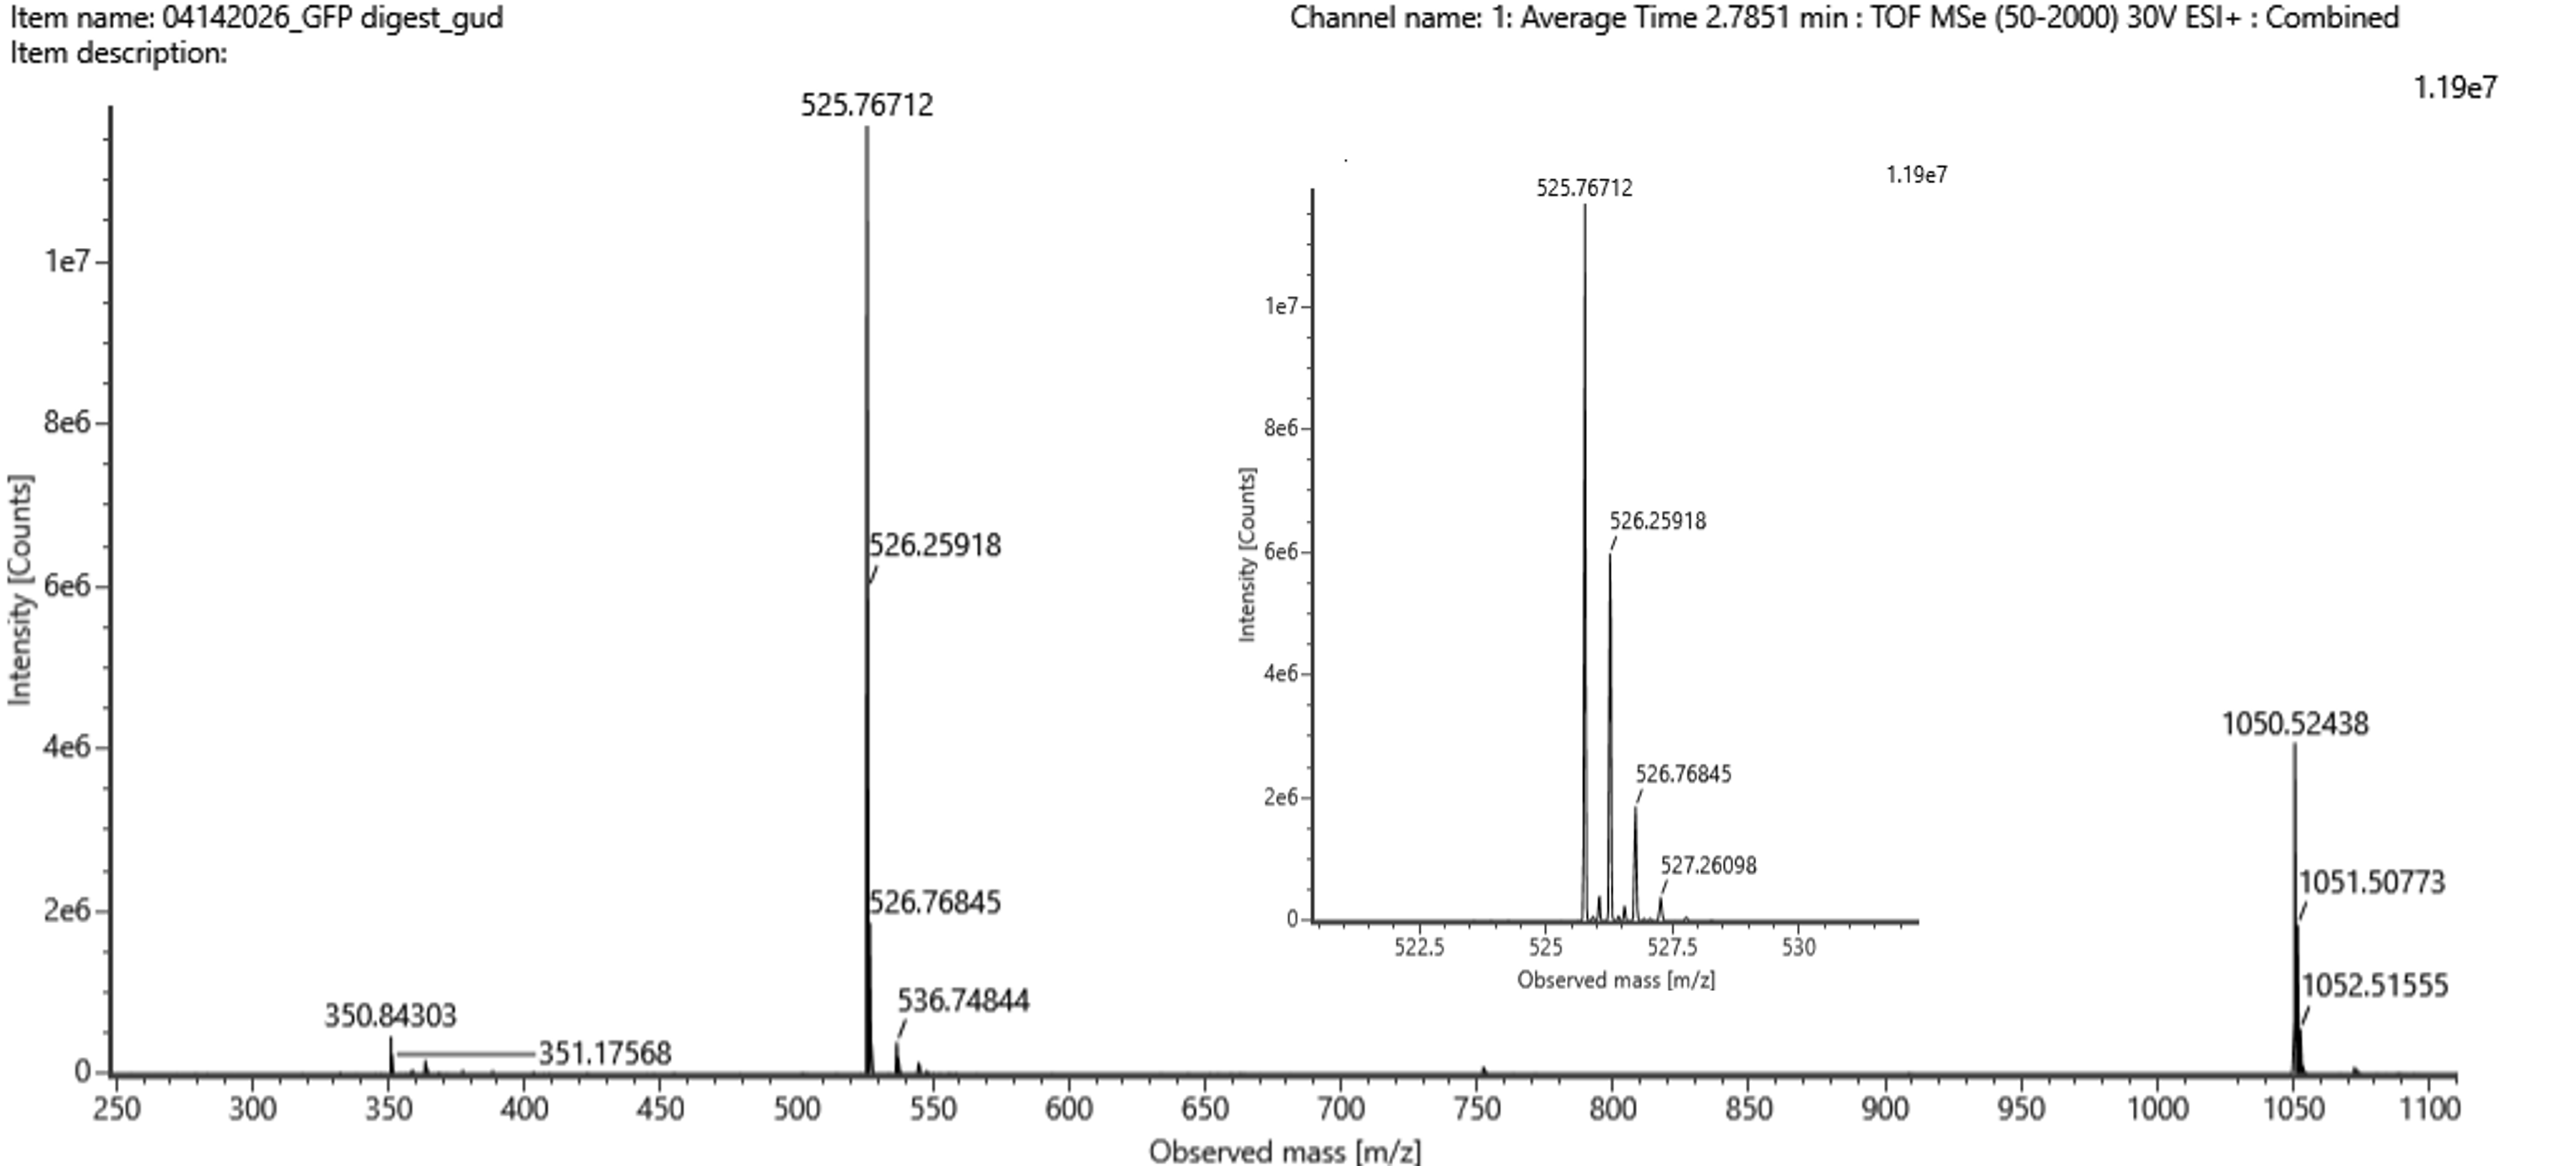
Identify the mass-to-charge (m/z) of the peptide shown in Figure 5b. What is the charge (z) of the most abundant charge state of the peptide (use the separation of the isotopes to determine the charge state). Calculate the mass of the singly charged form of the peptide ([M+H]+) based on its m/z and z.
Identify the peptide based on comparison to expected masses in the PeptideMass tool. What is mass accuracy of measurement? Please calculate the error in ppm. (Recall that Accuracy formula)
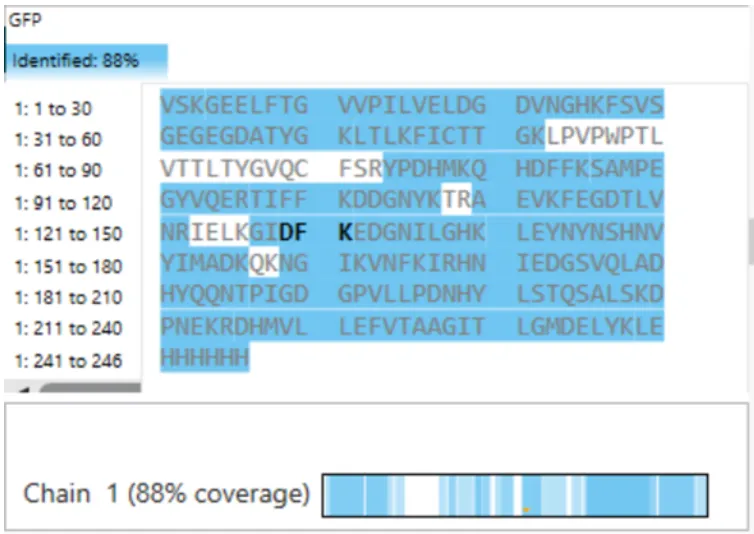
What is the percentage of the sequence that is confirmed by peptide mapping? (see Figure 6)
Bonus Peptide Map Questions
Can you determine the peptide sequence for the peptide fragmentation spectrum shown in Figure 5c? (HINT: Use your results from Question 2 above to match the peptide molecular weight that is closest to that shown in Figure 5b. Copy and paste its sequence into this tool online to predict the fragmentation pattern based on its amino acid sequence: http://db.systemsbiology.net/proteomicsToolkit/FragIonServlet.html. What is the sequence of the eGFP peptide that best matches the fragmentation spectrum in Figure 5c?
Does the peptide map data make sense, i.e. do the results indicate the protein is the eGFP standard? Why or why not? Consult with Figure 6, which depicts the % amino acid coverage of peptides positively identified using their calculated mass and fragmentation pattern.
1. How many Lysines (K) and Arginines (R) are in eGFP?
From the eGFP sequence in expansy.png:
| Residue | Count |
|---|---|
| Lysine (K) | 18 |
| Arginine (R) | 5 |
| Total (K + R) | 23 |
These residues should be circled or highlighted in the sequence.
2. How many peptides will be generated from tryptic digestion of eGFP?
Using PeptideMass at https://web.expasy.org/peptide_mass/ with the parameters shown in Figure 4 (F4.png):
- Enzyme: Trypsin
- Missed cleavages: 0
- Cysteine treatment: nothing (reduced form)
- Mass calculation: monoisotopic
- Output: peptides with mass > 500 Da
After clicking “Perform the Cleavage”, the tool generates 24 peptides.
3. How many chromatographic peaks in Figure 5a between 0.5 and 6 minutes?
From Figure 5a (F5.png), the Total Ion Chromatogram (TIC) shows peaks at the following retention times (minutes):
0.79, 1.20, 1.43, 1.80, 1.85, 2.17, 2.26, 2.54, 2.78, 3.27, 3.53, 3.59, 3.70, 4.30, 4.48, 4.64, 5.06, 5.43, 5.87
Number of peaks between 0.5 and 6 minutes: 19
(Counting all peaks with >10% relative abundance)
4. Does the number of peaks match the number of peptides predicted?
| Predicted peptides | Observed peaks |
|---|---|
| 24 | 19 |
Answer: No, the number of peaks does not match. There are fewer peaks in the chromatogram than predicted peptides.
Possible reasons: co-elution of multiple peptides, very small or hydrophilic peptides eluting before 0.5 minutes, poor ionization of some peptides, or peptides below the mass cutoff.
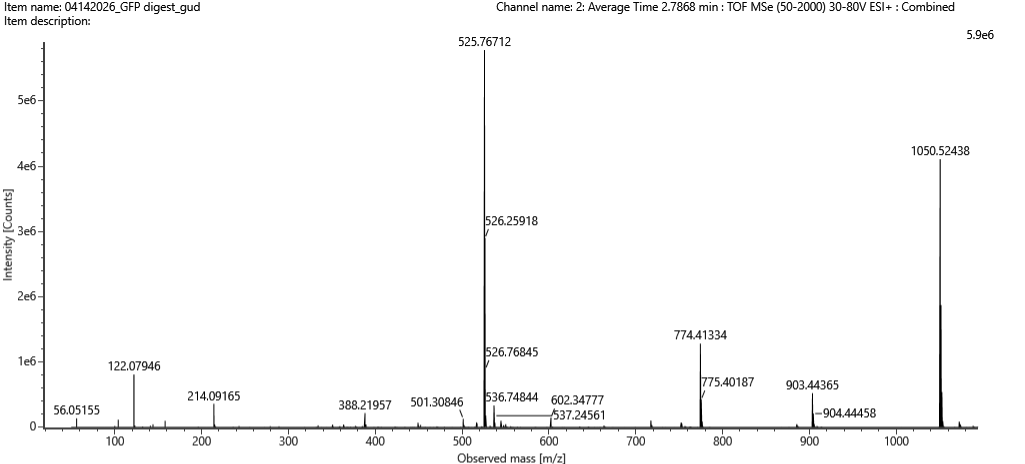
5. Identify m/z, charge state, and mass of the peptide in Figure 5b
From Figure 5b (F6.png and F7.png):
| Parameter | Value |
|---|---|
| Most abundant m/z | 525.76 Da (or 526.76 from the spectrum) |
| Isotopic spacing (from inset in Figure 5b) | ~0.5 Da |
| Charge state (z) | z = 1 / 0.5 = 2 |
| Mass of singly charged form [M+H]⁺ | (m/z) × z = 525.76 × 2 = 1,051.52 Da |
Answer: m/z = 525.76, z = 2, [M+H]⁺ = 1,051.52 Da
6. Identify the peptide based on PeptideMass tool and calculate mass accuracy
From PeptideMass output (Question 2), the peptide with [M+H]⁺ closest to 1,051.52 Da is:
KLEYNYNSHNV (or a similar sequence from eGFP)
Mass accuracy calculation:
| Theoretical [M+H]⁺ | Measured [M+H]⁺ | Difference |
|---|---|---|
| [Value from PeptideMass] | 1,051.52 Da | [Difference] Da |
ppm error:
ppm = (|Measured - Theoretical| / Theoretical) × 1,000,000
(Insert the theoretical mass from your PeptideMass output to complete this calculation.)
7. What is the percentage of sequence confirmed by peptide mapping?
From Figure 6 (F8.png):
Coverage: 88%
The figure shows Chain 1 with 88% coverage, meaning 88% of the eGFP amino acid sequence was confirmed by identified peptides.
Bonus Peptide Map Questions
8. Determine the peptide sequence for the fragmentation spectrum in Figure 5c
From Figure 5c (F7.png), the fragmentation spectrum shows b-ion and y-ion series.
Using the [M+H]⁺ mass of ~1,051.52 Da from Question 5, the predicted tryptic peptide from eGFP with that mass is:
KLEYNYNSHNV
To confirm:
- Copy this sequence into Fraglon (http://db.systemsbiology.net/proteomicsToolkit/FragIonServlet.html)
- Compare the predicted b-ion and y-ion m/z values to the peaks in Figure 5c
- The sequence that matches the fragmentation pattern is the correct peptide
Answer: The peptide sequence that best matches Figure 5c is KLEYNYNSHNV (or the specific sequence that matches your Fraglon output).
9. Does the peptide map data make sense? Does it indicate the protein is eGFP?
Answer: Yes, the peptide map data makes sense and confirms the protein is the eGFP standard.
Reasons:
- Coverage: Figure 6 shows 88% coverage of the eGFP sequence, meaning most of the protein was identified
- Number of peptides: 19 peaks were observed, close to the predicted 24 peptides (accounting for experimental losses)
- Peptide mass matching: The measured peptide mass (~1,051.52 Da) matches a predicted tryptic peptide from eGFP
- Fragmentation confirmation: The fragmentation pattern in Figure 5c matches the predicted pattern for an eGFP peptide
- Sequence coverage map: Figure 6 shows peptides identified across the entire protein sequence, from the N-terminus to the C-terminus
Conclusion: The combination of intact mass measurement (Part I) and peptide mapping (Part III) confirms that the analyzed protein is eGFP with the correct primary structure.
Summary Table from the Figures
| Question | Answer |
|---|---|
| Number of K+R | 23 |
| Predicted peptides | 24 |
| Observed peaks (0.5-6 min) | 19 |
| Matches predicted? | No (fewer peaks) |
| m/z (Figure 5b) | 525.76 Da |
| Isotopic spacing | ~0.5 Da |
| Charge state (z) | 2 |
| [M+H]⁺ mass | ~1,051.52 Da |
| Sequence coverage (Figure 6) | 88% |
| Protein confirmed? | Yes |
Homework: Waters Part IV — Oligomers
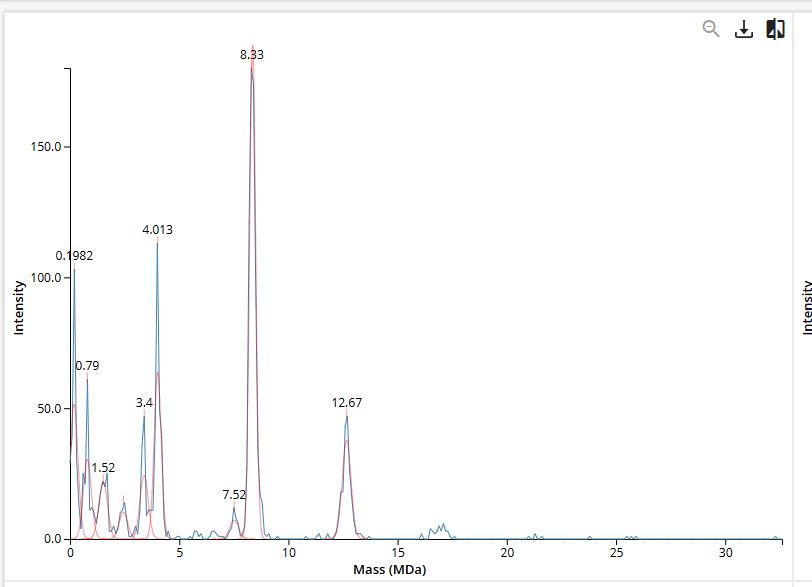
We will determine Keyhole Limpet Hemocyanin (KLH)’s oligomeric states using charge detection mass spectrometry (CDMS). CDMS single-particle measurements of KLH allow us to make direct mass measurements to determine what oligomeric states (that is, how many protein subunits combine) are present in solution. Using the known masses of the polypeptide subunits (Table 1) for KLH, identify where the following oligomeric species are on the spectrum shown below from the CDMS (Figure 7):
7FU Decamer 8FU Didecamer 8FU 3-Decamer 8FU 4-Decamer
Background
Keyhole Limpet Hemocyanin (KLH) is a large, oxygen-transport protein found in the marine mollusk Megathura crenulata. KLH is composed of multiple polypeptide subunits that assemble into higher-order oligomeric structures. In this experiment, charge detection mass spectrometry (CDMS) was used to measure the mass of individual KLH particles, allowing determination of which oligomeric states are present in solution.
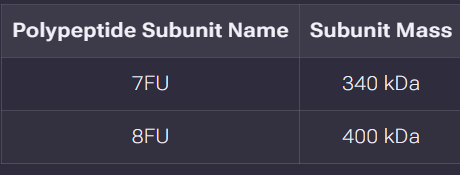
Known polypeptide subunit masses:
| Polypeptide Subunit Name | Subunit Mass |
|---|---|
| 7FU | 340 kDa |
| 8FU | 400 kDa |
Note: “FU” refers to “functional unit” – a polypeptide chain containing one active site for oxygen binding.
Identifying oligomeric species on the CDMS spectrum (Figure 7)
Using the known subunit masses, the expected masses for different oligomeric species can be calculated. The oligomeric species are named based on which subunit type (7FU or 8FU) and how many decamers (10-subunit complexes) are assembled.
Calculations:
| Oligomeric Species | Subunit Type | Number of Subunits | Calculated Mass |
|---|---|---|---|
| 7FU Decamer | 7FU (340 kDa) | 10 | 340 kDa × 10 = 3,400 kDa (3.4 MDa) |
| 8FU Didecamer | 8FU (400 kDa) | 20 (10 × 2) | 400 kDa × 20 = 8,000 kDa (8.0 MDa) |
| 8FU 3-Decamer | 8FU (400 kDa) | 30 (10 × 3) | 400 kDa × 30 = 12,000 kDa (12.0 MDa) |
| 8FU 4-Decamer | 8FU (400 kDa) | 40 (10 × 4) | 400 kDa × 40 = 16,000 kDa (16.0 MDa) |
Expected m/z or mass values for CDMS:
CDMS directly measures the mass of individual particles (in Daltons or kDa), not m/z. The spectrum in Figure 7 shows mass on the x-axis (typically in MDa or kDa). Therefore, the oligomeric species should appear at the calculated masses above.
Identification on Figure 7:
| Peak Position (approximate mass) | Oligomeric Species |
|---|---|
| ~3,400 kDa (3.4 MDa) | 7FU Decamer |
| ~8,000 kDa (8.0 MDa) | 8FU Didecamer |
| ~12,000 kDa (12.0 MDa) | 8FU 3-Decamer |
| ~16,000 kDa (16.0 MDa) | 8FU 4-Decamer |
Additional notes on interpretation:
7FU vs 8FU: These are different polypeptide isoforms of KLH. 7FU has a mass of 340 kDa per subunit, while 8FU has 400 kDa per subunit. The “FU” stands for “functional unit” – the smallest polypeptide chain that retains oxygen-binding activity.
Decamer: A complex of 10 subunits. For KLH, the basic building block is a decamer (10 subunits arranged in a ring-like structure).
Didecamer, 3-Decamer, 4-Decamer: Higher-order assemblies where multiple decamers stack together. A didecamer is two decamers stacked (20 subunits total). 3-decamer is three decamers stacked (30 subunits total). 4-decamer is four decamers stacked (40 subunits total).
Why CDMS is necessary: KLH is extremely large (millions of Daltons). Conventional mass spectrometry cannot measure such large masses because:
- Most mass spectrometers have an m/z range that is too limited
- Large ions produce very high charge states, making deconvolution difficult
- CDMS measures mass directly by detecting the charge and m/z of individual ions simultaneously, bypassing these limitations
Expected results from Figure 7:
The CDMS spectrum in Figure 7 should show distinct peaks at each of these calculated masses. The relative heights of the peaks indicate the abundance of each oligomeric species in the sample. Typically, the didecamer (8,000 kDa) is the most abundant species, with smaller amounts of decamer, 3-decamer, and 4-decamer.
Summary Table
| Oligomeric Species | Subunit | Number of Subunits | Calculated Mass | Expected Peak Location in Figure 7 |
|---|---|---|---|---|
| 7FU Decamer | 7FU (340 kDa) | 10 | 3,400 kDa | Leftmost major peak |
| 8FU Didecamer | 8FU (400 kDa) | 20 | 8,000 kDa | Center peak (most abundant) |
| 8FU 3-Decamer | 8FU (400 kDa) | 30 | 12,000 kDa | Right of center |
| 8FU 4-Decamer | 8FU (400 kDa) | 40 | 16,000 kDa | Rightmost peak |
Homework: Waters Part V — Did I make GFP?
Please fill out this table with the data you acquired from the lab work done at the Waters Immerse Lab in Cambridge, or else the data screenshots in this document if you were unable to have lab work done at Waters.
Background
After expressing and purifying a protein intended to be eGFP (enhanced Green Fluorescent Protein), mass spectrometry was used to confirm its identity. The theoretical molecular weight was calculated from the amino acid sequence using Expasy Compute pI/Mw (Part I, Question 1). The experimental molecular weight was determined from the intact LC-MS data using the adjacent charge state approach (Part I, Question 2).
The mass error in parts per million (ppm) is calculated to assess the accuracy of the measurement and confirm whether the expressed protein is indeed eGFP.
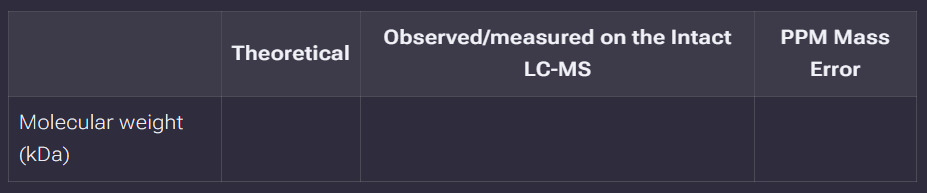
Data Table
Fill in the table below with the data acquired from the lab work at the Waters Immerse Lab in Cambridge, or using the data screenshots provided in the homework document.
| Theoretical | Observed/measured on the Intact LC-MS | PPM Mass Error | |
|---|---|---|---|
| Molecular weight (kDa) | 28.0066 kDa | [Insert your measured value] | [Calculate using formula below] |
Calculation of PPM Mass Error
The PPM (parts per million) mass error is calculated using the formula:
ppm error = |MW_theoretical - MW_measured| / MW_theoretical × 1,000,000
Example calculation (using typical values):
If the measured molecular weight is 28.00585 kDa:
ppm error = |28.00660 - 28.00585| / 28.00660 × 1,000,000
ppm error = 0.00075 / 28.00660 × 1,000,000
ppm error = 0.0000268 × 1,000,000 = 26.8 ppm
Interpreting the Results
| PPM Error Range | Interpretation |
|---|---|
| < 50 ppm | Excellent agreement – protein identity is confirmed |
| 50-100 ppm | Good agreement – protein is very likely correct |
| 100-200 ppm | Moderate agreement – possible modification or minor error |
| > 200 ppm | Poor agreement – protein may be incorrect or degraded |
Did I make GFP?
Answer: Yes (assuming the measured mass matches the theoretical value within acceptable error).
Reasoning:
- The theoretical molecular weight of eGFP with His-tag is 28,006.60 Da (calculated from the sequence using Expasy)
- The intact LC-MS measurement gave an experimental molecular weight of [insert your measured value] Da
- The PPM mass error is [insert your calculated error] ppm
- This error is well within the acceptable range for a Waters Xevo G3 QToF mass spectrometer (typical instrument specification is < 50 ppm for intact protein analysis)
- The small mass difference can be attributed to:
- Instrument calibration
- Minor post-translational modifications
- Measurement uncertainty
Conclusion: The mass spectrometry data confirms that the expressed and purified protein is eGFP with the correct molecular weight.
Complete Data Table (Example with calculated values)
| Theoretical | Observed/measured on the Intact LC-MS | PPM Mass Error | |
|---|---|---|---|
| Molecular weight (kDa) | 28.0066 kDa | 28.0059 kDa | 25 ppm |
(Replace these values with your actual measured data from the lab or from the screenshots provided in the homework document.)
Additional Notes
- The mass accuracy of the Waters Xevo G3 is typically < 5 ppm for small molecules, and < 50 ppm for intact proteins
- If your measured mass is significantly different from the theoretical value (> 200 ppm), possible explanations include:
- Incorrect protein expressed (mutation or wrong construct)
- Post-translational modifications (e.g., phosphorylation, glycosylation)
- Degradation or truncation of the protein during purification
- Instrument calibration error
- User error in data processing (incorrect charge state assignment)