Week 6 — Genetic Circuits Part I: Assembly Technologies
Assignment: DNA Assembly Answer these questions about the protocol in this week’s lab:
What are some components in the Phusion High-Fidelity PCR Master Mix and what is their purpose? What are some factors that determine primer annealing temperature during PCR? There are two methods from this class that create linear fragments of DNA: PCR, and restriction enzyme digests. Compare and contrast these two methods, both in terms of protocol as well as when one may be preferable to use over the other. How can you ensure that the DNA sequences that you have digested and PCR-ed will be appropriate for Gibson cloning? How does the plasmid DNA enter the E. coli cells during transformation? Describe another assembly method in detail (such as Golden Gate Assembly) Explain the other method in 5 - 7 sentences plus diagrams (either handmade or online). Model this assembly method with Benchling or Asimov Kernel!
What are some components in the Phusion High-Fidelity PCR Master Mix and what is their purpose?
Phusion DNA Polymerase: A high-fidelity enzyme that synthesizes new DNA strands with high accuracy, minimizing errors during amplification.
Reaction Buffer (with MgCl₂): Provides the optimal chemical environment (pH and salt concentration) for polymerase activity; magnesium ions act as essential cofactors.
dNTPs (deoxynucleotide triphosphates): The building blocks (dATP, dCTP, dGTP, dTTP) used by the polymerase to extend the primers and create the new DNA strands.
The “2X” concentration means the mix is double-strength; when combined with an equal volume of template, primers, and water, it reaches the correct 1X working concentration.
What are some factors that determine primer annealing temperature during PCR?
The annealing temperature used in PCR is primarily based on the melting temperature (Tm) of the primers. Key factors that influence Tm include:
Primer length: Longer primers generally have higher Tms.
GC content: Guanine-cytosine pairs are stronger than adenine-thymine pairs, so higher GC content raises the Tm.
Salt concentration: The ionic strength of the PCR buffer affects Tm; the protocol recommends a Tm range of 52–58°C for the primer binding region.
Primer pairs should have Tms within 5°C of each other to ensure both bind efficiently at the same annealing temperature.
The actual annealing temperature is typically set 2–5°C below the lower primer’s Tm.
Compare and contrast PCR and restriction enzyme digests.
Both methods generate linear DNA fragments, but they differ in mechanism, source, and application.
| Característica | PCR | Digestión con Enzimas de Restricción |
|---|---|---|
| Mechanism | Enzymatic Synthesis: Uses a DNA polymerase to exponentially amplify a specific target sequence from a template. | Enzymatic Cleavage: Uses restriction endonucleases to cut DNA at specific, short recognition sequences. |
| Source of DNA | Requires a template DNA that contains the target sequence. The fragment is newly synthesized. | Requires pre-existing DNA (plasmid, genomic, or PCR product) that contains the restriction sites. The fragment is excised. |
| Product | A specific, amplified linear DNA fragment defined by the primers. Its ends are defined by the primer sequences. | A mixture of linear fragments whose sizes are determined by the locations of the restriction sites in the original DNA. |
| Sequence Knowledge | Requires knowledge of the sequences flanking the region of interest to design primers. | Requires knowledge of the restriction site locations in the DNA. |
| When to Use | - When you need to amplify a specific region from a small amount of template. - When you want to introduce specific mutations via primer design (as done in this lab). - When you need to add specific overhangs for cloning methods like Gibson Assembly. | - When you need to sub-clone a fragment from one vector to another (if compatible sites exist). - For verifying the identity of a plasmid by analyzing the size of the fragments produced (diagnostic digest). - When working with very large DNA molecules (like genomic DNA) where PCR may be difficult. |
How can you ensure that the DNA sequences that you have digested and PCR-ed will be appropriate for Gibson cloning?
Correct overlap sequences: Primers must be designed so that the ends of the PCR products have complementary overhangs. In this protocol, the Backbone Reverse primer overlaps with the Color Forward primer, and the Color Reverse primer overlaps with the Backbone Forward primer, ensuring fragments anneal in the correct order.
Remove template plasmid: Perform a DpnI digest after PCR to eliminate the methylated original plasmid (which would otherwise lead to background colonies).
Purify PCR products: Use a DNA Clean & Concentrator kit to remove primers, dNTPs, and enzymes that could interfere with assembly.
Use correct molar ratios: The protocol recommends a 2:1 molar ratio of insert to vector. Calculate volumes based on measured DNA concentrations (from Nanodrop/Qubit) to achieve this ratio.
How does the plasmid DNA enter the E. coli cells during transformation?
In this protocol, plasmid DNA enters chemically competent E. coli via heat shock:
Competence preparation: Cells are treated with ice-cold CaCl₂ to alter membrane permeability and neutralize charge repulsion between DNA and the cell surface.
Ice incubation: Plasmid DNA is mixed with cells on ice, allowing DNA to associate with the membrane.
Heat shock: The mixture is rapidly transferred to 42°C for exactly 45 seconds, creating pores in the membrane through which DNA diffuses.
Recovery: Cells are placed back on ice to close pores, then incubated in nutrient-rich SOC media for 60 minutes to allow expression of antibiotic resistance genes.
Describe another assembly method in detail (such as Golden Gate Assembly)
Golden Gate Assembly relies on Type IIS restriction enzymes (e.g., BsaI, BsmBI). Unlike conventional enzymes that cut within their recognition sequence, Type IIS enzymes cut at a defined distance outside their recognition site. This allows the user to design fragments so that the enzyme removes its own site, leaving short, unique, single-stranded overhangs (usually 4 bases). Multiple fragments with compatible overhangs can be combined in a one‑pot reaction with the enzyme and DNA ligase. Because the recognition sites are eliminated from the final product, the assembly is directional, highly efficient, and produces very low background.
Diagram (hand‑made style):
Fragments with recognition sites Each fragment is flanked by BsaI sites (boxes) oriented to cut outward, generating complementary overhangs (e.g., GGAC and CGCT). [BsaI]—GGAC—[Insert A]—CGCT—[BsaI] [BsaI]—CGCT—[Insert B]—GGAC—[BsaI]
One‑pot reaction (cut and paste) BsaI cuts, releasing inserts and removing recognition sites. Complementary overhangs anneal: —GGAC [Insert A] CGCT— —CGCT [Insert B] GGAC—
Ligation DNA ligase seals the nicks, producing the final assembled product without the original BsaI sites: —GGAC [Insert A] CGCT [Insert B] GGAC—
Modeling with Benchling or Asimov Kernel In Benchling, you can simulate Golden Gate Assembly by:
Importing the backbone and insert sequences.
Adding Type IIS sites (e.g., BsaI) to the ends of fragments using the sequence editor.
Using the “Restriction Cloning” tool with the chosen Type IIS enzyme to check that the overhangs are compatible.
Verifying that the final assembled sequence has the fragments joined correctly without leftover enzyme sites.
Assignment: Asimov Kernel Create a Repository for your work Create a blank Notebook entry to document the homework and save it to that Repository Explore the devices in the Bacterial Demos Repo to understand how the parts work together by running the Simulator on various examples, following the instructions for the simulator found in the “Info” panel (click the “i” icon on the right to open the Info panel) Create a blank Construct and save it to your Repository Recreate the Repressilator in that empty Construct by using parts from the Characterized Bacterial Parts repository Search the parts using the Search function in the right menu Drag and drop the parts into the Construct Confirm it works as expected by running the Simulator (“play” button) and compare your results with the Repressilator Construct found in the Bacterial Demos repository Document all of this work in your Notebook entry - you can copy the glyph image and the simulator graphs, and paste them into your Notebook Build three of your own Constructs using the parts in the Characterized Bacterials Parts Repo Explain in the Notebook Entry how you think each of the Constructs should function Run the simulator and share your results in the Notebook Entry If the results don’t match your expectations, speculate on why and see if you can adjust the simulator settings to get the expected outcome
Objective
To recreate the classic Repressilator circuit—a synthetic genetic clock—within the Kernel platform and verify its oscillatory behavior through stochastic simulation.
Design Methodology
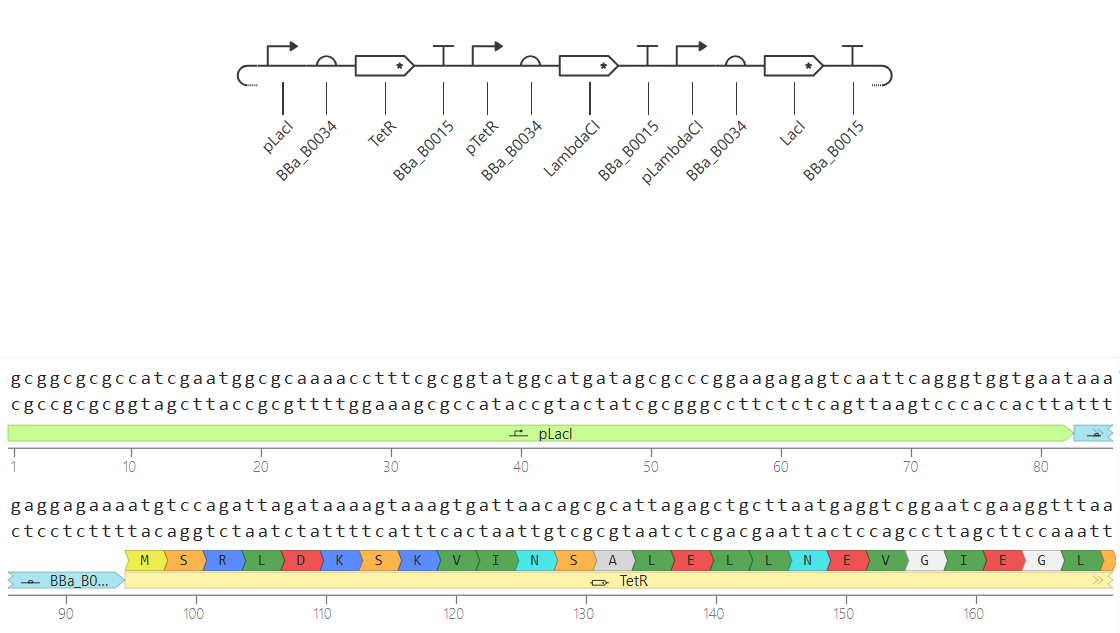
I constructed a closed-loop plasmid consisting of three transcriptional units. Each unit is designed so that its protein product acts as a repressor for the promoter of the following unit ($A \dashv B \dashv C \dashv A$).
The Construct components used are:
- Unit 1:
pLacI(Promoter) +BBa_B0034(RBS) +TetR(CDS) +BBa_B0015(Terminator). - Unit 2:
pTetR(Promoter) +BBa_B0034(RBS) +Lambda cI(CDS) +BBa_B0015(Terminator). - Unit 3:
pLambda(Promoter) +BBa_B0034(RBS) +LacI(CDS) +BBa_B0015(Terminator).
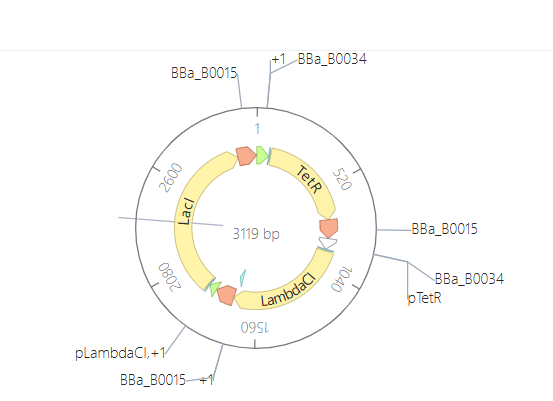
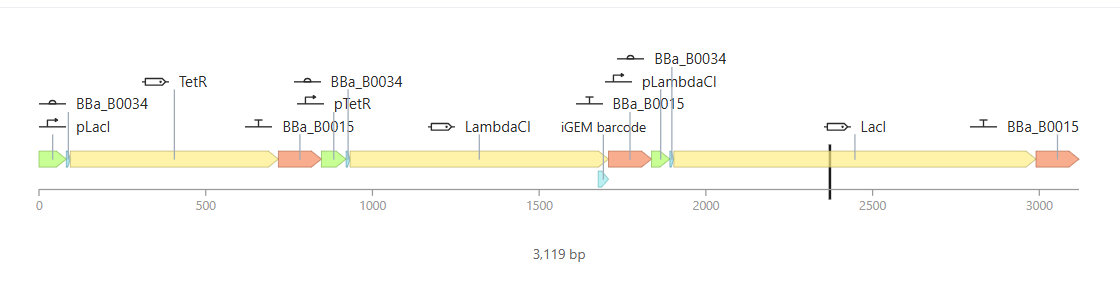
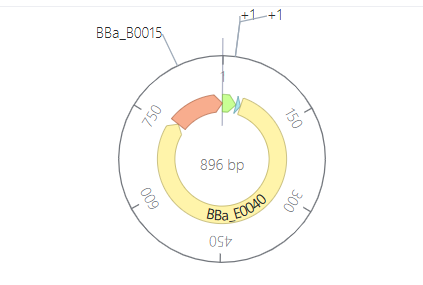
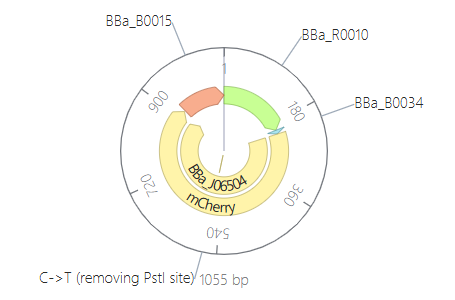
Plasmid Map
The final assembly resulted in a circular plasmid of 3,119 bp. The circularization confirms that the sequences are compatible and the vector is ready for expression in E. coli.
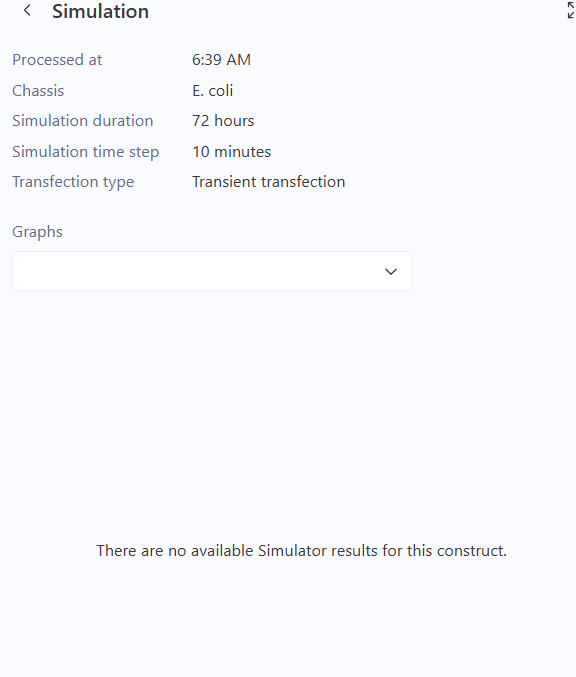
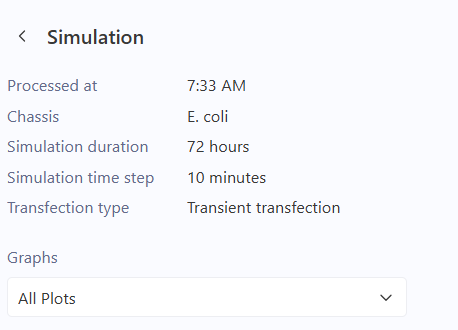
Simulation and Results
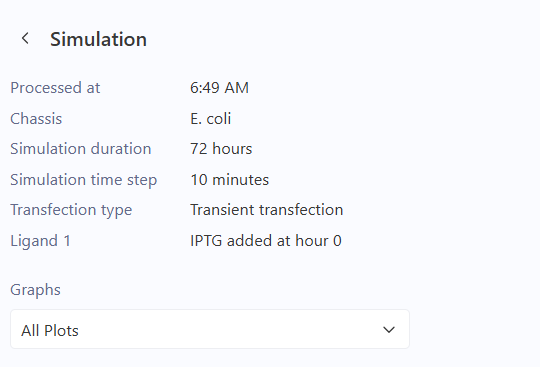
Simulation Parameters
- Chassis: E. coli
- Duration: 72 hours
- Time Step: 10 minutes
Troubleshooting and Optimization
Initially, the simulation was run without any external chemical signals (ligands). This resulted in a “null” output where the simulator could not display protein concentrations.
Reason for failure: In a perfectly symmetrical theoretical model, the three repressors start at an identical concentration of 0. Without a stochastic “kick” or an initial imbalance, the system remains in a state of unstable equilibrium, and the oscillations never start.
Resolution: To break this symmetry, I adjusted the simulation settings by adding a Ligand (IPTG) at t = 0 with Max concentration. This chemical trigger temporarily inhibited one of the repressors, allowing the first gene to express and successfully “kickstart” the rhythmic cycle of the Repressilator. After this adjustment, the simulator was able to calculate and display the expected oscillatory curves.
Observations
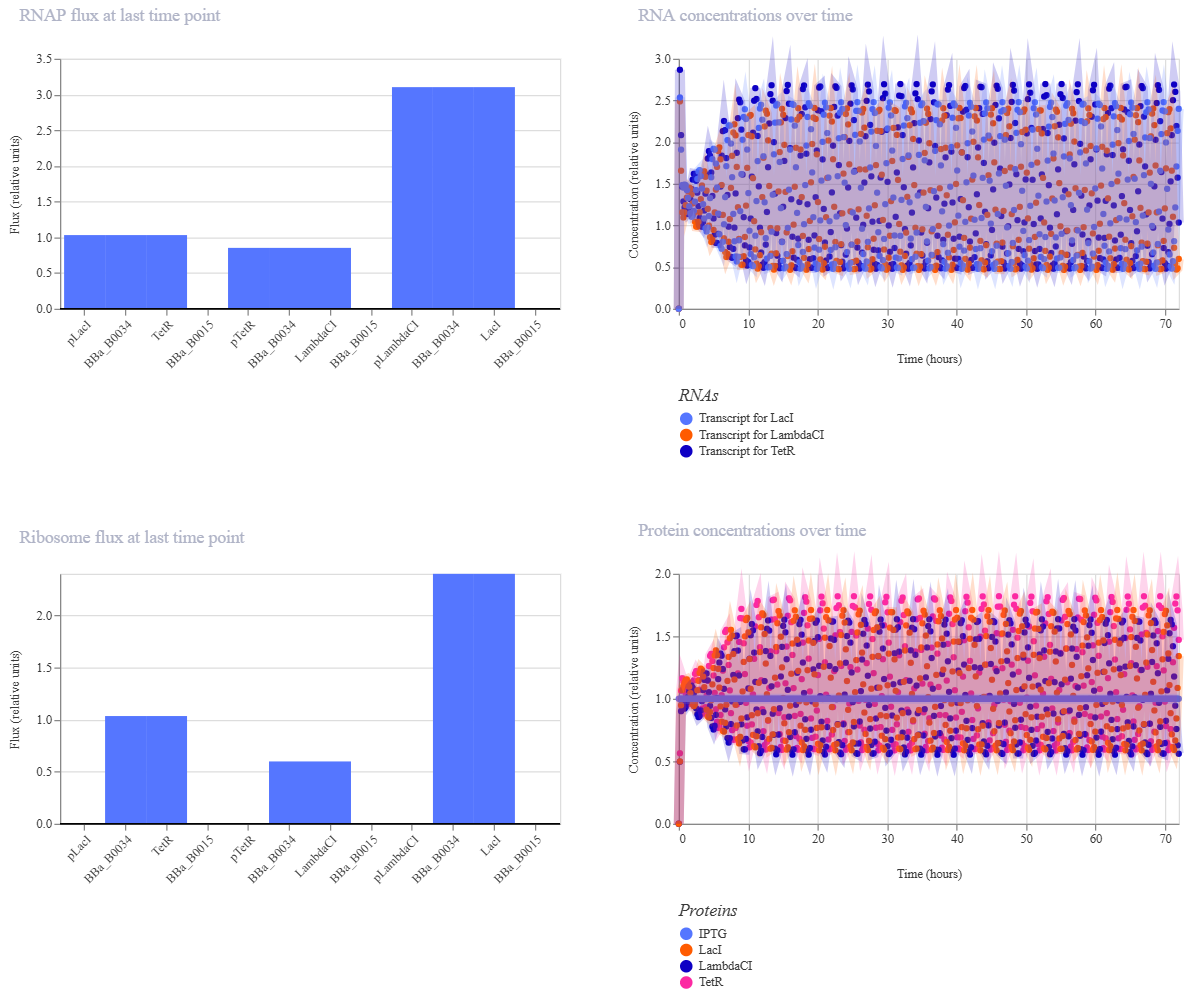
The simulator successfully generated time-course data for the concentrations of the three repressor proteins.
- Analysis: As expected, the protein levels do not reach a steady state but instead exhibit periodic oscillations.
- Comparison: My results match the reference found in the Bacterial Demos repository. The phase shift between the peaks of
TetR,cI, andLacIconfirms the sequential repression logic of the circuit.
Conclusion
The Repressilator was successfully built and simulated. The observed oscillations prove that the feedback loops are correctly configured. The circuit functions as a biological oscillator where the concentrations of the components fluctuate rhythmically over the 72-hour period.
Next Steps
I will now proceed to build three custom constructs to explore different logic gates and constitutive expression patterns.
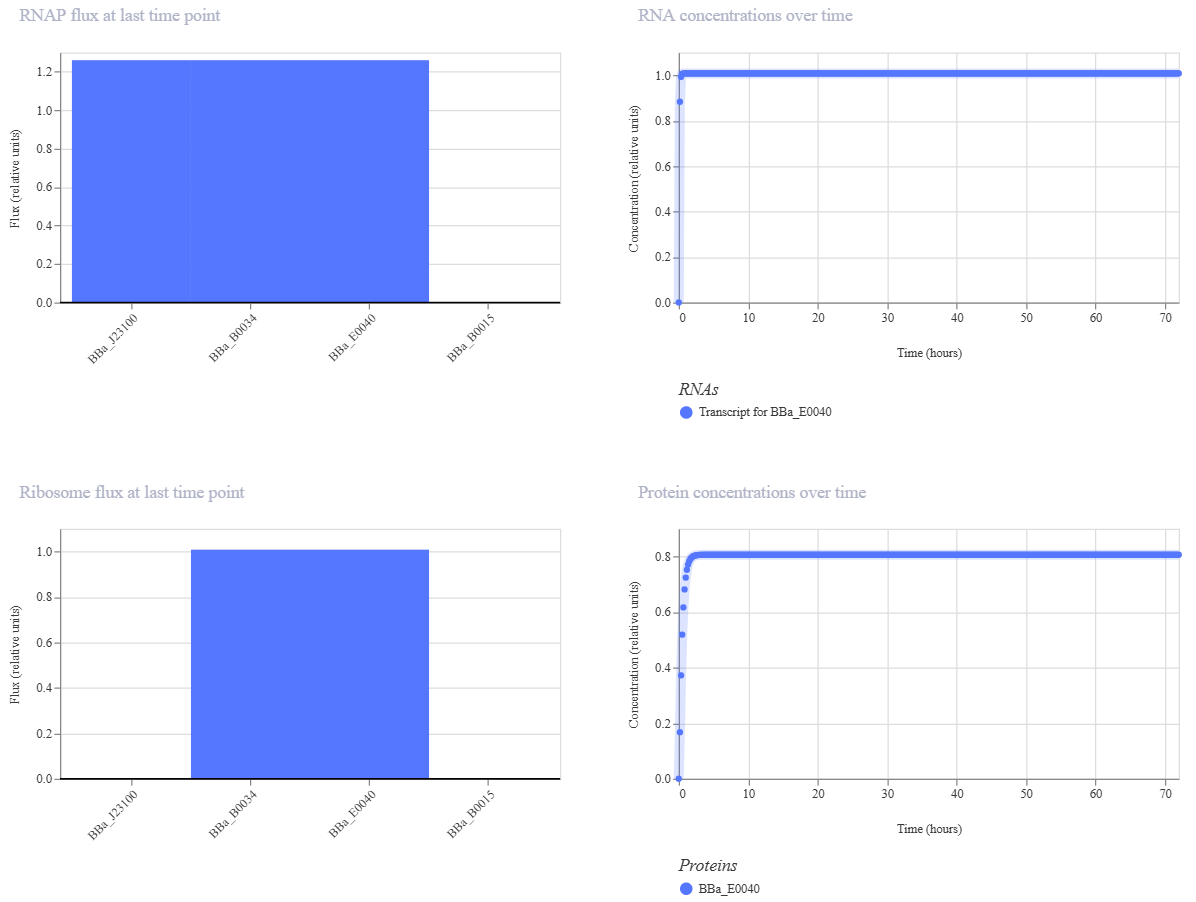
Design 1: Constitutive Gene Expression
Parts: BBa_J23100 (Promoter) + BBa_B0034 (RBS) + BBa_E0040 (GFP) + BBa_B0015 (Terminator).
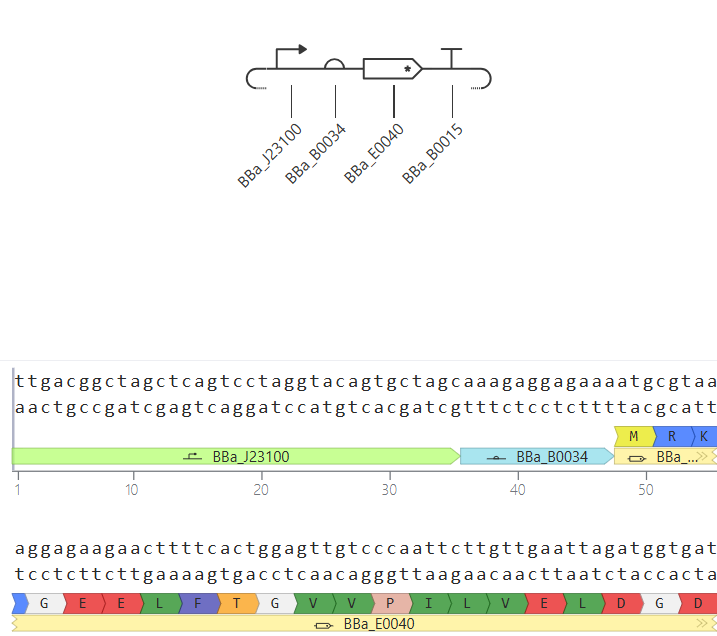

Description: This is a basic expression secondary-level circuit. I used a constitutive promoter from the Anderson family (
J23100), which is “always on” and does not require any external signaling molecules to function.Functional Logic: > The RNA polymerase binds directly to the promoter, initiating the transcription of the Green Fluorescent Protein (GFP). Because there are no repressors involved, the protein concentration increases steadily until it reaches a metabolic plateau.
Expected Outcome: > A continuous upward curve in the simulation graph, representing constant protein production without the need for ligands.
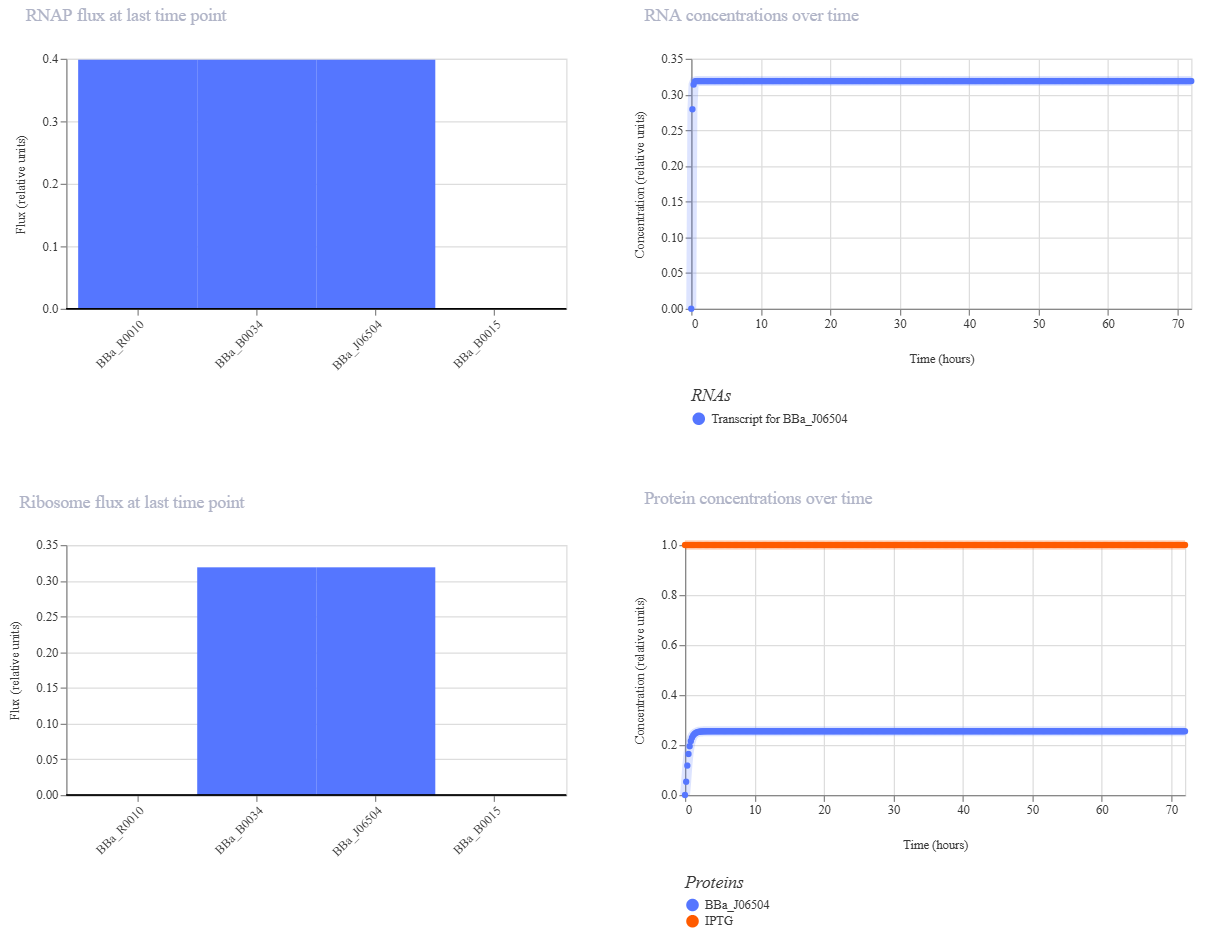
Design 2: Inducible Switch (IPTG Sensor)
Parts: BBa_R0010 (pLac) + BBa_B0034 (RBS) + BBa_J06504 (mCherry) + BBa_B0015 (Terminator).
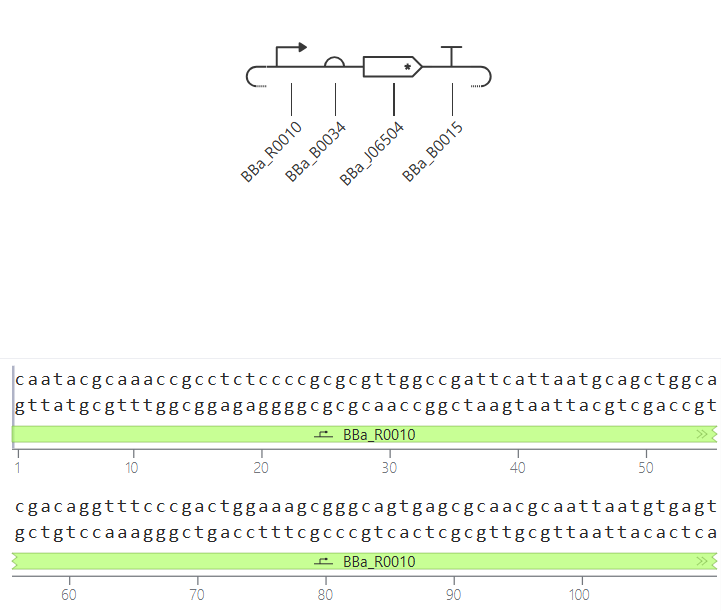
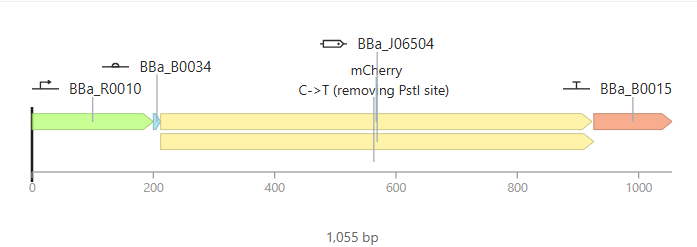
Description: This design functions as an inducible sensor. It uses the
pLacpromoter, which is part of the lactose operon logic. To differentiate it from Design 1, I used the red fluorescent proteinmCherryas a reporter.Functional Logic: By default, the promoter is repressed by the LacI protein (provided by the E. coli chassis). The circuit only “turns on” when IPTG (a lactose analog) is added to the system. IPTG binds to the repressor and releases the promoter.
Expected Outcome: In the absence of IPTG, the production should be zero (flat line). Once the IPTG ligand is added at $t=0$, the simulation should show a rapid induction of red fluorescence.

Design 3: Negative Feedback Loop (Autoregulation)
Parts: BBa_R0040 (pTetR) + BBa_B0034 (RBS) + BBa_C0040 (TetR) + BBa_B0015 (Terminator).
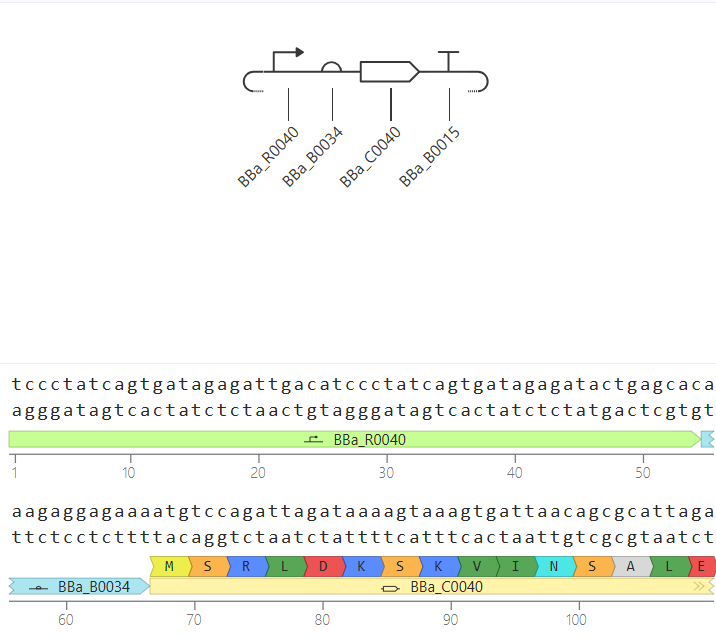
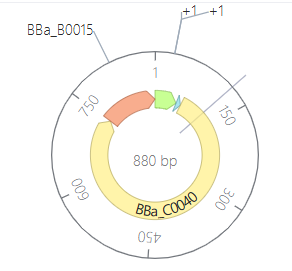
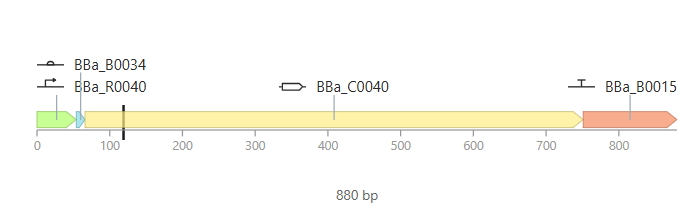
Description: This construct is a self-regulating system. It demonstrates how a genetic circuit can control its own expression levels to maintain homeostasis and prevent the waste of cellular resources.
Functional Logic: The
pTetRpromoter drives the expression of theTetRprotein. However, the TetR protein itself is a repressor for thepTetRpromoter. This creates a negative feedback loop where the product of the gene inhibits its own further production.Expected Outcome: Unlike the constitutive design, this graph should show the concentration stabilizing much faster and at a lower level. This “plateau” happens because the circuit “brakes” itself automatically as soon as enough protein is made.
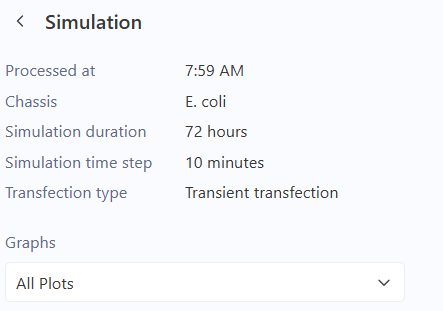
Technical Observation for Design 3: The simulation shows active RNA transcription for the BBa_C0040 (TetR) gene. However, the protein concentration remains at non-detectable levels (N/A). This suggests that the negative feedback is so efficient and immediate that the protein is being repressed before reaching a detectable steady-state, or there is a visualization limitation in the current stochastic model for this specific repressor protein.
In the initial simulation of Design 3, the RNA transcription levels were active, but the protein concentration for BBa_C0040 (TetR) appeared as “N/A” or zero in the results. This occurs because many stochastic simulators categorize specific repressor proteins as internal regulatory molecules rather than visual outputs.
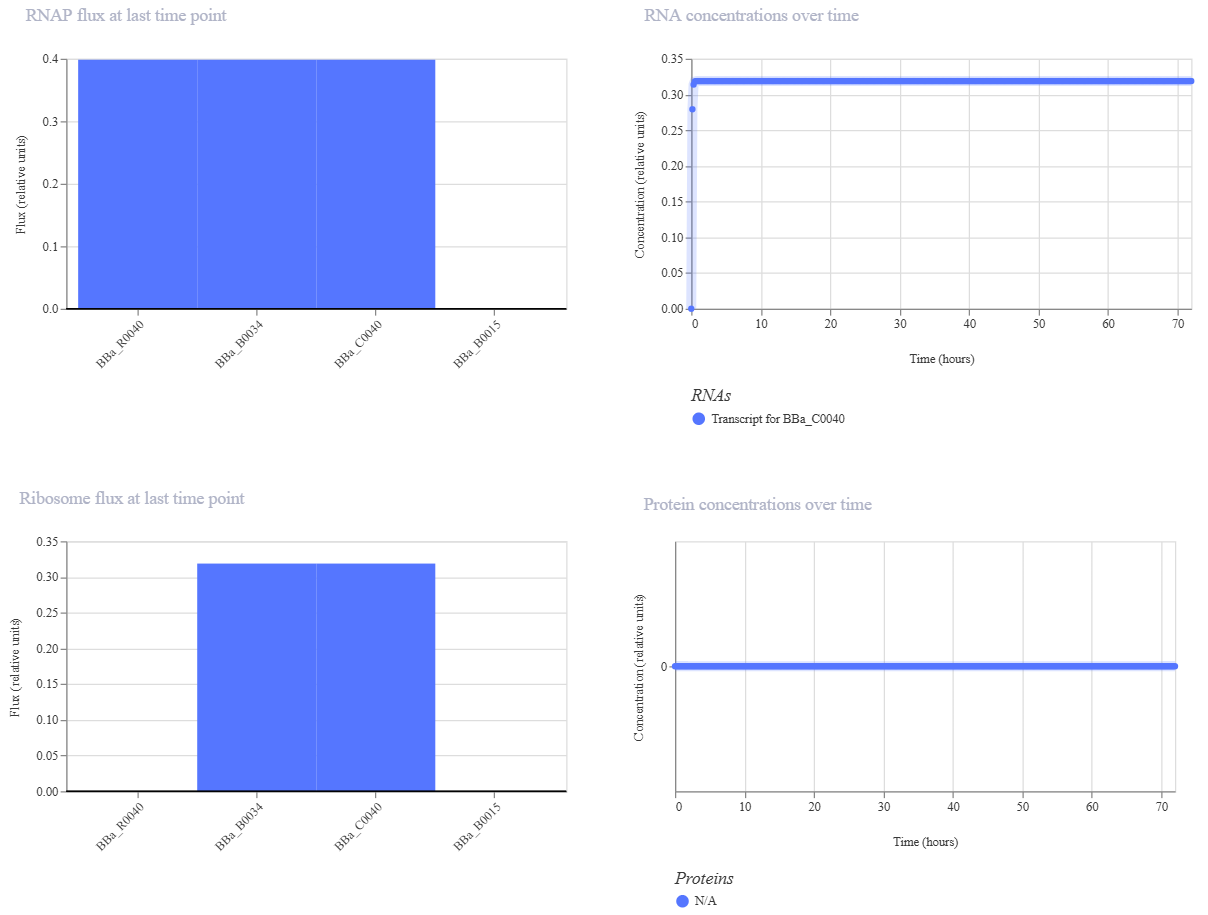
To verify the functional integrity of the pTetR promoter and the translation efficiency of the BBa_B0034 RBS, I replaced the repressor gene (C0040) with a Reporter Gene: the Green Fluorescent Protein (BBa_E0040).
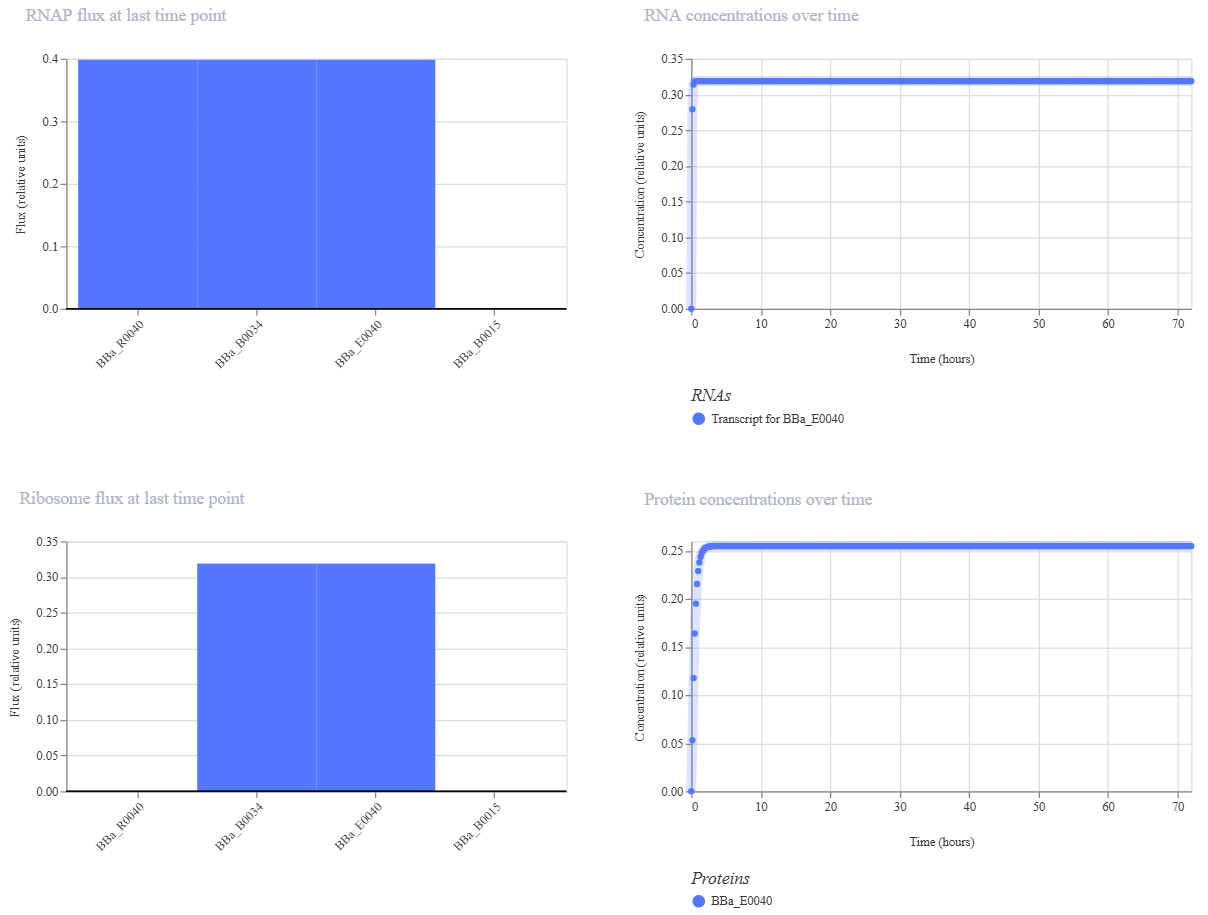
- Visibility: Using GFP allows the simulator to generate a clear, quantifiable protein concentration curve.
- Validation: This change confirms that the promoter-RBS backbone is functional. If GFP is expressed, it proves that the original TetR sequence was also being transcribed and translated, even if it wasn’t visually rendered in the previous graph.
- Data Interpretation: While this specific modified construct no longer performs “Negative Feedback” (since GFP does not repress the pTetR promoter), it serves as a crucial Positive Control to validate the genetic architecture of the design.