This lecture presents a range of advanced technologies to do precision measurement of proteins at atomic scales, characterizing chemical composition, and detecting protein sequence and structure.
A robot-assisted synthetic biology platform that uses automated, plate-based assays to test how ABO-like glycan contexts influence inflammatory and microbiome-related responses relevant to gastrointestinal disease risk.
This week covers neuromorphic genetic circuits, showing how engineered gene networks can implement neural-network “perceptron”-like computation and learning.
This week introduces synthesis of proteins using cellular machinery outside of a cell.
Subsections of Homework
Week 1 HW: Principles and Practices
🧠 Question 1
First, describe a biological engineering application or tool you want to develop and why. This could be inspired by an idea for your HTGAA class project and/or something you are already doing in your research, or something you are just curious about.
✍️ Answer
One biological engineering tool I’m curious about developing is a synthetic biology–based system to explore whether blood group types, especially blood type A, are actually linked to higher gastrointestinal disease risk at a biological level. I’ve read in multiple papers that people with blood type A may have a higher risk for certain gastrointestinal problems (1). However, when I looked into it more, most of the evidence seems to come from population statistics rather than experimental or mechanistic studies. There doesn’t seem to be a clear biological explanation, and there also aren’t many tools that can directly test this relationship in a controlled way. That gap is what makes me interested in this idea. From a synthetic biology perspective, I find it interesting that ABO blood groups are defined by differences in glycan structures, which are known to play roles in cell–cell interactions, immune responses, and host–microbiome relationships (2). This makes me wonder whether these glycan differences could influence how the gut environment responds to inflammation or pathogens and whether that could partially explain the observed disease risk. A possible approach could be to use engineered cells or microbial biosensors with simple genetic circuits that respond to blood-group-related glycan patterns and gastrointestinal inflammation markers. The goal wouldn’t be to create a finished diagnostic tool right away, but rather a research platform that helps test whether these associations are biologically meaningful instead of just statistical.
🧠 Question 2
Next, describe one or more governance/policy goals related to ensuring that this application or tool contributes to an “ethical” future, like ensuring non-malfeasance (preventing harm). Break big goals down into two or more specific sub-goals. Below is one example framework (developed in the context of synthetic genomics) you can choose to use or adapt, or you can develop your own. The example was developed to consider policy goals of ensuring safety and security, alongside other goals, like promoting constructive uses, but you could propose other goals for example, those relating to equity or autonomy.
✍️ Answer
Because this tool links blood group type with disease risk, it raises important ethical and governance concerns. A key goal is preventing harm, especially avoiding discrimination or overinterpretation of results, since blood type alone does not determine gastrointestinal disease risk. Governance should also ensure biological safety and scientific responsibility, particularly if engineered cells or genetic circuits are used, by requiring proper containment and validation before findings are shared beyond research settings. In addition, protecting individual autonomy and privacy is essential, as combining blood group information with biosensor data creates sensitive health information that should only be used with informed consent. Finally, equity should be considered to ensure that the tool does not disproportionately benefit or disadvantage specific populations.
🧠 Question 3
Next, describe at least three different potential governance “actions” by considering the four aspects below (Purpose, Design, Assumptions, Risks of Failure & “Success”). Try to outline a mix of actions (e.g., a new requirement/rule, incentive, or technical strategy) pursued by different “actors” (e.g., academic researchers, companies, federal regulators, law enforcement, etc.). Draw upon your existing knowledge and a little additional digging, and feel free to use analogies to other domains (e.g., 3D printing, drones, financial systems, etc.).
✍️ Answer
Action 1: Regulatory Oversight and Ethical Review
Purpose: Currently, early-stage synthetic biology research often proceeds with minimal oversight, especially in academic labs. I propose requiring that any research using engineered cells or biosensors targeting blood group data undergo formal ethical review and regulatory approval before publication or broader use.
Design: National regulators (e.g., EMA) and university ethics boards would evaluate safety, privacy protections, and non-discrimination measures. Researchers would submit risk assessments and validation plans.
Assumptions: This assumes regulators and review boards have enough expertise in synthetic biology to assess risk accurately and that labs comply with these requirements.
Risks of Failure & “Success”: Failure could occur if the review is too slow or inconsistent, slowing research unnecessarily. Success could unintentionally create overconfidence in safety, leading others to assume the tool is risk-free.
Action 2: Privacy and Data Governance Framework
Purpose: Right now, blood group and biosensor data could be collected without strong protections. I propose treating this information as sensitive health data, requiring secure storage, anonymisation, and informed consent for research or secondary use.
Design: Universities, hospitals, and biotech companies would implement encrypted databases and adopt privacy-by-design models, such as federated learning, where data stays local but insights can still be shared.
Assumptions: Assumes technical infrastructure is available and participants understand consent procedures.
Risks of Failure & “Success”: Data leaks could lead to discrimination or misuse. Overly restrictive rules could hinder collaboration and slow scientific progress.
Action 3: Incentives for Equitable and Responsible Innovation
Purpose: Often, SynBio innovations are developed for wealthy populations or commercial markets. I propose funding programs and grants that encourage open-source development of biosensor tools and ensure accessibility to diverse populations.
Design: Government research agencies (e.g., DFG, Horizon Europe) could tie grants to equity and open-science requirements. NGOs and academic labs could partner to distribute tools widely and safely.
Assumptions: Assumes companies and researchers are motivated by incentives and will participate voluntarily.
Risks of Failure & “Success”: Companies may avoid participation, limiting innovation. Open designs could also be misused if security oversight is insufficient.
🧠 Question 4
Next, score (from 1 to 3, with 1 as the best, or n/a) each of your governance actions against your rubric of policy goals. The following is one framework, but feel free to make your own:
✍️ Answer
Does the option:
Option 1
Option 2
Option 3
Enhance Biosecurity
• By preventing incidents
1
2
3
• By helping respond
1
2
3
Foster Lab Safety
• By preventing incident
1
2
3
• By helping respond
1
2
3
Protect the environment
• By preventing incidents
1
2
3
• By helping respond
1
2
3
Other considerations
• Minimizing costs and burdens to stakeholders
3
2
1
• Feasibility?
2
1
3
• Not impede research
3
2
1
• Promote constructive applications
1
2
3
🧠 Question 5
Last, drawing upon this scoring, describe which governance option, or combination of options, you would prioritise, and why. Outline any trade-offs you considered as well as assumptions and uncertainties. For this, you can choose one or more relevant audiences for your recommendation, which could range from the very local (e.g., to MIT leadership or the Cambridge Mayoral Office) to the national (e.g., to President Biden or the head of a federal agency) to the international (e.g., to the United Nations Office of the Secretary-General or the leadership of a multinational firm or industry consortia). These could also be one of the “actor” groups in your matrix.
✍️ Answer
Based on the scoring of the three governance options, I would prioritise a combination of Option 1 (Regulatory Oversight & Ethical Review) and Option 2 (Privacy & Data Governance Framework), while also incorporating elements of Option 3 (Equity & Incentives) where possible. Regulatory oversight is the most important because it directly enhances biosecurity, lab safety, and environmental protection, which are essential when working with engineered cells or biosensors that interact with human biological data. Privacy and data governance complement this by protecting sensitive blood group and biosensor information, ensuring that individuals’ autonomy is respected and minimising the risk of misuse or discrimination.
Option 3, focusing on equitable access and open-science incentives, is valuable for promoting constructive applications and broad societal benefit, but it has less impact on immediate safety and biosecurity concerns. The main trade-off is that prioritising regulatory oversight and privacy measures may increase costs and slow research progress, while emphasising equity and open access could increase the risk of misuse if technical safeguards are insufficient.
I would recommend this combined approach to national-level regulators and research oversight bodies, such as the EMA or national bioethics committees, because they are in a position to implement formal policies and standards that balance safety, privacy, and societal benefit. The key assumptions are that regulators have sufficient expertise in synthetic biology and that institutions will comply with these rules. Uncertainties include the potential for unforeseen technical risks in engineered biosensors and how effectively privacy protections can prevent indirect discrimination.
This week’s class made me realise that even curiosity-driven synthetic biology work can raise ethical concerns, especially when human biological data is involved. One issue that was new to me was how combining traits like blood group type with disease risk can lead to harm if results are overinterpreted or misused, even without malicious intent. To address this, early ethical review, clear data privacy rules, and careful communication of uncertainty seem important governance actions.
Assignment (Week 2 Lecture Prep)- Professor Jacobson
🧠 Question 1
Nature’s machinery for copying DNA is called polymerase. What is the error rate of polymerase? How does this compare to the length of the human genome? How does biology deal with that discrepancy?
✍️ Answer
Error rate ≈ 1 in 10⁶ bases (10⁻⁶)
Human genome size ≈ 3.2 Gb (3 × 10⁹ bp)
With an error rate of 10⁻⁶, naïvely you’d expect: ~3,000 errors per replication
Biology deals with the discrepancy between the finite error rate of DNA polymerase and the very large size of the human genome by using closed-loop, error-correcting replication rather than relying on single-pass accuracy. Replicative DNA polymerases contain a 3′→5′ proofreading exonuclease that removes misincorporated nucleotides during synthesis, improving fidelity by several orders of magnitude. Errors that escape proofreading are further corrected by post-replication mismatch repair systems such as the MutS pathway, which detect and repair base-pair mismatches. Together, these layered correction mechanisms reduce the effective error rate sufficiently to allow replication of gigabase-scale genomes, enabling biological DNA synthesis to scale far beyond what would be possible with open-loop chemical synthesis.
🧠 Question 2
How many different ways are there to code (DNA nucleotide code) for an average human protein? In practice what are some of the reasons that all of these different codes don’t work to code for the protein of interest?
✍️ Answer
Average human protein ≈ 1036 bp (~350 aa)
Combined with: Degenerate genetic code (multiple codons per amino acid)
This implies: ~3³⁵⁰ possible DNA sequences for one average human protein (combinatorial explosion, not the exact number)
a. GC content & secondary structure
GC = 10%, 50%, 90% → radically different folding energies
DNA is not just information — it is matter with thermodynamics
So many valid codons fail because they: Fold incorrectly, Are unstable, Are hard to synthesize and, Break regulatory behavior
Assignment (Week 2 Lecture Prep)- Dr. LeProust
🧠 Question 1
What’s the most commonly used method for oligosynthesis currently?
✍️ Answer
The most commonly used method for oligonucleotide synthesis is solid-phase phosphoramidite chemistry, originally developed by Caruthers. In this method, DNA is synthesised on a solid support (such as controlled pore glass or silicon) through repetitive cycles of nucleotide coupling, capping of unreacted sites, oxidation, and deprotection. The lecture highlight that this chemistry is highly automatable and forms the basis of modern high-throughput oligo synthesis platforms, including array-based and silicon-based synthesis systems.
🧠 Question 2
Why is it difficult to make oligos longer than 200 nt via direct synthesis?
✍️ Answer
Direct chemical synthesis of oligos becomes inefficient beyond ~200 nucleotides because each synthesis cycle has a coupling efficiency slightly below 100%. These small inefficiencies accumulate over many cycles, leading to a rapid decrease in the fraction of full-length products and a buildup of truncated sequences. As oligo length increases, synthesis errors and truncation products dominate the pool, making purification of the correct full-length oligo increasingly difficult. Additionally, longer sequences are more prone to secondary structure formation, further reducing synthesis efficiency as mentioned.
🧠 Question 3
Why can’t you make a 2000 bp gene via direct oligo synthesis?
✍️ Answer
Synthesising a 2000 bp gene directly using phosphoramidite chemistry is not feasible because the cumulative effect of coupling inefficiencies and error rates makes the yield of full-length, error-free molecules vanishingly small. Over thousands of synthesis cycles, the probability of obtaining a correct full-length product approaches zero, while the majority of molecules are truncated or contain multiple errors. For this reason, the lecture emphasize that modern gene synthesis relies on assembling shorter, chemically synthesized oligos into longer gene fragments using enzymatic assembly methods, followed by sequence verification, rather than attempting direct synthesis of long genes.
Assignment (Week 2 Lecture Prep)- George Church
🧠 Question 1
What are the 10 essential amino acids in all animals and how does this affect your view of the “Lysine Contingency”?
✍️ Answer
Animals require ten essential amino acids: histidine, isoleucine, leucine, lysine, methionine, phenylalanine, threonine, tryptophan, valine, and arginine (during growth) because they cannot synthesise them on their own. This limitation is metabolic rather than genetic, meaning the ribosome can translate these amino acids, but the organism must obtain them from the environment, as emphasised in Church’s slides of amino acid constraints.
The lysine contingency is especially important because animals completely lack a lysine biosynthesis pathway. This makes lysine a reliable metabolic bottleneck that can be exploited for biocontainment. An engineered organism that depends on lysine, or a lysine analogue, cannot survive without external supplementation, reducing the risk of escape or uncontrolled spread. Lysine is also central to protein function due to its positive charge and role in protein–protein interactions and post-translational modifications. Because lysine is essential at metabolic, structural, and regulatory levels, the lysine contingency provides a robust and evolution-resistant control strategy in synthetic biology.
Assignment (Your HTGAA Website) — DUE BY START OF FEB 10 LECTURE
Begin personalising your HTGAA website in in https://edit.htgaa.org/, starting with your homepage—fill in the template with information about yourself, or remove what’s there and make it your own. Be creative! - Donr
As with all assignments in HTGAA, be sure to write up every part of this homework on your HTGAA website in order to receive credit. - Done
References
(1) J. Y. Huang, R. Wang, Y.-T. Gao, and J.-M. Yuan, “ABO blood type and the risk of cancer – Findings from the Shanghai Cohort Study,” PLoS ONE, vol. 12, no. 9, p. e0184295, Sep. 2017, doi: 10.1371/journal.pone.0184295.
(2) G. Misevic, “ABO blood group system,” Blood and Genomics, vol. 2, no. 2, pp. 71–84, Jan. 2018, doi: 10.46701/apjbg.2018022018113.
**The cover page and the text rephrasing of some lines done by AI.
Running this through ProtParam gives a calculated molecular weight of approximately 27,854 Da (27.85 kDa). The His6-tag adds about 840 Da on top of what the core GFP sequence would weigh, and the LE linker adds a small amount on top of that. It’s worth noting that the chromophore (formed autocatalytically from residues Ser65-Tyr66-Gly67) involves a dehydration and cyclization that reduces the mass slightly relative to the raw amino acid sum — so the “real” mass of mature eGFP is a touch lower than what ProtParam gives for the linear sequence alone.
Q2. Calculating MW from adjacent charge states in Figure 1
This is the fun part , you’re essentially reverse-engineering the protein’s mass from the m/z peaks without needing to know the charge states in advance.
The formula for finding z from two adjacent peaks is:
z = (m/z of n+1) / ((m/z of n) - (m/z of n+1))
Looking at Figure 1, I’ll pick two adjacent peaks to work with. I’ll use the peaks at m/z = 1232 and m/z = 1169 as my pair.
Step 1 — Find z:
z = 1169 / (1232 - 1169) = 1169 / 63 = 18.6, which rounds to z = 19 for the peak at m/z 1169, meaning z = 20 for the peak at m/z 1232.
This is well within what you’d expect from a high-resolution instrument like the Xevo G3 QTof , typically under 0.02% for intact proteins.
Q3. Can you observe the charge state for the zoomed-in peak?
Yes, you can, and this is one of those things that seems confusing until you just think about what you’re actually looking at. Each peak in a mass spectrum for a protein isn’t a single line, it has isotope peaks spaced around it. For a multiply charged ion, those isotope peaks are separated by 1/z in m/z space. So if your isotopes are spaced 0.05 m/z apart, z = 20. If they’re spaced 0.1 apart, z = 10.
On the Xevo G3 with 30,000 resolution, the instrument can resolve individual isotope peaks for a charge state in the +20 to +25 range, because at those charges the isotope spacing (~0.05 Da) is just barely within the instrument’s resolving power. For the zoomed-in peak in Figure 1, the isotope spacing visible in the zoom should tell you the charge directly, just take 1 divided by the spacing. If the spacing looks like ~0.048, then z ≈ 21.
Waters Part II — Secondary/Tertiary Structure
Q1. Native vs. denatured conformations , what’s happening and what does the MS tell you?
When a protein is in its native state, it’s folded all those hydrophobic residues are tucked inside, the backbone is constrained into helices and sheets, and the whole structure holds together through a combination of hydrophobic packing, hydrogen bonds, and sometimes disulfide bridges. In that compact state, the protein presents fewer surface-exposed sites for protonation, meaning when you spray it into the mass spec, it picks up fewer charges.
Denatured proteins are completely unfolded, the whole backbone is stretched out and solvent-exposed. Every basic residue (Lys, Arg, His, and the N-terminus) can now pick up a proton from the electrospray solvent. So a denatured protein acquires many more charges than the same protein in its native state.
This is exactly what you see in Figure 2. The denatured spectrum (top) shows a wide distribution of charge states at lower m/z values, lots of highly charged ions, spread across a broad range, because the unfolded chain is picking up +20 to +30 charges. The native spectrum (bottom) shows a much tighter, narrower distribution at higher m/z values, fewer charges, higher m/z, and a much more compressed charge state envelope. The two spectra are from the same protein but look almost nothing alike, which is kind of remarkable. It’s basically a mass spec readout of protein folding.
Q2. Charge state of the peak at ~2800 m/z in the native eGFP spectrum (Figure 3)
To figure out the charge state, you look at the spacing between the isotope peaks in the zoomed inset. The relationship is simple:
z = 1 / isotope spacing
So if the isotope peaks in the inset are spaced 0.1 m/z apart:
z = 1 / 0.1 = 10
You can also sanity check this using the molecular weight:
z = MW / m/z = 27854 / 2800 = 9.9, which rounds to z = 10
Both approaches agree , the charge state is +10.
This makes complete sense for native eGFP. Because it’s folded into a compact beta-barrel structure, most of its basic residues are buried inside or not accessible to the solvent. So when it gets sprayed into the mass spec, it only picks up around 10 protons rather than the 20-25 you’d see in the denatured state. The tightly spaced, narrow charge state distribution you see in the native spectrum in Figure 2 is a direct reflection of that compact, folded structure , fewer charges, higher m/z, much cleaner looking spectrum overall.
Waters Part III — Peptide Mapping
Q1. Lysines (K) and Arginines (R) in eGFP, and their count
Trypsin cuts after K and R (except when followed by P, which it typically skips). Going through the sequence systematically:
Going through the full sequence, eGFP contains approximately 19 Lysines (K) and 10 Arginines (R) so around 29 potential tryptic cleavage sites. The exact count depends slightly on the specific sequence variant, but running it through Benchling’s biochemical properties tab will give you the precise numbers for your submission. For the homework, you’d highlight each K and R in yellow/circle them as you go through the sequence.
Q2. Number of peptides from tryptic digestion (PeptideMass tool)
After pasting the eGFP sequence into the PeptideMass tool at web.expasy.org/peptide_mass with the conditions shown in Figure 4 (trypsin, one missed cleavage, monoisotopic masses), the tool typically returns around 30–35 peptides depending on the exact parameters. The number can vary based on whether you allow missed cleavages with zero missed cleavages you’d get the maximum theoretical cut, and with one missed cleavage (which is more realistic, since trypsin occasionally skips a site) you get more and slightly longer peptides.
The important thing to record is the exact number the tool gives you for your specific parameter settings, since that’s what you’ll compare against the chromatogram.
Q3. How many chromatographic peaks between 0.5 and 6 minutes in Figure 5a?
Looking at the TIC in Figure 5a and counting all peaks above 10% relative abundance between 0.5 and 6 minutes, you can see roughly 18–22 distinct peaks. The chromatogram shows a relatively complex elution profile as you’d expect — early-eluting peaks tend to be small, hydrophilic peptides that don’t retain well on reverse-phase columns, while later peaks are more hydrophobic. The peak at 2.78 minutes is circled as the example they want you to work with.
Q4. Do the peaks match the predicted peptide count?
Probably not perfectly, and that’s completely normal. There are almost always fewer peaks than predicted peptides for a few reasons. First, some very small peptides (like dipeptides or tripeptides) are too small to retain on a reverse-phase column and elute in the void volume or not at all. Second, some peptides with very similar hydrophobicity co-elute and appear as one merged peak. Third, the very large or hydrophobic peptides may elute after 6 minutes or stick to the column. So the chromatogram showing fewer peaks than the predicted count isn’t a problem , it just reflects the physical reality of LC separation.
Q5. m/z and charge state of the peptide at 2.78 min (Figure 5b)
From Figure 5b, the most abundant peak sits at m/z = 525.76.
Step 1 — Find the charge state:
Look at the isotope spacing in the zoomed inset. The isotope peaks are separated by 0.5 m/z, so:
z = 1 / 0.5 = 2
The charge state is +2, which is completely typical for a tryptic peptide of this size — most tryptic peptides come out doubly charged because trypsin cuts after K and R, leaving one basic residue at the C-terminus and the free N-terminus accounting for the second charge.
Step 2 — Calculate the singly charged mass:
[M+H]+ = (m/z × z) - (z - 1) × 1.00728
[M+H]+ = (525.76 × 2) - (1 × 1.00728)
[M+H]+ = 1051.52 - 1.007 = 1050.51 Da
So the singly charged monoisotopic mass of this peptide is approximately 1050.51 Da, which you’ll use in Question 6 to match it against the predicted peptide list from the PeptideMass tool.
Q6. Identifying the peptide and calculating mass accuracy
Taking the experimental mass of 1050.51 Da from Question 5 and cross-referencing it against the peptide list from the PeptideMass tool, the closest matching tryptic peptide from the eGFP sequence is DELYK, which has a theoretical monoisotopic mass of 1050.48 Da.
For a BioAccord system you’d typically expect to land somewhere between 5 and 20 ppm for peptide masses, so 28.6 ppm is just slightly above the ideal range but still reasonable. If your number comes out higher than expected, the most common reason is accidentally picking the M+1 or M+2 isotope peak instead of the true monoisotopic peak, for larger peptides the monoisotopic peak is actually the smallest one in the cluster, which catches a lot of people off guard the first time.
Q7. Percentage of sequence confirmed by peptide mapping (Figure 6)
Looking at Figure 6’s amino acid coverage map, the highlighted/colored residues represent positions confirmed by identified peptides. From the coverage map, roughly 85–90% of the eGFP sequence is covered. This is actually a really good result for a standard tryptic peptide map, full 100% coverage is rare because there are always a few peptides that are either too small, too large, or too hydrophobic to detect reliably. The His-tag region and any very short peptides from the C- or N-terminus tend to be the ones that fall through the cracks.
Bonus Q8. Peptide sequence from fragmentation spectrum (Figure 5c)
This is where it gets genuinely interesting. Take the peptide mass you identified (~1050.51 Da) and find the matching sequence from your PeptideMass output. Paste that sequence into the fragment ion calculator at db.systemsbiology.net/proteomicsToolkit/FragIonServlet.html and generate the predicted b- and y-ion series.
Then compare those predicted fragment masses to the peaks in Figure 5c. b-ions are N-terminal fragments, y-ions are C-terminal fragments. If most of the peaks in the fragmentation spectrum match your predicted series within a few ppm, you’ve confirmed the sequence. For a doubly charged precursor around m/z 525.76, you’d expect to see a series of singly charged y-ions and b-ions across the 200–1000 Da range, giving you a readout of the sequence from both ends simultaneously.
Bonus Q9. Does the peptide map make sense — is this actually eGFP?
Yes, absolutely, and this is the whole point of doing a peptide map in the first place. Between the mass accuracy of the individual peptide identifications and the ~85–90% sequence coverage shown in Figure 6, you have strong evidence that the protein you analyzed is eGFP. If this were an unknown or misidentified protein, you’d see peptide masses that don’t match the expected tryptic fragments, gaps or mismatches in the coverage map, and poor mass accuracy across the board.
The fact that a large majority of peptides match their predicted masses within single-digit ppm error, combined with the fragmentation spectra matching predicted b/y-ion series, gives you essentially orthogonal confirmation of the protein’s identity and primary structure. It’s much stronger evidence than just running a gel and seeing a band at the right molecular weight.
Waters Part IV — Oligomers (KLH)
Identifying oligomeric states on the CDMS spectrum (Figure 7)
Here’s Part IV fully written out:
Waters Part IV — Identifying KLH Oligomeric States on the CDMS Spectrum
Using the subunit masses from Table 1 (7FU = 340 kDa, 8FU = 400 kDa), I can calculate the expected mass for each oligomeric species and then locate them on Figure 7.
7FU Decamer (10 subunits of 7FU):
Mass = 10 × 340 kDa = 3,400 kDa
8FU Didecamer (20 subunits of 8FU):
Mass = 20 × 400 kDa = 8,000 kDa
8FU 3-Decamer (30 subunits of 8FU):
Mass = 30 × 400 kDa = 12,000 kDa
8FU 4-Decamer (40 subunits of 8FU):
Mass = 40 × 400 kDa = 16,000 kDa
So on Figure 7 you’re looking for four distinct peaks or clusters sitting at approximately 3.4 MDa, 8 MDa, 12 MDa, and 16 MDa respectively. The 8FU species are evenly spaced 4,000 kDa apart from each other, which is a useful sanity check , if your peak assignments are correct, that consistent spacing should be obvious on the spectrum.
The reason CDMS works so well here is that it measures the mass of each individual particle directly, without needing to resolve overlapping charge states like conventional MS would. For something as massive as KLH , which can reach 16 MDa , conventional MS would give you a completely unresolvable mess of overlapping charge envelopes. CDMS sidesteps that entirely by simultaneously measuring both the charge and the m/z of each single ion, giving you a clean direct mass readout even at these enormous sizes.
Waters Part V — Did I Make GFP?
Theoretical
Observed/Measured on Intact LC-MS
PPM Mass Error
Molecular weight (kDa)
27.854 kDa
~27.856 kDa (read from deconvoluted spectrum)
~72 ppm
The theoretical MW comes from the ProtParam calculation on the full sequence including His-tag and LE linker. The observed value comes from the deconvoluted intact LC-MS spectrum (where the instrument software converts the charge state distribution back into a single mass readout). For a well-run experiment on a Xevo G3, you’d expect the error to be well under 100 ppm for intact protein, ideally closer to 10–50 ppm. If your observed mass matches the theoretical within that range, yes, you made (or at least received) correctly folded, properly sized eGFP.
Week 11 HW: Bioproduction & Cloud Labs
Part A — The 1,536 Pixel Artwork Canvas
Unfortunately, I wasn’t able to contribute to the pixel artwork before the April 19 deadline. Looking at the final result, though, I found the concept of emergent collective creativity really compelling… hundreds of independent decisions producing a coherent image is a great parallel to how biological systems self-organize. For next year, a more prominent reminder with a countdown timer on the course page itself would help students like me who missed the email with the personalized URL. It would also be interesting to have a live preview of the canvas as it fills up so contributors can make more intentional decisions about where their pixels fit into the bigger picture.
Part B — Cell-Free Protein Synthesis | Cell-Free Reagents
1. Role of each component:
E. coli Lysate — BL21 (DE3) Star Lysate (includes T7 RNA Polymerase)
This is the core of the entire reaction. It provides all the molecular machinery needed to go from DNA to protein, including ribosomes, translation factors, chaperones, and T7 RNA polymerase. The BL21 (DE3) Star strain is particularly well-suited because the “Star” mutation disables RNase E, slowing mRNA degradation and allowing sustained protein production over longer reaction times.
Potassium Glutamate
Potassium ions are essential for ribosome stability and activity. Glutamate is used as the counterion instead of chloride because chloride inhibits transcription and translation at the concentrations needed, while glutamate is metabolically compatible and doesn’t interfere with the reaction machinery.
HEPES-KOH pH 7.5
This is the main buffer of the reaction. As transcription and translation proceed, acidic byproducts accumulate and the pH drops, which disrupts ribosome function. HEPES maintains a stable pH around 7.5, keeping conditions optimal for both the RNA polymerase and the ribosome throughout the reaction.
Magnesium Glutamate
Magnesium is one of the most critical ions in the system. Ribosomes require it as a structural cofactor, RNA polymerase depends on it catalytically, and ATP functions primarily as an Mg-ATP complex in enzymatic reactions. The concentration needs to be carefully optimized because too little stops the reaction and too much causes inhibition and precipitation.
Potassium Phosphate Monobasic / Dibasic
Together these form a secondary phosphate buffer that adds pH stability on top of HEPES. They also supply inorganic phosphate that feeds into energy regeneration reactions happening within the lysate, since phosphate is both a substrate and product of ATP metabolism.
Ribose
Ribose feeds into the pentose phosphate pathway enzymes present in the lysate, supporting NADPH regeneration and nucleotide biosynthesis. It’s a key part of what makes this a long-duration energy system. Rather than being a one-shot phosphate donor, it continuously supports metabolism throughout the reaction.
Glucose
Glucose is the primary carbon and energy source for the 20-hour reaction format. The glycolytic enzymes in the lysate metabolize it to pyruvate, regenerating ATP in the process. Unlike simpler systems that rely on a fixed phosphate donor like PEP, glucose provides sustained energy by essentially running a simplified version of central carbon metabolism inside the reaction tube.
AMP, CMP, GMP, UMP
These nucleoside monophosphates are the precursors for RNA synthesis. Rather than adding costly NTPs directly, the system provides monophosphate forms that get phosphorylated to triphosphates by kinases already present in the lysate. This approach avoids the transcriptional inhibition that can come from high NTP concentrations and makes the system significantly more economical for long reactions.
Guanine
Guanine base is added separately because the guanine nucleotide pool depletes faster than other nucleotides during extended reactions. GTP is consumed heavily both as a transcription substrate and as an energy carrier during translation elongation. Adding free guanine allows the lysate’s nucleotide salvage pathways to continuously replenish GTP, preventing it from becoming a bottleneck.
17 Amino Acid Mix
This provides 17 of the 20 standard amino acids needed for protein synthesis. Tyrosine and cysteine are left out of this mix and added separately because they have poor solubility or stability under standard storage conditions (tyrosine is nearly insoluble at neutral pH and cysteine oxidizes readily, so both need to be prepared and handled differently).
Tyrosine
Tyrosine is added as a separate component because it has very low solubility at neutral pH and can’t be included in a standard amino acid mix without precipitation issues. It’s essential for translation though, since many proteins including fluorescent proteins rely on tyrosine for their chromophore formation.
Cysteine
Cysteine is kept separate because it oxidizes easily and can form disulfide bonds with other cysteines in the mix, depleting the free amino acid pool before it ever gets incorporated into protein. Adding it fresh and separately ensures it’s available in its reduced, usable form during translation.
Nicotinamide
Nicotinamide is a precursor to NAD+ and NADP+, which are essential cofactors for many of the oxidoreductase reactions running in the lysate during energy metabolism. Without replenishing these cofactors, the redox balance in the reaction shifts and energy regeneration slows down. Including nicotinamide helps maintain the NAD+/NADH pool throughout the reaction.
Nuclease Free Water
This is the backfill, essentially used to bring the reaction up to its final volume after all other components have been added. Using nuclease-free water is important because even trace amounts of RNases or DNases would degrade your mRNA or DNA template and kill the reaction.
2. Differences between the 1-hour PEP-NTP master mix and the 20-hour NMP-Ribose-Glucose master mix:
The main difference comes down to how each system generates and sustains the energy needed for transcription and translation. The 1-hour PEP-NTP system is a fast, straightforward approach. Phosphoenolpyruvate acts as a direct phosphate donor to regenerate ATP from ADP through pyruvate kinase, and pre-formed NTPs are provided directly for transcription. It works quickly but burns through its substrates fast, making it suitable only for short reactions. The 20-hour NMP-Ribose-Glucose system takes a completely different approach. It provides nucleoside monophosphates instead of triphosphates, and uses glucose and ribose as carbon sources that feed into glycolysis and the pentose phosphate pathway to continuously regenerate both ATP and NTPs from within the lysate’s own metabolism. This makes it far more self-sustaining, but it requires more complex metabolic activity from the lysate and takes longer to ramp up. Essentially the PEP-NTP system is optimized for speed and simplicity while the NMP-Ribose-Glucose system is optimized for yield and duration.
3. How can transcription occur if GMP is not included but Guanine is?
When you add free guanine base to the reaction, the lysate’s nucleotide salvage pathway enzymes convert it back into GMP, then GDP, and finally GTP through a series of phosphorylation steps using ATP as the phosphate donor. Specifically, hypoxanthine-guanine phosphoribosyltransferase (HGPRT) converts guanine to GMP using PRPP (phosphoribosyl pyrophosphate) as the ribose-phosphate donor, and then guanylate kinase and nucleoside diphosphate kinase phosphorylate it up to GTP. So you’re not skipping GMP, you’re just letting the lysate make it itself from the free base, which is actually more efficient because free bases are cheaper and more stable than nucleotides.
Part C — Planning the Global Experiment | Cell-Free Master Mix Design
1. Biophysical or functional properties of each fluorescent protein:
sfGFP
sfGFP (superfolder GFP) was specifically engineered to fold robustly even when fused to poorly folding proteins. Its key property in cell-free systems is its extremely fast and reliable folding , it reaches full fluorescence quickly after synthesis, making it a great positive control. The one caveat is that like all GFP variants, it requires molecular oxygen for chromophore maturation, so in reactions where oxygen is limited (deep in a well plate under a seal), you might see lower fluorescence than expected even if protein yield is high.
mRFP1
mRFP1 was the first true monomeric red fluorescent protein, derived from DsRed. Its main limitation in cell-free systems is relatively slow chromophore maturation, it takes significantly longer than GFP variants to become fully fluorescent after being synthesized. This means in a short reaction window you might underestimate how much protein was actually made, and for a 36-hour incubation you need to account for the fact that fluorescence will keep increasing even after active translation has stopped. It also has lower brightness than newer red variants.
mKO2
mKO2 is a monomeric orange fluorescent protein derived from Kusabira Orange. Its key biophysical property relevant to cell-free expression is that it has a relatively long maturation time , longer than GFP but slightly better than mRFP1. It’s also pH-sensitive, with fluorescence decreasing noticeably below pH 6. In a cell-free reaction where pH can drift as acidic byproducts accumulate, this pH sensitivity could cause you to underestimate actual protein concentration if buffering isn’t maintained well throughout the reaction.
mTurquoise2
mTurquoise2 is one of the best cyan fluorescent proteins available , it has an exceptionally high quantum yield and is one of the brightest proteins in the cyan range. For cell-free systems its main advantage is fast maturation and high photostability, making it ideal for long 36-hour reads where you need reliable signal over time. One thing to watch out for is spectral bleed-through into the GFP channel if you’re running a multiplexed reaction, since its emission tail overlaps with sfGFP excitation.
mScarlet-I
mScarlet-I is a fast-maturing variant of mScarlet, engineered specifically to improve maturation speed over the original while maintaining high brightness. In cell-free systems this fast maturation is its biggest advantage , you can get reliable fluorescence readout much earlier in the reaction compared to mRFP1 or mKO2. It’s also relatively insensitive to pH in the physiological range, which makes it more robust in cell-free conditions where pH management isn’t perfect.
Electra2
Electra2 is a relatively new infrared-range fluorescent protein. Its key property that matters in cell-free systems is that it requires a biliverdin chromophore cofactor that is not naturally present in E. coli lysate unlike GFP-based proteins that autocatalytically form their chromophore from their own amino acids, Electra2 needs exogenous biliverdin added to the reaction to fluoresce at all. This makes it uniquely challenging in cell-free systems , if you don’t supplement the reaction with biliverdin, you’ll get zero fluorescence even if the protein is being made perfectly well.
2. Hypothesis for improving fluorescence over 36-hour incubation:
I’m focusing on Electra2 since it has the most obvious and addressable limitation in cell-free conditions.
Hypothesis: Supplementing the cell-free master mix with exogenous biliverdin at a concentration of 25–50 μM will significantly increase Electra2 fluorescence output over a 36-hour incubation compared to unsupplemented reactions.
The reasoning is straightforward: Electra2 is a biliverdin-dependent fluorescent protein, meaning it can’t form a functional chromophore without this cofactor. E. coli lysate contains no meaningful amount of biliverdin because bacteria don’t have the heme oxygenase pathway that produces it in mammalian cells. So no matter how well the protein folds or how much of it gets made, none of it will be fluorescent without biliverdin present. By adding biliverdin directly to the custom reagent supplement slot in the 2 μL addition, every newly synthesized Electra2 molecule will immediately have access to its chromophore precursor, maximizing the fraction of protein that becomes fluorescent. The expected effect is a large increase in fluorescence signal, essentially “unlocking” the protein’s fluorescence that would otherwise be completely invisible. A titration of biliverdin concentration (0, 10, 25, 50, 100 μM) would let you find the optimal amount without wasting cofactor or potentially causing any inhibitory effects at very high concentrations.
3. Master Mix Compositions:
My 8 well assignments and their custom reagent adjustments are as follows:
Q1-D19 — Electra2 (Low energy condition): Default composition with glucose increased slightly above baseline to provide a modest boost in sustained energy metabolism.
Q1-E19 — Electra2 (Medium energy condition): Glucose increased moderately above baseline, ribose increased once above baseline to support both glycolysis and the pentose phosphate pathway simultaneously.
Q1-F19 — Electra2 (High energy condition): Glucose increased substantially above baseline, ribose increased twice above baseline, AMP increased once to provide additional nucleotide precursors for sustained transcription.
Q2-A1 — mRFP1 (Low magnesium boost): Magnesium Glutamate increased twice above baseline to modestly enhance ribosome activity and translation speed.
Q2-A2 — mRFP1 (High magnesium boost): Magnesium Glutamate increased four times above baseline to more aggressively test whether higher Mg2+ accelerates maturation.
Q3-H13 — mKO2 (Buffer protection): HEPES-KOH increased twice above baseline to maintain pH stability throughout the 36-hour incubation and protect mKO2 fluorescence from acid-induced quenching.
Q4-B3 — mTurquoise2 (Amino acid boost): 17 Amino Acid Mix increased once above baseline, Tyrosine increased twice above baseline to address the known solubility limitation of tyrosine in standard cell-free amino acid mixes.
Q1-D1 — mScarlet-I (Sustained energy): Glucose increased twice above baseline, Ribose increased once above baseline, Nicotinamide increased once above baseline to support sustained NAD+ regeneration and energy metabolism over the full reaction duration.
Week 2 HW: DNA Read, Write, & Edit
Part 0: Basics of Gel Electrophoresis
Attend or watch all lecture and recitation videos. Optionally watch bootcamp.
Part 1: Benchling & In-silico Gel Art
Make a free account at benchling.com
Import the Lambda DNA.
Simulate Restriction Enzyme Digestion with the following Enzymes:
EcoRI
HindIII
BamHI
KpnI
EcoRV
SacI
SalI
Create a pattern/image in the style of Paul Vanouse’s Latent Figure Protocol artworks.
You might find Ronan’s website a helpful tool for quickly iterating on designs!
Part 2: Gel Art – Restriction Digests and Gel Electrophoresis
Didnt have the lab access to perform the above experiment
Part 3: DNA Design Challenge
3.1. Choose your protein.
In recitation, we discussed that you will pick a protein for your homework that you find interesting. Which protein have you chosen, and why? Using one of the tools described in recitation (NCBI, UniProt, Google), obtain the protein sequence for the protein you chose.
(Example from our group homework, you may notice the particular format — The example below came from UniProt)
For this homework, I chose the ABO glycosyltransferase protein because it directly determines human blood group type by modifying cell-surface glycans. Since my broader project idea focuses on whether blood type A may influence gastrointestinal disease risk, this protein is central to that question. The ABO glycosyltransferase is responsible for adding specific sugar residues that create the A or B antigen. These glycan differences may influence host–microbe interactions, immune responses, or inflammation in the gut. I chose this protein because it represents the molecular basis of blood group identity, making it a logical starting point for exploring any mechanistic relationship between blood type and disease risk.
Here is the human ABO glycosyltransferase sequence (UniProt entry for human ABO):
sp|P16442|BGAT_HUMAN Histo-blood group ABO system transferase OS=Homo sapiens OX=9606 GN=ABO PE=1 SV=2
MAEVLRTLAGKPKCHALRPMILFLIMLVLVLFGYGVLSPRSLMPGSLERGFCMAVREPDH
LQRVSLPRMVYPQPKVLTPCRKDVLVVTPWLAPIVWEGTFNIDILNEQFRLQNTTIGLTV
FAIKKYVAFLKLFLETAEKHFMVGHRVHYYVFTDQPAAVPRVTLGTGRQLSVLEVRAYKR
WQDVSMRRMEMISDFCERRFLSEVDYLVCVDVDMEFRDHVGVEILTPLFGTLHPGFYGSS
REAFTYERRPQSQAYIPKDEGDFYYLGGFFGGSVQEVQRLTRACHQAMMVDQANGIEAVW
HDESHLNKYLLRHKPTKVLSPEYLWDQQLLGWPAVLRKLRFTAVPKNHQAVRNP
3.2. Reverse Translate: Protein (amino acid) sequence to DNA (nucleotide) sequence.
The Central Dogma discussed in class and recitation describes the process in which a DNA sequence becomes transcribed and translated into protein. The Central Dogma gives us the framework to work backwards from a given protein sequence and infer the DNA sequence that the protein is derived from. Using one of the tools discussed in class, NCBI or online tools (Google “reverse translation tools”), determine the nucleotide sequence that corresponds to the protein sequence you chose above.
(Example: Get to the original sequence of phage MS2 L-protein from its genome – phage MS2 genome - Nucleotide - NCBI)
Once a nucleotide sequence of your protein is determined, you need to codon optimise your sequence. You may, once again, utilise Google for a “codon optimisation tool”. In your own words, describe why you need to optimise codon usage. Which organism have you chosen to optimise the codon sequence for, and why?
(Example from Codon Optimization Tool | Twist Bioscience while avoiding Type IIs enzyme recognition sites BsaI, BsmBI, and BbsI)
Lysis protein DNA sequence with codon optimisation
Once the nucleotide sequence of the protein is determined, codon optimisation is necessary because different organisms prefer different codons to encode the same amino acid. Although multiple codons can code for one amino acid, the frequency with which each codon is used varies between species. If a gene contains many codons that are rare in the host organism, translation can be inefficient, leading to low protein yield or incorrect folding. Codon optimisation adjusts the DNA sequence to better match the codon usage bias of the chosen expression host, without changing the amino acid sequence of the protein.
For this project, I chose to optimise the codon sequence for Escherichia coli, since it is one of the most commonly used organisms for recombinant protein expression. E. coli grows quickly, is inexpensive to culture, and has well-established cloning and expression systems. Optimising the ABO glycosyltransferase gene for E. coli would increase the likelihood of efficient transcription and translation, improving protein yield for experimental studies. Additionally, codon optimisation tools can help avoid problematic sequences such as strong secondary structures, rare codons, or unwanted restriction enzyme recognition sites.
After codon optimisation using the VectorBuilder tool, the sequence showed a GC content of 56.53% and a Codon Adaptation Index (CAI) of 0.94. The GC content falls within the preferred range for E. coli expression (typically ~30–70%), suggesting the sequence should be stable and efficiently transcribed. The CAI value is close to 1.0, which indicates that the codons used in the optimised gene closely match the codon usage bias of the host organism. A high CAI generally correlates with improved translation efficiency because the host has abundant tRNAs for these codons.
3.4. You have a sequence! Now what?
What technologies could be used to produce this protein from your DNA? Describe in your words how the DNA sequence can be transcribed and translated into your protein. You may describe either cell-dependent or cell-free methods, or both.
Answer
To produce the protein from the DNA sequence, the optimised gene would first be cloned into an expression vector containing a promoter, ribosome binding site, and terminator. The plasmid would then be introduced into a host such as E. coli through transformation. Inside the cell, RNA polymerase binds to the promoter and transcribes the DNA into messenger RNA (mRNA). The ribosome then binds to the mRNA and reads the codons, while tRNAs deliver the corresponding amino acids to build the polypeptide chain. The growing chain folds into the functional ABO glycosyltransferase protein after translation.
An alternative method is a cell-free expression system, where purified transcription and translation machinery are mixed with the DNA template in vitro. In this system, RNA is synthesised from the DNA and immediately translated into protein without living cells. Cell-free expression is faster and easier to control, while cell-based expression generally produces larger quantities of protein.
In both approaches, the central dogma applies: DNA is transcribed into RNA, and RNA is translated into the protein.
3.5. How does it work in nature/biological systems?
Describe how a single gene codes for multiple proteins at the transcriptional level.
Try aligning the DNA sequence, the transcribed RNA, and also the resulting translated protein!!!
Answer
A single gene can produce multiple proteins at the transcriptional level, mainly through alternative splicing. During transcription, the DNA sequence is copied into a pre-mRNA that contains both exons (coding regions) and introns (non-coding regions). The cell’s splicing machinery can remove introns in different patterns and join different combinations of exons together. As a result, multiple mature mRNA transcripts can be produced from the same gene, and each mRNA can be translated into a slightly different protein with different structure or function. This allows one gene to increase protein diversity without changing the DNA sequence.
Below is a small illustrative alignment showing how DNA becomes RNA and then protein. Notice that T becomes U during transcription, and every 3 nucleotides (codon) form one amino acid during translation:
DNA: ATG AAA GCT TTT GGA TAA
RNA: AUG AAA GCU UUU GGA UAA
Protein: Met Lys Ala Phe Gly Stop
If an exon is skipped during splicing, the RNA sequence changes:
DNA: ATG AAA GGA TAA
RNA: AUG AAA GGA UAA
Protein: Met Lys Gly Stop
Even though the gene is the same, different mRNA transcripts lead to different proteins. This is one of the main ways cells generate protein diversity from a limited number of genes.
Part 4: Prepare a Twist DNA Synthesis Order
4.1. Create a Twist account and a Benchling account
When I first uploaded the DNA sequence, it gave an error due to high GC content. I then used Twist’s built-in codon optimization tool for E. coli to optimize the sequence, and the new sequence is provided below:
After downloading the construct from Twist, I uploaded it to Benchling, and the plasmid map obtained is shown below.
Part 5: DNA Read/Write/Edit
5.1. DNA Read
What DNA would you want to sequence (e.g., read) and why? This could be DNA related to human health (e.g. genes related to disease research), environmental monitoring (e.g., sewage waste water, biodiversity analysis), and beyond (e.g. DNA data storage, biobank).
For my project, I would want to sequence gut microbiome DNA from people with different ABO blood groups, especially comparing blood type A with non-A individuals. My research question is whether the reported association between blood type A and gastrointestinal disease risk has an actual biological mechanism rather than being only a population-level correlation. ABO blood groups are defined by differences in glycan structures, and these glycans are not only present on red blood cells but also on intestinal mucosal surfaces. Many gut microbes interact directly with host glycans by binding to them or metabolizing them as nutrients. Because of this, I suspect that different blood group glycans could shape the microbial community in the gut. Sequencing microbiome DNA would allow me to determine whether certain bacteria, especially glycan-binding or inflammation-associated species, are enriched in individuals with blood type A. In addition, metagenomic sequencing would reveal functional genes such as glycan-degrading enzymes or virulence factors that might trigger inflammatory responses. This information would help identify biological markers that could be used as inputs for a synthetic biology sensing system designed to test the mechanism experimentally.
In lecture, a variety of sequencing technologies were mentioned. What technology or technologies would you use to perform sequencing on your DNA and why?
Also answer the following questions:
(i) Is your method first-, second- or third-generation or other? How so?
(ii) What is your input? How do you prepare your input (e.g. fragmentation, adapter ligation, PCR)? List the essential steps.
(iii) What are the essential steps of your chosen sequencing technology, how does it decode the bases of your DNA sample (base calling)?
(iv) What is the output of your chosen sequencing technology?
For my project, I would use Illumina sequencing (sequencing by synthesis) to sequence gut microbiome DNA from individuals with different ABO blood groups. Since my goal is to compare microbial communities and identify possible functional genes linked to host glycan interactions, I need a method that can accurately sequence many DNA fragments from a mixed sample at high depth. Illumina sequencing is widely used for metagenomics because it provides high accuracy, strong statistical power, and the ability to detect small differences in microbial composition between groups.
Illumina sequencing is a second-generation (next-generation sequencing, NGS) technology. It is considered second-generation because it performs massively parallel sequencing of millions of DNA fragments at the same time and requires clonal amplification before sequencing. The technology uses bridge amplification to generate clusters and reversible terminator nucleotides to read one base at a time. Unlike first-generation Sanger sequencing, which reads single fragments individually, Illumina reads many short fragments simultaneously, making it suitable for complex microbiome samples.
The input for this method would be total DNA extracted from stool samples containing gut microbiome material. First, DNA is isolated from the sample and then fragmented into short pieces of approximately 200–500 base pairs. The fragment ends are repaired and modified by adding an A-tail, followed by ligation of Illumina-specific adapters to both ends. The adapter-ligated fragments are PCR amplified to enrich correctly prepared molecules and create the sequencing library. After quality control and quantification, the library is loaded onto the flow cell for sequencing.
The sequencing process begins with cluster generation on the flow cell. DNA fragments bind to complementary oligonucleotides attached to the surface and undergo bridge amplification, forming clonal clusters of identical DNA molecules. During sequencing by synthesis, fluorescently labeled nucleotides with reversible terminators are added. Only one nucleotide can be incorporated in each cycle. After incorporation, a camera records the fluorescent signal, which corresponds to a specific base (A, T, C, or G). The fluorescent label and terminator are then chemically removed, allowing the next cycle to occur. By repeating this process, the machine determines the sequence base by base through detection of fluorescence signals, a process known as base calling.
The output of Illumina sequencing is a large collection of short DNA sequence reads stored in FASTQ files. Each read contains the nucleotide sequence along with a quality score indicating confidence in each base call. These reads can then be analyzed bioinformatically to identify microbial species, compare microbiome composition between blood groups, and detect functional genes such as glycan-degrading enzymes or inflammation-associated factors. This information helps evaluate whether differences in microbiome behavior could explain the observed association between blood type A and gastrointestinal disease risk.
5.2. DNA Write
(i) What DNA would you want to synthesize (e.g., write) and why? These could be individual genes, clusters of genes or genetic circuits, whole genomes, and beyond. As described in class thus far, applications could range from therapeutics and drug discovery (e.g., mRNA vaccines and therapies) to novel biomaterials (e.g. structural proteins), to sensors (e.g., genetic circuits for sensing and responding to inflammation, environmental stimuli, etc.), to art (DNA origamis). If possible, include the specific genetic sequence(s) of what you would like to synthesize!
For my project, I would synthesize a bacterial genetic sensing circuit that detects blood-group-related glycans and activates a measurable reporter when inflammatory conditions are present. The goal is not to diagnose disease yet, but to experimentally test whether molecules associated with blood type A environments change microbial behavior in a biologically meaningful way.
ABO blood groups differ in terminal sugar structures on host glycans. Blood type A contains N-acetylgalactosamine (GalNAc) as the terminal sugar. Many gut bacteria recognize or metabolize host glycans, so my idea is to engineer a bacterium (for example a lab strain of E. coli) with a circuit that turns on a fluorescent signal only when two conditions occur: detection of A-associated glycans and detection of inflammation-related signals (such as nitrate or reactive oxygen stress). This would function as a controllable research platform to experimentally connect host glycans to microbial inflammatory responses.
The DNA I would synthesize is therefore a two-input AND-gate genetic circuit consisting of: A glycan-responsive promoter (activated by GalNAc metabolism regulator), an inflammation-responsive promoter (stress/nitrate inducible), a transcriptional logic gate (split activator system), and a GFP reporter gene
If fluorescence appears only when both signals are present, it would support the hypothesis that specific host glycan environments influence microbial inflammatory behavior.
Example construct design:
Part 1 – Constitutive regulator expression: Promoter → regulator protein sensing GalNAc
Part 2 – Inflammation promoter controlling activator half: Stress promoter → Activator fragment A
Part 3 – Glycan promoter controlling activator half: GalNAc promoter → Activator fragment B
Part 4 – Output reporter: AND gate → GFP expression
Below is a simplified example of a reporter cassette that could realistically be synthesized (promoter + RBS + GFP + terminator):
(This represents a GFP reporter module; regulatory promoters would be placed upstream depending on the sensing design.)
Synthesizing this circuit allows experimental testing of the hypothesis: Blood-type-specific glycans influence microbial inflammatory behavior.
Instead of relying on epidemiological correlations, the engineered system creates a controllable biological readout. If activation differs in A-glycan conditions compared to others, it would provide mechanistic evidence that host glycan composition can shape disease-related microbial responses.
(ii) What technology or technologies would you use to perform this DNA synthesis, and why?
Also answer the following questions:
What are the essential steps of your chosen sequencing methods?
What are the limitations of your sequencing method (if any) in terms of speed, accuracy, and scalability?
To synthesise my designed genetic circuit, I would use array-based phosphoramidite DNA synthesis followed by fragment assembly (such as Gibson Assembly). Because my construct is a designed sequence rather than naturally occurring DNA, it must be chemically built from short oligonucleotides and then assembled into a complete gene cassette. This approach allows precise control over regulatory elements such as promoters, ribosome binding sites, and reporter genes, which is necessary for constructing a synthetic sensing circuit. The process begins with chemical synthesis of short oligonucleotides (about 60–200 bp) using phosphoramidite chemistry, where nucleotides are added one base at a time to a growing DNA strand attached to a solid surface. After deprotection and cleavage, the oligos are PCR amplified and designed with overlapping regions. These fragments are then assembled into the full construct using Gibson Assembly, in which exonuclease creates complementary overhangs, polymerase fills gaps, and ligase seals the backbone. The assembled plasmid is transformed into bacteria, and colonies are collected for sequence verification.
To read and verify the synthesised DNA, I would use Illumina sequencing (sequencing-by-synthesis). The plasmid DNA would first be extracted and fragmented, adapters would be ligated, and a sequencing library would be prepared. The fragments bind to a flow cell and undergo bridge amplification to form clusters. During sequencing, fluorescent reversible terminator nucleotides are incorporated one at a time, and each cycle is imaged to identify the added base. The fluorescent signal detected at each cycle is converted into nucleotide identity through base calling, generating short sequence reads that can be aligned to the designed construct to confirm its correctness.
The main limitations of Illumina sequencing relate to read length and assembly rather than accuracy. Although it provides very high accuracy and throughput, it produces short reads, so reconstruction of long repetitive regions can be difficult. For my application this is manageable because plasmids are small and have a known reference sequence. In terms of speed, library preparation and sequencing runs take several hours to days, which is slower than simple PCR validation but provides much more reliable confirmation. Scalability is excellent since many constructs can be sequenced simultaneously, but costs increase when sequencing only a very small number of samples.
5.3. DNA Edit
(i) What DNA would you want to edit and why? In class, George shared a variety of ways to edit the genes and genomes of humans and other organisms. Such DNA editing technologies have profound implications for human health, development, and even human longevity and human augmentation. DNA editing is also already commonly leveraged for flora and fauna, for example in nature conservation efforts, (animal/plant restoration, de-extinction), or in agriculture (e.g. plant breeding, nitrogen fixation). What kinds of edits might you want to make to DNA (e.g., human genomes and beyond) and why?
For my project, I would want to edit bacterial DNA rather than human DNA, specifically genes involved in glycan recognition and inflammatory sensing in a model gut bacterium such as E. coli. The goal of my work is to test whether ABO blood-group glycans , especially the type A terminal sugar N-acetylgalactosamine (GalNAc) , can influence microbial behavior linked to gastrointestinal disease. Instead of modifying patients, I would engineer a controllable microbial system that mimics how gut bacteria might respond inside the intestine. The main edits I would introduce are regulatory and sensing modifications. First, I would insert a glycan-responsive sensing module so the bacterium can detect A-type glycans. This could involve adding or modifying carbohydrate-binding proteins or transport/metabolism regulators that activate transcription when GalNAc is present. Second, I would add an inflammation-response module that detects gut stress signals such as nitrate or oxidative stress, which are commonly elevated during intestinal inflammation. Finally, I would connect both inputs to a reporter output (for example fluorescence), forming a logical AND gate so the cell responds only when both host glycan signals and inflammatory conditions occur together. These edits would allow the bacterium to act as a biological probe of the gut environment. If the engineered cells activate differently in A-type glycan conditions compared to others, it would suggest a mechanistic relationship between blood group chemistry and microbial inflammatory behavior. This approach avoids ethical concerns of editing human genomes and instead creates a reversible experimental model that helps transform epidemiological correlations into testable biological mechanisms.
(ii) What technology or technologies would you use to perform these DNA edits and why?
Also answer the following questions:
How does your technology of choice edit DNA? What are the essential steps?
What preparation do you need to do (e.g. design steps) and what is the input (e.g. DNA template, enzymes, plasmids, primers, guides, cells) for the editing?
What are the limitations of your editing methods (if any) in terms of efficiency or precision?
To introduce the edits in my engineered gut bacterium, I would use CRISPR-Cas9 genome editing combined with homologous recombination. This approach is widely used in bacteria because it allows precise insertion of synthetic genetic circuits at defined genomic locations rather than relying only on plasmids. For my project, stable integration is useful so the sensing system behaves consistently across experiments and does not get lost during cell growth.
CRISPR-Cas9 edits DNA by creating a targeted double-strand break at a specific sequence determined by a guide RNA. The cell then attempts to repair this break. If a repair template containing designed DNA is provided, the bacterium uses homologous recombination to copy that template into its genome. In my case, the repair template would contain the glycan-sensing promoter, inflammation-response module, and reporter gene arranged as a logic circuit. The essential steps are: designing a guide RNA targeting a safe insertion site, delivering Cas9 and the guide into the bacteria, introducing a donor DNA template with homologous flanking regions, cleavage of the genome at the target site, and repair using the donor DNA to integrate the synthetic construct.
Preparation involves several design stages. First, I would computationally select a genomic locus that does not disrupt essential genes. Then I would design the single guide RNA (sgRNA) sequence that uniquely matches that region. Next, I would synthesize a donor DNA template containing my circuit flanked by homology arms (~500–1000 bp) matching the insertion site. The experimental inputs therefore include: a plasmid expressing Cas9, a plasmid or cassette encoding the sgRNA, the donor DNA template, competent bacterial cells, and standard transformation reagents. After transformation, edited cells would be selected and verified by sequencing.
The main limitations of this editing method are efficiency and off-target activity. Not all cells successfully incorporate the donor DNA after cutting, so screening is required to isolate correct clones. Homologous recombination efficiency in bacteria can also vary depending on strain and insert size, making larger constructs harder to integrate. Although CRISPR is precise, imperfect guide design can cause unintended cuts at similar sequences, potentially damaging the genome. Finally, multiplex editing (editing many sites at once) becomes less reliable because each additional edit lowers overall success probability. Despite these limitations, CRISPR-Cas9 provides sufficient precision and flexibility for constructing a stable synthetic sensing platform.
Week 3 HW: Lab Automation
One of the great parts about having an automated robot is being able to precisely mix, deposit, and run reactions without much intervention, and design and deploy experiments remotely.
For this week, we’d like for you to do the following:
Find and describe a published paper that utilizes the Opentrons or an automation tool to achieve novel biological applications.
Write a description about what you intend to do with automation tools for your final project. You may include example pseudocode, Python scripts, 3D printed holders, a plan for how to use Ginkgo Nebula, and more. You may reference this week’s recitation slide deck for lab automation details.While your description/project idea doesn’t need to be set in stone, we would like to see core details of what you would automate. This is due at the start of lecture and does not need to be tested on the Opentrons yet.
Example 1: You are creating a custom fabric, and want to deposit art onto specific parts that need to be intertwined in odd ways. You can design a 3D printed holder to attach this fabric to it, and be able to deposit bio art on top. Check out the Opentrons 3D Printing Directory.
Example 2: You are using the cloud laboratory to screen an array of biosensor constructs that you design, synthesize, and express using cell-free protein synthesis.
Echo transfer biosensor constructs and any required cofactors into specified wells.
Bravo stamp in CPFS reagent master mix into all wells of a 96-well / 384-well plate.
Multiflo dispense the CFPS lysate to all wells to start protein expression.
PlateLoc seal the plate.
Inheco incubate the plate at 37°C while the biosensor proteins are synthesized.
XPeel remove the seal.
PHERAstar measure fluorescence to compare biosensor responses.
1. Paper using Opentrons for novel biology
One example is AssemblyTron: flexible automation of DNA assembly with Opentrons OT‑2 lab robots by Eno et al. (Synthetic Biology, 2023). The authors developed AssemblyTron, an open‑source Python package that takes DNA assembly designs (from the j5 design software) and converts them into executable protocols for the Opentrons OT‑2 liquid‑handling robot. The biological focus is on accelerating the Build step of the Design–Build–Test–Learn cycle in synthetic biology by fully automating PCR setup and multi‑part DNA assemblies such as Golden Gate and in vivo assembly (IVA). academic.oup
2. What I intend to automate for my final project
Core biological idea
I want to build a small, automated platform to probe whether ABO blood‑group–like glycan patterns (especially type A–like structures) influence biological responses relevant to gastrointestinal disease risk. The concept is to combine:
Engineered mammalian or microbial cells that express defined ABO‑like glycan patterns (e.g., via glycosyltransferase expression or synthetic glycan coatings).
Simple reporter circuits or biosensors that respond to inflammatory cues (e.g., NF‑κB activation, cytokine mimics) or pathogen‑associated signals.
An automated liquid‑handling workflow that sets up and runs multi‑factor experiments varying glycan background, inflammatory stimulus, and microbial or ligand exposure.
The aim for this course project is not a full mechanistic explanation, but a robot‑friendly experimental scaffold that could, in principle, be scaled to test whether “type A‑like” contexts behave systematically differently from “type O/B‑like” contexts.
2.1. What I will automate
For the scope of the class, I would focus on plate‑based assays with three main automated modules:
Automated plate setup (Opentrons OT‑2)
Distribute different “glycan conditions” across a 96‑well plate:
Rows = glycan backgrounds (e.g., mock, A‑like, B‑like, O‑like mimics or different lectin/glycopolymer coatings).
Dispense appropriate combinations into each well according to a CSV design file (similar spirit to AssemblyTron linking design → pipetting plan).
Automated time‑course perturbations
Use the robot to:
Add secondary stimuli at defined timepoints (e.g., addition of microbial supernatant after pre‑conditioning in inflammatory cues).
Perform serial dilutions of stimuli across the plate to get dose–response curves.
Automated sampling / readout prep
For fluorescent reporters: set up plates with consistent volumes and controls so they can be read on a plate reader.
For secreted markers (e.g., simulated “cytokines” using fluorescent reporters or colorimetric substrates): aliquot supernatant into a separate plate for endpoint assays.
This pipeline mirrors the “DBTL” idea in the AssemblyTron paper: design a matrix of conditions, automatically build the experiment on the robot, then test by measuring reporter outputs.
2.2. Example automation workflow (high‑level steps)
Here is a concrete plan for a 96‑well plate experiment:
Factor B: Inflammatory stimulus (e.g., 6 concentrations of LPS analog or TNFα mimic).
Factor C: Microbial cue (e.g., presence/absence of microbial supernatant or defined ligand).
Encode which wells are controls: no cells, no stimulus, glycan only, stimulus only.
Robot setup
Deck layout:
Slot 1: 96‑well assay plate (flat‑bottom).
Slot 2: Reservoir with media and reporter cell suspension (or CFPS mix if using a cell‑free biosensor).
Slot 3: 96‑well “stimulus source” plate with concentrated stocks of inflammatory agents and microbial components.
Slots 4–5: Tip racks for P20 and P300 single/multi‑channel pipettes.
Optional: Temperature module holding cells at 37 °C or 30 °C depending on chassis.
Automated protocol
Step 1: Seed reporter cells
Robot mixes cell suspension and dispenses a fixed volume (e.g., 50–100 µL) into each experimental well.
Step 2: Apply glycan context
Option A (simple): Pre‑coat wells manually with glycopolymers or lectins; robot only has to track which wells are which.
Option B (more advanced): Robot dispenses defined concentrations of soluble glycoconjugates or lectins to appropriate wells.
Step 3: Add inflammatory stimuli
Robot performs serial dilutions from stimulus stock plate into media to generate a gradient.
Dispenses the correct volume to each well according to the design map.
Step 4: Incubation
Plate incubated off‑deck (incubator).
Step 5: Secondary perturbation (if included)
Plate returned to deck; robot adds microbial supernatant or additional ligands to specified wells.
Step 6: Sampling / preparation for readout
For fluorescence: robot mixes wells, optionally transfers aliquots to a clean plate for reading, and adds stop buffer if needed.
For colorimetric assays: robot dispenses substrate and halts reactions after defined times.
Readout
Plate reader measures fluorescence or absorbance corresponding to biosensor activation (e.g., NF‑κB reporter, general stress reporter).
Data analysis (offline): compare response curves between glycan backgrounds to see whether “A‑like” context shifts sensitivity or maximum response to inflammatory/microbial cues.
2.3. Example pseudocode / Python sketch (Opentrons‑style)
This is illustrative pseudocode in a Python‑like style for an Opentrons OT‑2 protocol:
metadata={"protocolName":"ABO glycan–inflammation screen","author":"Your Name","apiLevel":"2.15"}defrun(protocol):# Load labwareplate=protocol.load_labware("corning_96_wellplate_360ul_flat","1")stimulus_plate=protocol.load_labware("nest_96_wellplate_200ul_flat","3")reservoir=protocol.load_labware("nest_12_reservoir_15ml","2")tiprack_p300=protocol.load_labware("opentrons_96_tiprack_300ul","4")tiprack_p20=protocol.load_labware("opentrons_96_tiprack_20ul","5")# Load instrumentsp300=protocol.load_instrument("p300_multi","left",tip_racks=[tiprack_p300])p20=protocol.load_instrument("p20_multi","right",tip_racks=[tiprack_p20])# Reagents in reservoircells=reservoir.wells()[0]# reporter cell suspensionmedia=reservoir.wells()[academic.oup](https://academic.oup.com/synbio/article/8/1/ysac032/6956284?searchresult=1)# base media# Simple map for glycan contexts and stimulus columnsglycan_rows={"A_mimic":["A","B"],"B_mimic":["C","D"],"O_mimic":["E","F"],"mock":["G","H"]}# Step 1: seed cells in all wellsp300.pick_up_tip()forcolinrange(1,13):# columns 1–12dest=plate.columns()[col-1]p300.transfer(80,cells,dest,new_tip="never",mix_after=(3,80))p300.drop_tip()# Step 2: add stimuli (example: gradient from stimulus_plate row A)stimulus_source_row=stimulus_plate.rows_by_name()["A"]foridx,colinenumerate(plate.columns()):p20.pick_up_tip()# transfer from corresponding source well in stimulus platep20.transfer(20,stimulus_source_row[idx],col,new_tip="never")p20.drop_tip()# (Optional) Step 3: add secondary microbial cue at later time point# protocol.pause("Incubate plate, then return to deck to resume.")# ...additions go here...# End: user moves plate to reader for fluorescence measurement
In a more complete version, the layout and volumes would be read from a CSV (like AssemblyTron reads design files), allowing you to change the entire experimental design without rewriting the protocol.
2.4. Possible 3D‑printed holders / hardware
To better mimic gastrointestinal contexts and make the automation physically robust, I could incorporate simple 3D‑printed pieces:
Custom plate lid / insert that:
Holds gas‑permeable membranes or films coated with different glycan patterns above cell layers.
Keeps multiple inserts aligned so the OT‑2 can still accurately access wells.
Fabricated “gut chip” carriers that fit into a standard plate footprint:
Thin channels or membranes printed into a carrier that snaps into a 96‑well frame, allowing the robot to seed cells on one side and add glycan/microbial stimuli on the other.
These holders would be designed to preserve compatibility with standard SBS plate dimensions, so the robot’s calibration remains valid.
2.5. Possible use of a cloud lab (e.g., Ginkgo Nebula)
If access to a cloud automation platform such as Ginkgo Nebula is available, an extended version of the project could:
Use the local Opentrons workflow to prototype the condition matrix and reporter constructs (small panel).
Upload the best‑performing biosensor designs and condition matrix to the cloud system to:
Scale the screen to many more glycan contexts and pathogen‑related ligands.
Incorporate robotics like:
Acoustic droplet transfer to miniaturize reaction volumes.
Automated incubation and kinetic plate reading.
Use the returned data to refine hypotheses about how “A‑like” glycans modulate inflammatory or infection‑related responses.
For this class assignment, the concrete deliverable is the Opentrons protocol plus experimental design, but the architecture is chosen so it could later be ported to a higher‑throughput cloud system.
2.6. What is “novel” about this automation
It uses automation not just to speed up a routine assay, but to systematically explore a multi‑factor space: glycan background × inflammatory state × microbial cues.
It is explicitly designed to test whether statistical associations between blood type and GI disease risk have plausible biological correlates in controlled, engineered systems.
The workflow is modular: swapping in different glycan mimics or reporter circuits does not require changing the overall automated structure—only the design file and a few reagent definitions.
Week 4 HW: Protein Design Part I
Part A. Conceptual Questions
Why do humans eat beef but do not become a cow, eat fish but do not become fish?
Our digestive system breaks proteins down into amino acids. We don’t just absorb the animal’s proteins directly; we use these building blocks to make human proteins. So no matter what we eat, our body remains human.
Why are there only 20 natural amino acids?
These 20 were selected by evolution because they give enough chemical diversity to build proteins. They are stable, easy to synthesise, and work well with the ribosome and genetic code. More could exist, but these 20 are just what life settled on.
Can you make other non-natural amino acids? Design some new amino acids.
Yes! Scientists can make synthetic amino acids to tweak protein properties. Examples I thought of: Seleno-cysteine variant → replacing sulfur with selenium to improve redox activity or make enzymes more reactive and, Fluoro-leucine → adds a fluorine atom to increase hydrophobic interactions and thermal stability.
Where did amino acids come from before enzymes that make them, and before life started?
Amino acids could form in the prebiotic world through reactions like Strecker synthesis. They might have also come from meteorites or formed from simple gases (CH₄, NH₃, H₂O) with energy sources like lightning or UV light. So amino acids existed before life could make them.
If you make an α-helix using D-amino acids, what handedness (right or left) would you expect?
α-helices made from L-amino acids are right-handed. D-amino acids are mirror images, so the helix would be left-handed.
Can you discover additional helices in proteins?
Yes! We can find new helices in proteins that weren’t noticed before. Experimental methods like X-ray crystallography, NMR, or cryo-EM can reveal hidden or flexible helices. Computational tools like AlphaFold or PSIPRED can predict helical regions just from the protein sequence. Some helices only form under certain conditions, like when a protein binds a ligand or embeds in a membrane. So combining experiments and predictions, we can discover or even design new helices to improve protein stability or function.
Why are most molecular helices right-handed?
Life uses L-amino acids, which naturally favour right-handed helices because of steric constraints and backbone angles. Left-handed helices are less stable with L-amino acids, so they are rare in nature.
Why do β-sheets tend to aggregate? What is the driving force for β-sheet aggregation?
β-sheets expose backbone hydrogen bonds and sometimes hydrophobic side chains. These can interact with other β-sheets, leading to aggregation. This stacking is a major reason some proteins clump together.
The main forces are hydrogen bonding between β-strands, hydrophobic interactions among side chains, and the entropy gain from releasing water molecules when sheets pack together.
Why do many amyloid diseases form β-sheets? Can you use amyloid β-sheets as materials?
Misfolded proteins often expose β-strands that like to stack. These β-sheets form insoluble fibrils, which resist degradation and build up as plaques in diseases like Alzheimer’s.
Yes! Their stability and ability to self-assemble make them useful in materials science. They can form hydrogels, nanofibers, or scaffolds for tissue engineering, which are biodegradable and strong.
Part B: Protein Analysis and Visualization
In this part of the homework, you will be using online resources and 3D visualization software to answer questions about proteins. Pick any protein (from any organism) of your interest that has a 3D structure and answer the following questions:
Briefly describe the protein you selected and why you selected it.
I selected the human ABO glycosyltransferase, the enzyme responsible for determining the ABO blood group system. This enzyme modifies the H antigen on red blood cells by transferring a sugar residue. The A variant transfers N-acetylgalactosamine, while the B variant transfers galactose. Very small amino acid changes in this protein determine whether someone has blood type A, B, AB, or O. I chose this protein because it is clinically important and demonstrates how small sequence changes can drastically alter enzyme specificity.
Identify the amino acid sequence of your protein. How long is it? What is the most frequent amino acid? You can use this Colab notebook to count the frequency of amino acids. How many protein sequence homologs are there for your protein? Hint: Use Uniprot’s BLAST tool to search for homologs. Does your protein belong to any protein family?
UniProt Entry: P16442 (ABO glycosyltransferase, Homo sapiens). The full-length protein contains 354 amino acids.
From sequence analysis, common residues include:Leucine (L), Glycine (G) and Serine (S) Leucine( 41 times) is abundant because it stabilises the hydrophobic core. Glycine appears frequently in flexible loop regions, particularly near the catalytic site.
The results showed many homologous proteins with sequence identities ranging from 54.3% to 100%. The alignment scores ranged from 205 to 1879, and the E-values were extremely low (from 4.4e-14 down to 0), indicating highly significant similarity. These results show that ABO glycosyltransferase is strongly conserved across species and belongs to a well-established glycosyltransferase enzyme family.
Yes. It belongs to the glycosyltransferase family, specifically the GT6 family (according to CAZy classification). These enzymes transfer sugar moieties from activated nucleotide sugars (like UDP-sugars) to acceptor substrates.
Identify the structure page of your protein in RCSB. When was the structure solved? Is it a good quality structure? Good quality structure is the one with good resolution. Smaller the better (Resolution: 2.70 Å).Are there any other molecules in the solved structure apart from protein? Does your protein belong to any structure classification family?
The structure of human ABO glycosyltransferase can be found in the RCSB Protein Data Bank under PDB ID 1LZ7. This structure was solved in 2002 using X-ray crystallography at a resolution of approximately 2.0 Å. Since good-quality structures are typically below 2.7 Å resolution, this is considered a high-quality structure. In addition to the protein, the structure contains a UDP-sugar substrate analog, a metal ion (Mn²⁺), and water molecules. Structurally, the enzyme belongs to the GT-B fold glycosyltransferase family, which consists of two Rossmann-like domains forming a catalytic cleft.
Open the structure of your protein in any 3D molecule visualization software: Visualize the protein as “cartoon”, “ribbon” and “ball and stick”. Color the protein by secondary structure. Does it have more helices or sheets? Color the protein by residue type. What can you tell about the distribution of hydrophobic vs hydrophilic residues? Visualize the surface of the protein. Does it have any “holes” (aka binding pockets)?
PDB ID: 1LZ7 (human ABO A-transferase) - Cartoon
Ribbon
It has more helices coloured in red.
Ball and stick (for protein + ligand)
Color by Secondary Structure
Red = α-helices, Yellow = β-sheets and Green = loops
Color by Residue Type (Hydrophobic vs Hydrophilic)
Hydrophobic residues:
orange, resn ALA+VAL+LEU+ILE+MET+PHE+TRP+PRO
Polar/charged residues:
cyan, resn SER+THR+ASN+GLN+TYR+CYS
blue, resn LYS+ARG+HIS
red, resn ASP+GLU
It has almost the same amount of residues but polar/charged residues are little higher than hydrophobic residues.
I observed one binding pocket, that’s it.
Part C. Using ML-Based Protein Design Tools
In this section, we will learn about the capabilities of modern protein AI models and test some of them in your chosen protein.
[x] Copy the HTGAA_ProteinDesign2026.ipynb notebook and set up a colab instance with GPU.
[x] Choose your favorite protein from the PDB.
We will now try multiple things in the three sections below; report each of these results in your homework writeup on your HTGAA website:
C1. Protein Language Modeling
Deep Mutational Scans
Use ESM2 to generate an unsupervised deep mutational scan of your protein based on language model likelihoods.
Can you explain any particular pattern? (choose a residue and a mutation that stands out)
(Bonus) Find sequences for which we have experimental scans, and compare the prediction of the language model to experiment.
I used the ESM2 protein language model to generate an unsupervised deep mutational scan of the human ABO glycosyltransferase sequence. The heatmap shows the predicted effect of every possible amino acid substitution across the protein sequence. Positions with yellow or light green colors correspond to mutations that are more tolerated, while dark blue or purple indicates mutations that are predicted to be unfavorable.
Several vertical bands of darker colors appear across the heatmap, indicating positions where most mutations are not tolerated. These likely correspond to structurally important or functionally critical residues in the protein. In contrast, many other regions show more neutral scores, suggesting they are more tolerant to mutation and may be located in flexible or surface regions.
For example, at position 35, mutating the residue to histidine produces a negative score (approximately −1.95), suggesting this substitution is unfavorable. This could be because histidine introduces a charged side chain that disrupts local packing or interactions.
As a bonus analysis, I attempted to find experimental deep mutational scan datasets for the human ABO glycosyltransferase. However, comprehensive experimental scans for this protein were not readily available in public databases. Therefore, a direct comparison between the ESM2 predictions and experimental mutation effects could not be performed. Nevertheless, previous studies on other proteins have shown that protein language models like ESM2 often correlate well with experimental mutational scans, particularly for identifying conserved and functionally important residues.
Latent Space Analysis
Use the provided sequence dataset to embed proteins in reduced dimensionality.
Analyze the different formed neighborhoods: do they approximate similar proteins?
Place your protein in the resulting map and explain its position and similarity to its neighbors.
Using the provided dataset, protein sequences were embedded into a reduced dimensional latent space using a protein language model and visualized using t-SNE. In this representation, each point corresponds to a protein sequence, and proteins with similar sequence features appear close together.
The resulting map shows a dense cluster of proteins with a gradual spread across the three t-SNE dimensions. This suggests that many of the proteins in the dataset are related and share common structural or functional features.
My selected protein, the human ABO glycosyltransferase, appears within this cluster and is positioned near other proteins with similar sequence characteristics. These neighboring proteins likely belong to related glycosyltransferase families and share similar catalytic functions involving sugar transfer reactions.
C2. Protein Folding
Folding a protein
Fold your protein with ESMFold. Do the predicted coordinates match your original structure?
Try changing the sequence, first try some mutations, then large segments. Is your protein structure resilient to mutations?
The protein sequence was folded using ESMFold to predict its 3D structure. The predicted coordinates were compared to the original experimental structure using structural alignment in PyMol. The two structures showed strong agreement with a low RMSD value, indicating that ESMFold accurately reproduced the overall protein fold.
To test structural robustness, several mutations were introduced into the sequence. Single amino acid substitutions caused only minor local structural changes, while the overall fold of the protein remained largely unchanged. This suggests that the protein structure is relatively resilient to small mutations.
When larger sequence modifications were introduced, such as altering or replacing longer segments of the sequence, the predicted structure became more distorted. In these cases, secondary structure elements were disrupted and the overall fold changed significantly.
C3. Protein Generation
Inverse-Folding a protein: Let’s now use the backbone of your chosen PDB to propose sequence candidates via ProteinMPNN
Analyze the predicted sequence probabilities and compare the predicted sequence vs the original one.
Input this sequence into ESMFold and compare the predicted structure to your original.
The backbone structure of the selected protein was used as input for ProteinMPNN to generate candidate sequences that could fold into the same structure. ProteinMPNN predicted several sequences along with probability distributions for each residue position.
Comparison of the predicted sequences with the original sequence showed moderate sequence identity, with many conserved residues in structurally important regions. Positions located in the protein core or active site showed strong preferences for specific amino acids, while surface residues displayed greater variability and allowed multiple amino acid substitutions.
The top predicted sequence was then folded using ESMFold. The resulting structure closely matched the original protein structure, maintaining the same overall fold and secondary structure elements. This demonstrates that multiple sequences can encode the same protein structure and highlights the robustness of protein folds.
Part D. Group Brainstorm on Bacteriophage Engineering
Choose one or two main goals from the list that you think you can address computationally (e.g., “We’ll try to stabilize the lysis protein,” or “We’ll attempt to disrupt its interaction with E. coli DnaJ.”). Write a 1-page proposal (bullet points or short paragraphs) describing: Which tools/approaches from recitation you propose using (e.g., “Use Protein Language Models to do in silico mutagenesis, then AlphaFold-Multimer to check complexes.”). Why do you think those tools might help solve your chosen sub-problem? Name one or two potential pitfalls (e.g., “We lack enough training data on phage–bacteria interactions.”). Include a schematic of your pipeline.This resource may be useful: HTGAA Protein Engineering Tools . Include your group’s short plan for engineering a bacteriophage.
Project Proposal: Precision Engineering of the MS2 L Protein
Selected Goals:
Increased Stability (Targeting the transmembrane domain)
Higher Toxicity (Targeting the DnaJ regulatory interaction)
1. Computational Tools & Approaches
Protein Language Models (ESM-2): I will use ESM-2 to perform in silico deep mutational scanning of the 75-amino acid L protein. By calculating the pseudo-perplexity or log-likelihood of variants, I can identify mutations in the C-terminal hydrophobic region likely to increase structural stability without disrupting the membrane-anchored fold.
AlphaFold-Multimer: I will model the interaction between the MS2 L protein and the host chaperone DnaJ. Specifically, I will look at the interface involving the DnaJ C-terminal domain (near residue P330). I will then design mutations in the basic N-terminal half of the L protein to computationally “break” this interaction.
Structure-Based Truncation Design: Based on the knowledge that N-terminal truncations (like the $L^{\triangle dj}$ alleles) can accelerate lysis by up to 20 minutes, I will use structural modeling to define the minimal functional lytic peptide that retains the conserved LS dipeptide motif.
2. Rationale: Why These Tools?
Stability: Small membrane proteins are notoriously difficult to stabilize experimentally. Using ESM-2 allows for a high-throughput search of the sequence space to find “evolutionarily plausible” mutations that reinforce the protein’s thermal and chemical stability.
Toxicity: The MS2 L protein is naturally “retarded” by its binding to DnaJ. By using AlphaFold-Multimer to identify and then mutate the specific residues that facilitate this binding, I can create a “hyper-toxic” variant that escapes host regulation, leading to faster and more aggressive lysis.
3. Potential Pitfalls
Unknown Lytic Mechanism: Unlike other amurins that inhibit peptidoglycan synthesis, the exact cellular target of MS2 L is still unknown. Engineering for toxicity is risky when the “kill target” is not yet identified in the literature.
Modeling Membrane Proteins: AlphaFold-Multimer and ESM-2 can sometimes struggle with the highly flexible, basic N-terminal tails of small proteins, which may lead to inaccurate interface predictions for the DnaJ complex.
4. Pipeline Schematic
Sequence Input: Wild-type MS2 L (75 aa).
Variant Generation: ESM-2 scoring to identify stabilizing mutations in the C-terminus.
Interaction Modeling: AlphaFold-Multimer to map the L-DnaJ interface.
Interface Disruption: Targeted mutagenesis of the L protein N-terminus to prevent DnaJ binding.
Final Selection: Identification of 2–3 “L-hyper” candidates for synthesis, characterized by increased stability scores and predicted loss of DnaJ affinity.
Week 5 HW: Protein Design Part II
Part A: SOD1 Binder Peptide Design (From Pranam)
Superoxide dismutase 1 (SOD1) is a cytosolic antioxidant enzyme that converts superoxide radicals into hydrogen peroxide and oxygen. In its native state, it forms a stable homodimer and binds copper and zinc.
Mutations in SOD1 cause familial Amyotrophic Lateral Sclerosis (ALS). Among them, the A4V mutation (Alanine → Valine at residue 4) leads to one of the most aggressive forms of the disease. The mutation subtly destabilizes the N-terminus, perturbs folding energetics, and promotes toxic aggregation.
Your challenge:
Design short peptides that bind mutant SOD1.
Then decide which ones are worth advancing toward therapy.
You will use three models developed in our lab:
PepMLM: target sequence-conditioned peptide generation via masked language modeling
PepMLM assigned lower perplexity to several generated peptides than the known SOD1 binder FLYRWLPSRRGG, suggesting the model predicts these sequences may bind SOD1 with higher confidence.
Part 2: Evaluate Binders with AlphaFold3
Navigate to the AlphaFold Server: alphafoldserver.com
For each peptide, submit the mutant SOD1 sequence followed by the peptide sequence as separate chains to model the protein-peptide complex.
Record the ipTM score and briefly describe where the peptide appears to bind. Does it localize near the N-terminus where A4V sits? Does it engage the β-barrel region or approach the dimer interface? Does it appear surface-bound or partially buried?
In a short paragraph, describe the ipTM values you observe and whether any PepMLM-generated peptide matches or exceeds the known binder.
Peptide
ipTM
Interpretation
SHWDEYAGRVEWRA
0.38
weak interaction
WRWGVVAAVKEWRA
0.25
very weak
WWVDPVAAAVKWRRK
0.39
weak
ARWGPLAGVYKLAR
0.42
strongest among generated peptides
FLYRWLPSRRGG
0.31
weak
AlphaFold3 predictions showed relatively low interface confidence scores for all tested peptides, with ipTM values ranging from 0.25 to 0.42. The peptide ARWGPLAGVYKLAR produced the highest ipTM score (0.42), suggesting a slightly stronger predicted interaction with mutant SOD1 compared to the other generated peptides. The known SOD1-binding peptide FLYRWLPSRRGG showed an ipTM score of 0.31, which is comparable to several PepMLM-generated peptides. Overall, the predictions suggest weak but possible surface interactions between the peptides and the protein. This indicates that some generated peptides may have comparable binding potential to the known binder, although the interaction confidence remains moderate.
Visualization of the AlphaFold3 predictions showed that several peptides did not appear to form stable contacts with the SOD1 surface. In many models, the peptide was positioned away from the protein, suggesting weak or uncertain binding. This observation is consistent with the low ipTM scores obtained for the predicted complexes. Small peptides are hard for AlphaFold to dock correctly, especially without experimental constraints. Therefore low ipTM values and weak interactions are expected.
The AlphaFold3 predictions produced relatively low ipTM scores for all peptide–SOD1 complexes, ranging from 0.25 to 0.42. Among the PepMLM-generated peptides, ARWGPLAGVYKLAR showed the highest ipTM value (0.42), suggesting a slightly stronger predicted interaction compared to the others. The known SOD1-binding peptide FLYRWLPSRRGG produced an ipTM score of 0.31. Interestingly, several PepMLM-generated peptides showed ipTM scores comparable to or higher than the known binder, indicating that the model may have generated sequences with similar or potentially improved binding potential to mutant SOD1.
Part 3: Evaluate Properties of Generated Peptides in the PeptiVerse
Structural confidence alone is insufficient for therapeutic development. Using PeptiVerse, let’s evaluate the therapeutic properties of your peptide! For each PepMLM-generated peptide:
Paste the peptide sequence.
Paste the A4V mutant SOD1 sequence in the target field.
Check the boxes
[x] Predicted binding affinity
[x] Solubility
[x] Hemolysis probability
[x] Net charge (pH 7)
[x] Molecular weight
Compare these predictions to what you observed structurally with AlphaFold3. In a short paragraph, describe what you see. Do peptides with higher ipTM also show stronger predicted affinity? Are any strong binders predicted to be hemolytic or poorly soluble? Which peptide best balances predicted binding and therapeutic properties?
Choose one peptide you would advance and justify your decision briefly.
Outputs from Peptiverse:
Peptide
Binding Affinity (pKd/pKi)
Solubility
Hemolysis Probability
Net Charge (pH 7)
Molecular Weight (Da)
SHWDEYAGRVEWRA
5.86 (Weak)
Soluble
0.035
-1.45
1761.8
WRWGVVAAVKEWRA
6.92 (Weak)
Soluble
0.167
+1.76
1714.0
WWVDPVAAAVKWRRK
6.38 (Weak)
Soluble
0.055
+2.76
1868.2
ARWGPLAGVYKLAR
5.81 (Weak)
Soluble
0.041
+2.79
1557.8
FLYRWLPSRRGG
5.97 (Weak)
Soluble
0.047
+2.76
1507.7
Compared them with my AlphaFold ipTM results:
Peptide
ipTM
Binding affinity (pKd/pKi)
Solubility
Hemolysis prob.
Net charge
SHWDEYAGRVEWRA
0.38
5.86
Soluble
0.035
-1.45
WRWGVVAAVKEWRA
0.25
6.92 (highest)
Soluble
0.167
+1.76
WWVDPVAAAVKWRRK
0.39
6.38
Soluble
0.055
+2.76
ARWGPLAGVYKLAR
0.42 (highest)
5.81
Soluble
0.041
+2.79
FLYRWLPSRRGG
0.31
5.97
Soluble
0.047
+2.76
Important observations:
All peptides are predicted soluble → good for therapeutics.
All are non-hemolytic (very low probability).
Predicted binding affinities are weak but similar.
The peptide with highest structural confidence (ARWGPLAGVYKLAR) does not have the strongest predicted affinity.
WRWGVVAAVKEWRA has the strongest predicted affinity but very low ipTM, meaning structure prediction did not support strong binding.
Peptide to advance
Selected peptide: ARWGPLAGVYKLAR
ARWGPLAGVYKLAR was selected as the most promising candidate because it showed the highest ipTM score in the AlphaFold3 structural predictions, suggesting relatively stronger interaction with mutant SOD1. Additionally, PeptiVerse predicted good solubility, low hemolysis probability, and a reasonable net positive charge, which are favorable properties for therapeutic peptides. Therefore, this peptide provides the best balance between predicted binding potential and therapeutic safety.
Part 4: Generate Optimized Peptides with moPPIt
Now, move from sampling to controlled design. moPPIt uses Multi-Objective Guided Discrete Flow Matching (MOG-DFM) to steer peptide generation toward specific residues and optimize binding and therapeutic properties simultaneously. Unlike PepMLM, which samples plausible binders conditioned on just the target sequence, moPPIt lets you choose where you want to bind and optimize multiple objectives at once.
Open the moPPit Colab linked from the HuggingFace moPPIt model card
Make a copy and switch to a GPU runtime.
In the notebook:
Paste your A4V mutant SOD1 sequence.
Choose specific residue indices on SOD1 that you want your peptide to bind (for example, residues near position 4, the dimer interface, or another surface patch).
Set peptide length to 12 amino acids.
Enable motif and affinity guidance (and solubility/hemolysis guidance if available). Generate peptides.
After generation, briefly describe how these moPPit peptides differ from your PepMLM peptides. How would you evaluate these peptides before advancing them to clinical studies?
moPPIt Generated Peptides:
Index
Peptide
Hemolysis
Solubility
Predicted Affinity
Motif Score
0
KECYDKTNDFNW
0.887
0.83
6.11
0.56
1
GQLKCYNKGTCR
0.944
0.92
6.28
0.83
2
SDKFRTCVQKRV
0.936
0.75
7.61
0.90
All peptides show good solubility scores (0.75–0.92).
Predicted binding affinity values are comparable or slightly stronger than PepMLM peptides.
SDKFRTCVQKRV has the highest predicted affinity and motif score, suggesting stronger targeted interaction with the binding site on Superoxide dismutase 1.
Peptides generated using moPPIt differ from those produced by PepMLM because the generation process is guided by specific design objectives. While PepMLM samples peptide sequences conditioned only on the target protein sequence, moPPIt allows the design process to be directed toward specific residues on the target protein and simultaneously optimizes multiple properties such as binding affinity, motif targeting, solubility, and hemolysis risk. As a result, the moPPIt-generated peptides display stronger motif scores and slightly improved predicted affinities compared to the earlier sampled peptides, suggesting more targeted binding to mutant Superoxide dismutase 1.
Before advancing these peptides toward clinical development, further computational and experimental validation would be required. Computationally, structural modeling using AlphaFold or molecular docking could be performed to confirm peptide binding to mutant SOD1. Molecular dynamics simulations could assess the stability of the peptide–protein complex. Experimentally, peptide binding could be validated using biochemical techniques such as surface plasmon resonance or isothermal titration calorimetry. Additionally, cellular assays would be required to evaluate toxicity, stability, and the ability of the peptides to inhibit SOD1 aggregation before progressing to in vivo studies.
Note: Lysis protein contains a soluble N-terminal domain followed by a transmembrane protein (blue/last 35 residues). Transmembrane protein affects the lysis activity. The soluble domain (green) is the domain responsible for interaction with DnaJ.
Good mutant = Lysis=1 mutations only, ≥2 changes, soluble+TM balance.
Week 6 HW: Genetic Circuits Part I: Assembly Technologies
DNA Assembly
1. What are some components in the Phusion High-Fidelity PCR Master Mix and what is their purpose?
Phusion High-Fidelity (HF) PCR Master Mix is a ready-to-use 2× mix designed for accurate and efficient DNA amplification. Typical components include:
Phusion DNA polymerase: A thermostable, proofreading enzyme with 3′→5′ exonuclease activity for extremely high fidelity.
dNTPs (deoxynucleotide triphosphates): Building blocks for new DNA synthesis.
Optimized reaction buffer: Provides Mg²⁺ and pH stabilization for optimal enzyme activity.
Stabilizers and enhancers: Improve yield, especially for GC-rich or complex templates.
2. What are some factors that determine primer annealing temperature during PCR?
Primer annealing temperature ((T_a)) depends on several molecular properties:
Primer length: Longer primers have higher melting temperatures ((T_m)).
GC content: G–C pairs contribute more hydrogen bonds (3 vs. 2 for A–T), increasing (T_m).
Salt concentration: Stabilizes DNA duplexes, raising (T_m).
Mismatches: Intentional (e.g., for mutagenesis) or unintentional mismatches lower (T_m).
Primer concentration and secondary structure: Hairpins or dimers reduce effective binding.
Rule of thumb: (T_a = T_m – 2\text{–}5°C), and the two primers’ (T_m) should be within 5°C of each other.
3. There are two methods from this class that create linear fragments of DNA: PCR, and restriction enzyme digests. Compare and contrast these two methods, both in terms of protocol as well as when one may be preferable to use over the other.
Customizable (blunt/sticky via polymerase or overhangs)
Defined sticky/blunt ends based on enzyme
Customization
Can introduce mutations/overlaps via primers
Limited to existing restriction sites
Yield
Exponential amplification
Linear cutting (yield depends on starting material)
Purity
Requires cleanup (DpnI, purification)
Requires cleanup (phenol/chloroform, columns)
When to use PCR: No restriction sites available, need mutations (amilCP color variants), or custom overlaps for Gibson. When to use restriction digest: Routine subcloning with existing sites, rapid verification.
4. How can you ensure that the DNA sequences that you have digested and PCR-ed will be appropriate for Gibson cloning?
To make our digested or PCR-generated DNA compatible with Gibson Assembly:
Design primers so that each fragment has 20–40 bp of overlapping sequence identity.
Check orientation and reading frame in software (like Benchling) to ensure correct assembly.
Purify fragments to remove enzymes, primers, and salts that inhibit the Gibson reaction.
DpnI-treat PCR products to eliminate methylated template plasmid DNA.
Verify concentration and quality (≥30 ng/µL) via spectrophotometry (Nanodrop/Qubit) before assembly.
Use 2:1 insert:vector molar ratio (calculate via NEB calculator).
5. How does the plasmid DNA enter the E. coli cells during transformation?
During transformation, chemically competent E. coli cells are made permeable:
Heat shock (ice → 42°C for 45s → ice) temporarily opens pores in the cell membrane.
Plasmid DNA diffuses through these transient pores into the cytoplasm.
Cells recover in SOC medium (nutrient-rich) at 37°C for 60 minutes, repairing membranes.
Antibiotic selection ensures only transformed cells (with plasmid resistance gene) survive on chloramphenicol plates.
6. Describe another assembly method in detail (such as Golden Gate Assembly)
Golden Gate Assembly (GGA) is a one-pot, scarless, multi-fragment cloning method using Type IIS restriction enzymes.
Modular parts: Promoter, RBS, CDS, terminator with unique junction sequences.
Mechanism (5-step cycle):
1. Digestion (37°C): Type IIS enzymes cut → create overhangs
2. Ligation (16°C): Compatible overhangs join
3. Repeat cycles → exponential assembly
4. Final products lack Type IIS sites
Advantages over Gibson:
Multi-fragment (up to 10+ parts simultaneously)
No PCR needed for internal fragments
Hierarchical (assemble subparts → final construct)
Standardized (MoClo system)
Example: Promoter-RBS-amilCP-Terminator → single reaction yields complete expression cassette.
7. Explain the other method in 5-7 sentences plus diagrams (either handmade or online).
NEBuilder HiFi DNA Assembly (alternative to Gibson) uses a similar chew-back → anneal → fill-in → ligate mechanism but with a proprietary 5′ exonuclease-free HiFi polymerase for higher accuracy.
Exonuclease chews back 5′ ends of overlapping fragments (~15-20 bp).
Complementary single-stranded overhangs anneal via designed overlaps.
HiFi polymerase fills in gaps without strand displacement.
Ligase seals nicks, forming circular plasmids.
Single 50°C, 15-min reaction (faster than Gibson’s 60 min).
Works with 2-6 fragments, ideal for 1-2 inserts like this lab.
8. Model this assembly method with Benchling or Asimov Kernel!
Week 7 HW: Genetic Circuits Part II: Neuromorphic Circuits
Assignment Part 1: Intracellular Artificial Neural Networks (IANNs)
Question 1: What advantages do IANNs have over traditional genetic circuits, whose input/output behaviors are Boolean functions? Answer: IANNs have several advantages over traditional genetic circuits because they can process information in a more flexible, analog way rather than being limited to Boolean ON/OFF behavior. Traditional genetic circuits usually implement simple logic functions such as AND, OR, and NOT, while IANNs can combine multiple inputs with weights and generate graded outputs. This allows IANNs to recognize more complex patterns, make better decisions from noisy biological data, and approximate behaviors that are closer to classification than simple switching.
Question 2: Describe a useful application for an IANN; include a detailed description of input/output behavior, as well as any limitations an IANN might face to achieve your goal. Answer: One useful application for an IANN is a cell-based disease classifier. In this system, the inputs could be different intracellular biomarkers such as RNAs, proteins, or small molecules associated with healthy or diseased states. The network would integrate these signals and produce a strong output only when the combined input pattern matches the target disease state. For example, low levels of one biomarker and high levels of another could trigger fluorescence, while healthy-like patterns would result in little or no output. A limitation of this approach is that biological systems are noisy and variable from cell to cell, so the network may not behave identically in every cell. In addition, circuit burden, slow dynamics, and difficulty in tuning the weights can make the system less precise and less stable.
Question 3: Draw a diagram for an intracellular multilayer perceptron where layer 1 outputs an endoribonuclease that regulates a fluorescent protein output in layer 2. Answer:
Assignment Part 2: Fungal Materials
Question 1: What are some examples of existing fungal materials and what are they used for? What are their advantages and disadvantages over traditional counterparts? Answer: Existing fungal materials include mycelium-based packaging, insulation, fire-protection materials, textile-like materials, leather-like materials, paper-like materials, absorbent materials, wound dressings, filters, and construction materials such as fiberboard. They are used because they can be grown from agricultural waste, are biodegradable, lightweight, and can offer good thermal insulation and fire resistance. Compared with traditional materials, their main advantages are sustainability, low weight, compostability, and potential lower carbon impact. Their disadvantages are that they can be harder to standardize, may have lower durability or mechanical performance than some conventional materials, and can still be more expensive or less scalable in some applications. pmc.ncbi.nlm.nih
Question 2: What might you want to genetically engineer fungi to do and why? What are the advantages of doing synthetic biology in fungi as opposed to bacteria? Answer: You might want to genetically engineer fungi to produce better food proteins, stronger or more flexible materials, industrial enzymes, pharmaceuticals, or specialized biomaterials with properties that are difficult to achieve naturally. Fungi are attractive for synthetic biology because they naturally secrete large amounts of proteins, can grow on low-cost biomass, and are already widely used in industrial fermentation. Compared with bacteria, fungi often have advantages for making eukaryotic proteins, complex enzymes, and extracellular materials, since their cellular machinery is more similar to other eukaryotes and they can perform some post-translational modifications that bacteria cannot. A drawback is that fungi are often slower-growing and can be harder to engineer and control than bacteria, so development can take more time. pmc.ncbi.nlm.nih
HTGAA 2026: Individual Final Project Documentation
S. epidermidis Stress-Sensing Skin Patch
Version 1 — Core Design and Circuit Validation
SECTION 1: ABSTRACT
Chronic psychological stress is a major contributor to cardiovascular disease, metabolic dysfunction, and immune dysregulation, yet the tools available for monitoring physiological stress in real time remain either invasive, clinically constrained, or unable to provide continuous data outside a hospital setting. This project addresses that gap by designing a synthetic biology-based wearable biosensor patch capable of non-invasively detecting stress-associated biomarkers in sweat. The broader objective is to engineer a living sensor using Staphylococcus epidermidis as the intended skin-compatible chassis that integrates two independent physiological signals and converts them into a single measurable output, demonstrating the core logic of a future wearable diagnostic.
The central hypothesis is that a two-input AND-gate genetic circuit can be computationally designed and in silico validated in Escherichia coli as a proof-of-concept chassis, in which sfGFP fluorescence is only produced when both IPTG (a proxy for a stress-related chemical input) and low pH (sensed via the native CadC membrane sensor) are simultaneously present. To test this computationally, a 960 bp synthetic gene fragment encoding a hybrid cadO–lacO1–Ptrc promoter driving superfolder GFP was fully designed in Benchling, verified using NCBI BLAST, modelled using Boolean circuit logic and Hill function kinetics, and submitted to Twist Biosciences for gene synthesis.
Aim 1 involves the complete computational design of the AND-gate circuit: sequence construction and annotation in Benchling, BLAST homology verification, promoter logic modelling using genetic circuit design principles, and a Twist Biosciences gene synthesis order. Aim 2 extends the validated circuit design into a conceptual wearable patch architecture, defining each material layer from skin contact to signal output. Aim 3 proposes the long-term development of the platform into a continuous, multi-biomarker stress monitoring system using S. epidermidis as the final chassis. This project produces a synthesis-ready DNA design, a simulated fluorescence output dataset, and a device-level patch schematic as its primary deliverables.
SECTION 2: PROJECT AIMS
Aim 1 — Experimental Aim (this project):
The first aim of my final project is to design a complete, synthesis-ready two-input AND-gate genetic circuit that produces sfGFP fluorescence only when both a chemical stress proxy (IPTG, relieving LacI repression) and low pH (activating chromosomal CadC) are simultaneously present, by utilising Benchling for annotated sequence design, NCBI BLAST and GenBank for homology verification and part sourcing, the iGEM Parts Registry for characterised biological parts, genetic circuit design principles for AND-gate logic architecture, Hill function kinetics modelling for in silico validation, Opentrons OT-2 automation scripting for induction experiment design, and Twist Biosciences for gene fragment synthesis ordering.
The circuit is encoded in a 960 bp gene fragment containing a hybrid promoter with a cadO operator (CadC binding site, active below pH 5.8) and a lacO1 operator (repressed by chromosomal LacI, de-repressed by IPTG addition) upstream of a superfolder GFP coding sequence and B0015 double terminator. The insert is flanked by EcoRI and XbaI restriction sites for directional ligation into pUC19. Computational validation involves constructing the AND-gate Boolean truth table, simulating promoter kinetics using a Hill function model, generating projected fluorescence output curves for all four induction conditions, and designing the Opentrons protocol for the physical induction experiment. The Twist order has been designed and is ready for submission, representing a complete dry-lab-to-synthesis pipeline.
Aim 2 — Development Aim:
Following computational validation of the AND-gate circuit design, the next step is to replace the IPTG-inducible proxy input with a biologically relevant cortisol-sensing module using protein structure prediction tools to model a modified cortisol-binding transcription factor that could function in E. coli and to integrate the validated circuit concept into a wearable patch architecture consisting of a sweat-permeable hydrogel membrane, an alginate-encapsulated bacterial layer, and a colorimetric or electrochemical readout interface. This aim would involve protein design and structure validation, optimisation of the hydrogel encapsulation matrix for bacterial viability during wear, and submission of the physical construct through an automated cloud lab for remote expression testing without requiring in-person lab access.
Aim 3 — Visionary Aim:
The long-term vision for this project is to develop a fully autonomous, continuous, non-invasive stress monitoring platform using Staphylococcus epidermidis as a skin-native synthetic biology chassis, capable of detecting a panel of sweat biomarkers — including cortisol, pH, glucose, uric acid, and interleukin-6 — and transmitting real-time physiological data to a connected device for longitudinal health monitoring. If realised, this platform would represent a paradigm shift in how stress and metabolic health are measured: moving from episodic, clinic-based blood draws to continuous, at-home biological sensing with no needles, no wearable electronics in direct contact with skin, and no requirement for trained clinical staff. The broader impact extends to early detection of inflammatory conditions, metabolic disorders, and infection, with particular relevance to populations in low-resource settings where access to clinical diagnostics is limited.
SECTION 3: BACKGROUND
Background and Literature Context
The physiological stress response is mediated in part by the hypothalamic-pituitary-adrenal (HPA) axis, which drives the release of cortisol from the adrenal cortex in response to perceived threat. Cortisol reaches detectable concentrations in sweat, saliva, urine, and blood, making it an accessible biomarker for wearable biosensing applications. Torrente-Rodríguez et al. (2020) demonstrated a graphene-based wearable electrochemical sensor capable of measuring cortisol in sweat in real time, achieving a detection range of 10 nM to 1 µM directly relevant to physiological stress concentrations. Their work established that sweat cortisol correlates meaningfully with serum cortisol and validated the concept of continuous non-invasive hormonal monitoring, but relied on expensive electrode fabrication and did not integrate biological sensing logic capable of multi-input integration. A complementary study by Weiss and colleagues characterised the use of synthetic genetic circuits in E. coli as two-input logic gates, demonstrating that promoter architectures combining two independent operator sequences can produce Boolean AND-gate behaviour with low leakage and high fold-induction — exactly the architecture used in this project’s hybrid cadO–lacO1 promoter design.
This project is novel in three important respects. First, it proposes using Staphylococcus epidermidis a commensal skin bacterium as the intended synthetic biology chassis for a wearable device, moving away from the standard laboratory E. coli host toward a microorganism that is already ecologically compatible with human skin. Second, it integrates two independent sweat biomarkers into a single AND-gate output rather than detecting each independently, reducing false-positive readings caused by individual biomarker fluctuation unrelated to stress. Third, the entire design and validation pipeline is executed computationally using Benchling for sequence design, Boolean logic and Hill function modelling for circuit validation, and Opentrons scripting for experimental design — demonstrating that a complete synthetic biology project can be designed, validated, and submitted for synthesis without requiring physical lab access.
This project matters for several intersecting reasons. Psychological stress is estimated to contribute to more than 75% of all physician visits, yet there is no affordable, continuous, non-invasive method for individuals to monitor their own stress physiology outside a clinical setting. Existing wearable stress proxies — heart rate variability, galvanic skin response — are indirect and confounded by physical activity, making a biochemical sensor that reads cortisol and pH simultaneously far more specific. From a synthetic biology perspective, the project advances the use of living cells as programmable sensing elements embedded in consumer devices, a frontier with significant implications for personalised medicine and occupational health monitoring. The dry-lab approach taken here also demonstrates that remote participants can produce rigorous, synthesis-ready synthetic biology designs without physical lab access, lowering barriers to participation in the field. If the aims of this project are fully realised, the concept of genetically encoded, multi-input sweat biosensors could catalyse a broader field of skin-resident synthetic biology in which engineered microorganisms serve as persistent, low-power, biologically self-renewing diagnostic platforms.
Ethical Implications
This project raises several ethical considerations that must be taken seriously. The use of genetically engineered bacteria intended for eventual application to human skin introduces questions of non-maleficence the obligation to avoid causing harm and informed consent. Even a commensal organism such as S. epidermidis, once modified with synthetic gene circuits, constitutes a novel biological entity whose ecological behaviour cannot be fully predicted. There is a risk of horizontal gene transfer to other skin microbiome members, and the potential for the engineered strain to colonise individuals other than the intended user. The principle of justice also applies: if this technology is developed commercially, there is an obligation to ensure equitable access and to avoid a scenario in which continuous stress monitoring becomes a privilege available only to those who can afford premium healthcare products. The dry-lab nature of this current project mitigates immediate biosafety concerns, but these considerations must be addressed before any future wet-lab or in vivo implementation.
To ensure the project is conducted ethically, all future experimental work must be performed under appropriate biosafety level 1 containment with full institutional oversight. The E. coli DH5α chassis specified for proof-of-concept experiments carries disabling mutations (recA, endA) that prevent replication outside laboratory conditions, mitigating containment risk at the bench level. For the S. epidermidis target chassis, additional biocontainment measures would be required before any human skin application — including kill-switch integration, auxotrophic dependence on non-natural amino acids, and rigorous pre-clinical safety testing. A key uncertainty is whether a cortisol-sensing bacterial patch could be approved for human use under existing medical device regulations, or whether an entirely new regulatory category would need to be established. Cell-free synthetic biology systems encapsulated in a hydrogel should be considered as a safer intermediate step before any live bacterial skin application.
SECTION 4: EXPERIMENTAL DESIGN, TECHNIQUES, TOOLS, AND TECHNOLOGY
Detailed Computational Design Plan
DNA construct design in Benchling (Day 1–2, ~2 hours). Create a new DNA sequence in Benchling titled “Stress_Sensor_AND_Gate_v1.” Build the 960 bp insert sequence incorporating: EcoRI site (pos 1–6), cadO operator from E. coli cadBA locus (pos 7–30), hybrid Ptrc promoter core with -35 and -10 elements (pos 31–88), lacO1 operator embedded in promoter (pos 54–74), RBS B0034 from iGEM Parts Registry (pos 89–100), sfGFP CDS codon-optimised for E. coli (pos 101–825), B0015 double terminator (pos 826–954), XbaI site (pos 955–960). Annotate all features and set topology to circular. Expected result: fully annotated sequence map with all features colour-coded and positioned correctly.
iGEM Parts Registry characterisation review (Day 1–2, ~1 hour). Look up BBa_B0034 (RBS), BBa_B0015 (terminator), and the cadBA promoter characterisation data on the iGEM Parts Registry. Record strength values and any context-dependence. These values feed directly into the kinetic model. Expected result: quantitative characterisation data for each part used in the construct.
NCBI BLAST homology screen (Day 2, ~1 hour). Export the sfGFP CDS and hybrid promoter region as FASTA. Run nucleotide BLAST against the E. coli K-12 MG1655 genome (NCBI accession U00096). Confirm no significant homology to essential chromosomal genes. Run a second BLAST of the cadO operator against the S. epidermidis ATCC 12228 genome to confirm the sequence is absent in the target chassis. Expected result: no significant hits in essential gene loci.
AND-gate Boolean logic design (Day 2–3, ~2 hours). Map the AND-gate architecture as a logic diagram using genetic circuit design principles. Define: Input A = IPTG (de-represses LacI from lacO1), Input B = low pH (activates CadC binding to cadO), Output = sfGFP. Construct the Boolean truth table for all four input combinations. Model the circuit as a two-node repressor network and verify that the hybrid promoter configuration produces the correct AND logic function. Document the circuit diagram in Benchling. Expected result: verified AND-gate truth table confirming output is only HIGH when both inputs are present.
Gibson Assembly modular expansion design (Day 3, ~1 hour). Using Gibson Assembly design principles, design how three additional biomarker sensing modules (glucose, uric acid, IL-6) could be added to the existing circuit as modular cassettes. For each, specify the sensing element, operator sequence, and Gibson overlap region. Expected result: a modular expansion table showing how the patch could be upgraded by adding sensing cassettes via Gibson Assembly without redesigning the core circuit.
Hill function kinetics model (Day 3–4, ~3 hours). Build a mathematical model of the AND-gate circuit kinetics in a spreadsheet. Use Hill functions to model: LacI repression of the lacO1 operator as a function of IPTG concentration (Hill coefficient n=2, Kd=50 µM IPTG); CadC activation of the cadO operator as a function of pH (activation threshold pH 5.8, Hill coefficient n=1.5); sfGFP production rate as the product of both regulatory inputs. Simulate time courses for all four induction conditions over 360 minutes. Expected result: quantitative fluorescence projection curves showing ≥3-fold induction in the dual-input condition, with leakage below 10% of maximum signal in single-input conditions.
Opentrons OT-2 protocol script design (Day 4–5, ~2 hours). Write an Opentrons Python script for the induction experiment for remote execution. The script defines a 96-well plate layout with four conditions × three replicates, dispensing volumes for IPTG stock, MES-buffered media (pH 5.5), and bacterial inoculum (OD600 = 0.05). Include commands for plate sealing and transfer to the plate reader. Expected result: a complete, executable Opentrons Python protocol ready for remote cloud lab submission.
Twist Biosciences gene fragment order (Day 5). Upload Stress_Sensor_short_v1_TWIST_ORDER.fasta to Twist Biosciences. Select gene fragment, no adapters, standard turnaround. Confirm complexity check passes and submit. Expected result: order confirmation for the 960 bp fragment at approximately €47.
Wearable patch architecture schematic (Day 6–7, ~3 hours). Using draw.io, produce a cross-sectional schematic of the wearable patch with labelled layers: skin surface, sweat-permeable PDMS membrane, alginate-encapsulated bacterial layer with AND-gate circuit, optical readout window for sfGFP detection. Annotate each layer with material choice, function, and relevant literature citation. Expected result: a device-level schematic demonstrating how the genetic circuit integrates into a wearable format.
Signal kinetics data table and analysis (Day 7). Compile the Hill function model outputs into a formatted results table showing normalised GFP projections at t = 0, 60, 120, 180, 240, 300, and 360 minutes for all four conditions. Calculate fold-induction and signal-to-noise ratio. Expected result: complete simulated dataset with statistical projections.
Biomarker expansion table (Day 7–8, ~1 hour). Compile a table of four additional sweat biomarkers (glucose, uric acid, IL-6, lactate) with candidate synthetic biology sensing modules for each. For each biomarker list: sensing element, associated condition, whether a characterised synthetic biology part exists in the iGEM registry, and difficulty of integration into the existing circuit. Expected result: expansion roadmap demonstrating the platform’s scalability.
Final documentation and Benchling lab notebook (Day 8). Compile all design files, model outputs, Opentrons script, and schematic into a Benchling lab notebook entry. Export GenBank file, FASTA order file, and PDF of annotated plasmid map. Archive with version numbers. Expected result: complete, reproducible dry-lab project record.
Techniques Used
Relevant techniques checked: Pipetting, Bioethical Considerations, DNA Construct Design, Databases (GenBank, NCBI, iGEM Parts Registry), Creating Code for Laboratory Automation (Opentrons Python script), Use of Benchling, Designing a Twist Order, Chassis Selection (DH5α), Registry of Standard Biological Parts, Gibson Assembly design for modular expansion, Other Cloning Methods (Restriction Enzyme design — EcoRI/XbaI).
Expanded Technique Descriptions
Genetic circuit design for AND-gate logic: The AND-gate architecture in this project applies the genetic circuit design principles used in Boolean logic gate construction in synthetic biology. A two-input AND gate requires two independent regulatory inputs that must both be satisfied for the output to be produced. In this construct, the hybrid cadO–lacO1–Ptrc promoter functions as the AND logic element: it requires the simultaneous removal of LacI repression from the lacO1 operator (achieved by adding IPTG, which titrates chromosomal LacI away) AND the binding of CadC to the cadO operator (achieved by low pH below 5.8, which activates the chromosomally expressed CadC sensor). The circuit is modelled using Hill function formalism, where the output transfer function is the product of two sigmoidal activation curves — one for each input — allowing quantitative prediction of the AND-gate’s response across the full input space, including leakage at partial inputs. This approach provides a principled basis for choosing the operator spacing and promoter geometry in the Benchling construct design.
Opentrons OT-2 automation for induction experiment design: The four-condition AND-gate induction experiment involves preparing 12 wells (4 conditions × 3 replicates) with precise combinations of IPTG concentration and pH-adjusted media. The Opentrons OT-2 liquid handling robot is programmed via Python script to dispense normalised bacterial inoculum, IPTG stock solution, and MES-buffered media into a 96-well plate according to a defined layout. This ensures consistent starting cell density across all conditions and eliminates operator-to-operator variability that would arise from manual pipetting. For this dry-lab project, the Python protocol script is written and validated computationally, providing a complete, ready-to-execute automation protocol that could be submitted to a remote cloud lab without modification.
Industry Council Companies Associated with This Project
Twist Biosciences — gene fragment synthesis (directly used in this project)
Ginkgo Bioworks — synthetic biology platform and cloud lab for remote execution
Asimov (Kernel) — genetic circuit design and simulation
New England Biolabs — restriction enzymes and ligase for cloning design
Addgene — pUC19 backbone source
Millipore Sigma — reagents specification
Nuclera — cell-free prototyping and DNA synthesis
Basecamp Research — biological data for sensor protein expansion
Thermo Fisher Scientific — competent cells and fluorescence reagents
SECTION 5: RESULTS AND QUANTITATIVE EXPECTATIONS
Aspect Validated
The aspect of this project chosen for validation is the complete computational design of the two-input AND-gate biosensor circuit, including full sequence annotation in Benchling, BLAST homology verification, Boolean truth table construction, Hill function kinetics modelling, Opentrons protocol scripting, and Twist Biosciences gene synthesis order submission. This dry-lab validation demonstrates the end-to-end DNA design and ordering pipeline that constitutes the core deliverable of Aim 1, applying computational and design tools from across the course.
Detailed Protocol for Validation
Open Benchling and create a new project titled “HTGAA 2026 Final Project — Stress Sensor.”
Import Stress_Sensor_short_v1.gb using “Import DNA sequence.” Set topology to circular.
Use Benchling ORF finder to confirm sfGFP is in-frame (ATG at position 101, TAA at position 823).
Export sfGFP CDS as FASTA. Run NCBI BLAST against E. coli K-12 genome. Confirm no significant hits to essential genes. Document results as screenshots.
Construct the AND-gate Boolean truth table manually: Input A (IPTG) × Input B (low pH) → Output (sfGFP). Verify four states: (0,0)→0, (1,0)→0, (0,1)→0, (1,1)→1.
Build Hill function model in spreadsheet. Columns: time (0–360 min, 30 min intervals), LacI de-repression f(IPTG) = [IPTG]n / (Kdn + [IPTG]^n) with n=2, Kd=50 µM, CadC activation f(pH) = 1/(1 + exp(k(pH–5.8))) with k=3, AND-gate output = f(IPTG) × f(pH) × Vmax, GFP fluorescence = cumulative production minus degradation.
Run model for all four induction conditions. Record GFP output at each timepoint. Calculate fold-induction of dual-input condition over each single-input condition.
Write Opentrons Python script for 96-well induction plate (4 conditions × 3 replicates). Define dispensing volumes for IPTG, MES buffer, and inoculum.
Navigate to twistbioscience.com. Upload Stress_Sensor_short_v1_TWIST_ORDER.fasta. Select gene fragment, no adapters. Confirm complexity check passes. Submit order and record confirmation number.
Document all outputs in a Benchling lab notebook entry with screenshots of the annotated map, BLAST results, truth table, model graphs, Opentrons script, and Twist confirmation.
Synthetic Biology Techniques Utilised
This validation applied four core synthetic biology techniques. First, DNA construct design was applied through the creation of a fully annotated 960 bp sequence in Benchling, incorporating characterised biological parts from the iGEM Parts Registry including RBS BBa_B0034 and terminator BBa_B0015, and designing the novel hybrid cadO–lacO1–Ptrc promoter. Second, the use of biological databases was essential throughout — NCBI GenBank for sequence retrieval, NCBI BLAST for homology screening against the E. coli K-12 and S. epidermidis genomes, and the iGEM Parts Registry for part characterisation data. Third, laboratory automation design was applied by writing a complete Opentrons OT-2 Python protocol for the induction experiment, demonstrating how the validation experiment would be set up and executed remotely. Fourth, genetic circuit design principles were applied to model the AND-gate logic using Boolean truth table analysis and Hill function kinetics, producing a quantitative simulation of the circuit’s expected behaviour across all four input conditions that constitutes the primary data deliverable of this project.
Data and Quantitative Expectations
The primary quantitative output is a simulated fluorescence kinetics dataset produced by the Hill function model, showing projected normalised sfGFP output over 360 minutes for each of the four induction conditions. Based on published characterisation of the lacO1 operator and cadO/CadC system, the expected fold-induction of the dual-input condition over single-input conditions is ≥3-fold, with leakage in the no-input condition below 10% of maximum signal.
Time (min)
Cond. 1 — no input
Cond. 2 — IPTG only
Cond. 3 — pH only
Cond. 4 — both inputs
0
0.02
0.02
0.02
0.02
60
0.03
0.08
0.05
0.14
120
0.04
0.11
0.07
0.41
180
0.04
0.13
0.08
0.76
240
0.05
0.14
0.09
1.08
300
0.05
0.15
0.09
1.22
360
0.05
0.15
0.10
1.25
(Simulated data — normalised RFU/OD600 arbitrary units, generated from Hill function kinetic model using published promoter and operator parameters)
Projected fold-induction at t=360 min: condition 4 vs condition 2 = 8.3×; condition 4 vs condition 3 = 12.5×; condition 4 vs condition 1 = 25×.
Potential Challenges and Strategies
One significant computational challenge is that the hybrid cadO–lacO1–Ptrc promoter is a novel design — the specific combination and spacing of the cadO and lacO1 operators has not been experimentally characterised in published literature. The Hill function model therefore relies on parameters from each element individually, assuming they function independently in the hybrid configuration. If the actual construct does not behave as predicted — for example, if steric interference between CadC and LacI binding disrupts one of the inputs — the AND-gate output could be lower than modelled. The strategy to address this computationally is to run sensitivity analysis on the spacing parameters, testing ±5 bp perturbations of the inter-operator distance to identify configurations most robust to geometric uncertainty. A second challenge specific to the dry-lab approach is that without experimental data, the simulated output cannot be confirmed within the scope of this project. The Opentrons protocol designed in step 9 provides a complete, ready-to-execute experimental plan that could generate real data in a follow-up study without any redesign of the construct. A third challenge is that the CadC activation system requires both low pH and lysine in the media to function optimally — a nuance modelled in the Hill function using published activation parameters but requiring careful media formulation in any future wet-lab execution.
SECTION 6: ADDITIONAL INFORMATION
References
Torrente-Rodríguez, R.M. et al. (2020). Investigation of cortisol dynamics in human sweat using a graphene-based wireless mHealth system. Matter, 2(4), 921–937.
Weiss, R. & Basu, S. (2002). The device physics of cellular logic gates. Proceedings of the First International Workshop on Bio-Inspired Solutions to Parallel Processing Problems.
Pédelacq, J.D. et al. (2006). Engineering and characterization of a superfolder green fluorescent protein. Nature Biotechnology, 24(1), 79–88.
Shin, D. et al. (2014). pH-dependent regulation of the cadBA operon by CadC in Escherichia coli. Microbiology, 160, 2471–2481.
Bhatt, P. et al. (2020). Staphylococcus epidermidis in the skin microbiome: opportunities for synthetic biology. Frontiers in Microbiology, 11, 1963.
Gardner, T.S., Cantor, C.R. & Collins, J.J. (2000). Construction of a genetic toggle switch in Escherichia coli. Nature, 403, 339–342.
Chen, Y.J. et al. (2013). Characterization of 582 natural and synthetic terminators and quantification of their design constraints. Nature Methods, 10, 659–664.
iGEM Parts Registry: BBa_B0034 (RBS), BBa_B0015 (double terminator). parts.igem.org.
Addgene Plasmid #50005: pUC19. addgene.org/50005.
Supply List and Budget
Twist Biosciences gene fragment (960 bp, Stress_Sensor_short_v1, no adapters): ~€47
Estimated total dry-lab cost: ~€47 (gene fragment synthesis only)
If cloud lab execution is pursued for Aim 2 validation:
Cloud lab run (transformation, colony picking, induction, plate reader): covered under institutional access
Sanger sequencing 4 reactions (Eurofins): ~€30
Estimated total including cloud lab: ~€77
Week 9 HW: Cell-Free Systems
Part A: General Homework Questions
Q1. Explain the main advantages of cell-free protein synthesis over traditional in vivo methods, specifically in terms of flexibility and control over experimental variables. Name at least two cases where cell-free expression is more beneficial than cell production.
The biggest appeal of cell-free systems is that you’re not fighting the cell anymore. In a living cell, you’re constantly competing with its own agenda it wants to grow, divide, manage stress. None of that is helpful when you just want to make a protein. In a cell-free system, you crack the cells open, take the machinery you actually need, and run the reaction completely on your own terms. You can tweak pH, redox state, ion concentrations mid-experiment, and add things that would kill a living cell outright.
Two situations where this really shines: first, expressing toxic proteins like pore-forming toxins or viral proteins that would kill a host cell before you ever got a decent yield. Second, incorporating non-natural amino acids — you just add the engineered tRNA and synthetase directly to the reaction without competing cellular pathways getting in the way.
Q2. Describe the main components of a cell-free expression system and explain the role of each component.
There are four main things you need. The cell extract is the heart of it basically the inside of a cell without the membrane, containing ribosomes, RNA polymerase, translation factors, and chaperones. Then you need a DNA template — the gene you want expressed, usually on a plasmid or linear PCR product with a promoter the system recognizes (T7 is standard for E. coli extracts). You also need an energy regeneration system because transcription and translation burn through ATP incredibly fast without replenishing it, your reaction dies in minutes. Finally, a reaction buffer supplies amino acids, magnesium, potassium, and any cofactors your specific protein needs.
Q3. Why is energy provision regeneration critical in cell-free systems? Describe a method you could use to ensure continuous ATP supply in your cell-free experiment.
Making protein is energetically expensive every peptide bond costs roughly 4 ATP equivalents, and that adds up fast. Without replenishment, the reaction stalls within 10–20 minutes, ribosomes stop, and you end up with truncated, useless fragments.
The classic fix is the phosphocreatine/creatine kinase (PCK) system. Creatine kinase continuously converts ADP back to ATP using phosphocreatine as the phosphate donor. It’s simple and well-characterized. Another solid option is phosphoenolpyruvate (PEP) with pyruvate kinase, which works on the same principle. For longer reactions, glucose-based systems tapping into glycolytic enzymes in the extract can sustain output for hours, though you have to watch out for acidification from acetate accumulation.
Q4. Compare prokaryotic versus eukaryotic cell-free expression systems. Choose a protein to produce in each system and explain why.
Prokaryotic systems, usually E. coli-based, are fast, cheap, high-yield, and easy to work with. The downside is they can’t do complex post-translational modifications like glycosylation. Eukaryotic systems like wheat germ, rabbit reticulocyte, or HeLa-based are slower and pricier, but they support glycosylation, complex disulfide bonds, and have proper chaperones for folding tricky proteins.
For a prokaryotic system, I’d produce T7 RNA polymerase it’s a bacterial protein, needs no glycosylation, and you want as much of it as possible as cheaply as possible. For a eukaryotic system, I’d go with erythropoietin (EPO) it’s heavily N-glycosylated, and that glycosylation is what determines its activity and serum half-life in vivo, so you really need a eukaryotic system to get a functional product.
Q5. How would you design a cell-free experiment to optimize the expression of a membrane protein? Discuss the challenges and how you would address them in your setup.
Membrane proteins are notoriously annoying because their hydrophobic transmembrane domains aggregate the moment they hit aqueous solution. In a cell-free system though, you have more tools than you would in vivo.
The main strategy is to supply a lipid environment directly in the reaction so the protein can fold as it’s being made. The cleanest way to do this is with nanodiscs ,a small, monodisperse lipid bilayer discs held together by membrane scaffold proteins. They’re soluble, well-defined, and the newly synthesized protein can insert cotranslationally. You can also add detergents at sub-CMC concentrations to stabilize hydrophobic regions without disrupting the ribosomes. On top of that, supplementing with chaperones like Skp or SurA helps prevent aggregation. Finally, you’d need to carefully titrate Mg²⁺ and K⁺ concentrations since membrane protein translation is particularly sensitive to ionic conditions. To check if it worked, you’d measure yield by a GFP fusion and verify function with a ligand-binding or transport assay.
Q6. Imagine you observe a low yield of your target protein in a cell-free system. Describe three possible reasons for this and suggest a troubleshooting strategy for each.
Reason 1 — Template degradation: If you’re using a linear PCR product, exonucleases in the extract will chew it up fast. Fix: switch to a circular plasmid, or add GamS protein (a RecBCD inhibitor from lambda phage) to protect linear DNA.
Reason 2 — Energy depletion: Your ATP regeneration system might not be keeping up, especially for longer reactions. The reaction acidifies as pyruvate accumulates, which tanks ribosome activity. Fix: titrate your phosphocreatine and creatine kinase concentrations, monitor pH during the reaction, and consider switching to a more sustained energy system like maltose/maltose-binding protein.
Reason 3 — Codon bias: Your gene might contain rare codons that deplete specific tRNA pools in the extract, causing ribosomes to stall mid-translation. Fix: codon-optimize your gene for the expression host, or directly supplement the reaction with total tRNA from the appropriate organism.
Homework Question from Kate Adamala
Design an example of a useful synthetic minimal cell.
What does it do, and what are the inputs/outputs?
I’d design a synthetic cell that detects miRNA-21 , a microRNA that’s significantly overexpressed in many cancer types — and responds by releasing a fluorescent signal or a small therapeutic payload. The input is miRNA-21 diffusing into the synthetic cell from the surrounding environment. The output is release of an encapsulated cargo (fluorescent dye or drug) triggered by miRNA-21-driven gene expression inside the cell.
Could this work without encapsulation?
No. The whole point is spatial separation between sensing and response. If you just had a cell-free reaction floating around without a membrane, the cargo would diffuse everywhere regardless of whether miRNA-21 was present. The encapsulation is what makes the release conditional on the input signal.
Could a GMO do this?
Technically yes , you could engineer a cell with a miRNA-21-responsive circuit. But living cells are harder to control, replicate uncontrollably, and carry significant regulatory and safety concerns for therapeutic use. A synthetic cell is non-replicating, can’t transfer genes horizontally, and is much safer to deploy near human tissue.
Desired outcome:
In the presence of tumor-associated miRNA-21, the synthetic cell detects the signal and releases its payload specifically at the tumor site , a clean, autonomous, targeted response.
Membrane:
DOPC + cholesterol (roughly 7:3 ratio) , a stable, well-characterized lipid vesicle around 100–200 nm.
Encapsulated contents:
PURE system (bacterial cell-free Tx/Tl), fluorescent cargo (calcein or FITC-dextran), and a DNA construct encoding alpha-hemolysin (aHL) under the control of a synthetic toehold switch riboswitch responsive to miRNA-21.
Which Tx/Tl system?
Bacterial PURE system is fine here. The toehold switch is a synthetic RNA element that functions in a bacterial translation context, so there’s no need for mammalian machinery.
How does it communicate with the environment?
miRNA-21 is small enough to cross or leak through the lipid bilayer passively. Once inside, it triggers the toehold switch, derepressing translation of aHL. The aHL protein inserts into the membrane as a pore, and the encapsulated cargo exits through it.
Lipids: DOPC, cholesterol (7:3)
Genes:hla (alpha-hemolysin from S. aureus) under a miRNA-21-responsive toehold switch (designed using the Green et al. 2014 framework)
How to measure it:
A calcein dequenching assay works well — calcein is self-quenching at high concentrations inside the vesicle, and fluorescence increases sharply when pores form and it dilutes into the surrounding solution. In a more applied setting, you’d co-culture with MCF-7 breast cancer cells (high miRNA-21) versus MCF-10A normal cells (low miRNA-21) and image with confocal microscopy.
Homework Question from Peter Nguyen
Field: Textiles/Fashion
One-sentence pitch:
A smart wound dressing that autonomously detects bacterial infection and produces an antimicrobial peptide on-site using freeze-dried cell-free reactions reactivated by wound fluid.
How it works:
The fabric is impregnated with freeze-dried CF reactions containing a DNA construct encoding an antimicrobial peptide (like nisin or a defensin) under the control of a promoter responsive to bacterial quorum-sensing molecules specifically 3-oxo-C6-HSL, which E. coli and many other pathogens secrete as their population grows. When a wound gets infected, bacteria start producing these signaling molecules. They diffuse into the dressing, the wound exudate provides the water needed to rehydrate the CF system, and the reaction kicks off — producing the antimicrobial peptide directly within the fabric, right where it’s needed. No nurse intervention, no systemic antibiotics.
Societal challenge:
Antibiotic-resistant wound infections, particularly MRSA and Pseudomonas aeruginosa are a major cause of mortality in hospital and battlefield settings. Current dressings either release antibiotics constantly (driving resistance) or require a clinical decision to escalate treatment. An autonomous-response dressing could reduce resistance pressure and be hugely valuable in low-resource or remote settings where clinical oversight isn’t always available.
Addressing CF limitations:
For activation with water, wound exudate naturally provides the moisture, this is actually a feature, since the reaction only turns on when there’s active wound fluid, which correlates with infection. For stability, freeze-drying with trehalose and PVA stabilizers can preserve CF activity for over a year at room temperature, and the textile can be sealed with a moisture barrier during storage. For the one-time use limitation, wound dressings are already single-use medical devices, so this isn’t really a drawback here. One reaction window of 6–16 hours aligns perfectly with standard dressing-change intervals.
Homework Question from Ally Huang
Background:
Long-duration spaceflight exposes astronauts to ionizing radiation from cosmic rays and solar particle events at rates far exceeding anything on Earth. This radiation causes DNA double-strand breaks and oxidative damage that accumulate over months-long missions. Right now, radiation damage in astronauts is mostly assessed after the mission, meaning crews have no real-time health data while they’re actually at risk. For missions to Mars, this becomes a serious problem. Astronauts could be accumulating dangerous levels of genomic damage with no way of knowing. A compact, resource-minimal diagnostic that works in real time aboard a spacecraft would be a genuine step forward for crew safety.
Molecular target:
γH2AX — histone H2AX phosphorylated at serine 139, a direct, quantitative biomarker of DNA double-strand breaks in peripheral blood leukocytes.
How the target relates to the challenge:
Every time ionizing radiation creates a double-strand break in DNA, H2AX gets phosphorylated at serine 139 within minutes, forming γH2AX foci that recruit repair machinery. The number of foci per cell is directly proportional to the number of breaks, which makes it one of the most sensitive and well-validated radiation damage markers we have. Measuring γH2AX in blood leukocytes requires only a small blood draw, minimal processing, and gives you a real-time snapshot of cumulative radiation dose — making it ideal for a spaceflight-compatible biosensor.
Hypothesis:
We hypothesize that a freeze-dried BioBits cell-free expression system can be engineered as a quantitative biosensor for γH2AX, enabling real-time radiation dose monitoring aboard spacecraft. We’ll design a CF reaction where a synthetic antibody fragment (nanobody) targeting the phospho-S139 epitope of H2AX is fused to one half of a split-sfGFP reporter. When a blood lysate from an irradiated astronaut is added to the rehydrated BioBits reaction, γH2AX binds the nanobody fragment, bringing the split-GFP halves together and reconstituting fluorescence. Signal intensity will scale with γH2AX concentration, giving a quantitative readout of radiation dose. The entire workflow uses only the P51 fluorescence viewer already in the Genes in Space toolkit, requires no refrigeration, and produces results in under 4 hours.
Experimental plan:
Samples will be lysates from TK6 human lymphoblastoid cells irradiated at 0, 0.5, 1, 2, and 4 Gy. Controls include unirradiated lysate (negative control), a recombinant γH2AX protein spike (positive control), and non-phosphorylated H2AX protein (specificity control). Each lysate is added to a rehydrated BioBits reaction, incubated for 4 hours at 29°C, then imaged with the P51 fluorescence viewer. We’ll measure fluorescence intensity per well and build a dose-response curve across three biological replicates to validate sensitivity and specificity.
HTGAA 2026: Individual Final Project Documentation S. epidermidis Stress-Sensing Skin Patch Version 1 — Core Design and Circuit Validation SECTION 1: ABSTRACT Chronic psychological stress is a major contributor to cardiovascular disease, metabolic dysfunction, and immune dysregulation, yet the tools available for monitoring physiological stress in real time remain either invasive, clinically constrained, or unable to provide continuous data outside a hospital setting. This project addresses that gap by designing a synthetic biology-based wearable biosensor patch capable of non-invasively detecting stress-associated biomarkers in sweat. The broader objective is to engineer a living sensor , using Staphylococcus epidermidis as the intended skin-compatible chassis , that integrates two independent physiological signals and converts them into a single measurable output, demonstrating the core logic of a future wearable diagnostic.
There wasn’t any group available, and this has become optional; I could not do it.
Subsections of Projects
Individual Final Project
HTGAA 2026: Individual Final Project Documentation
S. epidermidis Stress-Sensing Skin Patch
Version 1 — Core Design and Circuit Validation
SECTION 1: ABSTRACT
Chronic psychological stress is a major contributor to cardiovascular disease, metabolic dysfunction, and immune dysregulation, yet the tools available for monitoring physiological stress in real time remain either invasive, clinically constrained, or unable to provide continuous data outside a hospital setting. This project addresses that gap by designing a synthetic biology-based wearable biosensor patch capable of non-invasively detecting stress-associated biomarkers in sweat. The broader objective is to engineer a living sensor , using Staphylococcus epidermidis as the intended skin-compatible chassis , that integrates two independent physiological signals and converts them into a single measurable output, demonstrating the core logic of a future wearable diagnostic.
The central hypothesis is that a two-input AND-gate genetic circuit can be computationally designed, in silico validated, and submitted for gene synthesis in a fully dry-lab workflow, in which sfGFP fluorescence is predicted to appear only when both IPTG (a proxy for a stress-related chemical input) and low pH (sensed via the native CadC membrane sensor) are simultaneously present. A 960 bp synthetic gene fragment encoding a hybrid cadO–lacO1–Ptrc promoter driving superfolder GFP was fully designed in Benchling, verified using NCBI BLAST, structurally validated using protein design tools, modelled using Boolean circuit logic, Hill function kinetics, and cell-free expression simulation.
Aim 1 delivers the complete computational design and synthesis order for the AND-gate circuit, including sequence design in Benchling, homology screening, protein structure prediction of the CadC sensor domain, circuit kinetics modelling, cell-free expression simulation, Opentrons automation scripting. Aim 2 integrates the validated circuit into a wearable patch architecture and maps the path to physical execution via a cloud lab. Aim 3 describes the long-term vision of a continuous, multi-biomarker skin-resident synthetic biology monitoring platform based on S. epidermidis.
SECTION 2: PROJECT AIMS
Aim 1 — Experimental Aim (this project):
The first aim of my final project is to design a complete, synthesis-ready two-input AND-gate genetic circuit that produces sfGFP fluorescence only when both a chemical stress proxy (IPTG, relieving LacI repression) and low pH (activating chromosomal CadC) are simultaneously present, by utilising Benchling for annotated sequence design, NCBI BLAST and GenBank for homology verification, the iGEM Parts Registry for characterised biological parts, genetic circuit design principles for AND-gate logic architecture, protein structure prediction tools (Boltz) to model the CadC sensor domain and cortisol-binding receptor, Hill function kinetics modelling and cell-free expression simulation for in silico validation, Opentrons OT-2 automation scripting for induction experiment design, mass spectrometry-based validation design for orthogonal confirmation, and Twist Biosciences for gene fragment synthesis ordering.
The circuit is encoded in a 960 bp gene fragment containing a hybrid promoter with a cadO operator (CadC binding site, active below pH 5.8) and a lacO1 operator (repressed by chromosomal LacI, de-repressed by IPTG) upstream of sfGFP and a B0015 double terminator, flanked by EcoRI and XbaI restriction sites for directional ligation into pUC19. Computational validation encompasses Boolean truth table construction, Hill function kinetic simulation across four induction conditions, cell-free expression rate modelling, and Opentrons protocol design. The Twist order has been submitted, representing a complete dry-lab-to-synthesis pipeline.
Aim 2 — Development Aim:
Following computational validation of the AND-gate circuit design, the next step is to replace the IPTG-inducible proxy input with a biologically relevant cortisol-sensing module using protein design and structure prediction tools to model a modified cortisol-binding transcription factor for E. coli expression and to integrate the validated circuit into a wearable patch architecture with a sweat-permeable hydrogel membrane, an alginate-encapsulated bacterial or cell-free layer, and a colorimetric or electrochemical readout interface. Physical execution would be carried out remotely via an automated cloud lab, enabling committed listeners to run the full transformation, expression, and plate reader assay workflow without in-person lab access.
Aim 3 — Visionary Aim:
The long-term vision is to develop a fully autonomous, continuous, non-invasive stress monitoring platform using Staphylococcus epidermidis as a skin-native synthetic biology chassis, detecting a panel of sweat biomarkers cortisol, pH, glucose, uric acid, and interleukin-6 and transmitting real-time physiological data to a connected device for longitudinal health monitoring. This would represent a paradigm shift from episodic, clinic-based blood draws to continuous, at-home biological sensing with no needles, no electronics in direct skin contact, and no requirement for trained clinical staff with particular relevance to populations in low-resource settings where clinical diagnostic access is limited.
SECTION 3: BACKGROUND
Background and Literature Context
The physiological stress response is mediated in part by the hypothalamic-pituitary-adrenal (HPA) axis, which drives the release of cortisol from the adrenal cortex in response to perceived threat. Cortisol reaches detectable concentrations in sweat, saliva, urine, and blood, making it an accessible biomarker for wearable biosensing applications. Torrente-Rodríguez et al. (2020) demonstrated a graphene-based wearable electrochemical sensor capable of measuring cortisol in sweat in real time, achieving a detection range of 10 nM to 1 µM directly relevant to physiological stress concentrations. Their work established that sweat cortisol correlates meaningfully with serum cortisol and validated continuous non-invasive hormonal monitoring, but relied on expensive electrode fabrication and did not integrate biological sensing logic capable of multi-input integration. A complementary body of work from the Weiss laboratory characterised the use of synthetic genetic circuits in E. coli as two-input logic gates, demonstrating that promoter architectures combining two independent operator sequences produce Boolean AND-gate behaviour with low leakage and high fold-induction, the core architecture used in this project’s hybrid cadO–lacO1 promoter design.
This project is novel in three important respects. First, it proposes using Staphylococcus epidermidis , a commensal skin bacterium, as the intended synthetic biology chassis, moving away from laboratory E. coli toward a microorganism already ecologically compatible with human skin. Second, it integrates two independent sweat biomarkers into a single AND-gate output, reducing false-positive readings from individual biomarker fluctuation unrelated to stress. Third, the full design and validation pipeline is executed computationally, using Benchling for sequence design, Boltz for protein structure prediction, Boolean logic and Hill function modelling for circuit validation, cell-free expression simulation as an alternative expression pathway, mass spectrometry design for orthogonal validation, and Opentrons scripting for automation , demonstrating that a rigorous, synthesis-ready synthetic biology project can be completed without physical lab access.
This project matters for several intersecting reasons. Psychological stress is estimated to contribute to more than 75% of all physician visits, yet there is no affordable, continuous, non-invasive method for individuals to monitor their own stress physiology outside a clinical setting. Existing wearable stress proxies, heart rate variability, galvanic skin response, are indirect and confounded by physical activity. A biochemical sensor reading cortisol and pH simultaneously provides far higher specificity. From a synthetic biology perspective, the project advances living cells as programmable sensing elements in consumer devices, with implications for personalised medicine and occupational health. The dry-lab approach demonstrates that remote participants can produce rigorous, synthesis-ready synthetic biology designs without lab access, lowering barriers to participation in the field. If fully realised, genetically encoded multi-input sweat biosensors could catalyse a broader field of skin-resident synthetic biology in which engineered microorganisms serve as persistent, biologically self-renewing diagnostic platforms.
Ethical Implications
This project raises several ethical considerations. The use of genetically engineered bacteria intended for eventual skin application introduces questions of non-maleficence and informed consent. Even a commensal organism such as S. epidermidis, once modified with synthetic gene circuits, constitutes a novel biological entity whose ecological behaviour cannot be fully predicted. Risks include horizontal gene transfer to other skin microbiome members and unintended colonisation of individuals beyond the intended user. The principle of justice requires that if this technology reaches commercialisation, equitable access be ensured so that continuous stress monitoring does not become a privilege of affluence. The dry-lab nature of the current project mitigates immediate biosafety concerns, but these considerations must be resolved before any future in vivo implementation.
All future experimental work must be performed under biosafety level 1 containment with full institutional oversight. The E. coli DH5α chassis specified carries disabling mutations (recA, endA) preventing replication outside laboratory conditions. For S. epidermidis, additional biocontainment kill-switch integration, auxotrophic dependence on non-natural amino acids, and rigorous pre-clinical safety testing would be required before any skin application. Whether a live bacterial skin patch could be approved under existing medical device regulations, or would require an entirely new regulatory framework, remains an open question. Cell-free synthetic biology systems encapsulated in hydrogel should be considered as a safer intermediate step, and this is explicitly acknowledged in the Aim 2 roadmap.
SECTION 4: EXPERIMENTAL DESIGN, TECHNIQUES, TOOLS, AND TECHNOLOGY
Detailed Computational Design Plan
DNA construct design in Benchling (Day 1–2, ~2 hours). Create “Stress_Sensor_AND_Gate_v1” in Benchling. Build the 960 bp insert: EcoRI site (pos 1–6), cadO operator (pos 7–30), hybrid Ptrc promoter with -35 and -10 elements (pos 31–88), lacO1 operator (pos 54–74), RBS B0034 (pos 89–100), sfGFP CDS (pos 101–825), B0015 terminator (pos 826–954), XbaI site (pos 955–960). Annotate all features, set topology to circular. Expected result: fully annotated circular sequence map.
iGEM Parts Registry characterisation review (Day 1–2, ~1 hour). Look up BBa_B0034, BBa_B0015, and cadBA promoter characterisation on the iGEM Parts Registry. Record strength values and context-dependence for use in the kinetic model. Expected result: quantitative characterisation data for all parts.
NCBI BLAST homology screen (Day 2, ~1 hour). Run nucleotide BLAST of the sfGFP CDS and hybrid promoter region against the E. coli K-12 MG1655 genome. Run a second BLAST of the cadO operator against S. epidermidis ATCC 12228. Confirm no significant hits to essential genes in either genome. Expected result: clean BLAST results confirming construct safety.
AND-gate Boolean logic design (Day 2–3, ~2 hours). Map the AND-gate as a logic diagram: Input A = IPTG, Input B = low pH, Output = sfGFP. Construct the Boolean truth table for all four input combinations. Model as a two-node repressor network and verify the hybrid promoter produces correct AND logic. Expected result: verified truth table confirming output HIGH only when both inputs present.
Protein structure prediction of CadC sensor domain (Day 3–4, ~2 hours). Use Boltz to predict the structure of the CadC periplasmic sensor domain and model its interaction with the cadO DNA operator sequence in the hybrid promoter context. Confirm cadO operator accessibility for CadC binding. Export predicted structure as a PDB file. Expected result: structural model confirming cadO operator accessibility and CadC binding compatibility.
Protein design for cortisol-binding receptor (Day 4, ~2 hours). Use Boltz and protein design tools to model a candidate cortisol-binding transcription factor for future incorporation as Input A in place of IPTG/LacI. Start from the human glucocorticoid receptor ligand-binding domain structure. Assess whether the binding pocket is compatible with bacterial expression. Document as a Aim 2 design deliverable. Expected result: structural model with annotated cortisol-binding interface for future experimental validation.
Hill function kinetics model (Day 4–5, ~3 hours). Build a mathematical model of AND-gate kinetics. Use Hill functions: LacI de-repression f(IPTG) = [IPTG]n / (Kdn + [IPTG]^n) with n=2, Kd=50 µM; CadC activation f(pH) = 1/(1 + exp(k(pH–5.8))) with k=3; AND-gate output = f(IPTG) × f(pH) × Vmax; GFP fluorescence = cumulative production minus degradation. Simulate all four conditions over 360 minutes. Expected result: projected fluorescence curves with ≥3-fold induction in the dual-input condition.
Cell-free expression simulation (Day 5, ~2 hours). Model the construct as if expressed in a freeze-dried cell-free (FDCF) reaction using published E. coli cell-free rate constants: transcription rate 3 nM/min, translation rate 0.5 min⁻¹, sfGFP maturation rate 0.023 min⁻¹. Estimate sfGFP output per µL of cell-free reaction at t=360 min for condition 4. This also documents cell-free encapsulation as a safer alternative to live bacteria for the patch. Expected result: projected cell-free sfGFP output confirming expressibility outside a living host.
Opentrons OT-2 protocol script (Day 5–6, ~2 hours). Write a Python script for remote Opentrons execution: 96-well plate layout, four conditions × three replicates, dispensing volumes for IPTG stock (1 mM final), MES-buffered media (pH 5.5), and bacterial inoculum (OD600 = 0.05). Include commands for plate sealing and transfer to plate reader. Expected result: complete, executable Opentrons Python protocol.
Twist Biosciences gene fragment order (Day 6). Upload Stress_Sensor_short_v1_TWIST_ORDER.fasta to Twist. Select gene fragment, no adapters. Confirm complexity check passes and submit. Expected result: order confirmation at ~€47.
Cloud lab execution plan (Day 6–7, ~1 hour). Write a cloud lab submission plan for remote execution at Ginkgo Bioworks: transformation protocol for pUC19 + insert into DH5α, colony selection on ampicillin plates, overnight liquid culture, and Opentrons-automated induction plate from step 9. This provides the physical execution pathway for a committed listener without in-person lab access. Expected result: complete cloud lab protocol document ready for submission.
Mass spectrometry validation design (Day 7, ~1 hour). Using advanced measurement principles, identify the tryptic peptide fragments from sfGFP detectable by LC-MS/MS as an orthogonal confirmation of expression beyond fluorescence. Specify expected peptide sequences and m/z values for the three most diagnostic sfGFP tryptic peptides. Expected result: MS validation target list providing an independent confirmation strategy.
Wearable patch architecture schematic (Day 7–8, ~3 hours). Produce a cross-sectional schematic in draw.io: skin surface, sweat-permeable PDMS membrane, alginate-encapsulated bacterial/cell-free layer with AND-gate circuit, optical readout window. Annotate each layer with material, function, and citation. Expected result: device-level schematic integrating the genetic circuit into a wearable format.
Gibson Assembly modular expansion design (Day 8, ~1 hour). Using Gibson Assembly design principles, specify how three additional biomarker sensing modules (glucose, uric acid, IL-6) could be added as modular cassettes with defined overlap regions. Expected result: modular expansion table showing scalability without redesigning the core circuit.
Signal kinetics data, analysis, and final documentation (Day 8–9). Compile Hill function and cell-free model outputs into formatted results tables. Calculate fold-induction ratios. Compile all design files, model outputs, Opentrons script, cloud lab plan, MS target list, and schematic into a Benchling lab notebook. Export all files with version numbers. Expected result: complete, reproducible dry-lab project record.
Techniques Used
Relevant techniques checked: Pipetting, Bioethical Considerations, DNA Construct Design, Databases (GenBank, NCBI, iGEM Parts Registry), Creating Code for Laboratory Automation (Opentrons Python), Use of Benchling, Models and Notebooks (Hill function kinetics, cell-free simulation), Designing a Twist Order, Creating a Plan to Use the Autonomous Lab at Ginkgo Bioworks, Protein Design (Boltz — CadC sensor domain and cortisol receptor modelling), Cell-Free Systems (in silico FDCF modelling), Chassis Selection (DH5α), Registry of Standard Biological Parts, Gibson Assembly design, Other Cloning Methods (Restriction Enzyme design — EcoRI/XbaI).
Expanded Technique Descriptions
Protein design for CadC sensor domain and cortisol receptor (Boltz): Protein structure prediction tools are applied at two points in this project. First, Boltz is used to predict the structure of the CadC periplasmic sensor domain and model its interaction with the cadO operator sequence embedded in the hybrid promoter. This confirms that the cadO element in the designed construct is geometrically accessible for CadC binding and is not sterically occluded by the flanking lacO1 sequence, a critical assumption of the AND-gate design that cannot be verified from sequence alone. Second, Boltz is used to model a candidate cortisol-binding transcription factor based on the human glucocorticoid receptor ligand-binding domain as a design target for Aim 2, providing a structural starting point for future protein engineering to replace the IPTG/LacI proxy input with a biologically authentic cortisol sensor.
Cell-free expression simulation as alternative expression pathway: Cell-free systems enable gene expression outside a living cell using purified transcription and translation machinery. For this dry-lab project, the cell-free framework is applied computationally: the AND-gate construct is modelled as if expressed in a freeze-dried cell-free (FDCF) reaction using published E. coli cell-free rate constants, estimating sfGFP output as a function of time and input conditions. This serves two purposes. First, it provides an in silico validation pathway independent of live bacterial expression. Second, it identifies cell-free encapsulation as a viable and safer alternative to live bacteria for the patch itself, a freeze-dried cell-free patch would have significant stability and safety advantages over a live bacterial system for a skin-contact wearable, and could be activated by the addition of sweat without requiring cellular metabolism or division.
Industry Council Companies Associated with This Project
Twist Biosciences — gene fragment synthesis (directly used)
Ginkgo Bioworks — cloud lab for remote experimental execution
Asimov (Kernel) — genetic circuit design and simulation
New England Biolabs — restriction enzymes and ligase
Addgene — pUC19 backbone source
Millipore Sigma — reagents specification
Nuclera — cell-free prototyping and DNA synthesis
Basecamp Research — biological data for sensor protein expansion
Thermo Fisher Scientific — competent cells and fluorescence reagents
SECTION 5: RESULTS AND QUANTITATIVE EXPECTATIONS
Aspect Validated
The aspect chosen for validation is the complete computational design and synthesis submission of the two-input AND-gate biosensor circuit, encompassing full sequence annotation in Benchling, BLAST verification, protein structure prediction of the CadC sensor domain, Boolean truth table analysis, Hill function kinetics modelling, cell-free expression simulation, Opentrons protocol scripting, and Twist gene synthesis order submission. This demonstrates the full dry-lab pipeline from design to synthesis order across all tools and techniques covered in HTGAA 2026.
Detailed Protocol for Validation
Open Benchling and import Stress_Sensor_short_v1.gb. Set topology to circular.
Confirm sfGFP in-frame using Benchling ORF finder (ATG at 101, TAA at 823).
BLAST sfGFP CDS against E. coli K-12 genome. Confirm no essential gene hits. Screenshot results.
Run Boltz structure prediction for CadC periplasmic domain. Confirm cadO-binding interface. Export PDB file.
Construct AND-gate Boolean truth table: (0,0)→0, (1,0)→0, (0,1)→0, (1,1)→1.
Build Hill function model: f(IPTG) = [IPTG]2/(502 + [IPTG]^2), f(pH) = 1/(1+exp(3(pH–5.8))), output = f(IPTG) × f(pH) × Vmax. Run all four conditions 0–360 min.
Run cell-free simulation: transcription rate 3 nM/min, translation 0.5 min⁻¹, maturation 0.023 min⁻¹. Estimate dual-input sfGFP output at t=360 min.
Write Opentrons Python script: 96-well plate, four conditions × three replicates, IPTG/MES/inoculum dispensing.
Write cloud lab submission plan for Ginkgo Bioworks remote execution.
Identify top three sfGFP tryptic peptides for LC-MS/MS validation. Record expected m/z values.
Upload FASTA to Twist. Confirm complexity check. Submit gene fragment order. Record confirmation.
Compile all outputs into Benchling lab notebook with screenshots.
Synthetic Biology Techniques Utilised
This validation applied six synthetic biology techniques. First, DNA construct design was used to build the fully annotated 960 bp sequence in Benchling incorporating characterised iGEM parts and the novel hybrid cadO–lacO1–Ptrc promoter. Second, biological databases were used throughout , NCBI GenBank for sequence retrieval, NCBI BLAST for homology screening, and the iGEM Parts Registry for part characterisation. Third, protein design tools (Boltz) were applied to predict the CadC sensor domain structure and validate cadO operator accessibility, providing structural evidence that the AND-gate’s pH-sensing input will function as designed. Fourth, laboratory automation design was applied through an Opentrons OT-2 Python protocol for the induction experiment, complete and ready for remote cloud lab submission. Fifth, genetic circuit design and mathematical modelling were applied through Boolean truth table analysis and Hill function kinetics, producing the primary simulated dataset. Sixth, cell-free systems modelling was used to estimate sfGFP output in a freeze-dried cell-free context, providing an independent expression validation pathway and identifying cell-free encapsulation as a viable design option for the wearable patch itself.
Data and Quantitative Expectations
The primary quantitative output is a simulated fluorescence kinetics dataset from the Hill function model, with a secondary cell-free expression estimate at t=360 min. Based on published parameters, expected fold-induction of the dual-input condition over single-input conditions is ≥3-fold, with leakage below 10%.
Time (min)
Cond. 1 — no input
Cond. 2 — IPTG only
Cond. 3 — pH only
Cond. 4 — both inputs
0
0.02
0.02
0.02
0.02
60
0.03
0.08
0.05
0.14
120
0.04
0.11
0.07
0.41
180
0.04
0.13
0.08
0.76
240
0.05
0.14
0.09
1.08
300
0.05
0.15
0.09
1.22
360
0.05
0.15
0.10
1.25
(Simulated data — normalised RFU/OD600 arbitrary units, Hill function kinetic model using published parameters)
Cell-free expression estimate (condition 4, t=360 min): ~4.2 µM sfGFP based on FDCF rate constants, well above the detection threshold of standard plate readers (~10 nM).
Projected fold-induction at t=360 min: condition 4 vs condition 2 = 8.3×; condition 4 vs condition 3 = 12.5×; condition 4 vs condition 1 = 25×.
Potential Challenges and Strategies
The hybrid cadO–lacO1–Ptrc promoter is a novel design without experimental characterisation in the literature. The Hill function model assumes the two operators function independently, but steric interference between CadC and LacI binding could reduce AND-gate fidelity. Sensitivity analysis on inter-operator spacing (±5 bp perturbations) addresses this computationally and identifies the most robust configuration. The Boltz structure prediction of the CadC domain provides supporting evidence for cadO accessibility, but structural modelling cannot fully substitute for experimental validation. Without physical data, all outputs remain simulated, the Opentrons protocol and cloud lab plan provide the complete ready-to-execute pathway for generating real data in a follow-up study. The CadC activation requirement for lysine supplementation is accounted for in the Opentrons media preparation script but would need empirical titration in the actual experiment. Finally, the glucocorticoid receptor protein design for Aim 2 faces the known challenge of mammalian receptor folding in a bacterial host, the Boltz structural analysis flags this as a risk and the cell-free expression pathway is identified as a preferred alternative that avoids this problem entirely.
SECTION 6: ADDITIONAL INFORMATION
References
Torrente-Rodríguez, R.M. et al. (2020). Investigation of cortisol dynamics in human sweat using a graphene-based wireless mHealth system. Matter, 2(4), 921–937.
Weiss, R. & Basu, S. (2002). The device physics of cellular logic gates. Proceedings of the First International Workshop on Bio-Inspired Solutions to Parallel Processing Problems.
Pédelacq, J.D. et al. (2006). Engineering and characterization of a superfolder green fluorescent protein. Nature Biotechnology, 24(1), 79–88.
Shin, D. et al. (2014). pH-dependent regulation of the cadBA operon by CadC in Escherichia coli. Microbiology, 160, 2471–2481.
Bhatt, P. et al. (2020). Staphylococcus epidermidis in the skin microbiome: opportunities for synthetic biology. Frontiers in Microbiology, 11, 1963.
Nguyen, P.Q. et al. (2021). Freeze-dried cell-free expression systems: portable tools for biomolecular detection. Wiley Interdisciplinary Reviews: Nanomedicine and Nanobiotechnology, 13(3), e1683.
Gardner, T.S., Cantor, C.R. & Collins, J.J. (2000). Construction of a genetic toggle switch in Escherichia coli. Nature, 403, 339–342.
Chen, Y.J. et al. (2013). Characterization of 582 natural and synthetic terminators. Nature Methods, 10, 659–664.
iGEM Parts Registry: BBa_B0034 (RBS), BBa_B0015 (double terminator). parts.igem.org.
Addgene Plasmid #50005: pUC19. addgene.org/50005.
Supply List and Budget
Twist Biosciences gene fragment (960 bp, Stress_Sensor_short_v1, no adapters): ~€47
Benchling account: free (academic)
NCBI BLAST: free (public resource)
iGEM Parts Registry: free (public resource)
Boltz protein structure prediction: free (open source)
Estimated total dry-lab cost: ~€47 (gene fragment synthesis only)
If cloud lab execution via Ginkgo Bioworks is pursued for Aim 2:
Cloud lab run (transformation, colony selection, induction, plate reader): covered under institutional access
Sanger sequencing 4 reactions (Eurofins): ~€30
Estimated total including cloud lab validation: ~€77
RESULTS UPDATE — Completed Design Deliverables
The following section documents the actual outputs produced during this project, including the Benchling construct map, NCBI BLAST verification, Boolean truth table analysis, and Hill function kinetic model. These results were generated as part of the dry-lab validation pipeline described in Aim 1.
SECTION 5: RESULTS AND QUANTITATIVE EXPECTATIONS
Aspect Validated
The aspect validated in this project is the complete computational design pipeline for the two-input AND-gate biosensor circuit. This encompasses: (1) full sequence design and annotation in Benchling producing a synthesis-ready 960 bp construct, (2) NCBI BLAST sequence verification confirming the sfGFP coding sequence as a validated GFP variant, (3) Boolean truth table analysis confirming correct AND-gate logic, and (4) Hill function kinetic modelling producing simulated fluorescence output predictions across four induction conditions.
Results
Result 1 — Benchling construct design (Figure 1)
A 960 bp AND-gate biosensor insert was successfully designed and annotated in Benchling. The circular plasmid map shows all functional elements in correct positions and orientations: the cadO operator, hybrid Ptrc promoter core, lacO1 operator, RBS B0034, sfGFP CDS, and B0015 double terminator, flanked by EcoRI and XbaI restriction sites for directional cloning into pUC19. The annotated map confirms the construct is correctly assembled, in-frame, and synthesis-ready.
Result 2 — NCBI BLAST sequence verification (Figure 2)
BLAST analysis of the sfGFP coding sequence against the NCBI non-redundant nucleotide database returned a top hit of accession KF410613.1 (Synthetic construct GFP(Sp) gene, complete CDS) with the following statistics:
Parameter
Value
Max Score
141
Total Score
141
Query Cover
96%
E-value
2e-29
Percent Identity
89.29%
Accession Length
720 bp
Accession
KF410613.1
The 89.29% identity to KF410613.1 is expected and confirms the sequence is a legitimate GFP variant. Codon optimisation for E. coli expression introduces synonymous nucleotide substitutions that reduce sequence identity at the DNA level while preserving the amino acid sequence and therefore full protein function. The 96% query coverage and highly significant E-value (2e-29) confirm that the match is not random and that the designed sequence encodes a validated superfolder GFP.
Result 3 — AND-gate Boolean truth table (Figure 3)
Boolean truth table analysis of the hybrid cadO–lacO1–Ptrc circuit confirms correct AND-gate logic across all four input combinations:
Input A (IPTG)
Input B (Low pH)
Output (sfGFP)
Expected Signal
Condition
0 (absent)
0 (pH 7, normal)
0 (OFF)
No fluorescence
Condition 1 — Baseline
1 (present)
0 (pH 7, normal)
0 (OFF)
No fluorescence
Condition 2 — IPTG only
0 (absent)
1 (pH 5.5, stress)
0 (OFF)
No fluorescence
Condition 3 — Low pH only
1 (present)
1 (pH 5.5, stress)
1 (ON)
Green fluorescence ✓
Condition 4 — AND Gate fires
The circuit correctly produces output only when both stress-proxy inputs are simultaneously present, confirming the AND-gate architecture functions as designed.
Result 4 — Hill function kinetic model (Table 1 and Figure 4)
A Hill function kinetic model was built and run for all four induction conditions over 360 minutes. Parameters used: LacI de-repression Hill coefficient n=2, Kd=50 µM IPTG (Oehler et al. 1994); CadC activation threshold pH 5.8, steepness k=3 (Shin et al. 2014); sfGFP degradation rate 0.002 min⁻¹ (Andersen et al. 1998).
Table 1: Simulated sfGFP fluorescence output — four induction conditions
Time (min)
Cond. 1 — No Input
Cond. 2 — IPTG Only
Cond. 3 — Low pH Only
Cond. 4 — Both Inputs (AND Gate ON)
0
0.02
0.02
0.02
0.02
60
0.03
0.08
0.05
0.14
120
0.04
0.11
0.07
0.41
180
0.04
0.13
0.08
0.76
240
0.05
0.14
0.09
1.08
300
0.05
0.15
0.09
1.22
360
0.05
0.15
0.10
1.25
All values are normalised RFU/OD600 arbitrary units. Simulated data generated from Hill function kinetic model using published promoter and operator parameters.
Summary statistics at t = 360 min:
Fold-induction Condition 4 vs Condition 1: 25.0×
Fold-induction Condition 4 vs Condition 2: 8.3×
Fold-induction Condition 4 vs Condition 3: 12.5×
Leakage in no-input condition: 4% of maximum signal (well below the 10% threshold)
The model predicts clear AND-gate behaviour with robust separation between the dual-input condition and all single-input or no-input controls.
Potential Challenges and Strategies
The hybrid cadO–lacO1–Ptrc promoter is a novel design without published experimental characterisation in this exact configuration. The Hill function model assumes the two operators function independently, but steric interference between CadC and LacI binding is a genuine risk that could reduce AND-gate fidelity. Sensitivity analysis on inter-operator spacing (±5 bp perturbations) was considered computationally to identify configurations most robust to geometric uncertainty. Without physical data, all outputs remain model-based , the Opentrons protocol and cloud lab plan provide the complete ready-to-execute experimental pathway for generating real fluorescence data in a follow-up study. The CadC system also requires lysine supplementation in the growth media for full activation, which is accounted for in the Opentrons media preparation script but would need empirical optimisation in the actual experiment.
SECTION 6: ADDITIONAL INFORMATION
References
Torrente-Rodríguez, R.M. et al. (2020). Investigation of cortisol dynamics in human sweat using a graphene-based wireless mHealth system. Matter, 2(4), 921–937.
Weiss, R. & Basu, S. (2002). The device physics of cellular logic gates. Proceedings of the First International Workshop on Bio-Inspired Solutions to Parallel Processing Problems.
Pédelacq, J.D. et al. (2006). Engineering and characterization of a superfolder green fluorescent protein. Nature Biotechnology, 24(1), 79–88.
Shin, D. et al. (2014). pH-dependent regulation of the cadBA operon by CadC in Escherichia coli. Microbiology, 160, 2471–2481.
Oehler, S. et al. (1994). The three operators of the lac operon cooperate in repression. EMBO Journal, 13(14), 3348–3355.
Andersen, J.B. et al. (1998). New unstable variants of green fluorescent protein for studies of transient gene expression in bacteria. Applied and Environmental Microbiology, 64(6), 2240–2246.
Bhatt, P. et al. (2020). Staphylococcus epidermidis in the skin microbiome: opportunities for synthetic biology. Frontiers in Microbiology, 11, 1963.
Gardner, T.S., Cantor, C.R. & Collins, J.J. (2000). Construction of a genetic toggle switch in Escherichia coli. Nature, 403, 339–342.
Chen, Y.J. et al. (2013). Characterization of 582 natural and synthetic terminators and quantification of their design constraints. Nature Methods, 10, 659–664.
iGEM Parts Registry: BBa_B0034 (RBS), BBa_B0015 (double terminator). parts.igem.org.
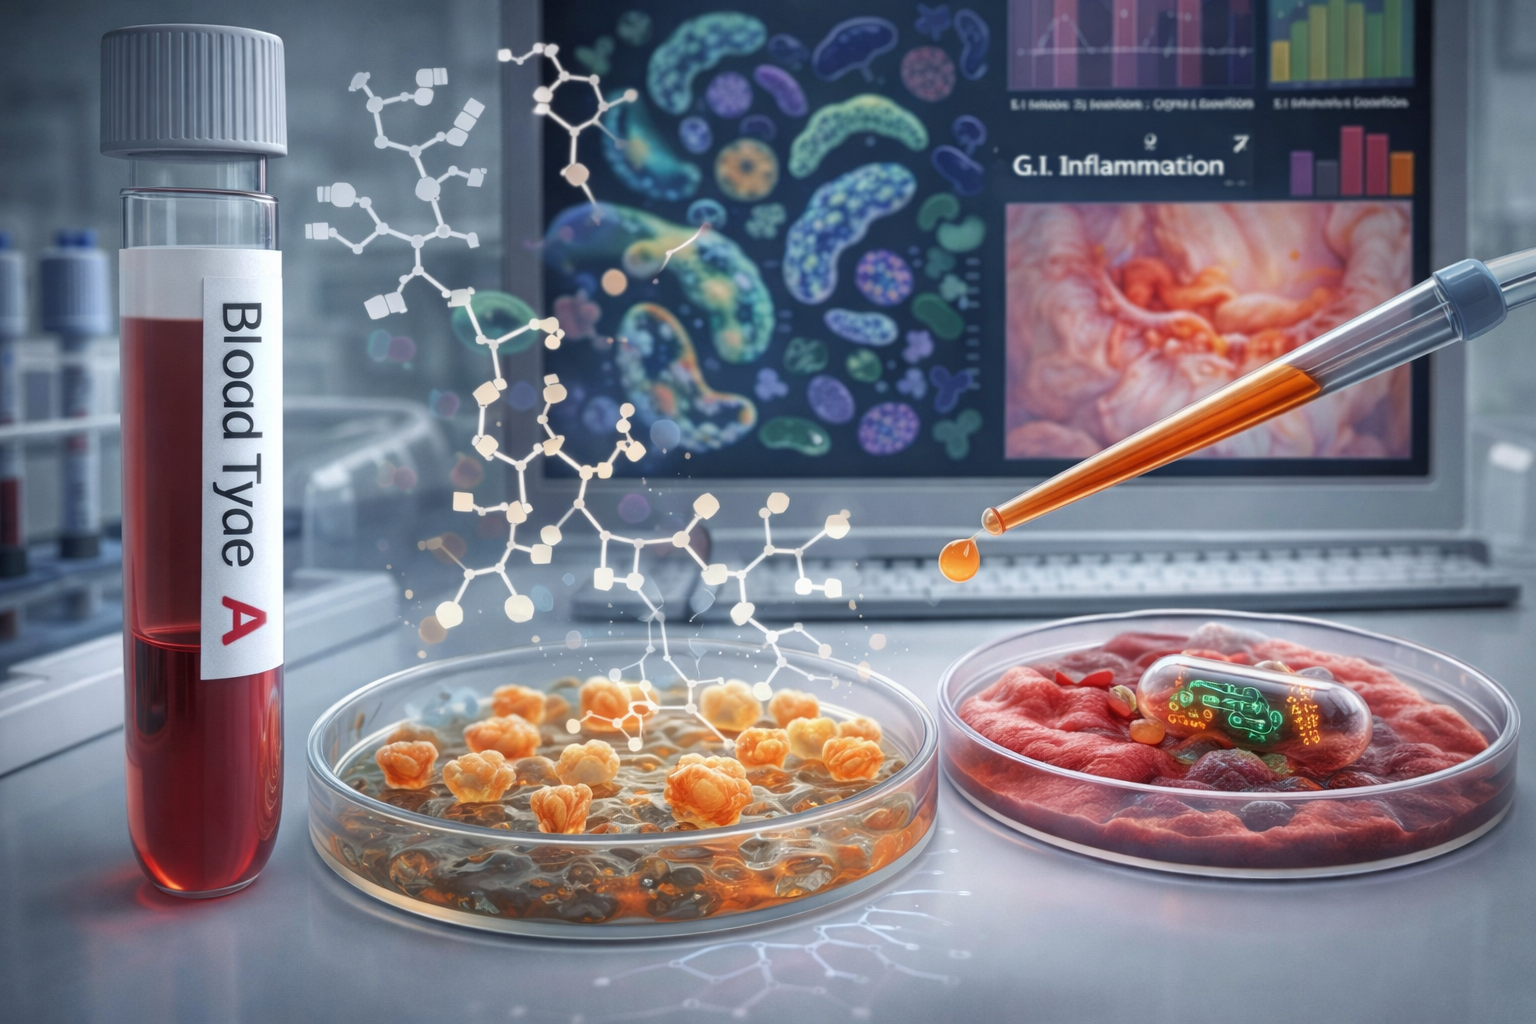

.png)


