week-10-hw-imaging-and-measurement

https://www.cygnustechnologies.com/hcp-identification-quantification
Homework: Final Project
For your final project:
1.Please identify at least one (ideally many) aspect(s) of your project that you will measure. It could be the mass or sequence of a protein, the presence, absence, or quantity of a biomarker, etc.
In the final project the presence of specific mec A mRNA is detected using aptamer fluorescence.The fluorescence intensity is directly proportional to the amount of the mRNA present at the site.
The system relies on the COF acting as a quencher for a fluorophore-labeled aptamer. The efficiency of the “turn-on” signal upon target binding must be measured to calculate the detection limit.
The mec A mRNA knockdown is also measured along with protein depletion using RT-qPCR and Western Blot respectively.The phenotypic Minimal Inhibitory Concentration (MIC) shift assay is also measured to measure thesensitivity of the bateria after treatment.
The cell wall binding domain specificity to MRSA bacteria is also measured by flow cytomeery of the pellet and pellet fold change of MRSA, MSSa and E.coli cells.
2.Please describe all of the elements you would like to measure, and furthermore describe how you will perform these measurements.
Measure the fluorescence recovery upon target binding (mecA mRNA)
Determine the lowest concentration of mec A mRNA that can be detected.
Ensure the aptamer only binds to the targeted mecA mRNA.
The cell wall binding specificity to bacteria is also studied to measure FAM fluorescence in pellet and supernatant by Flow cytometry.
The mRNA silencing is measured by RT-qPCR and protein depletion by Western blot.
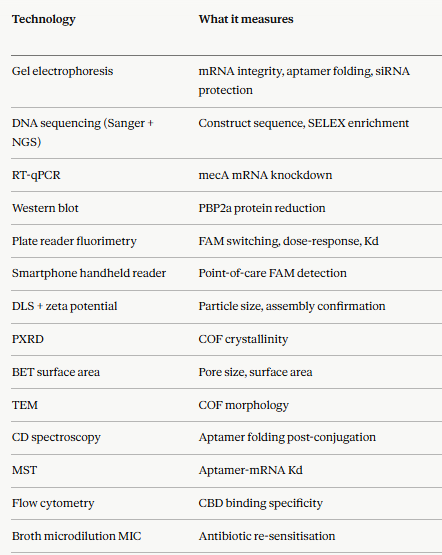
3.What are the technologies you will use (e.g., gel electrophoresis, DNA sequencing, mass spectrometry, etc.)? Describe in detail.
Smartphone-based Handheld Readers: 3D-printed attachments for smartphones that integrate a violet light source (LED) and a specialized emission filter, allowing them to serve as portable, low-cost scanners for quantifying fluorescence intensity.
The COF surface acts as a proximity quencher, holding the FAM-tagged aptamer in a dark OFF state through the inner filter effect and photoinduced electron transfer. Upon binding mecA mRNA, the aptamer undergoes a conformational change that separates the FAM fluorophore from the COF surface, generating a bright turn-on fluorescent signal detectable by the handheld device.
Courtesy: Claude.ai
Homework: Waters Part 1 — Molecular Weight
1.We will be analyzing an eGFP standard onto a BioAccord LC-MS system to determine the molecular weight of intact eGFP and observe its charge state distribution in the denatured (unfolded) state. The conditions for LC-MS analysis of intact protein cause it to unfold and be detected in its denatured form (due to the solvents and pH used for analysis).
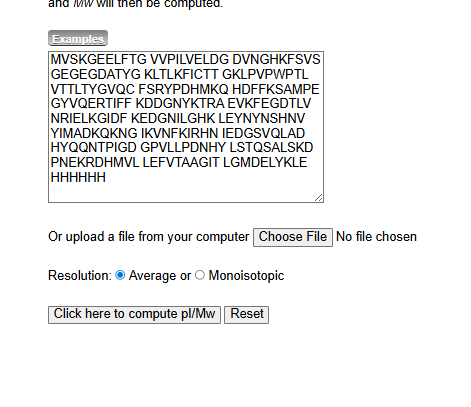
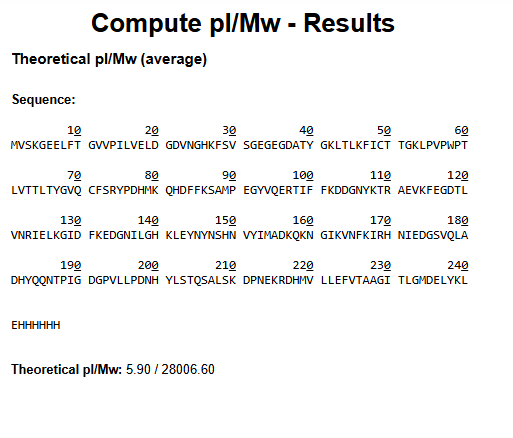
1.Based only on the predicted amino acid sequence of eGFP (see below), what is the calculated molecular weight? You can use an online calculator like the one at https://web.expasy.org/compute_pi/
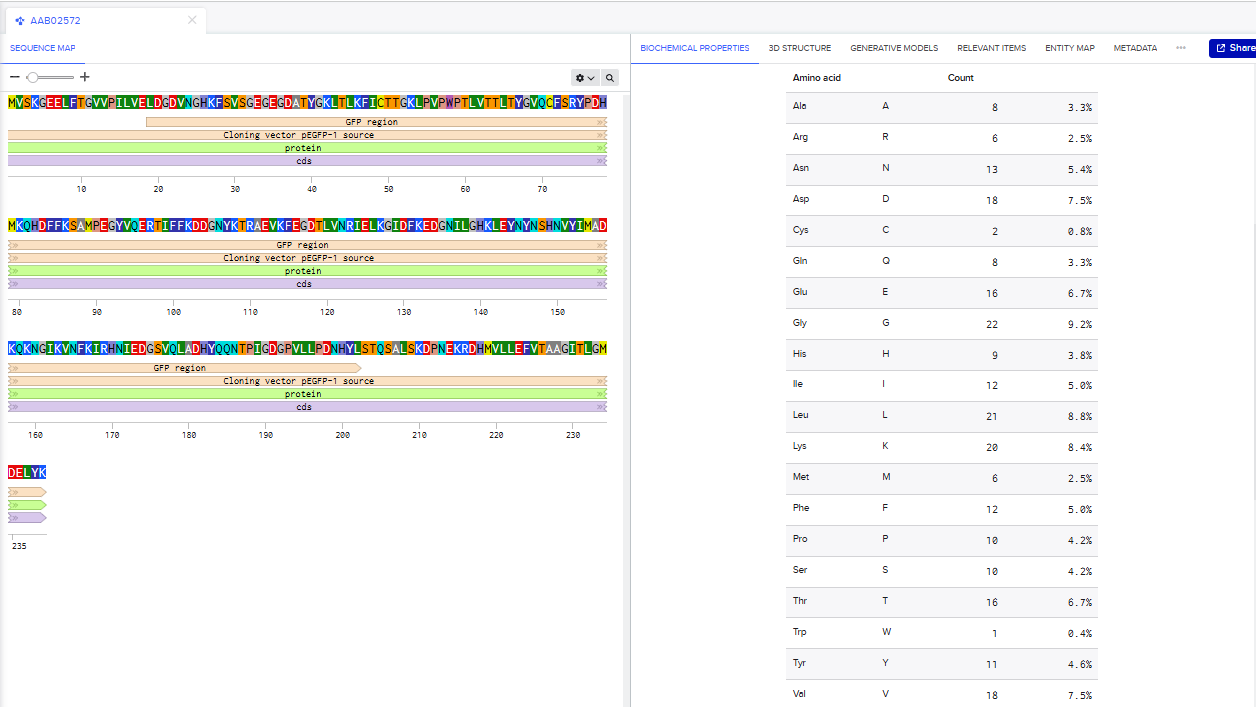
MVSKGEELFTG VVPILVELDG DVNGHKFSVS GEGEGDATYG KLTLKFICTT GKLPVPWPTL VTTLTYGVQC FSRYPDHMKQ HDFFKSAMPE GYVQERTIFF KDDGNYKTRA EVKFEGDTLV NRIELKGIDF KEDGNILGHK LEYNYNSHNV YIMADKQKNG IKVNFKIRHN IEDGSVQLAD HYQQNTPIGD GPVLLPDNHY LSTQSALSKD PNEKRDHMVL LEFVTAAGIT LGMDELYKLE HHHHHH Note: This contains a His-purification tag (HHHHHH) and a linker (the LE before it).
2.Calculate the molecular weight of the eGFP using the adjacent charge state approach described in the recitation.
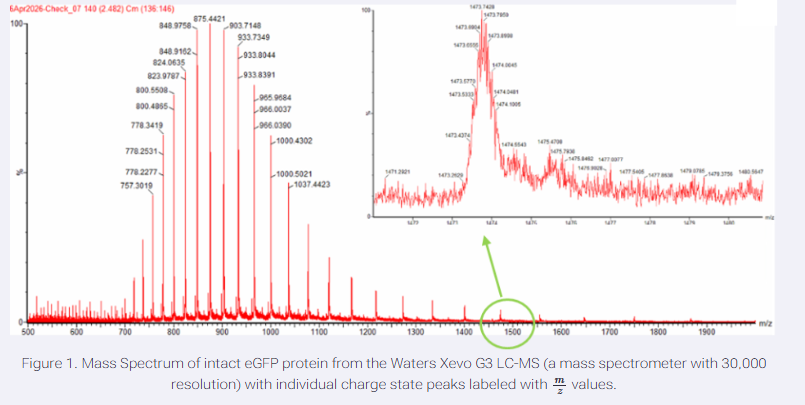
Select two charge states from intact LC-MS data (Figure 1) and:
The peaks around m/z 875.4421 and m/z 903.71
1.Determine z for each (n, n+1)
The formula
$$z = \frac{m_2}{m_1} - 1$$
Given:
- $m_1 = 903.71$
- $m_2 = 875.4421$
Therefore: $$z = \frac{875.4421}{903.71} - 1 \approx 1.008 - 1 \approx 32$$
Thus: $$z + 1 = 33$$
2.Determine the MW of the protein using the relationship between m/z,MW and z
The formula derives from
Since the difference gives: $$-\left(\frac{z_n}{z_{n+1}}\right) = -\frac{1}{z_n}$$
So: $$z = \frac{m_2 - 1.008}{m_1 - m_2}$$
$$M = z(m_1 - 1.008)$$
The molecular weight ($\text{MW}$) of the protein is calculated from the adjacent peaks using: $$\text{MW} \approx z \times (m/z) - (z \times 1.008)$$
Where $z = 32$ for $m/z = 903.71$ and $z = 33$ for $m/z = 875.4421$.
From the first peak ($m_1$): $$\text{MW} \approx 903.71 \times 32 - (32 \times 1.008)$$ $$\text{MW} = 28918.72 - 32.256 = 28886.464\text{ Da}$$
From the second peak ($m_2$): $$\text{MW} \approx 875.4421 \times 33 - (33 \times 1.008)$$ $$\text{MW} = 28889.553 - 33.264 = 28856.289\text{ Da}$$
Average Molecular Weight: $$\text{Average MW} \approx \frac{28886.464 + 28856.289}{2} \approx 28871.3765\text{ Da}$$
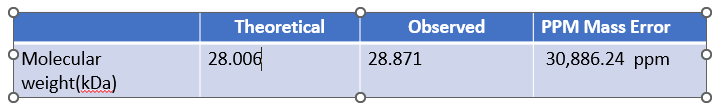
3.Calculate the mass accuracy of the measurement using the deconvoluted MW from 2.2 and the predicted weight of the protein from 2.1 using these formulae:
General Formulas:
$$\text{Mass Accuracy (ppm)} = \frac{m_{\text{exp}} - m_{\text{theor}}}{m_{\text{theor}}} \times 10^{6}$$
$$n = \frac{m/z_{n+1} - 1.008}{m/z_n - m/z_{n+1}}$$
Parameters and Reference Values
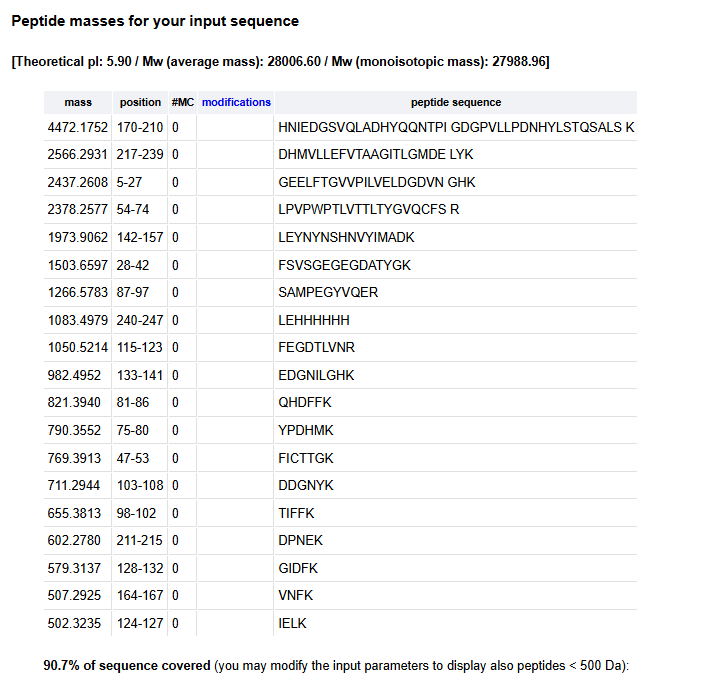
- Theoretical MW: $28006.60\text{ Da}$ (Calculated via the Expasy Compute pI/Mw tool)
- Experimental MW: $28871.3765\text{ Da}$ (Deconvoluted from adjacent charge state analysis using $H = 1.008\text{ Da}$ approximation)
Error and Accuracy Calculation
Mass Error: $$\text{Error} = 28871.3765 - 28006.60 = 864.7765\text{ Da}$$
Mass Accuracy (ppm): $$\text{Mass Accuracy} = \frac{864.7765}{28006.60} \times 10^6 \approx 30877\text{ ppm}$$
3.Can you observe the charge state for the zoomed-in peak in the mass spectrum for the intact eGFP? If yes, what is it? If no, why not?
No we cannot see it.To determine the charge state ($z$) directly from a single zoomed-in peak envelope, you must be able to observe the spacing between the individual isotopic peaks ($\Delta m/z$). In the inset the peaks are not baseline resolved.We cannot observe it directly from osotopes in inset , we can calculate it.
1. Main Spectrum Charge State ($z_2$) Determination: Using two adjacent, highly abundant peaks:
- $m_1 = 848.9758$
- $m_2 = 824.0635$
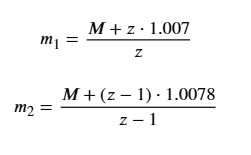
Formula for the charge state of the lower $m/z$ peak: $$z_2 = \frac{m_1 - 1.0078}{m_1 - m_2}$$
Using the $1\text{ Da}$ approximation: $$z_2 = \frac{848.9758 - 1}{848.9758 - 824.0635} \approx 34$$
2. Intact Mass ($M$) of eGFP Protein: Knowing the charge is $+34$ for the $824.0635$ peak: $$M = (34 \times 824.0635) - 34$$ $$M \approx 27,984.16\text{ Da}$$
3. Zoomed-In Peak Charge State Determination: Using the intact mass ($M \approx 27,984\text{ Da}$) to find the charge state for a peak centered around $m/z \approx 1474$: $$z = \frac{M}{m/z}$$
$$z = \frac{27984}{1474} \approx 18.98 \rightarrow z = 19+$$
Conclusion:
- The peak at $m/z \approx 1474$ represents the $+19$ charge state.
Homework: Waters Part 2 — Secondary/Tertiary structure
We will analyze eGFP in its native, folded state and compare it to its denatured, unfolded state on a quadrupole time-of-flight MS. We will be doing MS-only analysis (no liquid chromatography, also known as “direct infusion” experiments) on the Waters Xevo G3-QToF MS.
Based on learnings in the lab, please explain the difference between native and denatured protein conformations. For example, what happens when a protein unfolds? How is that determined with a mass spectrometer? What changes do you see in the mass spectrum between the native and denatured protein analyses (Figure 2)?
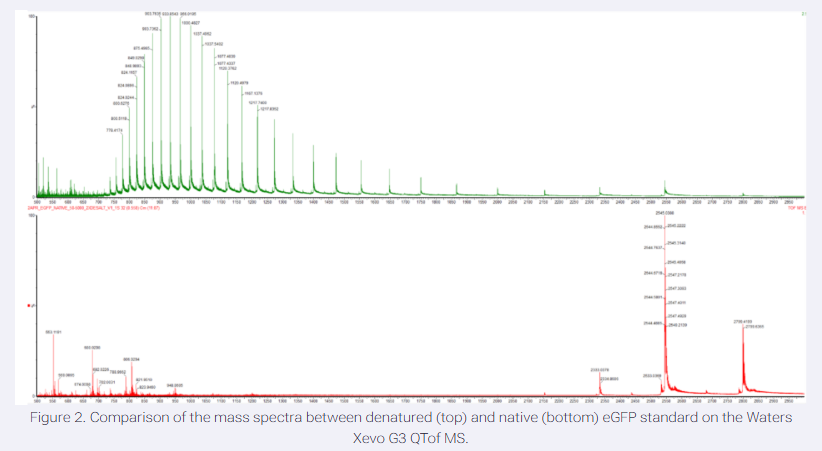
Native proteins maintain their folded, biologically active structures, while denatured proteins unfold into extended, disordered chains due to disruption of non-covalent interactions like hydrogen bonds and hydrophobic effects.Denaturation (e.g., via acid like formic or heat) breaks the highly ordered tertiary or quarternary structure, yielding random coils with exposed residues. Unfolding increases solvent-accessible surface area, often shifting charge statesNative proteins typically show narrow, high-charge distributions (e.g., +4 to +7 here), while denatured ones display broader, lower-charge envelopes (+3 to +5).
Mass spectrometers distinguish via charge state distributions (CSD) in ESI-TOF spectra: native MS yields narrow, symmetric peaks at higher m/z (lower z, intact fold limits adduction); denatured MS shows wider CSD at lower m/z (higher z, flexible chain binds more ions). Isotope resolution sharpens in native due to stable conformers.
Top Spectrum (Green, Denatured): This spectrum shows a broad distribution of many peaks across a wide range of mass-to-charge ratios (m/z), particularly at lower (m/z) values. This is characteristic of a highly charged species, as the charge (z) is high and the mass (m) is the same.
Bottom Spectrum (Red, Native): This spectrum shows fewer, more intense peaks clustered at higher (m/z) values. This indicates a lower charge state distribution, consistent with a compact, folded protein where fewer sites were available for protonation.
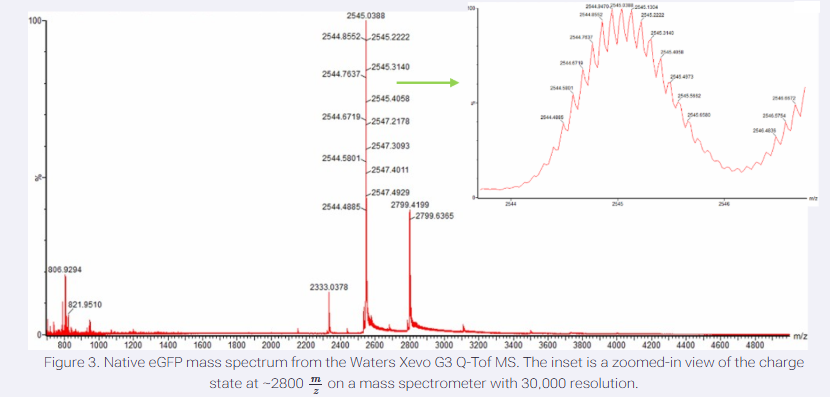
Zooming into the native mass spectrum of eGFP from the Waters Xevo G3 Q-Tof MS (see Figure 3), can you discern the charge state of the peak at ~2800 m/z? What is the charge state? How can you tell?
Identify adjacent isotopic peaks
Adjacent Isotopic Peaks
- $m/z_1 = 2545.3140$
- $m/z_2 = 2545.4058$
1. Difference in $m/z$ Values ($\Delta m/z$): $$\Delta m/z = m/z_2 - m/z_1$$ $$\Delta m/z = 2545.4058 - 2545.3140 = 0.0918$$
2. Charge State Calculation ($z$): Using the monoisotopic mass difference of carbon-13 ($\Delta m \approx 1.00335\text{ Da}$): $$z = \frac{1.00335}{\Delta m/z}$$
Substituting the value: $$z = \frac{1.00335}{0.0918} \approx 10.93$$
Final Result:
- Calculated charge: $z \approx 11$
The charge state of the peak at approximately (2800,m/z) is approximately 11. This is determined by measuring the mass-to-charge difference between adjacent isotopic peaks in the high-resolution inset and dividing the known isotopic mass difference (approx. 1.00335 Da) by the observed (m/z) difference.
Homework: Waters Part 3 — Peptide Map Work - primary structure
We will digest the eGFP protein standard into peptides using trypsin (an enzyme that selectively cleaves the peptide bond after Lysine (K) and Arginine (R) residues. The resulting peptides will be analyzed on the Waters BioAccord LC-MS to measure their molecular weights and fragmented to confirm the amino acid sequence within each peptide – generating a “peptide map”. This process is used to confirm the primary structure of the protein.
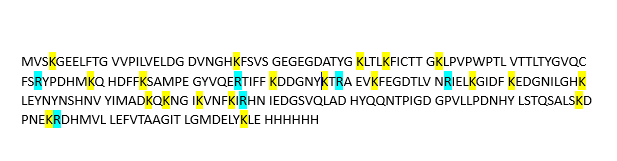
The lysine residues are marked in yellow and arginine residues are marked in light blue.
1.How many Lysines (K) and Arginines (R) are in eGFP? Please circle or highlight them in the in Waters Part I question 1 above. (Note: adding the sequence to Benchling as an amino acid file and clicking biochemical properties tab will show you a count for each amino acid).
There are 20 lysines(K) and 6 Arginines(R) in eGFP.
2.There are a variety of tools available online to calculate protein molecular weight and predict a list of peptides generated from a tryptic digest. We will be using tools within the online resource Expasy (bioinformatics resource portal of the SIB Swiss Institute of Bioinformatics) to predict a list of tryptic peptides from eGFP.
How many peptides will be generated from Tryptic digestion of eGFP?
3.Based on the LC-MS data for the Peptide Map data generated in lab (please use Figure 5a as a reference) how many chromatographic peaks do you see in the eGFP peptide map between 0.5 and 6 minutes?You may count all peaks that are >10% relative abundance.
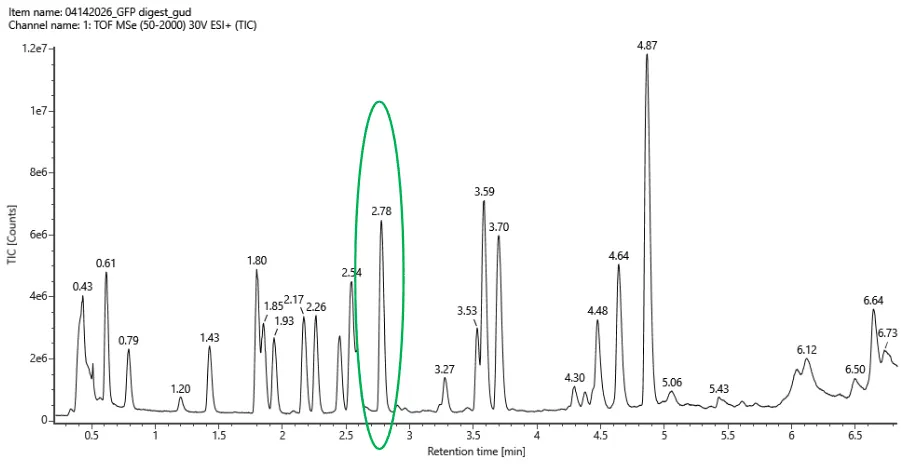
The maximum peak height is at 1.2e7 so all peaks that are >10% relative abundance, should have 0.1*1.2e7 = 1.2e6. There are 21 such peaks.
4.Assuming all the peaks are peptides, does the number of peaks match the number of peptides predicted from Step 2.3 and 2.4? Are there more peaks in the chromatogram or fewer?
There are only 19 peptides predicted. So there are more peaks in the chromatogram. These may be due to impurities in the sample or sample degradation.
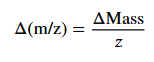
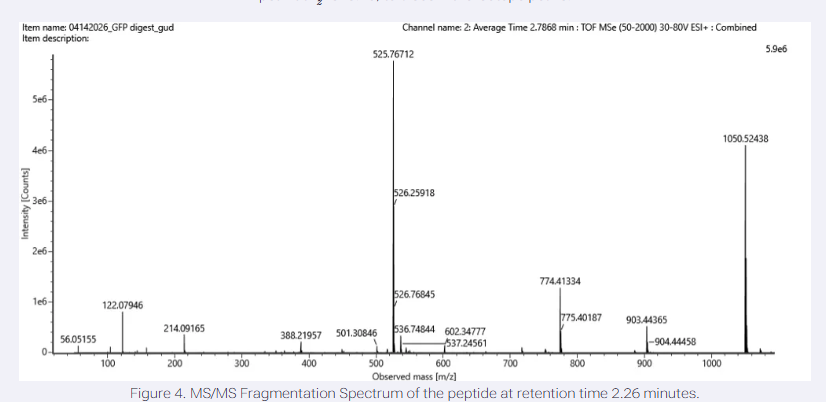
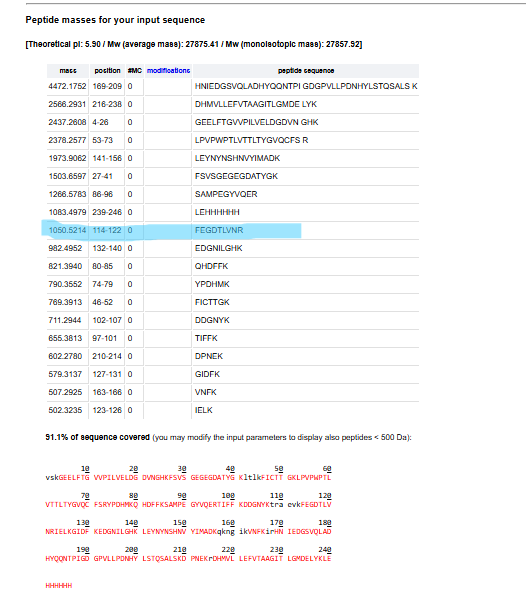
5.Identify the mass-to-charge (m/z) of the peptide shown in Figure 5b. What is the charge (z) of the most abundant charge state of the peptide (use the separation of the isotopes to determine the charge state). Calculate the mass of the singly charged form of the peptide based on its m/z and z ([M+H]+).
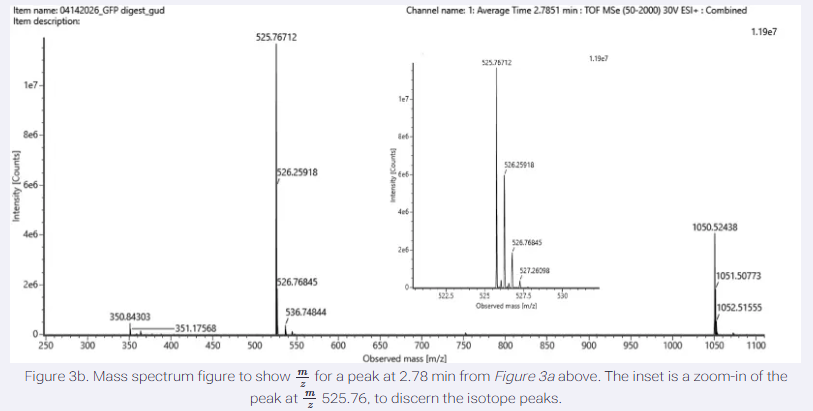
The most abundant peak in Figure 5b (GFP digest spectrum) is at m/z 525.76712, representing the monoisotopic m/z of the peptide’s most abundant charge state.
From the zoomed-in inset in the image, the m/z values of two adjacent major isotopic peaks are approximately 525.76712 and 526.25918.
The difference between these values is 526.25918-525.76712 = 0.492
1. Charge State ($z$) Determination:
$$\Delta m/z = 0.492$$
$$z = \frac{1}{0.492} \approx 2.03 \rightarrow z = 2+$$
2. Mass-to-Charge Relation Formula:
$$\frac{m}{z} = \frac{M + z \cdot \text{H}^+}{z}$$
3. Substituting Values ($m/z = 525.767$, $z = 2$, $\text{H}^+ = 1.0078\text{ Da}$):
$$525.767 = \frac{M + 2(1.0078)}{2}$$
$$M + 2.0156 = 2 \times 525.767$$
$$M + 2.0156 = 1051.534$$
$$M = 1051.534 - 2.0156$$
Final Neutral Mass:
$$M = 1049.5184\text{ Da}$$
6.Identify the peptide based on comparison to expected masses in the PeptideMass tool. What is mass accuracy of measurement?
Formula:
$$\text{Mass Accuracy (ppm)} = \frac{m_{\text{exp}} - m_{\text{theor}}}{m_{\text{theor}}} \times 10^{6}$$
Substituting Values:
- $\text{MW}_{\text{experiment}} = 1050.52438\text{ Da}$
- $\text{MW}_{\text{theory}} = 1050.5214\text{ Da}$
$$\text{Accuracy} = \frac{1050.52438 - 1050.5214}{1050.5214} \times 10^6$$
$$\text{Accuracy} = \frac{0.00298}{1050.5214} \times 10^6 \approx 2.84\text{ ppm}$$
7.What is the percentage of the sequence that is confirmed by peptide mapping (Figure 6)?
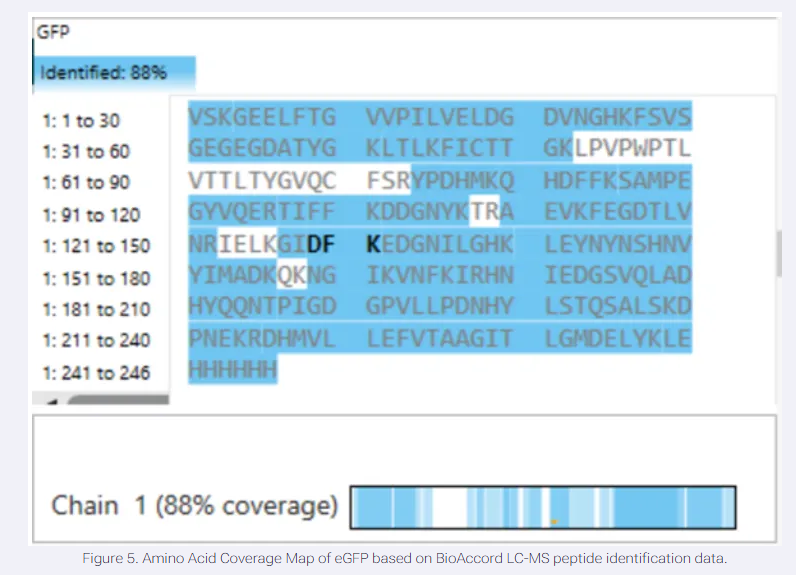
The image shows a peptide mapping result for GFP (Chain 1), explicitly labeling the identified sequence coverage as 88%.
Bonus Questions
8.Can you determine the peptide sequence for the peptide fragmentation spectrum shown in Figure 5c? (HINT: Use your results from Question 2 above to match the peptide molecular weight that is closest to that shown in Figure 5b. Copy and paste its sequence into this tool online to predict the fragmentation pattern based on its amino acid sequence: http://db.systemsbiology.net/proteomicsToolkit/FragIonServlet.html.
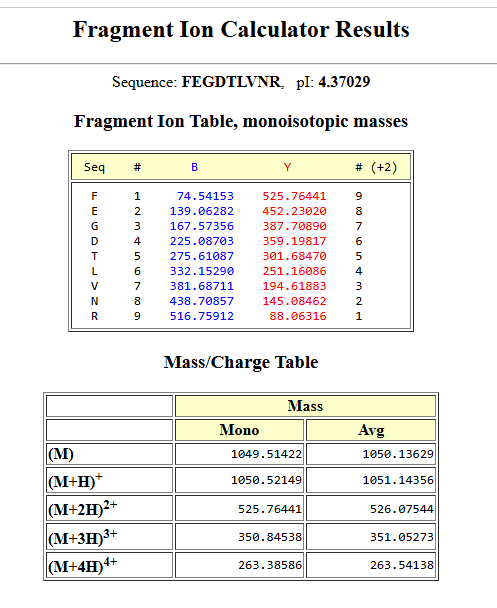
What is the sequence of the eGFP peptide that best matches the MS/MS fragmentation spectrum in Figure 5c?
9.Do the Peptide Map data make sense and do the results indicate the protein is the eGFP standard? Why or why not? Consult with Figure 6, showing the % amino acid coverage of peptides positively identified by their calculated mass and fragmentation pattern.
The results make sense because they are from the fragments of GFP protein as they map to different protions of GFP sequence and it identified 88%.The rest of the sequences were not properly digested probably. There could be presence of post translational modifications that interfered with the expected mass and could not be matched with theoretical sequence.
Homework: Waters Part 4 — Oligomers
We will determine Keyhole Limpet Hemocyanin (KLH)’s oligomeric states using charge detection mass spectrometry (CDMS). CDMS single-particle measurements of KLH allow us to make direct mass measurements to determine what oligomeric states (that is, how many protein subunits combine) are present in solution. Using the known masses of the polypeptide subunits (Table 1) for KLH, identify where the following oligomeric species are on the spectrum shown below from the CDMS (Figure 7):
7FU Decamer 8FU Didecamer 8FU 3-Decamer 8FU 4-Decamer
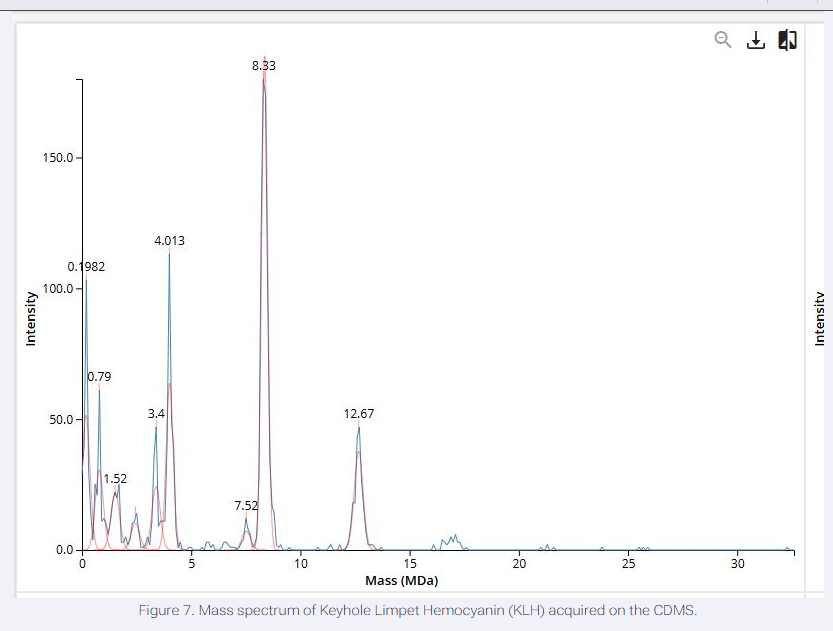
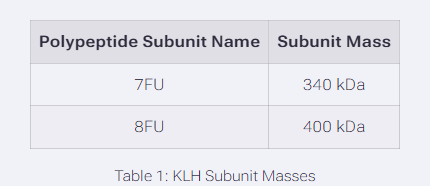
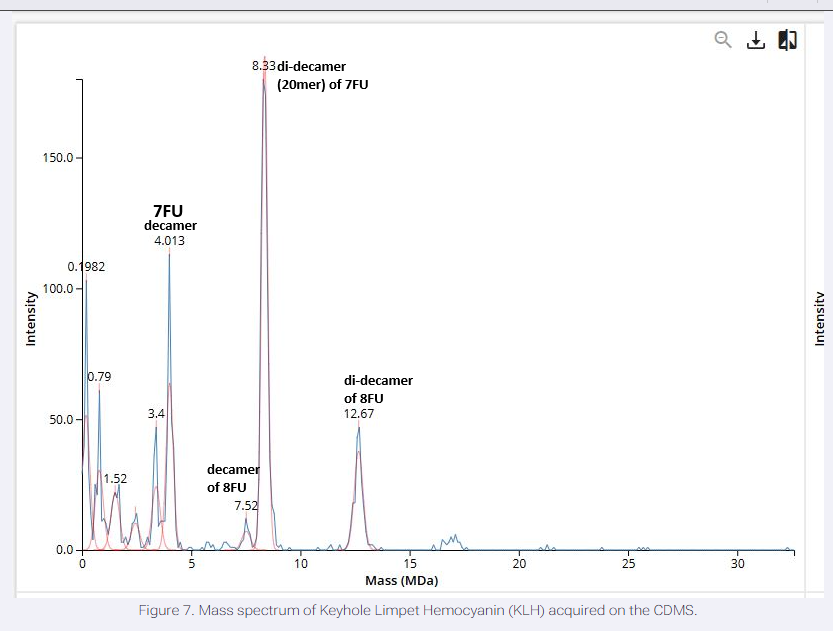
Oligomer Identifications The peak at ~4.01 MDa corresponds to a decamer of 7FU subunits (10 × 340 kDa = 3.4 MDa; observed shift due to glycosylation/adducts common in CDMS).
The peak at ~7.52 MDa aligns with a decamer of 8FU subunits (10 × 400 kDa = 4 MDa; higher oligomers or mixtures may shift observed mass).
The peak at ~8.33 MDa likely represents a di-decamer (20mer) of 7FU (20 × 340 kDa ≈ 6.8 MDa; adducted/glycosylated).
The peak at ~12.67 MDa corresponds to a di-decamer of 8FU (20 × 400 kDa = 8 MDa; further adducted) or larger assemblies.
Smaller peaks (e.g., ~3.4 MDa, ~0.98 MDa) may indicate monomers or fragments, but primary oligomeric species match decameric and didecameric forms typical of KLH
Homework: Waters Part 5 — Did I make GFP?
References
1.https://web.expasy.org/compute_pi/- for molecular weight calculation.
2.“Measurement technologies” prompt. Claude, version used (e.g., Claude 3.5 Sonnet version), Anthropic, Date accessed (e.g., 22 May 2026), claude.ai.
3.http://db.systemsbiology.net/proteomicsToolkit/FragIonServlet.html calculating fragmentation ion.
4.Benchling [Biology Software]. (2026). count the number of lysines and arginines in the protein