Principles and practices 💼 1. First, describe a biological engineering application or tool you want to develop and why. This could be inspired by an idea for your HTGAA class project and/or something for which you are already doing in your research, or something you are just curious about. Purification of enzymes for natural pigment synthesis facilitated by microalgal cell wall release
DNA read, write, and edit 🧬 Part 1: Benchling and in-silico gel art The genome of the λ-phage was imported and virtually digested with the following restriction endonucleases: EcoRI, HindIII, BamHI, KpnI, EcoRV, SacI, and SalI before being visualized on Benchling’s agarose gel simulator (Figure 2.1).
Lab automation 🦾 Python script for Opentrons artwork Generate an artistic design using Ronan’s GUI. Using the coordinates from the GUI, follow the instructions in the HTGAA26 Opentrons Colab to write your own Python script, which draws your design using the Opentrons. You may use AI assistance for this coding — Google Gemini is integrated into Colab (see the stylized star bottom center); it will do a good job writing functional Python, while you probably need to take charge of the art concept. If you use AI to help complete this homework or lab, document how you used AI and which models made contributions. Consistent with this week’s highly automated and digitized theme, for this assignment, I drew inspiration from an image popularized by the Internet, KC Green’s web comic strip “On Fire”, which, in 2014, became a famous -and my personal favorite- online meme (Figure 3.1). As many other people from all over the world, I deeply relate to this meme, which, I feel, accurately describes my life.
Protein design-Part I 💻 Part 1: Conceptual questions Answer any nine of the following questions from Shuguang Zhang: (i.e. you can select two to skip) How many molecules of amino acids do you take with a piece of 500 grams of meat? (On average, an amino acid is ~100 Daltons.) Depending on the type of meat, as well as the manner it is processed prior to consumption, 500g of meat contain approximately 100 - 130g of protein. Assuming that this protein consists entirely of amino acids (meaning, excluding metal ions, such as iron or zinc, which can be found bound to protein molecules, or glycans and other moieties added to proteins through post-translational modifications), then 100-130g of amino acids = 6.02 - 7.83x1025Da approximately. Therefore, if the molecular weight of one amino acid is on average ~100Da, then 500g of meat contain (6.02 - 7.83x1025Da)/100Da = 6.02 - 7.83x10²³ amino acid molecules.
Protein design-Part II 💻 Part 1: SOD1 binder peptide design Superoxide dismutase 1 (SOD1) is a cytosolic antioxidant enzyme that converts superoxide radicals into hydrogen peroxide and oxygen. In its native state, it forms a stable homodimer and binds copper and zinc.
Genetic circuits-Part I: Assembly technologies 🧩 DNA Assembly Answer these questions about the protocol in this week’s lab: 1. What are some components in the Phusion High-Fidelity PCR Master Mix and what is their purpose? The components in the Phusion High-Fidelity PCR Master Mix, along with their purpose, are the following:
Genetic circuits-Part II: Neuromorphic circuits and fungal biomaterials ⚙️ Part 1: Intracellular artificial neural networks (IANNs) 🧠 1. What advantages do IANNs have over traditional genetic circuits, whose input/output behaviors are Boolean functions? IANNs offer several advantages over traditional genetic circuits, which are governed by Boolean logic, as they can integrate multiple inputs simultaneously to produce an output. Similar to biological brains, they can process information in a more adaptive manner, as they are capable of learning from cellular environments that constantly change, thus responding faster to fluctuations in their surroundings than conventional gene-regulation systems 1. Another one of their advantages is that they significantly improve decision-making accuracy inside cells by reducing noise in gene expression 2. This way, they also enable more complex computational tasks within living cells, in turn allowing the design of highly sophisticated cellular behaviors 3. This degree of scalability and control, along with their versatility, renders IANNs particularly well-suited for numerous applications in Synthetic Biology, especially in targeted therapies and personalized medicine, where the level of fine-tuning and precision that can be achieved with a genetic circuit plays a tremendously important role 2 3.
Cell-free systems 🧪 General homework questions 1. Explain the main advantages of cell-free protein synthesis over traditional in vivo methods, specifically in terms of flexibility and control over experimental variables. Name at least two cases where cell-free expression is more beneficial than cell production. Compared to conventional in vivo methods, cell-free protein synthesis provides modularity and substantially higher experimental control, as all the system’s components can be readily added or removed, especially when the strategy employed is to separately produce or extract each cellular element required for the process and then combine them all together into a single reaction. Cell-free systems also offer the potential for precise control over reaction conditions, such as pH and ion concentration, while being more flexible and versatile since they allow the expression of proteins deleterious to living cells, support the integration of non-natural and non-canonical amino acids into peptide backbones, and are compatible with diverse DNA templates (linear or plasmid). Additionally, they eliminate constraints imposed by the existence of living cells. For instance, unlike traditional cell cultures, they do not need any monitoring, cultivating, or other interventions aimed at preservation, nor are they susceptible to issues of cell viability, growth limits, or stress responses. Similarly, since the cell-free apparatus exists outside of the context of a cellular platform, there are no cell-membrane barriers, facilitating access to biochemical reactions, while, at the same time, there is no interference or competition from other metabolic procedures or regulatory signals, enabling all the available resources to be channeled towards the synthesis of the desired protein, which, in addition, can later be purified more easily, without impurities. The absence of living cells can be translated into abolishing the need for cloning and cellular transformation as well, which, in turn, ensures safer handling, as no genetically modified organisms are involved in cell-free protein production. More generally, one of the method’s most significant advantages is that it is a highly efficient technique for rapid protein synthesis that can also withstand being transferred across larger distances for longer periods of time, as the entire system can be easily freeze-dried and stored for later use 1.
Advanced imaging and measurement technology 🎞️ For your final project: Please identify at least one (ideally many) aspect(s) of your project that you will measure. It could be the mass or sequence of a protein, the presence, absence, or quantity of a biomarker, etc. Please describe all of the elements you would like to measure, and furthermore describe how you will perform these measurements. What are the technologies you will use (e.g., gel electrophoresis, DNA sequencing, mass spectrometry, etc.)? Describe in detail. My final individual project revolves around developing a lichen-based building coating that is prompted to change its color by the conditions of its environment as a means of passive heat acclimation. The biomaterial can assume two different colorations, a lighter one for hot sunny days and a darker one for days when the weather is cold and cloudy. The two colorations are mediated by two different compounds, namely the protein reflectin and the pigment eumelanin respectively. As engineering a lichen is quite challenging, especially when taking into consideration the very short time frame of the course, for my first experimental aim, I intend to design a genetic circuit that will emulate the color-changing effect of the lichen construct, although, adapted for expression in E. coli, which is simpler and easier to genetically manipulate, as proof-of-concept. After inducing the synthesis of reflectin and melanin in the bacterial system, I would like to test the responsivity and functionality of the color-shifting circuit first with a simple spectrophotometric measurement, which should be feasible given that reflectin is highly reflective when interacting with visible light, whereas eumelanin is highly absorbant. As a semi-quantitative method, I could also visualize the expression of reflectin and MelC2, an essential enzyme for the biosynthesis of eumelanin, by running an SDS-PAGE protein electrophoresis and, subsequently, Western blotting. To this end, I have attached a C-terminal tag to both proteins, more specifically a 6x-His tag to reflectin and a FLAG tag to MelC2, which will allow me to use anti-His and anti-FLAG antibodies to examine the expression of each protein in the Western blot. Alternatively, for a more precise quantification, I could purify the proteins and analyze them through mass spectrometry. This way, I could obtain both measurements about each protein’s level of expression, but also useful data both their respective sequences to verify that the proteins are synthesized as anticipated in my system. Another advantage of mass spectrometry-facilitated analysis is that, unlike SDS-PAGE and Western blots, it can be utilized to investigate other biomolecules too. Therefore, instead of indirectly quantifying eumelanin production through measurement of MelC2 expression, directly monitoring how much eumelanin has been generated would be possible. Going a step back, before the induction of protein expression, I would like to have already sequenced my final assembled DNA constructs, to validate that the plasmids constructed in the lab harbor the same sequence as the ones theoretically designed and display the anticipated functions. Lastly, apart from sequencing the plasmids before the bacterial transformation, it is prudent to do the same with colonies identified as positive transformants through the selection process by extracting their plasmids and isolating the insert containing the genetic cassette(s) responsible for the different colorations. The isolation of the insert can be easily achieved either by performing a strategic restriction digestion or, in case the plasmid lacks restriction sites, by amplifying the insert through PCR and, subsequently, visualizing the result of the reaction with an agarose gel electrophoresis in both scenarios.
Bioproduction and cloud labs 🥼 Part A: The 1,536 Pixel Artwork Canvas | Collective artwork Contribute at least one pixel to the global artwork experiment before the editing ends on Sunday 19/04 at 11.59pm EST. A personalized URL was sent to the email address associated with your Discourse account, and you can discuss the artwork on the Discourse. Make a note on your HTGAA webpages including: what you contributed to the community bioart project (e.g., “I made part of the DNA on the bottom right plate”) what you liked about the project, and what about this collaborative art experiment could be made better for next year. What survived of my main contributions to the bioart project are initiating and adding several pixels in the DNA double helix positioned in the left part of the bottom right plate. I also painted some of the Electra2 blue pixels in the background of the same plate (Figure 11.1).
Subsections of Homework
Week 1 homework
Principles and practices 💼
1. First, describe a biological engineering application or tool you want to develop and why. This could be inspired by an idea for your HTGAA class project and/or something for which you are already doing in your research, or something you are just curious about.
Purification of enzymes for natural pigment synthesis facilitated by microalgal cell wall release
In recent decades, microalgae have emerged as promising platforms for the sustainable biosynthesis of various high-value compounds 12, however, during their purification, challenges can arise. This project aims to propose a method of metabolite purification from microalgal cultures by tapping into a largely overlooked resource of microalgal cells of various species, namely their cell wall. Purification of proteins of interest could be carried out by fusing them to elements of the microalgal cell wall and then harvesting the shedded cell walls following nitrogen starvation-induced sexual reproduction, as this method is inspired by the ecdysis of insects. Theoretically, this method of purification could be implemented for any fused proteins, but here, for a more tangible example stemming from an interest in the production of eco-friendly ink, the idea described below will focus on the synthesis of indigoidine synthetase, the primary enzyme implicated in the generation of the indigo dye.
The organism chosen for the purposes of this project is the model green microalga Chlamydomonas reinhardtii, as its physiology and metabolism have been extensively studied 345, while multiple tools have already been developed and established for its genetic manipulation 678. In more detail, the first step of this process should be to engineer C. reinhardtii910 to overexpress pherophorin (microlgal cell wall protein)-indigoidine synthetase fusion proteins (Figure 1.1A). Subsequently, gamete generation can be induced by depleting the nitrogen in the growth medium, leading to mating of haploid microalgal cells followed by shedding of their cell walls (Figure 1.1B). The rejected cell wall components can then be isolated by sucrose-gradient centrifugation (Figure 1.1C), before being subjected to enzymatic processing both for polysaccharide degradation and for separation of indigoidine synthetase molecules from pherophorins (Figure 1.1D). Lastly, affinity chromatography can be employed for further purification of the synthesized indigoidine synthetase units (Figure 1.1E), which can afterwards be screened in an activity assay (Figure 1.1F) to monitor the enzymatic conversion of L-glutamate into indigoidine (indigo dye).
Figure 1.1 Schematic overview of cell wall release-based purification of indigoidine synthetase. Figure modified from Sekimoto, 2017 11 and partially created on BioRender.com.
2. Next, describe one or more governance/policy goals related to ensuring that this application or tool contributes to an “ethical” future, like ensuring non-malfeasance (preventing harm). Break big goals down into two or more specific sub-goals. Below is one example framework (developed in the context of synthetic genomics) you can choose to use or adapt, or you can develop your own. The example was developed to consider policy goals of ensuring safety and security, alongside other goals, like promoting constructive uses, but you could propose other goals for example, those relating to equity or autonomy.
The primary policy behind this project is sustainability, as microalgae require minimal resources to efficiently synthesize numerous valuable compounds utilized in human food and animal feed, in pharmaceuticals and cosmetics, and even in the energy sector with the production of biofuels through photosynthesis-driven carbon sequestration. Besides their role as promising green cell factories and a potential carbon sink, microalgae, and in turn projects revolving around them, contribute to sustainability by offering great spatial autonomy in terms of their cultivation, as they are not confined by the availability of arable land or freshwater-based irrigation. From a performance aspect, microalgae have been advocated for their high photosynthetic capacity too, enabling them to generate biomass more efficiently than most crops. Taking all the aforementioned benefits into consideration, another principle emerges, as microalgal cultivation gives equal opportunities for development both to established facilities, but most importantly, to low-income communities and developing countries, including small island nations. Culturing of microalgae merely requires exposing them to light and letting them fixate atmospheric inorganic carbon and has become even more affordable with the introduction of the plastic tubular photobioreactor 12, which also allows for the exploitation of otherwise unutilized vertical space.
3. Next, describe at least three different potential governance “actions” by considering the four aspects below (Purpose, Design, Assumptions, Risks of Failure & “Success”). Try to outline a mix of actions (e.g. a new requirement/rule, incentive, or technical strategy) pursued by different “actors” (e.g. academic researchers, companies, federal regulators, law enforcement, etc). Draw upon your existing knowledge and a little additional digging, and feel free to use analogies to other domains (e.g. 3D printing, drones, financial systems, etc.).
Purpose: What is done now and what changes are you proposing?
Design: What is needed to make it “work”? (including the actor(s) involved - who must opt-in, fund, approve, or implement, etc)
Assumptions: What could you have wrong (incorrect assumptions, uncertainties)?
Risks of Failure & “Success”: How might this fail, including any unintended consequences of the “success” of your proposed actions?
Option 1. Initiative to establish a teaching module on biosafety and biosecurity in high school Biology classes, with lectures from Biotechnology experts and academics of the local university or from iGEM teams that are active in the area. Raising awareness for biosafety and biosecurity issues as early as in high school years will ensure that future generations of researchers have the necessary stimuli to pursue good scientific practices. This initiative can also help high school students gain an overview both of the academic research being concucted at local universities, along with the regulatory frameworks defining that research, especially when that happens through the lens of an aspiring young scientist closer to their age, such as a university student member of a local iGEM team. In case of a smaller town or village without a university, lectures from invited experts coming from larger cities could be arranged, perhaps with the help and support of the Ministry of Education, which could even twin schools in rural areas with metropolitan universities.
Option 2. Enforcement of regular inspections from EU representatives to ensure that Biotechnology-focused academic, research, and industrial facilities adhere to imposed regulations. Surprisingly, there is no official EU institution, board, or committee primarily devoted to matters of biosafety and biosecurity, so pushing for the establishment of one should be a priority at this stage. In any case, laws that require regular inspections of biotechnological facilities even by experts appointed by the local government should be imposed. Close monitoring of academic and industrial facilities to verify that, for instance, HEPA filters are renewed and biohazardous waste is handled appropriately, is paramount and heavy fines should be issued in case of non-compliance.
Option 3. Increased funding of programs dedicated to designing and integrating novel kill-switches and other biocontainment mechanisms to expand the arsenal of available strategies both for a wider range of projects/conditions but also for a wider range of genetically modified organisms. This could be an action to promote innovative research in the field of biosecurity. By diverting resources or even creating new programs to fund research into novel biocontainment approaches at an EU (for example, the Marie-Skłodowska-Curie grants) or at a national level, more scientists could be encouraged to engage in discovering or devising cutting-edge kill-switch mechanisms 13141516 (Figure 1.2B), genetic safeguards or firewalls for preventing horizontal gene transfer, and auxotrophic strains 17 (Figure 1.2A). Hopefully, such an initiative could contribute to expanding the research and use of biocontainment not only to bacteria and yeast, for which the field of biosecurity is already established to a significant degree, but also to less widespread biotechnological hosts, such as microalgae, whose kill-switch and auxotrophy strategies are currently far less advanced.
Figure 1.2 Proposed biocontainment strategies for genetically engineered microalgae. (A) A promising biocontainment method involves the development of auxotrophic strains, such as microalgae that can solely survive on a non-standard source of P, for example, phosphite 17. (B) Kill-switch mechanism employing a light-controlled riboregulator. The main premise behind this circuit is that genetically engineered microalgae are primarily cultured in well-illuminated ponds. In this case, the light-inducible pLIP promoter from Dunaliella sp.13 drives the expression of a trigger RNA molecule (trRNA) that, through binding to a three-way junction riboregulator 1415 at the 5’ UTR of NucA nuclease’s coding sequence, suppresses the gene’s expression. However, if the engineered microalgae accidentally end up in an underground aquifer or inside another organism after ingestion, the dark conditions will reveal an integrated internal ribosome entry site (IRES), enabling the nuclease’s expression 16 and, effectively, exterminating the microalgal cell. Figure from Motomura et al., 2018 17 and partially created on BioRender.com.
4. Next, score (from 1-3 with, 1 as the best, or n/a) each of your governance actions against your rubric of policy goals. The following is one framework but feel free to make your own.
Adhering to the suggested format, the scores of the proposed governance actions are presented below (Table 1.1).
Table 1.1 Scores of the proposed governance measures with respect to the rubric of policy goals.
Does the option:
Option 1
Option 2
Option 3
Enhance Biosecurity
• By preventing incidents
1
2
1
• By helping respond
2
3
3
Foster Lab Safety
• By preventing incident
1
2
2
• By helping respond
1
3
2
Protect the environment
• By preventing incidents
2
2
1
• By helping respond
2
3
3
Other considerations
• Minimizing costs and burdens to stakeholders
n/a
1
n/a
• Feasibility?
1
2
2
• Not impede research
1
2
1
• Promote constructive applications
1
3
1
5. Last, drawing upon this scoring, describe which governance option, or combination of options, you would prioritize, and why. Outline any trade-offs you considered as well as assumptions and uncertainties. For this, you can choose one or more relevant audiences for your recommendation, which could range from the very local (e.g. to MIT leadership or Cambridge Mayoral Office) to the national (e.g. to President Biden or the head of a Federal Agency) to the international (e.g. to the United Nations Office of the Secretary-General, or the leadership of a multinational firm or industry consortia). These could also be one of the “actor” groups in your matrix. Reflecting on what you learned and did in class this week, outline any ethical concerns that arose, especially any that were new to you. Then propose any governance actions you think might be appropriate to address those issues. This should be included on your class page for this week.
Among the three actions listed above, the least feasible one would be the enforcement of regular inspections by an EU board devoted to addressing biosafety and biosecurity issues. Since such an institution does not exist right now, its establishment would require time and a large bureaucratic, as well as administrative and legislative mobilization, implicating several bodies of the EU, including the European Council and the European Commission.
On the other hand, the other two initiatives, namely integrating modules about biosafety and biosecurity in high school curricula and increasing funding for research on biocontainment practices, appear more feasible and promising in the short term and should, therefore, be prioritized. The basic rationale behind this prioritization is that, judging from personal experience, the educational community, including secondary and higher education, has always been more open-minded and welcoming towards new initiatives compared to legislative bodies and political agents. As educational institutions, regardless of level, have always been united by ideals such as service to humanity and a strong drive towards innovation and intellectual progress, it is generally much easier and faster to put internal actions for institutional twinning and raising awareness about biosafety and biosecurity in motion, mostly concerning the first option. Another benefit of prioritizing the initiative presented in the first option would be providing the opportunity to promote other principles alongside biosafety and biosecurity to younger audiences too, for instance, sustainability and equity as previously mentioned. Regarding the third option, increasing funding for relevant strategies internally appears more feasible as well, since in many cases, research groups and laboratories are given substantial flexibility in terms of allocating resources to individual projects from national grants that do not specify a particular objective. In the long run, both options one and three could have a significantly positive influence in establising more fundamental and impactful governance policies in the future, as they incorporate a more “bottom-up” approach, where members of the general public that have become more aware of the aforementioned principles, school students, university students, and academics, can start building an initial framework. This will lay the foundation for more radical reforms, as more citizens become aware of biosafety, sustainability, and equity issues and push (through voting and other sociopolitical manifestations) for more generalized changes and a renewal of governance policies.
Preparation for week 2 lecture 🔎
Homework Questions from Prof. Jacobson
1. Nature’s machinery for copying DNA is called polymerase. What is the error rate of polymerase? How does this compare to the length of the human genome? How does biology deal with that discrepancy?
The primary polymerases for nuclear genome replication in human cells are DNA polymerases δ (delta) and ε (epsilon) 181920. Purely based on their replicase activity, they display an error rate of 10-4 to 10-5 per base pair per replication cycle. Given that the entire haploid human genome spans approximately 3.3×10⁹bp, it can be calculated that, in every replication cycle, (3.3×10⁹bp) × 10-4 = 3.3×10⁵bp can be erroneous in a worst-case scenario.
However, DNA polymerases δ and ε have evolved to have a 3’ to 5’ proofreading exonuclease activity, meaning that they can recognize and correct misplaced nucleotides based on strand complementarity by “going in reverse”, excising, and replacing them 181920. It has been shown that, due to their proofreading capacity, those polymerases exhibit extremely low error rates, estimated at less than 10-9 per base pair per replication cycle 20, which, according to the calculation above, can be translated into approximately 3.3 errors for every replication. Except for the polymerases’ proofreading capacity, cells also possess mismatch repair (MMR) mechanisms that correct mistakes in DNA replication missed by the polymerases 20. In case all the previously mentioned systems fail, there are cell cycle checkpoints in place, which will not allow cellular division to proceed if mistakes in DNA replication persist.
Another factor that contributes to a lower rate of mutations in the “final product” of the genome, namely the proteins, is that protein-coding genes constitute about 1% of the entire genome, as they are “diluted” due to what has been called “junk DNA”. Because of this “dilution” effect, it seems far more likely that, even if an error occurs, it will be located in a non-coding region of the genome. Although this could influence the regulation of expression, it will not affect the final amino acid sequence of the protein of interest. To this end, namely the preservation of a protein’s primary structure, the genetic code has also evolved to be degenerate. The degeneracy of the genetic code, meaning the redundancy where multiple, distinct codons (nucleotide triplet combinations) encode for the same single amino acid, allows for increased flexibility in protein expression. Therefore, even if an error occurs within a coding region, the mutated codon can still be translated into the correct amino acid. Finally, as a fail-safe on the protein level, in case a replication error results in a mutated codon that corresponds to a different amino acid, the tertiary structure, as well as the functionality of the final protein, could still be preserved, if the altered amino acid demonstrates the same or very similar biochemical properties as the original one (for instance, aspartic acid and glutamic acid).
2. How many different ways are there to code (DNA nucleotide code) for an average human protein? In practice, what are some of the reasons that all of these different codes do not work to code for the protein of interest?
Each of the 20 standard amino acids can be represented by one to six different codons, with a three-codon representation in the genetic code on average. The coding sequence for an average human protein is 1,036bp long, meaning that an average human protein consists of approximately 1,036 / 3 = 345 amino acids. Based on this information, an average human protein could be translated from about 3345 = 4×10164 different codon combinations.
Although this is a valid theoretical assumption, in reality, every organism, including humans, does not show such flexibility in the coding sequences of its genome due to codon biases, as well as the genome’s GC content. Codon biases mostly relate to the actual availability of aminoacyl-tRNA synthetases and aminoacyl-tRNAs corresponding to every amino acid inside the cell, as aminoacyl-tRNAs are heavily involved in protein synthesis and their availability substantially affects the rate and the eventual success of the overall process. Specific codon usage databases (also known as “Kazusa tables”) have been composed based on studies of different organisms’ codon usages and biases 2122. When synthesizing an artificial coding sequence for the expression of a human protein, the GC content of the genome needs to be taken into consideration too, as large variations can lead to silencing effects. Another factor that can drastically diminish the number of functional combinations for a protein’s coding sequence are the respective mRNA’s thermodynamic properties. Different combinations of codons, hence nucleotidic triplets, can facilitate the formation of secondary structures, such as hairpins, in a transcript, which can delay or even hinder translation. The selected codon sequence should, therefore, produce an mRNA with the appropriate thermodynamic profile for optimal protein expression. Finally, more limitations can be posed by the synthesis method in case the coding sequence has to be artificially assembled, as DNA molecules with low GC content and a low percentage of repeated sequences are preferred. Additionally, if the artificially synthesized gene also needs to contain introns that stabilize or enhance transcription, selection of a codon combination should ensure the presence of positions where introns can be inserted, for instance, GGs at determined intervals or spots.
Homework Questions from Dr. LeProust
1. What’s the most commonly used method for oligo synthesis currently?
Currently, the most established and widely used method for oligonucleotide synthesis is the solid-phase phosphoramidite (S-PP) method. This constitutes a type of chemical synthesis that utilizes a solid-phase material, typically controlled pore glass or microporous polystyrene, as a platform where oligonucleotides are added in a 3’ to 5’ direction. S-PP synthesis can be highly automated, enabling high-throughput production of oligonucleotides in 96- and 384-well plates.
The basic principle behind S-PP synthesis can be summarized as exposing biochemical groups that should react while simultaneously protecting groups that should not react. To this end, specifically modified nucleotides, called phosphoramidite monomers, which have their reactive groups “concealed”, need to be used. In particular, to prevent the reactive groups of the monomers from forming undesirable bonds during the process, their nitrogenous bases are protected by a benzoyl or isobutyryl moiety (Figure 1.3A, pink), their 3’-OH by a 2-cyanoethyl-diisopropylamino moiety (Figure 1.3A, purple, orange, and yellow), and their 5’-OH by a dimethoxytrityl (DMT) moiety (Figure 1.3A, green). In the case of RNA oligonucleotide synthesis, the highly reactive 2’-OH has to be “concealed” by a ter-butyldimethylsilyl moiety as well.
In more detail, the method consists of a cyclic four-step process that allows the assembly of the oligonucleotide chain by starting with a first monomer that has already been covalently attached to the synthesis platform and then elongating it one nucleotide at a time (Figure 1.3B):
Step 1. Detritilation The 5′-DMT protecting group is removed by lowering the pH of the reaction, thus exposing the 5′-OH.
Step 2. Coupling The incoming phosphoramidite monomer is added in a substantially high concentration and its phosphoramidite moiety “attacks” the now exposed 5′-OH (usually in the presence of an azole catalyst) to form a phosphite triester bond, ultimately linking the new monomer to the growing oligonucleotide. During this step, the diisopropylamino group is cleaved as well.
Step 3. Capping Unreacted 5′-OH groups are capped through acetylation to avoid the formation of oligonucleotides with the wrong sequence.
Step 4. Oxidation The unstable phosphite triester is oxidized into a stable phosphate triester bond.
Once the last cycle of the process is completed, the synthesized oligonucleotide is excised from the solid-phase platform by the implementation of alkaline conditions. This increase in pH will also cause the detachment of the 2-cyanoethyl groups, as well as of the nitrogenous bases’ protective moieties, from all the building blocks of the nucleotide, essentially rendering the newly synthesized oligonucleotide biochemically suitable for downstream applications 232425.
2. Why is it difficult to make oligos longer than 200nt via direct synthesis? Why can 2000bp genes not be made via direct oligo synthesis?
Generating oligonucleotides via direct chemical synthesis, such as the S-PP method, presents challenges due to cumulative inefficiencies in the building process. These inefficiencies ultimately lead to a drastic decrease in the yield and purity of the final product as, for several factors analyzed below, the latter drop exponentially with the increasing length of the desired oligonucleotide.
One such factor appears to be cumulative yield loss. While S-PP synthesis is highly efficient (>99% per step), this discrepancy from 100% increases exponentially as the chain grows. Given that the addition of every new phosphoramidite monomer probabilistically constitutes an independent event from previous additions and by assuming a coupling efficiency of 99%, the yield of a 100-mer is approximately 0.99100 = 36.6%, while the yield of a 200nt oligonucleotide amounts to an even lower percentage, 0.99200 = 13.4%. Accordingly, the yield of a 2,000nt sequence is practically 0, since 0.992,000 = 18.6×10⁻⁹%.
Another shortcoming stems from the accumulation of truncated sequences, which can occur at any stage of the assembly due to incomplete coupling. Those shorter oligonucleotides (also called “failure sequences”) accumulate as impurities in the pool of S-PP synthesized oligonucleotides. As the elongation advances, the length difference between the desired full-length product and the truncated oligonucleotide becomes negligible. For instance, the two nucleotides that differentiate a truncated 198-mer from the desired 200-mer correspond to a 1% discrepancy, however, in the case of a 1,198nt truncated oligonucleotide and the desired 2,000-mer, the discrepancy is 0.1%. Due to resolution constraints of high-performance liquid chromatography (HPLC) or polyacrylamide gel electrophoresis (PAGE), which are employed to separate the desired products from truncated entities, isolating the desired oligonucleotide (especially in the case of the 2,000-mer) proves to be extremely difficult, negatively impacting the purity of the final product.
Lastly, the physical properties of the support platform, as well as the biochemistry of the oligonucleotides themselves, can post limitations to the synthesis, which intensify with the increasing length of the desired oligonucleotide. More specifically, when CPG beads are used as a support matrix, their pores can become clogged as the oligonucleotide chain grows longer, ultimately hindering the diffusion of reagents to the reactive 5’-OH group and reducing coupling efficiency. Similarly, repeated cycles of detritilation under acidic conditions can induce depurination (chemical degradation and loss of purine bases). Depurination can accumulate over 200 cycles and even reach concerningly high levels at 2,000 cycles, leading to damaged, fragmented, or incorrect sequences.
Homework Questions from Prof. Church
3. Given the one paragraph abstracts for these real 2026 grant programs sketch a response to one of them or devise one of your own:
For the generative optogenetics program, an approach could be to design and express a light-activated polymerase that has a “pinwheel” structure/shape and works the way a danish Christmas star is folded/woven (Figure 1.4A,B, and C). More specifically, the polymerase would have four arms (one for each of the standard DNA nucleotides) that are activated by a specific wavelength. For the light activation element, domains from different opsins can be incorporated into the molecule, which would cause conformational changes in the appropriate arm resulting in its bending towards the central cavity where the nascent oligonucleotide is anchored (Figure 1.4D). Recruitment of the right nucleotide could be facilitated by selective affinity through specific amino acid interactions, while each arm should retain the properties of a polymerase to also form phosphodiester bonds. For an initial DNA fragment, which is normally needed for enzymatic DNA amplification, a poly-A tail (such as the one mature eukaryotic trnascripts have attached in their 3’ end) could be employed, which can be cleaved after synthesis of the desired oligonucletide is completed. This approach can, theoretically, be easily automated and scaled up by utilizing a 96-well Light Plate Apparatus (LPA) or it can be enhanced with the addition of more arms to integrate non-standard nucleotides as well, such as pseudouridine and inosine, for different applications. 1
Figure 1.4 (A) and (B) Photographs of folding/weaving a danish Christmas star, which can be seen finished in (C). (D) Schematic representation of the “pinwheel” polymerase, whose arms bend and add a particular nucleotide upon activation with a specific wavelength. Figure from How to make a danish Christmas star, the Bureau of Betterment, and partially created on BioRender.com.
Fabris M, Abbriano RM, Pernice M, et al. Emerging Technologies in Algal Biotechnology: Toward the Establishment of a Sustainable, Algae-Based Bioeconomy. Front Plant Sci. 2020;11:279. doi:10.3389/fpls.2020.00279 ↩︎↩︎
Brodie J, Chan CX, De Clerck O, et al. The Algal Revolution. Trends Plant Sci. 2017;22(8):726-738. doi:10.1016/j.tplants.2017.05.005 ↩︎
Johnson X, Alric J. Central carbon metabolism and electron transport in Chlamydomonas reinhardtii: metabolic constraints for carbon partitioning between oil and starch. Eukaryotic Cell. 2013;12(6):776-793. doi:10.1128/EC.00318-12 ↩︎
Rochaix JD. Chlamydomonas reinhardtii as the photosynthetic yeast. Annu Rev Genet. 1995;29:209-230. doi:10.1146/annurev.ge.29.120195.001233 ↩︎
Calatrava V, Tejada-Jimenez M, Sanz-Luque E, Fernandez E, Galvan A. Nitrogen metabolism in Chlamydomonas. In: The Chlamydomonas Sourcebook. Elsevier; 2023:99-128. doi:10.1016/B978-0-12-821430-5.00004-3 ↩︎
Ghribi M, Nouemssi SB, Meddeb-Mouelhi F, Desgagné-Penix I. Genome Editing by CRISPR-Cas: A Game Change in the Genetic Manipulation of Chlamydomonas. Life (Basel). 2020;10(11). doi:10.3390/life10110295 ↩︎
Perozeni F, Baier T. Current Nuclear Engineering Strategies in the Green Microalga Chlamydomonas reinhardtii. Life (Basel). 2023;13(7). doi:10.3390/life13071566 ↩︎
Einhaus A, Baier T, Kruse O. Molecular design of microalgae as sustainable cell factories. Trends Biotechnol. December 12, 2023. doi:10.1016/j.tibtech.2023.11.010 ↩︎
Baier T, Kros D, Feiner RC, Lauersen KJ, Müller KM, Kruse O. Engineered Fusion Proteins for Efficient Protein Secretion and Purification of a Human Growth Factor from the Green Microalga Chlamydomonas reinhardtii. ACS Synth Biol. 2018;7(11):2547-2557. doi:10.1021/acssynbio.8b00226 ↩︎
Torres-Tiji Y, Fields FJ, Yang Y, et al. Optimized production of a bioactive human recombinant protein from the microalgae Chlamydomonas reinhardtii grown at high density in a fed-batch bioreactor. Algal Research. 2022;66:102786. doi:10.1016/j.algal.2022.102786 ↩︎
Sekimoto H. Sexual reproduction and sex determination in green algae. J Plant Res. 2017;130(3):423-431. doi:10.1007/s10265-017-0908-6 ↩︎
Shahar B, Haim E, Kuc ME, Azerrad SP, Dudai N, Kurzbaum E. Simplified and cost-effective modulatory photobioreactor setup for upscaling microalgal culture for research and semi-industrial purposes. Algal Research. 2023;74:103200. doi:10.1016/j.algal.2023.103200 ↩︎
Park S, Lee Y, Lee JH, Jin E. Expression of the high light-inducible Dunaliella LIP promoter in Chlamydomonas reinhardtii. Planta. 2013;238(6):1147-1156. doi:10.1007/s00425-013-1955-4 ↩︎↩︎
Kim J, Zhou Y, Carlson PD, et al. De novo-designed translation-repressing riboregulators for multi-input cellular logic. Nat Chem Biol. 2019;15(12):1173-1182. doi:10.1038/s41589-019-0388-1 ↩︎↩︎
Zhao EM, Mao AS, de Puig H, et al. RNA-responsive elements for eukaryotic translational control. Nat Biotechnol. 2022;40(4):539-545. doi:10.1038/s41587-021-01068-2 ↩︎↩︎
Sebesta J, Xiong W, Guarnieri MT, Yu J. Biocontainment of Genetically Engineered Algae. Front Plant Sci. 2022;13. doi:10.3389/fpls.2022.839446 ↩︎↩︎
Motomura K, Sano K, Watanabe S, et al. Synthetic Phosphorus Metabolic Pathway for Biosafety and Contamination Management of Cyanobacterial Cultivation. ACS Synth Biol. 2018;7(9):2189-2198. doi:10.1021/acssynbio.8b00199 ↩︎↩︎↩︎
Prindle MJ, Loeb LA. DNA polymerase delta in DNA replication and genome maintenance. Environ Mol Mutagen. 2012;53(9):666-682. doi:10.1002/em.21745 ↩︎↩︎
Bulock CR, Xing X, Shcherbakova PV. Mismatch repair and DNA polymerase δ proofreading prevent catastrophic accumulation of leading strand errors in cells expressing a cancer-associated DNA polymerase ϵ variant. Nucleic Acids Res. 2020;48(16):9124-9134. doi:10.1093/nar/gkaa633 ↩︎↩︎↩︎↩︎
Nakamura Y, Gojobori T, Ikemura T. Codon usage tabulated from international DNA sequence databases: status for the year 2000. Nucleic Acids Res. 2000;28(1):292. doi:10.1093/nar/28.1.292 ↩︎
The genome of the λ-phage was imported and virtually digested with the following restriction endonucleases: EcoRI, HindIII, BamHI, KpnI, EcoRV, SacI, and SalI before being visualized on Benchling’s agarose gel simulator (Figure 2.1).
Figure 2.1 Virtual digest of λ-phage’s DNA treated with seven different restriction enzymes (as indicated by the gel lane legend on the top left). Figure created on Benchling.com.
Part 3: DNA design challenge
3.1. Choose your protein. In recitation, we discussed that you will pick a protein for your homework that you find interesting. Which protein have you chosen and why? Using one of the tools described in recitation (NCBI, UniProt, Google), obtain the protein sequence for the protein you chose.
The entire medical establishment relies heavily on a sea creature so ancient and resilient that it has barely changed since its ancestral form first appeared in the tree of life when Planet Earth had its own ring system (like Saturn and Uranus), approximately 450 million years ago. Besides a hardy armour-like exoskeleton and a bizarre body plan, horseshoe crabs bring to the table a primitive, yet extremely functional, immune system tightly-packed in their blue-colored blood. A key component of their immune response are the granular amoebocytes found in their blood (Figure 2.2B), which, upon contact with a bacterial endotoxin, initiate a coagulation cascade that protects the horseshoe crab by sequestering and neutralizing the harmful agent (Figure 2.2C). This very property of horseshoe crab immunity has been harnessed by numerous medical corporations since the 1960s-1970s as an effective method to safely screen vaccines, other injectable pharmaceuticals, as well as implantable biomedical devices, for the presence of bacteria-derived toxins in a procedure called “Limulus amoebocyte lysate (LAL) assay” 1 (Figure 2.2A).
Figure 2.2 (A) Photograph from a horseshoe crab blood harvesting facility. (B) The blue blood of horseshoe crabs contains granular amoebocytes (depicted in brown), which, upon contact with a bacterial endotoxin (mostly a lipopolysaccharide residue), trigger a coagulation cascade that sequesters the foreign compound. This property has been utilized by the medical establishment for decades to test pharmaceuticals for the presence of bacterial endotoxins (C). Figure from an NPR’s report on horseshoe crab blood harvesting and partially created on BioRender.com.
Based on this premise, an interesting idea to pursue would be to perform whole-cell engineering of bacteria or, preferably, yeast cells to render them functionally similar to the granular amoebocytes contained in horseshoe crab blood. This endeavor, primarily inspired by an old iGEM project aiming to convert Escherichia coli bacteria into red blood cells 2, could contribute to the conservation of the fragile ecosystem to which horseshoe crabs belong, but also drastically confine the invasive, time-consuming, and expensive practice of harvesting horseshoe crab haemolymph 3.
To this end, a critical step is to transform the cells-to-be-engineered with the gene coding for factor C, namely the main protein that initiates the immune response and triggers the coagulation pathway 45. The amino acid sequence for the factor C protein of the mangrove horseshoe crab Carcinoscorpius rotundicauda (CrFactor C) was retrieved from UniProt under the accession number “Q26422” 46:
3.2. Reverse Translate: Protein (amino acid) sequence to DNA (nucleotide) sequence. The Central Dogma discussed in class and recitation describes the process in which DNA sequence becomes transcribed and translated into protein. The Central Dogma gives us the framework to work backwards from a given protein sequence and infer the DNA sequence that the protein is derived from. Using one of the tools discussed in class, NCBI or online tools (Google “reverse translation tools”), determine the nucleotide sequence that corresponds to the protein sequence you chose above.
The nucleotide coding sequence for CrFactor C was extracted from the respective NCBI entry 7:
3.3. Codon optimization. Once a nucleotide sequence of your protein is determined, you need to codon optimize your sequence. You may, once again, utilize Google for a “codon optimization tool”. In your own words, describe why you need to optimize codon usage. Which organism have you chosen to optimize the codon sequence for and why?
Different organisms display different codon biases regarding protein translation 89. Codon bias and codon usage are predominantly determined by the relative abundance of aminoacyl-tRNAs and aminoacyl-tRNA synthetases inside a cell, as they both constitute crucial components of the translational machinery, carrying the proteinogenic amino acids and loading the aminoacyl-tRNAs with the proper amino acid respectively. This codon bias has to be taken into account when transforming an organism with a gene from another organism to modify the coding sequence accordingly, enabled by the degeneracy of the genetic code, and render it compatible with the host cell’s translational machinery, thus ensuring smooth heterologous expression of the protein of interest. If the gene of interest is not codon optimized for the expression host, it is likely that the protein will be synthesized at very low levels or not at all.
Similarly, when choosing an expression host for synthesizing the protein of interest, several parameters have to be considered as well. In this specific case, factor C is a protein derived from a eukaryote, has a complex molecular structure involving disulfide bonds, and is glycosylated at several amino acid positions. For the expression of a protein with those characteristics, a putative host should also be a eukaryote, as eukaryotic cells harbor the necessary biochemical pathways for protein post-translational modifications, such as glycosylation, and, additionally, should have an oxidizing intracellular environment to facilitate the formation of disulfide bridges. A promising candidate that fulfils all those criteria is the methylotrophic yeast Pichia pastoris, for which the original coding sequence for factor C has been codon optimized employing Benchling’s codon optimization tool:
3.4. You have a sequence! Now what? What technologies could be used to produce this protein from your DNA? Describe in your words how the DNA sequence can be transcribed and translated into your protein. You may describe either cell-dependent or cell-free methods, or both.
For the expression of the codon-optimized version of CrFactor C in P. pastoris, the first step would be to replace the regulatory elements integrated in the cassette generated above, as they have been selected for bacterial expression, with parts that would be recognized in a yeast cell, such as the methanol-activated AOX1 promoter, an appropriate Kozak sequence, and the AOX1 terminator. After assembling the new genetic cassette for P. pastoris expression, it would have to be inserted into an integrative vector (probably from the pPICZα series), which would also carry a selection marker, for instance, zeocin, in conjunction with the expression cassette for the protein of interest. Subsequently, this integrative vector would be employed for the transformation of the yeast cells. In a portion of the successfully transformed yeast cells, the expression cassette-selection marker sequence would then be incorporated into the organism’s genome and, through the antibiotic resistance conferred by the selection marker, those positive transformants could be identified. By utilizing zeocin in particular, the most highly expressing strains can be readily isolated through increasing the dose of the antibiotic, as the resistance provided by zeocin is directly proportional to the number of selection marker genes integrated, which is a direct indication for the number of genes encoding the protein of interest integrated as well. The highly-expressing positive transformants would, afterwards, be cultured in the presence of methanol, which can strongly induce the transcription of the codon-optimized CrFactor C gene, whose mRNA would then be translated (ensured by the Kozak consensus) into CrFactor C protein molecules. Lastly, the nascent CrFactor C protein would be transferred to the endoplasmic reticulum (ER) and the Golgi apparatus for post-translational modifications.
For proteins with extended post-translational modification requirements, such as factor C, a cell-free expression system would not be recommended. However, a T7-based in vitro transcription method, coupled with a highly active and reliable in vitro eukaryotic translation system, such as rabbit reticulocyte lysate (RRL), would be an appealing alternative. For the expression of recombinant CrFactor C, though, the translation system should also be supplemented with microsomal membranes to secure the capacity for glycosylation 10.
3.5. How does it work in nature/biological systems?
Describe how a single gene codes for multiple proteins at the transcriptional level.
At the transcriptional/post-transcriptional level, the same gene, or rather, the same transcript, can code for multiple proteins through the mechanism of alternative splicing. More specifically, in the majority of eukaryotic organisms, genes consist of both exons, genetic segments that can be translated, and introns, genetic segments that are not translated but have regulatory roles. A crucial step in the transcript maturation process is the excision of introns, which is performed by the spliceosome, a large ribonucleoprotein complex found within the nucleus of the cell. Apart from removing the non-coding introns, the spliceosome also contributes to joining the remaining regions, namely the exons, from the precursor mRNA to generate the mature transcript. However, during this process, one or more different exons can be omitted, if, for instance, they are excised along with their flanking introns, leading to multiple variations of the mature mRNA (depending on the exons it contains) and, thus, to multiple proteins. Another mechanism through which a transcript can encode multiple proteins are multicistronic genes in prokaryotes. Multicistronic genes are frequently found clustered in prokaryotic operons, where a single transcription process, initiated by the gene’s sole promoter, leads to the synthesis of a long transcript with more than one start codons. Each start codon results in the expression of a different protein, albeit with all translation products from one multicistronic gene usually serving metabolic functions of the same metabolic pathway.
More clearly at the translational level, a single gene can code for multiple proteins if it contains more than one reading frames in eukaryotes too. The reading frames can also overlap, however, each one has its own start and stop codon. Lastly, at the post-translational level, a protein in a eukaryotic cell can exist in several distinct versions. Even though those versions are not considered different molecules, as they occurred from the same gene, a protein can be altered after it has been biosynthesized through post-translational modifications (PTMs), which include, but are not limited to, the cleavage of the initial methionine amino acid residue and the addition of other chemical moieties, such as glycans or phosphate groups.
Try aligning the DNA sequence, the transcribed RNA, and also the resulting translated protein!
The alignment of the gene for the codon-optimized CrFactor C, the transcribed RNA, and the resulting protein is illustrated in Figure 2.3. As the gene is fairly large, I opted to show only the part of the gene that codes for the protein’s N-terminus.
Figure 2.3 Alignment of the gene encoding CrFactor C, as it has been codon optimized for expression in P. pastoris, with its mature mRNA transcript, and the resulting CrFactor C protein. Figure generated with Benchling.com.
Part 4: Prepare a Twist DNA Synthesis Order
By following the instructions on preparing a DNA synthesis order for Twist, a plasmid containing the CrFactor C sequence codon-optimized for P. pastoris was generated (Figure 2.4).
Figure 2.4 Snapshot of the plasmid map for pTwist(amp, high copy)-CrFactor_C generated for the Twist DNA synthesis order. Plasmid map created on Benchling.com.
Part 5: DNA read/write/edit
5.1 DNA Read (i) What DNA would you want to sequence (e.g., read) and why? This could be DNA related to human health (e.g. genes related to disease research), environmental monitoring (e.g., sewage waste water, biodiversity analysis), and beyond (e.g. DNA data storage, biobank).
In continuation of the CrFactor C project, once again, expressing the codon-optimized sequence in P. pastoris would require assembling the genetic cassette, including the gene and all its flanking regulatory elements. Sequencing the assembled construct constitutes an important step before proceeding with the transformation in order to verify that the cloning was indeed successful and that the newly assembled expression cassette is identical to the designed one.
(ii) In lecture, a variety of sequencing technologies were mentioned. What technology or technologies would you use to perform sequencing on your DNA and why?
Also, answer the following questions:
Is your method first-, second- or third-generation or other? How so?
What is your input? How do you prepare your input (e.g. fragmentation, adapter ligation, PCR)? List the essential steps.
What are the essential steps of your chosen sequencing technology, how does it decode the bases of your DNA sample (base calling)?
What is the output of your chosen sequencing technology?
For whole-plasmid sequencing of the integrative vector carrying the CrFactor C codon-optimized sequence, I would choose Oxford Nanopore sequencing. It is a third-generation sequencing technology that combines high speed, reliability, and read accuracy (98-99%), as well as low cost.
Another advantage of this technology is that it requires minimal library preparation, essentially omitting time-consuming steps, such as PCR or reverse transcription of RNA into DNA. Sample preparation involves a single, rapid “tagmentation” step facilitated by a hyperactive transposase complex. The complex, also called a transposome, is pre-loaded with synthetic, double-stranded adapters to simultaneously fragment DNA or RNA strands and ligate sequencing adapters, which, for Nanopore sequencing specifically, carry a motor protein as well that will help thread the nucleotide chains through the nanopores in the flow cell. The entire process of transposome-based library preparation lasts no more than 5min.
Once preparation of the sequencing library is completed, the sample can be loaded onto the flow cell, which contains thousands of nanopores (nano-scale protein channels) embedded in an electrically resistant membrane. The membrane separates two chambers, each filled with an electrolyte solution, and allows the flow of ions between the two chambers exclusively through its integrated nanopores. The ionic current induced by the flow of charged particles through each nanopore is monitored and measured with an individual electronic sensor. The sensor detects and reports the disruptions in the ionic current caused by the passing through of individual nucleotide bases, each of which displays a unique electrical fingerprint, hence electrical disruptive pattern, depending on its biochemical properties. Specialized base-calling algorithms interpret those disruptions by generating data in the form of nucleotide sequences in real time. Therefore, the output of the technology is an electrical current graph depicting “squiggles” of specific amplitude, which can then be translated into sequencing data consisting of readable nucleotide chains. Those sequencing data can be further processed afterwards by employing alignment, assembly, and analysis bioinformatics tools 11.
5.2 DNA Write (i) What DNA would you want to synthesize (e.g., write) and why? These could be individual genes, clusters of genes or genetic circuits, whole genomes, and beyond. As described in class thus far, applications could range from therapeutics and drug discovery (e.g., mRNA vaccines and therapies) to novel biomaterials (e.g. structural proteins), to sensors (e.g., genetic circuits for sensing and responding to inflammation, environmental stimuli, etc.), to art (DNA origamis). If possible, include the specific genetic sequence(s) of what you would like to synthesize!
(ii) What technology or technologies would you use to perform this DNA synthesis and why?
To actually create the genetic circuit for the expression of CrFactor C in P. pastoris described above, each genetic element would first have to be individually synthesized by a DNA synthesis company, such as Twist. Apart from the codon-optimized sequence of the CrFactor C gene previously shown, those genetic elements include:
the AOX1 promoter from P. pastoris, combined with its native Kozak sequence (last six nucleotides)
CTGTTCTAACCCCTACTTGACAGCAATATATAAACAGAAGGAAGCTGCCCTGTCTTAAACCTTTTTTTTTATCATCATTATTAGCTTACTTTCATAATTGCGACTGGTTCCAATTGACAAGCTTTTGATTTTAACGACTTTTAACGACAACTTGAGAAGATCAAAAAACAACTAATTATTGAAAGAATTCCGAAACG and
the AOX1 terminator from P. pastorisTCAAGAGGATGTCAGAATGCCATTTGCCTGAGAGATGCAGGCTTCATTTTTGATACTTTTTTATTTGTAACCTATATAGTATAGGATTTTTTTTGTCATTTTGTTTCTTCTCGTACGAGCTTGCTCCTGATCAGCCTATCTCGCAGCTGATGAATATCTTGTGGTAGGGGTTTGGGAAAATCATTCGAGTTTGATGTTTTTCTTGGTATTTCCCACTCCTCTTCAGAGTACAGAAGATTAAGTGAGA
Both aforementioned parts have been sourced from the iGEM Registry of Standard Biological Parts. After receiving the individually synthesized parts, the promoter, Kozak consensus, coding sequence, and terminator would have to be assembled into the genetic cassette for the expression of the CrFactor C. For this, I would use a reliable cloning technique, such as Golden Gate assembly, which capitalizes on type IIS restriction enzymes’ property to cleave a double-stranded DNA molecule downstream of their recognition site. This property allows the generation of custom four-nucleotide overhangs with the use of solely one restriction enzyme, enabling the assembly of complex DNA constructs (consisting of up to 30 distinct parts)
seamlessly, with an extremely low error rate in a one-pot reaction. This method requires a lot of caution in its design phase, so that the appropriate flanking regions that will generate the suitable overhangs for the assembly step are added to each segment with the right orientation (alternatively, they can also be added after the initial synthesis of the parts through PCR). Additionally, it is important to remove any internal recognition sites for the selected type IIS endonuclease through site-directed mutagenesis before construct assembly. With proper design and execution of the previously mentioned laboratory techniques, the genetic cassette for the expression of the recombinant CrFactor C in P. pastoris can, therefore, be synthesized.
5.3 DNA Edit (i) What DNA would you want to edit and why? In class, George shared a variety of ways to edit the genes and genomes of humans and other organisms. Such DNA editing technologies have profound implications for human health, development, and even human longevity and human augmentation. DNA editing is also already commonly leveraged for flora and fauna, for example in nature conservation efforts, (animal/plant restoration, de-extinction), or in agriculture (e.g. plant breeding, nitrogen fixation). What kinds of edits might you want to make to DNA (e.g., human genomes and beyond) and why?
Although it would probably be more rational to simply redo the cassette assembly with the desired DNA elements, I could use a gene editing method, such as CRISPR, to swap the bacteria-specific regulatory parts in the pTwist(amp, high copy)-CrFactor_C plasmid generated above for the Twist order with regulatory parts with a similar function but specialized for gene expression in P. pastoris. Those genetic segments would include the promoter, RBS, and terminator already integrated into the vector, which would be replaced by the AOX1 promoter, its native Kozak sequence, and the AOX1 terminator respectively. This way, an already assembled genetic construct can be repurposed for heterologous expression in a different organism (in this case, one that is more appropriate for the expression of the selected gene). At a later stage, the swapped regulatory sequences can be altered again with new ones, for instance, a stronger promoter and a more reliable terminator, to optimize transcription and obtain more robust protein synthesis.
(ii) What technology or technologies would you use to perform these DNA edits and why?
Also answer the following questions:
How does your technology of choice edit DNA? What are the essential steps?
What preparation do you need to do (e.g. design steps) and what is the input (e.g. DNA template, enzymes, plasmids, primers, guides, cells) for the editing?
What are the limitations of your editing methods (if any) in terms of efficiency or precision?
The CRISPR-Cas9 system is a tremendously versatile and powerful genome-editing technology that can introduce precise modifications in DNA. The principle, as well as the main components of the system, have been adapted from bacterial cells, where transcripts from the CRISPR (Clustered Regularly Interspaced Short Palindromic Repeats) array are combined with Cas (CRISPR-associated) proteins to recognize and neutralize foreign genetic material, such as bacteriophage DNA, thus functioning as a natural defense mechanism.
At its core, CRISPR editing relies on guiding a DNA-cutting enzyme to a specific sequence in the genome, where it introduces a targeted break that the cell then repairs, often resulting in a desired genetic modification. More specifically, a guide molecule called a single-guide RNA (sgRNA or gRNA), which is designed to be complementary to the target DNA sequence, forms a complex with the Cas9 endonuclease (Figure 2.5A and B). Once the complex is delivered into the target cells, the gRNA directs Cas9 to the genetic target through base pairing. Importantly, the target site must be adjacent to a short motif known as the PAM (protospacer adjacent motif), which is required for Cas9 binding. Upon recognition, Cas9 generates a double-strand break in the DNA (Figure 2.5C), which in turn activates the cell’s natural repair pathways. The repair mechanisms include non-homologous end joining (NHEJ) or homology-directed repair (HDR), with the former often introducing brief insertions or deletions to the target site, which can be disruptive to the gene’s function. The latter, on the other hand, enables incorporating a DNA template to obtain more precise editing (Figure 2.5D).
Figure 2.5 Overview of the CRISPR-Cas9 gene editing mechanism. Figure modified from Addgene’s CRISPR guide.
Preparation for a CRISPR experiment involves several design and input considerations. First, the target DNA sequence must be computationally analyzed to identify sites that can be specifically targeted by gRNA molecules and are located near a PAM sequence. The selected sgRNA sequence is then synthesized and often inserted into a plasmid vector that also encodes Cas9. Alternatively, Cas9 protein and sgRNA can be delivered directly as a ribonucleoprotein complex. If the experiment aims to integrate a precisely altered sequence via HDR, a donor DNA template containing the intended modification should be designed as well, typically with homologous arms flanking the edit site. Additional inputs may include primers for verification, plasmids for delivery (as already mentioned), appropriate host cells depending on the application, as well as availability of delivery methods depending, in turn, on host cell type.
Despite its potential, CRISPR has several limitations, the main one concerning off-target effects, where the Cas9-sgRNA complex binds and cuts at unintended genomic sites, potentially causing unwanted mutations. Improved gRNA design and optimized Cas variants have reduced this risk, without, however, entirely eliminating it. Efficiency can be another shortcoming of the method, particularly for HDR-based edits, which are often less efficient than NHEJ and are usually influenced by the cell cycle stage. Additionally, delivery of CRISPR components into certain cell types or tissues remains challenging. There are also biological constraints, such as immune responses to Cas proteins and variability in editing outcomes between cells. Lastly, ethical considerations and regulatory frameworks can confine CRISPR implementation, especially in human germline editing.
Maloney T, Phelan R, Simmons N. Saving the horseshoe crab: A synthetic alternative to horseshoe crab blood for endotoxin detection. PLoS Biol. 2018;16(10):e2006607. doi:10.1371/journal.pbio.2006607 ↩︎
Ding JL, Navas MA, Ho B. Molecular cloning and sequence analysis of factor C cDNA from the Singapore horseshoe crab, Carcinoscorpius rotundicauda. Mol Marine Biol Biotechnol. 1995;4(1):90-103. ↩︎↩︎
Ding JL, Ho B. Endotoxin detection–from limulus amebocyte lysate to recombinant factor C. Subcell Biochem. 2010;53:187-208. doi:10.1007/978-90-481-9078-2_9 ↩︎
Nakamura Y, Gojobori T, Ikemura T. Codon usage tabulated from international DNA sequence databases: status for the year 2000. Nucleic Acids Res. 2000;28(1):292. doi:10.1093/nar/28.1.292 ↩︎
Beckler GS, Thompson D, Van Oosbree T. In vitro translation using rabbit reticulocyte lysate. Methods Mol Biol. 1995;37:215-232. doi:10.1385/0-89603-288-4:215 ↩︎
Using the coordinates from the GUI, follow the instructions in the HTGAA26 Opentrons Colab to write your own Python script, which draws your design using the Opentrons. You may use AI assistance for this coding — Google Gemini is integrated into Colab (see the stylized star bottom center); it will do a good job writing functional Python, while you probably need to take charge of the art concept.
If you use AI to help complete this homework or lab, document how you used AI and which models made contributions.
Consistent with this week’s highly automated and digitized theme, for this assignment, I drew inspiration from an image popularized by the Internet, KC Green’s web comic strip “On Fire”, which, in 2014, became a famous -and my personal favorite- online meme (Figure 3.1). As many other people from all over the world, I deeply relate to this meme, which, I feel, accurately describes my life.
As a first step, I fed the right part of the meme into Ronan’s automation art interface, however, the generated artwork required a lot of additional manual processing to resemble the original image (Figure 3.2).
Figure 3.2 (A) Initial image produced by inserting the right-hand ptych of the “This is fine” meme into Ronan’s automation art interface. (B) Final artwork generated after manual rendering of the initial image.
After composing the final artwork (Figure 3.2B), I imported the nine bacterial dyes I utilized (mClover3, mLychee_TF, mWatermelon, Ultramarine, mKO2, dsRed, mScarlet_I, mCherry, mKate2) along with their respective coordinates into Gemini 2.5 Flash (which was incorporated into my personal copy of HTGAA26 Opentrons Colab notebook) and asked it to write a Python script that would generate the “This is fine”-inspired artwork on a petri dish with the Opentrons system. The Pyhton script obtained from this prompt, slightly augmented with some basic tweaking, including the addition of comments at several steps and functions, as well as renaming the bacterial dyes with their corresponding Hex codes, can be found below:
Lastly, when I simulated the artwork, the Python script presented above did produce the designed image (Figure 3.3).
Figure 3.3 Simulation of the “This is fine” artwork generated by running the Python script displayed above.
Post-lab questions related to using the Opentrons system
One of the great parts about having an automated robot is being able to precisely mix, deposit, and run reactions without much intervention, and design and deploy experiments remotely. For this week:
Find and describe a published paper that utilizes the Opentrons or an automation tool to achieve novel biological applications.
In their paper from March 2026 1, Kostanjšek et al. present the development of Rhodo-Box, a toolkit of standardized genetic parts for the emerging Synthetic Biology chassis Rhodobacter sphaeroides. R. sphaeroides is a purple non-sulfur alphaproteobacterium with a highly versatile metabolism, including photosynthetic pathways, which render it a promising platform for the sustainable biosynthesis of numerous compounds. To realize the microorganism’s full potential, the researchers built and characterized a collection of modular genetic elements specifically tailored for use in R. sphaeroides.
The modular parts include three broad-host origins of replication (ORIs), namely RSF1010, pBBR1, and RK2 functioning as high-, medium-, and medium-copy-number ORIs respectively. Also found in the toolbox are 13 constitutive promoters of native (like PJ95025), heterologous (such as P crtE), and artificial origin (like PJ23100), spanning a 270-fold dynamic range, as well as 11 ribosome binding sites (RBSs), originally designed for E. coli, for instance, B0034, or for R. sphaeroides, such as J95028, for translational regulation, spanning a 49-fold dynamic range. Another significant feature of Rhodo-Box are the four inducible expression systems assessed in the context of the study, namely NahR-P salTTC, LacI-P lacT7A1_O3O4, VanR-P vanCC, and XylS-Pm. Among them, NahR-P salTTC and VanR-P vanCC, induced by salicylic and vanillic acid each, appeared to be the most promising ones as they displayed high tunability and low basal expression, with the former comprising an appealing option for industrial-scale biomanufacturing due to the affordability of salicylic acid. To enable further flexibility and orthogonality of the modular cloning strategy, the authors proceeded to construct plasmid backbones for Rhodo-Box by combining the ORIs mentioned above with common antibiotic resistance markers, while ensuring that the interaction of the different promoter and RBS sequences tested would not generate genetic context-dependent effects influencing the level of expression.
To this end, meaning to cross-screen for context-dependent interactions among Rhodo-Box’s components, Kostanjšek et al. implemented a semi-automated cloning workflow to build a R. sphaeroides strain library in a time-efficient manner using an Opentrons OT2 platform. In particular, they programmed the Opentrons liquid-handling robot to assemble five promoters with six RBSs and four transcriptional terminators to yield a total of 42 constructs (Figure 3.4). Through this process, they obtained 38 correctly assembled strains, corresponding to an overall 90% success rate in genetic circuit construction, and, concurrently, reduced the time required to build this library by 50%.
Figure 3.4 Combinatorial characterization of parts from the Rhodo-Box toolkit using a semiautomated cloning workflow on the Opentrons OT2 platform. (A) General layout of the semiautomated workflow, combining five promoters (red) with six RBSs (green), and characterizing four terminators (blue) with eGFP. (B) Heat-map representing the combinatorial promoters and RBSs' strengths in *R. sphaeroides*. (C) Normalized fluorescence of tested terminators T0, B0010, B0015, J95029 expressed in combinations of P~J23100~ and P~J95025~ with B0034 and B0030. Graphs (B, C) represent the average fluorescence values normalized with OD~600~, with the standard deviation of three technical replicates depicted in (C). Figure from Kostanjšek et al., 2026 [^1].
By coupling the validation of the modular design principles underlying the Rhodo-Box toolkit with the automated approach facilitated by the Opentrons OT2 platform, the researchers hope to further expand the repertoire of genetic circuits built for expression in R. sphaeroides, so that this novel chassis can be employed for more advanced Metabolic Engineering and Synthetic Biology applications.
Write a description about what you intend to do with automation tools for your final project. You may include example pseudocode, Python scripts, 3D printed holders, a plan for how to use Ginkgo Nebula, and more. You may reference this week’s recitation slide deck for lab automation details.
While your description/project idea doesn’t need to be set in stone, we would like to see core details of what you would automate.
A significantly large portion of my experience of Synthetic Biology stems from working in the wet lab, so I hope you can understand my reluctance to adopt a more automated approach. However, I believe that automation can substantially help with highly repetitive tasks in order to accelerate several processes, rendering them more high-throughput.
In the context of one of my final ideas in particular, I would like to combine a genetically modified fungus with a cyanobacterium or a microalga to generate a synthetic lichen. One of the major challenges of building a lichen from the bottom up lies in establishing the appropriate organisms partaking in the symbiotic relationship. Although there are hundreds of naturally occurring lichen species 2 that could function as a basic foundation for this investigation, it would be interesting to experiment with different combinations of fungi and photobionts (possibly more than one from each category per combination). Exploring novel microorganism combinations for the generation of a synthetic lichen could lead to optimizing existing species but also to creating an artificial lichen that constitutes a particularly suitable platform for the proposed application, which is a color-shifting building coating. Opentrons could be deployed both to prepare the initial separate axenic cultures of the different fungi and photobionts and to generate the mixed co-culture combinations. Another difficulty arises from growth incompatibility between the different symbiotic partners, so Opentrons could also contribute to visually inspecting the several co-cultures through a spectrophotometer function to pinpoint the combinations where the growth rate of the fungus (or fungi) matches the respective growth rate of the photobiont(s) in a stable and consistent manner. Additionally, this kind of visual inspection performed by the Opentrons system could ensure that the cultures stay uncontaminated (which can be revealed through alterations in light absorption too), as well as identify the co-cultures which display the potential for a lichen’s structural complexity. Rather that merely co-existing in the same culture, the symbionts should also demonstrate the capacity to recreate the highly organized, layered structure of natural lichens (called a thallus), which constitutes an additional criterion for distinguishing the most promising candidates. To this end, apart from utilizing the Opentrons platform for co-culture maintenance and surveillance, I could design and 3D-print a 24-well plate embedded with a micro-scaffold that would “encourage” the formation of a rudimentary thallus by the symbiotic microorganisms. Lastly, as genetic parts for putative lichen partners are often not as well-established as for model organisms, such as E. coli, several versions of the color-changing genetic construct should be assembled, each combining different genetic parts. In that case, Opentrons could be extremely helpful in screening the performance of all different circuit combinations in a high-throughput manner, as well as in characterizing a number of novel parts, engineered or optimized for the purposed of the project. Since all three of my proposals involve the assembly and integration of a genetic construct into a biological system, the same screening of genetic circuits could be conducted by Opentrons to a similar end for my other final project ideas too.
Kostanjšek M, Raynal A, Dimopoulos G, et al. Rhodo-Box: A Synthetic Biology Toolbox to Facilitate Metabolic Engineering of Rhodobacter sphaeroides. ACS Synth Biol. March 15, 2026. doi:10.1021/acssynbio.5c00808 ↩︎
Lutzoni F, Miadlikowska J. Lichens. Curr Biol. 2009;19(13):R502-3. doi:10.1016/j.cub.2009.04.034 ↩︎
Week 4 homework
Protein design-Part I 💻
Part 1: Conceptual questions
Answer any nine of the following questions from Shuguang Zhang: (i.e. you can select two to skip)
How many molecules of amino acids do you take with a piece of 500 grams of meat? (On average, an amino acid is ~100 Daltons.)
Depending on the type of meat, as well as the manner it is processed prior to consumption, 500g of meat contain approximately 100 - 130g of protein. Assuming that this protein consists entirely of amino acids (meaning, excluding metal ions, such as iron or zinc, which can be found bound to protein molecules, or glycans and other moieties added to proteins through post-translational modifications), then 100-130g of amino acids = 6.02 - 7.83x1025Da approximately. Therefore, if the molecular weight of one amino acid is on average ~100Da, then 500g of meat contain (6.02 - 7.83x1025Da)/100Da = 6.02 - 7.83x10²³ amino acid molecules.
Why do humans eat beef but do not become a cow, eat fish but do not become fish?
When humans consume proteins from beef or fish, the proteins do not remain as they are, but are digested and disassembled into oligopeptides and, eventually, into their building blocks, namely amino acids. Amino acids can be further broken down, however, the majority of them are diverted to the synthesis of nascent protein molecules in the organism/cells that have absorbed those amino acids from food consumption. The kind of proteins that will be synthesized with these amino acids is dictated by the organism’s (in this case, human) genes, in combination with intercellular interactions and other environmental cues in general, since an organism’s genome is what determines their developmental program, in other words, what makes a cow a cow, a fish a fish, and a human a human.
Why are there only 20 natural amino acids?
There are 20 standard/canonical or proteinogenic amino acids encoded by the genetic code. It is very likely that, in the last four billion years of Earth’s existence, since the first organic molecules started to emerge, many different amino acid molecules have occurred. Nevertheless, this combination of 20 amino acids seems to have been favored by what can be considered a deeply fundamental form of natural selection. The main factors that led to this set of 20 amino acids comprising the proteinogenic code of all life on the planet can be traced to the diversity of sizes and chemical properties they display, the prevalence of the atoms that constitute their components, the stability they provide to protein folding and structure, all balanced by their biosynthetic cost. 1
Can you make other non-natural amino acids? Design some new amino acids.
Designing new amino acids primarily entails identifying what modifications can be introduced to the 20 natural ones. Among the most obvious ones is replacing one of the usual elements found in organic compounds (C, H, O, N, S, P) with another element from the periodic table. Based on this concept, I decided to swap the C in alanine’s side chain methyl group with Si (Figure 4.1A), which has similar properties but is associated with digital computing. For the second amino acid, I focused on amino acids with aromatic rings, which have always fascinated me as chemical moieties due to their conjugated π electrons and extraordinary properties. Sticking with the aromatic theme, I replaced the benzene ring in phenylalanine’s side chain with azulene (Figure 4.1B). Azulene is an aromatic group with a seven- and five-membered ring and has a distinctive blue hue, which could be useful for detection assays. Finally, to design the third amino acid (which will also ensure my being locked away in Chemistry prison for all eternity), I joined two copies of the basic amino acid skeleton (the core C with one amino and one carboxyl group) together to generate what could be described as a “double” amino acid (Figure 4.1C). Although very unorthodox and probably chemically unstable, especially in its trans form (Figure 4.1C, bottom), the “double” amino acid is envisioned to function as an adapter enabling connecting amino acids in unusual ways, such as generating peptides with two N- or two C-termini.
Figure 4.1 Schematics of new non-natural amino acids: (A) alanine with the C in its methyl group replaced with Si, (B) phenylalanine with the benzene in its side chain swapped with azulene, and (C) the “double” amino acid, both as a cis (top) and trans (bottom) isomer. Figure drawn on ChemDoodle.
Where did amino acids come from before enzymes that make them, and before life started?
In 1953, Stanley Miller and Harold Urey conducted what is now known as the “Miller-Urey experiment”, which supports the prebiotic (prior to the emergence of life) synthesis of amino acids. In more detail, the researchers replicated the chemical conditions of Earth’s early atmosphere by combining methane, ammonia, hydrogen, and water vapor in a flask. By stimulating those compounds with electric sparks (recreating lightning), Miller and Urey were able to detect simple amino acids, such as glycine, alanine, and valine, under the simulated early Earth conditions, demonstrating that complex organic molecules could form spontaneously from inorganic precursors in the prebiotic “primordial soup”. 2
Another hypothesis claims the introduction of amino acids to Earth from space through meteorites. Among them, the Murchison meteorite 3, which fell near Murchison, Victoria, in Australia in 1969, has been found to contain over 90 amino acids, including 19 also found on Earth, suggesting an extraterrestrial origin for organic compounds.
If you make an α-helix using D-amino acids, what handedness (right or left) would you expect?
Natural proteins consist of L-amino acids (rather than D-amino acids), meaning that the chirality (or the molecular orientation) of amino acids in naturally occurring proteins tends to be left-handed rather than right-handed 4. Due to this property, structural stability favors the formation of right-handed or clockwise-rotating α-helices with L-amino acids 56, with the exception of regions rich in glycine, which is the only achiral of the 20 proteinogenic amino acids. Based on this rationale, a peptide chain composed of D-amino acids would display a structural propensity towards left-handedness and would, therefore, most likely form left-handed or counterclockwise-rotating α-helices.
Why are most molecular helices right-handed?
Similarly to proteins’ “preference” towards L-amino acids, the dominant forms of DNA and RNA consist of nucleotides containing D-sugars, D-deoxyribose and D-ribose respectively. In both cases of proteins and nucleic acids, the chirality of their building blocks thermodynamically favors right-handed helical structures, which minimize steric hindrances and optimize hydrogen bonding among monomers. In other words, the inherent geometry of the amino acids and sugars found in naturally occurring proteins, as well as DNA and RNA molecules, renders right-handed α-helices (in the case of proteins) and the right-handed β-form double helix (in the case of DNA) more structurally stable and energetically efficient, as they require less energy for maintenance, than their left-handed counterparts 56.
Why do β-sheets tend to aggregate? What is the driving force for β-sheet aggregation?
In physiologically folded proteins, β-sheets are arranged in a parallel or antiparallel orientation to form zigzag polypeptide chains. They tend to be positioned side-by-side, as this conformation is mediated by hydrogen bonds between the amino- and carboxyl-groups of neighbouring sheets. However, in pathogenic states (which often involve the misfolding of the protein too), this very property favors the “edge-to-edge” aggregation of multiple β-sheets, potentially leading to the formation of insoluble amyloid fibrils. Another mechanism that drives β-sheet aggregation occurs from the shape of this type of protein secondary structure, which forces the hydrogen bonds between neighbouring domains to exist on the same plane, while the side chains of hydrophobic amino acid residues (which are common in β-sheets) are inclined to protrude out of either side of that plane. These hydrophobic moieties can interact with the hydrophobic side chains of amino acids from another sheet, creating hydrophobic spaces between them. It is, therefore, thermodynamically favorable for β-sheets to gradually be stacked on top of each other, which, once again, can result in their aggregation 789.
Design a β-sheet motif that forms a well-ordered structure.
For this task, at first I thought to draw inspiration from nature and, specifically, from naturally occurring proteins characterized by a well-ordered structure despite being rich in β-sheets. One such category of proteins are fluorescent proteins, for instance GFP, whose wild-type structural configuration forms a fluorophore-protecting can-shaped cavity termed a “β-barrel”. I thought I could experiment with increasing the stability of the β-barrel, while retaining most of its intrinsic structural properties. One way to approach this would be to swap several of the hydrophobic amino acids located in its barrel-forming region (approximately amino acids 13 - 227) with prolines. Amino acid residues with hydrophobic R-groups contribute both with their side chains but also with their amino- and carboxyl-moieties to β-sheet aggregation propensity as explained in the previous question. On the contrary, proline does not have a hydrophobic R-group, as the amino acid’s cyclic side chain curls back into its own nitrogen backbone, thus preventing the amino-group’s hydrogen from interacting with other amino acids through hydrogen bonds 101112. However, I then proceeded to reject this idea, as this well-ordered β-sheet pattern already exists and has been optimized by nature through evolution. I similarly rejected other ideas involving symmetric naturally generated protein motifs, such as the ones found in viral capsids.
At this point, I wondered what other intricate β-sheet motifs had already been discovered in nature. I was intrigued to find one called “the greek key”, which comprises a protein supersecondary structure consisting of four adjacent antiparallel β-strands connected non-sequentially by hairpin loops in a shape reminiscent of the meander pattern (also known as “the greek key”) 13. Wanting to honor greek heritage as well, I designed a secondary structure motif abstractly inspired by the swirls commonly observed at the bottom part of traditional greek antefixes (“ακροκέραμα”), which are ornamental ceramic tiles placed at the edge of the roof (Figure 4.2B, top). This motif contains eight β-sheets, divided into two columns and positioned antiparallel to each other in pairs, while connected by hairpin loops in the sequence 1-3-2-4-5-7-6-8 (Figure 4.2A). Upon a second glance, I realized that this pattern also resembles the capital, meaning the upper part (“κιονόκρανο”), of columns sculpted in ionic style (Figure 4.2B, bottom). This motif is, of course, imaginary, therefore it would have to be artificially constructed within a protein molecule to test for its structural integrity and conclude whether it qualifies or not as a well-ordered protein supersecondary structure.
Figure 4.2 Visual representation of the antefix-derived β-sheet secondary structure motif and its inspirational source. (A) The pattern contains eight β-sheets, divided into two columns and positioned antiparallel to each other in pairs non-sequentially. (B) This β-sheet motif was inspired by the spirals displayed at the bottom part of traditional greek antefixes (top) or bilaterally in ionic column capitals (bottom). Figure from the ceramic art workshop “Akrokeramo”.
Part 2: Protein analysis and visualization
Pick any protein (from any organism) of your interest that has a 3D structure and answer the following questions:
Briefly describe the protein you selected and why you selected it.
For this assignment, I selected reflectin from Sepia officinalis, the common cuttlefish, as it contributes, among other proteins and structures, to the formation of intricate iridescent patterns that distinguish several cephalopods, such as cuttlefish, squids, and octopuses. In general, reflectins enable rapid, dynamic camouflage by controlling light reflection, as they possess high refractive indices and form nanostructured photonic films called iridophores, which can shift color in response to neurotransmitters 14. I am deeply fascinated by those patterns and the way they are created, so I drew inspiration from this natural phenomenon for one of my final project ideas, hence my interest in delving more into this particular protein.
Identify the amino acid sequence of your protein.
How long is it? What is the most frequent amino acid?
How many protein sequence homologs are there for your protein?
The peptide chain is 291aa long, with the most frequent amino acid being tyrosine (Y) as it appears in the sequence 47 times.
UniProt’s BLAST tool identified 20 results with a sequence identity of 50 - 88% that appear to be homologs of SpREF8 from other appearance-shifting cephalopods, such as the Pharaoh cuttlefish (Sepia pharaonis), the East Asian common octopus (Octopus sinensis), and the common octopus (Octopus vulgaris).
Reflectins belong to a unique family of intrinsically disordered proteins (IDPs) found in cephalopods. They are highly unusual, rich in aromatic and sulfur-containing amino acids, for example, tryptophan (W) and methionine (M), and can self-assemble into diverse nanostructures 14.
Identify the structure page of your protein in RCSB.
When was the structure solved? Is it a good quality structure? (A good quality structure is one with good resolution, the smaller the better (Resolution: 2.70 Å)).
Are there any other molecules in the solved structure apart from protein?
Does your protein belong to any structure classification family?
The query about reflectin on RCSB did not yield any results, even when computed structure models (CSMs) were included. However, there was a 3D model of the protein’s structure on its UniProt page (Figure 4.3). No other molecules seem to participate in this structure, which is consistent with the protein’s property to interact mainly with photons.
Figure 4.3 Snapshot of reflectin’s (SoREF8) 3D structure visualization. Figure from its UniProt page.
Open the structure of your protein in any 3D molecule visualization software.
Visualize the protein as “cartoon”, “ribbon”, and “ball and stick”.
Color the protein by secondary structure. Does it have more helices or sheets?
Color the protein by residue type. What can you tell about the distribution of hydrophobic vs hydrophilic residues?
Visualize the surface of the protein. Does it have any “holes” (aka binding pockets)?
Below you can find the 3D structure visualizations of SoREF8 in the “cartoon”, “ribbon” (Figure 4.4A), and “ball and stick” (or “liquorish”) (Figure 4.4B) models as rendered in PyMOL.
Figure 4.4 Visualizations of reflectin’s (SoREF8) 3D structure in the “cartoon” and “ribbon” model (A), as well as in the “ball and stick” (or “liquorish”) model (B). Figure generated with the PyMOL software.
When coloring the protein based on its secondary structures, it appears that it has an almost equal number of very short α-helices (Figure 4.5, red) and β-sheets (Figure 4.5, yellow), while the largest part of the protein retains a less structurally defined loop form (Figure 4.5, green).
Figure 4.5 Visualization of reflectin’s (SoREF8) secondary structures, including α-helices (depicted in red), β-sheets (highlighted in yellow), and loops (marked with green). Figure generated with the PyMOL software.
Furthermore, reflectin seems to have more hydrophilic and charged amino acids than hydrophobic residues in its peptide chain, which is consistent with the respective reflectin protein family’s high content of aromatic and sulfur-containing amino acids, such as tryptophan (W) and methionine (M) (Figure 4.6).
Figure 4.6 Visualization of reflectin’s (SoREF8) structure based on its amino acid hydrophobicity: hydrophobic residues are illustrated in green, whereas hydrophilic/polar and charged ones are displayed in red and blue respectively. Figure generated with the PyMOL software.
Lastly, upon visualizing reflectin’s (SoREF8) surface, the protein does form large gaping holes where its loops are located, however, their size renders them highly unsuitable for binding ligands (Figure 4.7). After a quick 3D inspection of the entire molecule’s surface, I could not find any binding pockets, which also aligns with the absence of complex secondary structures in the protein. Complex secondary structures, often facilitated by long stretches of hydrophobic amino acid residues, which are absent in reflectin’s peptide sequence, enable the folding of the amino acid chain into pores and cavities that can serve as binding sites for specific ligands. The absence of binding pockets in the case of reflectin does not come as a surprise though, as the principal element these proteins have to interact with are rays of light.
Figure 4.7 Visualization of reflectin’s (SoREF8) surface, where no binding pockets can be seen. Figure generated with the PyMOL software.
a. Use ESM2 to generate an unsupervised deep mutational scan of your protein based on language model likelihoods. Can you explain any particular pattern? (Choose a residue and a mutation that stands out.)
Model esm2_t30_150M_UR50D was deployed to generate the deep mutational scan of reflectin (SoREF8), which revealed several regions that are highly sensitive to mutations in the protein. More specifically, positions 17 - 22, 40 - 48, 97 - 122, 145 - 153, 158 - 165, 207 - 230, and 264 - 278, which also appear darker in the mutation scan heatmap, indicate protein regions with an integral role in reflectin’s structure and function, being, therefore, less tolerant to amino acid substitutions (Figure 4.8). Those regions may also correspond to short patterns repeated across the protein’s amino acid sequence. Additionally, some points that stand out in the heatmap as favorable mutations are glutamine (Q) amino acid residue at positions 110 and 157, as well as a M amino acid residue at position 207 (denoted with yellow color in Figure 4.8).
Figure 4.8 Mutation scan heatmap of reflectin from Sepia officinalis. Figure generated by utilizing Evolutionary Scale Modeling version 2 (esm2_t30_150M_UR50D).
b. (Bonus) Find sequences for which we have experimental scans, and compare the prediction of the language model to the experiment.
Unfortunately, I could not find any experimental scans for SoREF8 in the literature. Nevertheless, I managed to discover a paper investigating the structural properties of another member of the reflectin family, namely a truncated version of reflectin A1 from the longfin inshore squid (Doryteuthis pealei), which displays N-terminal and internal motifs distinctive of many other reflectin proteins 15. The truncated variant of this specific reflectin protein (RfA1TV) contains an ERYMD amino acid sequence at positions 37 - 41, which appears to play a significant role in the formation of a helix crucial for granting the biomolecule its reflective properties 15. In SoREF8, a similar sequence of the amino acids GRYMD can be seen between positions 40 and 48, which were identified as a region critical for the protein’s function by the mutational scan in the previous question.
Latent Space Analysis
a. Use the provided sequence dataset to embed proteins in reduced dimensionality. Analyze the different formed neighborhoods: do they approximate similar proteins?
In various cases, protein clusters created by the t-SNE analysis shown below (Figure 4.9) consist of proteins with a common property, such as proteins that associate with DNA, including topoisomerases, DNA repair proteins, DNA polymerases, and helicases, or, in another example, receptors of various molecules, like cytokines, developmental regulators (e.g. Hedgehog), or even motor proteins (e.g. myosin). Proteins in Figure 4.9 seem to be clustered based on function and biochemical properties rather than species, as homologs of proteins that serve similar purposes but originate from evolutionarily distant organisms (for instance, from Escherichia coli, Drosophila melanogaster, and Homo sapiens) tend to be grouped together in the plot. Thus, it would appear that embedding a dataset of proteins in reduced dimensionality retains their biochemical profile and spatially distributes them according to functional (and, therefore, probably also structural) similarity.
Figure 4.9 3D t-SNE visualization of 15,178 protein sequence embeddings, including reflectin (SoREF8) highlighted in red.
b. Place your protein in the resulting map and explain its position and similarity to its neighbors.
As I mentioned earlier, reflectins belong to a very unique and distinct family of proteins, as they reflect and refract light through self-assembling into intricate nano-layers within cells. Based on that, I was expecting SoREF8 to be positioned close to another cluster of proteins related to the emergence of structural color, which are mainly of bacterial origin. However, the latent space analysis visualized in Figures 4.9 and 4.10 was created with a dataset of 15,178 protein sequences, which, of course, did not include all the protein molecules ever discovered, only a portion of them, which is probably the reason no proteins associated with structural color were present in the plot or, at least, close to where reflectin was placed. On the contrary, the closest neighbour to reflectin appears to be a cluster of proteins mostly from multicellular organisms with bilateral symmetry, such as Hyalophora cecropia, Gallus gallus, Mus musculus, and Homo sapiens (Figure 4.10, black box). This cluster is particularly enriched in proteins acting as mediators or receptors facilitating immune responses (e.g. hemolin, IgA Fc receptor, interleukin-1 receptor, immunoglobulin heavy chain). Such a correlation seems bizarre, especially when taking into consideration reflectin’s loose secondary structure (Figures 4.3 - 4.7), allowing it to interact with photons, and the very intricate, characteristic, and β-sheet-abundant secondary structure of proteins of the immune system, which contributes to the formation of nooks and cavities for epitope recognition 16.
Figure 4.10 Close-up of the region surrounding reflectin in the 3D t-SNE visualization. Once again, reflectin (SoREF8) is shown in red, while its neighbouring protein cluster, enriched in proteins partaking in immune responses, is encapsulated in a black frame.
3.2 Protein folding
Folding a protein
a. Fold your protein with ESMFold. Do the predicted coordinates match your original structure?
By comparing Figures 4.3 and 4.11, I would say that wild-type reflectin’s coordinates as predicted by ESMFold’s algorithm do not match the structure provided by UniProt. However, this could possibly be explained if we take into account that SoREF8 belongs to a special family of intrinsically disordered proteins, hence the challenge of reliably and repeatedly generating its tertiary structure through separate computational tools.
Figure 4.11 Illustration of wild-type SoREF8’s structure from three different points of view. Figure generated by ESMFold.
b. Try changing the sequence, first try some mutations, then large segments. Is your protein structure resilient to mutations?
For this exercise, I will be comparing the ESMFold-predicted structures of different mutated variants of reflectin with the ESMFold-reconstructed wild-type protein.
Firstly, I experimented with three separate point mutations in SoREF8’s amino acid sequence either in regions “outside” of segments critical for the protein’s function (according to the deep mutational scan performed above) or “inside” those segments. For most of the point mutations I introduced, I decided to target amino acids significant to the structure of reflectins in general, therefore I mainly converted aromatic and sulfur-containing residues to alanine, which is small and chiral, while featuring a chemically inert, non-bulky methyl side group. In both cases of swapping amino acids outside and inside the regions identified by the mutational scan, the tertiary structure of reflectin (Figure 4.12A and B) did not seem to diverge dramatically from the wild-type (Figure 4.11), showing that the protein’s structure is quite resilient to point mutations in general.
Secondly, I tried converting entire segments of wild-type reflectin’s amino acid sequence into alanine arrays, once again both in regions outside and inside the domains that were identified as crucial for the protein’s folding and function. For this part, I converted whole arrays of 10 to 15 sequential amino acid residues to a series of alanines and, in contrast to the point mutations, these modifications resulted in noticeable changes in reflectin’s 3D structure. In both cases, but more intensely when the substitutions were positioned within the areas that are crucial for folding, reflectin’s tertiary structure became more elongated and enriched in α-helices (Figure 4.12C and D) compared to the wild-type (Figure 4.11), indicating that the protein cannot tolerate modifications of large amino acid segments.
Finally, I decided to swap three specific amino acids in the wild-type sequence with different ones, based on the mutations that were suggested by the deep mutational scan as favorable for optimized folding of the protein, namely replacing the residue at positions 110 and 157 with Q and the one at position 207 with M (Figure 4.8). This intervention did not appear to particularly affect the protein’s structure (Figure 4.12E compared to the wild-type in Figure 4.11) and this version of reflectin would most likely have to be experimentally tested in the wet lab to verify whether it actually contributes to optimized folding and, therefore, to optimized function.
Figure 4.12 Tertiary structure visualization of different mutated variants of SoREF8 from three different points of view as predicted by ESMFold: (A) SoREF8 Y58A_N182A_Q247A, (B) SoREF8 M104A_D161A_W222A, (C) SoREF8 30 - 40A_125 - 140A_235 - 250A, (D) SoREF8 100 - 110A_150 - 165A_215 - 230A, and (E) SoREF8 D110Q_N157Q_R207M. Figure generated by ESMFold.
3.3 Protein generation
Inverse-folding a protein
a. Let’s now use the backbone of your chosen PDB to propose sequence candidates via ProteinMPNN. Analyze the predicted sequence probabilities and compare the predicted sequence vs the original one.
As there is no tertiary structure submitted to PDB for SoREF8, I used the ESMFold prediction generated above as a prompt for ProteinMPNN. By deploying model v_48_020, ProteinMPNN produced the following amino acid sequence for SoREF8 based on the probability heatmap demonstrated in Figure 4.13:
Reflectin [Sepia officinalis] amino acid sequence created by ProteinMPNN
LAALLAALLPLLLLAAALAALLALLLGLPLLLLPLSLLTKNENGEWYDALGRLVDPRLLDPLGRLLLAELLLPGLPLLLLLLLPPELLALLLLLLLGPLALLDLSNFSLNSEGNWLDSEGNEVDPLSLLKYLPNGLLLPLLLLPLLLLPPLLLDLSKYTKNEEGEWLNEEGEVVDPLSLPLDEEEELLELPGLPLELLLLPLLLPLPLLDLSNFTLNEEGEWLNENGEPVDPEELLRLLLLPLDLLDPEALAPLKIEGFDFSKLYKNEEGEWYDENGNKINLEELEKLLNK
The BLASTp algorithm detected an 18.54% identity between the original SoREF8 amino acid sequence and the one predicted by ProteinMPNN. This discrepancy can mainly be attributed to the computational tool’s interpretation of reflectin’s probability heatmap (Figure 4.13). In particular, it appears that the ProteinMPNN software tends to place L and A residues in positions where there is probabilistically no prevalent amino acid (such as reflectin’s N-terminus in this case), while it has also replaced all M, C, H, and Q residues contained in the wild-type variant with one of the remaining 16 amino acids. Both types of intervention have drastically skewed the frequency with which each amino acid residue appears in the original and computationally generated sequences, leading to two fundamentally different peptide chains for the same protein molecule.
Figure 4.13 Heatmap illustrating the probability of each amino acid residue appearing at one of the 291 positions of reflectin’s peptide chain based on the wild-type’s tertiary structure as recreated by ESMFold. Figure generated with ProteinMPNN.
b. Input this sequence into ESMFold and compare the predicted structure to your original.
Compared to the tertiary structure of the original sequence as predicted by ESMFold (Figure 4.11), the folding of the ProteinMPNN-suggested peptide chain for reflectin seems to engage more α-helices and fewer β-sheets (Figure 4.14). The larger number of α-helices in the computationally recreated protein molecule renders it more compact (Figure 4.14) than the wild-type one, resulting in a 3D structure that is readily distinguishable from the original’s folding motif.
Figure 4.14 Visualization of the 3D structure for the amino acid sequence generated by ProteinMPNN with the ESMFold prediction of SoREF8’s structure as an input from three different points of view. Figure created with ESMFold.
Doig AJ. Frozen, but no accident - why the 20 standard amino acids were selected. FEBS J. 2017;284(9):1296-1305. doi:10.1111/febs.13982 ↩︎
Miller SL. A Production of Amino Acids Under Possible Primitive Earth Conditions. Science. 1953;117(3046):528-529. doi:10.1126/science.117.3046.528 ↩︎
Kvenvolden KA, Lawless JG, Ponnamperuma C. Nonprotein amino acids in the Murchison meteorite. Proc Natl Acad Sci USA. 1971;68(2):486-490. doi:10.1073/pnas.68.2.486 ↩︎
Egli M, Zhang S. Making sense of helices: right and wrong models in science and art. Mol Front J. 2023;07(01n02):71-81. doi:10.1142/S2529732523500086 ↩︎
Cole BJ, Bystroff C. Alpha helical crossovers favor right-handed supersecondary structures by kinetic trapping: the phone cord effect in protein folding. Protein Sci. 2009;18(8):1602-1608. doi:10.1002/pro.182 ↩︎↩︎
Liu L, Klausen LH, Dong M. Two-dimensional peptide-based functional nanomaterials. Nano Today. 2018;23:40-58. doi:10.1016/j.nantod.2018.10.008 ↩︎
Eskandari S, Guerin T, Toth I, Stephenson RJ. Recent advances in self-assembled peptides: Implications for targeted drug delivery and vaccine engineering. Advanced Drug Delivery Reviews. 2016;110-111:169-187. doi:10.1016/j.addr.2016.06.013 ↩︎
Samuel D, Kumar TK, Ganesh G, et al. Proline inhibits aggregation during protein refolding. Protein Sci. 2000;9(2):344-352. doi:10.1110/ps.9.2.344 ↩︎
Richardson JS, Richardson DC. Natural beta-sheet proteins use negative design to avoid edge-to-edge aggregation. Proc Natl Acad Sci USA. 2002;99(5):2754-2759. doi:10.1073/pnas.052706099 ↩︎
Shamsir MS, Dalby AR. Beta-sheet containment by flanking prolines: molecular dynamic simulations of the inhibition of beta-sheet elongation by proline residues in human prion protein. Biophys J. 2007;92(6):2080-2089. doi:10.1529/biophysj.106.092320 ↩︎
Zhang C, Kim SH. A comprehensive analysis of the Greek key motifs in protein β-barrels and β-sandwiches. Wiley Online Library. Published online August 15, 2000. doi:10.1002/1097-0134(20000815)40:3 ↩︎
Kramer RM, Crookes-Goodson WJ, Naik RR. The self-organizing properties of squid reflectin protein. Nat Mater. 2007;6(7):533-538. doi:10.1038/nmat1930 ↩︎↩︎
Umerani MJ, Pratakshya P, Chatterjee A, et al. Structure, self-assembly, and properties of a truncated reflectin variant. Proc Natl Acad Sci USA. 2020;117(52):32891-32901. doi:10.1073/pnas.2009044117 ↩︎↩︎
Janeway CA Jr, Travers P, Walport M, Shlomchik MJ. The structure of a typical antibody molecule. Immunobiology - NCBI Bookshelf. Published 2001. https://www.ncbi.nlm.nih.gov/books/NBK27144/↩︎
Week 5 homework
Protein design-Part II 💻
Part 1: SOD1 binder peptide design
Superoxide dismutase 1 (SOD1) is a cytosolic antioxidant enzyme that converts superoxide radicals into hydrogen peroxide and oxygen. In its native state, it forms a stable homodimer and binds copper and zinc.
Mutations in SOD1 cause familial Amyotrophic Lateral Sclerosis (ALS). Among them, the A4V mutation (Alanine → Valine at residue 4) leads to one of the most aggressive forms of the disease. The mutation subtly destabilizes the N-terminus, perturbs folding energetics, and promotes toxic aggregation.
This week, the assignment entails designing short peptides that bind mutant SOD1 and then deciding which ones are worth advancing toward therapy by using three models developed in the Chatterjee Lab.
A. Generate Binders with PepMLM
Begin by retrieving the human SOD1 sequence from UniProt (P00441) and introducing the A4V mutation.
Using the PepMLM Colab linked from the HuggingFace PepMLM-650M model card, generate four peptides of length 12 amino acids conditioned on the mutant SOD1 sequence.
To your generated list, add the known SOD1-binding peptide FLYRWLPSRRGG for comparison.
Record the perplexity scores that indicate PepMLM’s confidence in the binders.
Upon retrieving the Homo sapiens SOD1 (HsSOD1) peptide sequence from its UniProt page, I noticed that the alanine residue that is mutated in the A4V protein variant is in position 5 and not in position 4 of the peptide chain. This means that the methionine in position 1 of the nascent protein molecule is post-translationally cleaved during the protein’s maturation process 1. Based on this and after incorporating the A4V mutation into the peptide chain, the SOD1 sequence I decided to use for this week’s assignment is the following:
As the length and the number of the binding peptides had already been defined by the assignment, I thought it would be interesting to experiment with the k value, which, in the script we were given, was set to 3 2. As we can design only four peptides, I decided to “sacrifice” model confidence to a certain degree (and report higher perplexity values) in favor of diversity by increasing the k value to 4. The results of this analysis, including the known SOD1-binding peptide FLYRWLPSRRGG, are presented below, in Table 5.1.
Table 5.1 Peptide binders generated by PepMLM for the A4V mutant of SOD1, along with their perplexity scores and the known SOD1-binding peptide FLYRWLPSRRGG.
Peptide sequence
Control or test
Peptide perplexity
0
FLYRWLPSRRGG
Control
n/a
1
WLSPATVAARKX
Test
7.249112
2
WRYGAVGAKLWX
Test
9.529020
3
HRYVWTAARHKX
Test
13.445100
4
WRYGVAGVAHKX
Test
9.256418
B. Evaluate binders with AlphaFold3
After navigating to the AlphaFold Server, for each peptide, submit the mutant SOD1 sequence followed by the peptide sequence as separate chains to model the protein-peptide complex.
Record the ipTM score and briefly describe where the peptide appears to bind. Does it localize near the N-terminus where A4V sits? Does it engage the β-barrel region or approach the dimer interface? Does it appear surface-bound or partially buried?
In a short paragraph, describe the ipTM values you observe and whether any PepMLM-generated peptide matches or exceeds the known binder.
AlphaFold3 requires a defined peptide sequence to visualize protein-peptide interactions, which, I did not obtain for my test peptides, as can be seen by the “X” at position 12 in all four of them (possibly due to the increased k value I used). This provided a “loophole” I could capitalize on to experiment with several amino acid residues with different biochemical properties. So, I chose eight different amino acids out of the 20 proteinogenic ones, each representing a different chemical profile:
arginine (R), as an amino acid harboring a positively charged side chain
aspartic acid (D), as an amino acid harboring a negatively charged side chain
serine (S), as an amino acid harboring a polar but uncharged side chain
cysteine (C), as an amino acid harboring a S-containing side chain
glycine (G), as the only achiral amino acid
proline (P), because it has a straight-up weird structure and belongs to its own category
leucine (L), as an amino acid harboring a non-aromatic hydrophobic side chain and
tryptophan (W), as an amino acid harboring an aromatic and spatially-challenging-to-accomodate hydrophobic side chain.
Based on this rationale, instead of four, I tried 32 different peptides on AlphaFold3’s server, eight for each peptide template. After screening each peptide template with the eight different amino acids I had selected above, I decided to proceed with the amino acid combination that produced the highest ipTM score in each case. The results of this process are displayed in Table 5.2. I also experimented with simulating multiple copies of the same selected peptide interacting with SOD1 A4V. Nevertheless, this introduced a new level of complexity, as it had to integrate peptide-peptide interactions in the model too, so I opted not to continue with this approach.
Table 5.2 Peptide binders selected after a binding-based screening on AlphaFold3 for the A4V mutant of SOD1, along with their ipTM scores and including the known SOD1-binding peptide FLYRWLPSRRGG (iteration 1).
Peptide sequence
Control or test
ipTM
0
FLYRWLPSRRGG
Control
0.89
1
WLSPATVAARKC
Test
0.90
2
WRYGAVGAKLWC
Test
0.90
3
HRYVWTAARHKW
Test
0.90
4
WRYGVAGVAHKW
Test
0.91
Upon obtaining the four peptide binders presented in Table 5.2, I wondered if I could further improve them by replacing the final amino acid with a different one exhibiting similar biochemical properties, which, however, I arbitrarily chose not to include in the first iteration of my binding screening. For this second iteration, I swapped cysteine with methionine (M) for the first two peptides and tryptophan with phenylalanine (F) and tyrosine (Y) for the third and fourth PepMLM-generated peptides. As a result, the first peptide was further optimized with a methionine as its final amino acid residue (Table 5.3).
Table 5.3 Peptide binders selected after a binding-based screening on AlphaFold3 for the A4V mutant of SOD1, along with their ipTM scores and including the known SOD1-binding peptide FLYRWLPSRRGG (iteration 2).
Peptide sequence
Control or test
ipTM
0
FLYRWLPSRRGG
Control
0.89
1
WLSPATVAARKM
Test
0.91
2
WRYGAVGAKLWC
Test
0.90
3
HRYVWTAARHKW
Test
0.90
4
WRYGVAGVAHKW
Test
0.91
All peptides (0 - 4, as numbered in Table 5.3) appear to localize near the N-terminus of both monomers in the homodimer (Figure 5.1C-G). They also seem to approach the dimer interface, rather than engage the β-barrels, and they are all surface-bound (Figure 5.1C-G).
Figure 5.1 3D visualizations of SOD1 and SOD1 A4V with and without interacting with already known and PepMPL-generated binding peptides as computed by the AlphaFold3 server: (A) SOD1, (B) SOD1 A4V, (C) SOD1 A4V with the known binding peptide FLYRWLPSRRGG (peptide 0), (D) SOD1 A4V with the binding peptide WLSPATVAARKM (peptide 1), (E) SOD1 A4V with the binding peptide WRYGAVGAKLWC (peptide 2), (F) SOD1 A4V with the binding peptide HRYVWTAARHKW (peptide 3), and (G) SOD1 A4V with the binding peptide WRYGVAGVAHKW (peptide 4). Figure generated with AlphaFold3.
Among the PepMLM-generated peptides shown in Table 5.3, all four of them were assigned an ipTM score >0.8, indicating confident, high-quality, and successful predictions of the complex’s structure by the model. More importantly, peptides 1 - 4 were given higher ipTM scores than the known SOD1-binding peptide FLYRWLPSRRGG, which can be translated as a more accurate prediction of the relative positions among the components of the complex. Peptides 1 and 4 in particular scored 0.91 compared to the 0.89 ipTM score of peptide 0, rendering them promising alternatives at this stage of the analysis. As an additional measure of the peptides’ performance, I calculated their combined score as well, defined with the formula 0.8 x ipTM + 0.2 x pTM, to include their pTM metrics too 3. Once again, peptides 1 - 4 scored consistently higher than FLYRWLPSRRGG, with peptides 2 and 3 receiving a combined score of 0.904 over peptide 0’s 0.896, along with peptides 1 and 4 being assigned 0.914 for the same measure.
C. Evaluate properties of generated peptides in the PeptiVerse
Structural confidence alone is insufficient for therapeutic development. Using PeptiVerse, let’s evaluate the therapeutic properties of your peptide! For each PepMLM-generated peptide:
Paste the peptide sequence.
Paste the A4V mutant SOD1 sequence in the target field.
Check the boxes:
Predicted binding affinity
Solubility
Hemolysis probability
Net charge (pH 7)
Molecular weight
Compare these predictions to what you observed structurally with AlphaFold3. In a short paragraph, describe what you see. Do peptides with higher ipTM also show stronger predicted affinity? Are any strong binders predicted to be hemolytic or poorly soluble? Which peptide best balances predicted binding and therapeutic properties? Choose one peptide you would advance and justify your decision briefly.
To better simulate the binding target, which in this case, is an ion-recruiting protein homodimer, I inserted two copies of SOD1 A4V’s amino acid sequence in the designated field of the PeptiVerse interface. The predicted properties of the PepMLM-generated peptides are summarized below, in Table 5.4.
Table 5.4 SOD1 A4V-binding peptides’ properties as predicted by PeptiVerse, with the peptides either being known binders or having been generated with PepMLM.
Peptide sequence
Solubility
Haemolysis
Binding affinity
Molecular weight
Net charge (pH 7)
Isoelectric point
Hydrophobicity
0
FLYRWLPSRRGG
Soluble (100%)
Non-haemolytic (95.3%)
Weak binding (6.098pKd/pKi)
1,507.7Da
2.76
11.71
-0.71 GRAVY
1
WLSPATVAARKM
Soluble (100%)
Non-haemolytic (98.4%)
Weak binding (5.368pKd/pKi)
1,330.6Da
1.76
11.00
0.24 GRAVY
2
WRYGAVGAKLWC
Soluble (100%)
Non-haemolytic (92.4%)
Medium binding (7.831pKd/pKi)
1,409.7Da
1.75
9.31
0.15 GRAVY
3
HRYVWTAARHKW
Soluble (100%)
Non-haemolytic (98.3%)
Weak binding (5.572pKd/pKi)
1,610.8Da
2.93
11.00
-1.28 GRAVY
4
WRYGVAGVAHKW
Soluble (100%)
Non-haemolytic (96.8%)
Medium binding (7.799pKd/pKi)
1,429.6Da
1.85
9.99
-0.29 GRAVY
According to PeptiVerse’s predictions as presented in Table 5.4, all screened peptides are soluble (100% probability) and non-haemolytic (> 92% probability). It would also appear that higher ipTM scores do not necessarily correlate with a strong binding affinity to the protein variant. This is especially the case for peptide 1, which, despite receiving a 0.91 ipTM score, is anticipated to have weak binding affinity to the target. After obtaining the data above from PeptiVerse, I would choose to proceed with one the two peptides that displayed medium binding affinity, namely either peptide 2 or peptide 4. Since the discrepancy between their binding affinities is relatively small, I would advance peptide 4, which was assigned a 0.91 score with AlphaFold3 and demonstrates a higher probability of not causing haemolysis (96.8% > 92.4%).
D. Generate optimized peptides with moPPIt
Now, move from sampling to controlled design. moPPIt uses Multi-Objective Guided Discrete Flow Matching (MOG-DFM) to steer peptide generation toward specific residues and optimize binding and therapeutic properties simultaneously. Unlike PepMLM, which samples plausible binders conditioned on just the target sequence, moPPIt lets you choose where you want to bind and optimize multiple objectives at once.
After opening the moPPit Colab linked from the HuggingFace moPPIt model card, make a copy and switch to a GPU runtime.
In the notebook:
Paste your A4V mutant SOD1 sequence.
Choose specific residue indices on SOD1 that you want your peptide to bind (for example, residues near position 4, the dimer interface, or another surface patch).
Set peptide length to 12 amino acids.
Enable motif and affinity guidance (and solubility/hemolysis guidance if available). Generate peptides.
After generation, briefly describe how these moPPit peptides differ from your PepMLM peptides. How would you evaluate these peptides before advancing them to clinical studies?
For the generation of binding peptides through moPPit, I chose the “Haemolysis” and “Solubility” criteria with a weight of 2, as I considered them less significant than “Specificity”, to which I assigned a weight of 3, as well as “Affinity” and “Motif”, whose weights I increased to 7, since those two are the principal factors determining the structure of the peptide binders for this assignment. More specifically, for the “Motif” criterion, I designated amino acids 1 - 10, 106 - 112, and 140 - 153 as positions that should be primarily taken into account. The first region is where the A4V mutation resides, while the second seems to be related to the formation of two short β-sheets beneath the β-barrel regions; those structures are present in the mutant variant but not in the wildtype one (Figure 5.1B compared to A). Additionally, the C-terminus of the protein, here represented by residues 140 - 153, appears to be the main interface for the homodimer formation and stabilization, hence its inclusion as a region that should influence the generation of binding peptides. The newly-designed peptides can be found below (Table 5.5, Figure 5.2).
Table 5.5 Peptide binders for the A4V mutant of SOD1 generated by moPPit, along with their ipTM scores.
Peptide sequence
ipTM
1
KKKCGVLVVVHD
0.89
2
AVTMKRKPLFCQ
0.92
3
PKSQKVKTCVAQ
0.89
Figure 5.2 3D visualizations of SOD1 A4V interacting with moPPit-generated binding peptides as computed by the AlphaFold3 server: (A) SOD1 A4V with the binding peptide KKKCGVLVVVHD (peptide 1_moPPit), (B) SOD1 A4V with the binding peptide AVTMKRKPLFCQ (peptide 2_moPPit), and (C) SOD1 A4V with the binding peptide PKSQKVKTCVAQ (peptide 3_moPPit). Figure generated with AlphaFold3.
Before advancing any of the moPPit-generated peptides to clinical studies, I would first evaluate them through the PeptiVerse to assess their biochemical properties and screen for possible unintended effects. The results of this analysis are presented in Table 5.6.
Table 5.6 SOD1 A4V-binding peptides’ properties as predicted by PeptiVerse, with the peptides having been generated with moPPit.
Peptide sequence
Solubility
Haemolysis
Binding affinity
Molecular weight
Net charge (pH 7)
Isoelectric point
Hydrophobicity
1
KKKCGVLVVVHD
Soluble (100%)
Non-haemolytic (95.7%)
Tight binding (9.909pKd/pKi)
1,324.6Da
1.84
9.20
0.36 GRAVY
2
AVTMKRKPLFCQ
Soluble (100%)
Non-haemolytic (98.0%)
Weak binding (6.635pKd/pKi)
1,421.8Da
2.78
10.06
-0.09 GRAVY
3
PKSQKVKTCVAQ
Soluble (100%)
Non-haemolytic (98.4%)
Medium binding (8.371pKd/pKi)
1,316.6Da
2.95
9.81
-0.76 GRAVY
Stevens JC, Chia R, Hendriks WT, et al. Modification of superoxide dismutase 1 (SOD1) properties by a GFP tag–implications for research into amyotrophic lateral sclerosis (ALS). PLoS ONE. 2010;5(3):e9541. doi:10.1371/journal.pone.0009541 ↩︎
Chen T, Dumas M, Watson R, et al. PepMLM: Target Sequence-Conditioned Generation of Therapeutic Peptide Binders via Span Masked Language Modeling. arXiv. August 11, 2024. doi:10.48550/arxiv.2310.03842 ↩︎
Omidi A, Møller MH, Malhis N, Bui JM, Gsponer J. AlphaFold-Multimer accurately captures interactions and dynamics of intrinsically disordered protein regions. Proc Natl Acad Sci USA. 2024;121(44):e2406407121. doi:10.1073/pnas.2406407121 ↩︎
Week 6 homework
Genetic circuits-Part I: Assembly technologies 🧩
DNA Assembly
Answer these questions about the protocol in this week’s lab:
1. What are some components in the Phusion High-Fidelity PCR Master Mix and what is their purpose?
The components in the Phusion High-Fidelity PCR Master Mix, along with their purpose, are the following:
Phusion PCR buffer: The buffer solution ensures optimal salt concentration and pH conditions for the amplification reaction to take place, while also providing the Mg+2 ions needed for the polymerase’s catalytic activity.
Deoxyribonucleotides (dNTPs): This is a mix of A, T, G, and C nucleotides in equal concentrations (to prevent integration bias) which provides the building blocks necessary for the synthesis of the nascent DNA strands.
Phusion polymerase: This is the enzyme that, upon given a free 3’ -OH group and a complementary DNA strand, will catalyze the actual amplification step, where new strands are synthesized.
Dimethylsulfoxide (DMSO): DMSO can be added in especially challenging amplification reactions, in particular when the template sequence is particularly GC-rich. An increased GC content can lead to incomplete denaturation, as well as to the formation of secondary structures that lower PCR efficacy, therefore, a denaturing aid, such as DMSO, can reduce DNA melting temperature and non-specific binding for more effective amplification of the target sequence.
Nuclease-free water: If needed, nuclease-free water can be added to the PCR solution to reach the final volume of the reaction. This secures that all ingredients have the appropriate concentration for the amplification to happen and no degrading enzymes can endanger the template DNA or the nascent strands’ integrity.
The DNA template, as well as the primers, for the reaction are usually custom-designed and provided by the researcher.
2. What are some factors that determine primer annealing temperature during PCR?
The two primary factors determining primer annealing temperature are the primer’s length and its GC content. In general, the longer a primer is the higher its annealing temperature. The same holds true for a higher GC percentage, as in both cases the more hydrogen bonds formed between the template strand and the primer the stronger and more stable the annealing. Those two factors majorly influence the formation of secondary structures in primer molecules and primer dimers, which in turn affect PCR efficiency. However, the degree to which those two parameters influence primer annealing temperature is relative. For instance, a primer that is designed to introduce several point mutations at a short distance from one another (a “garland primer”) or a primer fabricated to insert an entirely novel small fragment to a sequence (a primer with a 5’ overhang), although seemingly longer, do not necessarily require a higher annealing temperature, at least not in the first cycles of the PCR, when the template DNA molecules outnumber the newly synthesized sequences. Similarly, apart from the GC content, the distribution of Gs and Cs in the primer can modulate its annealing point: primers with more than two or three sequential Gs and Cs accumulated at one point bind more firmly to their complementary strand and, thus, display higher Tms, than primers where Gs and Cs are more evenly spaced out and separated by brief arrays of As and Ts. The need for higher primer annealing temperatures can be alleviated by the addition of denaturing agents, such as DMSO as explained previously, which could also mildly impact the resulting primer Tm. Furthermore, the concentration of salts in the reaction, combined with their ionic strength, as well as the concentration of primers themselves, can influence annealing temperature too. An increased concentration of both can negate the electrostatic forces facilitating the formation of hydrogen bonds and favor non-specific binding respectively, resulting in the need for a higher annealing temperature.
3. There are two methods from this class that create linear fragments of DNA: PCR and restriction enzyme digests. Compare and contrast these two methods, both in terms of protocol as well as when one may be preferable to use over the other.
PCR and restriction enzyme digests show both similarities and differences. In terms of their respective protocols, conducting a PCR requires a thermocycler for the temperature to fluctuate during the different stages of the reaction, whereas restriction enzyme digests have to be incubated only at one specific temperature dictated by the restriction endonuclease (optionally, a second higher temperature, usually 80°C, can also be deployed for deactivating the enzyme). Additionally, the same three steps -denaturation, annealing, and extension- have to be repeated 25 - 30 times for a PCR, rendering it generally more time-consuming than a restriction digest, which does not involve any repeated steps. Apart from the DNA template, the buffer, and the respective enzyme in both techniques, PCR needs more reagents than a restriction endonuclease digestion, including the primers, the dNTPs, as well as the GC enhancers (like DMSO). Another difference lies in the lack of heat tolerance of restriction endonucleases used in digest reactions (as highlighted previously, they can be easily deactivated by increasing the reaction temperature), while DNA polymerases employed in PCRs are utilized exactly because they can withstand temperatures close to water’s boiling point and are even optimized for this specific property. On the other hand, there is a much wider variety of restriction enzymes that can be used for digests compared to the fewer variants of DNA polymerases commercially available. Lastly, while PCR requires the a priori designing of appropriate primers and restriction digests entail the selected endonuclease’s recognition site already existing in the DNA template, the products generated from both processes need column-based purification before being used in downstream applications.
Regarding their general use and purpose, as fundamental Molecular Biology techniques, they both generate linear DNA fragments. Nonetheless, in PCR, amplicons have blunt ends, whereas in restriction digests, digested DNA fragments can have 5’ or 3’ overhangs too. In many cases, both techniques are crucial for cloning designed DNA sequences, as they can isolate a particular DNA segment with great specificity and efficiency. Both techniques can be employed to confirm that the correct DNA fragment has indeed been inserted in an assembled construct after cloning is complete (and can be visualized with agarose gel electrophoresis), while they can also be combined on multiple occasions, for instance, to carry out a Gibson assembly or to degrade the remaining plasmid template through DpnI digestion after a PCR and before performing a bacterial transformation. On the contrary, PCR alone would be the preferred technique when the goal of the experiment is to insert a point mutation or a short new fragment to a known DNA sequence (with the suitable primers) or when the ultimate purpose of a reaction is simply to propagate and amplify DNA. PCR is a synthtic technique, leading to a much higher in vitro-synthesized nucleic acid yield and concentration than the initial one, which is, of course, not the case for restriction enzyme digestion, which can contain both in vitro- and in vivo-produced sequences. Concerning restriction enzyme digestion, it can be utilized when DNA needs to be broken down, for example, to decompose the plasmid template molecules after a PCR as mentioned above, or it can be employed for other cloning methods, such as Golden Gate assembly, which, traditionally, does not involve any PCR steps.
4. How can you ensure that the DNA sequences that you have digested and PCR-ed will be appropriate for Gibson cloning?
The first and most crucial step to ensure that PCR-amplified and digested DNA sequences are appropriate for Gibson cloning is to spend as much time as needed to design them correctly. During this phase, verifying that DNA segments are properly designed can be achieved by in silico simulating their assembly on a simulation software like Benchling. On a more practical note, apart from making sure to cautiously follow the steps of the designated protocols, PCR-amplified and digested DNA sequences should be purified through a column-based method and, ideally, have their concentration measured (for example, with a NanoDrop instrument) before any downstream processes. Lastly, prior to proceeding with the cloning, it is always a good idea to visualize the DNA amplicons and digested segments through agarose gel electrophoresis, to ensure that they were indeed generated and that they have the anticipated size as an indication that no mistakes had been made in previous experiments.
5. How does the plasmid DNA enter the E. coli cells during transformation?
For plasmid DNA to successfully enter E. coli cells during transformation, firstly, the correct positioning of the plasmid molecules on the periphery of the bacterial cells has to be ensured. Several chemical agents, such as MgCl2 and polyethylene glycol (PEG) 8000, are employed during the preparation of competent bacterial cells (bacteria that have been rendered available to receive exogenously procured DNA) to this end. In more detail, Mg+2 cations from MgCl2 help neutralize the negative charges of DNA’s phosphate backbone, allowing plasmids to approach and remain close to the bacterial cell walls, while extremely hydrophilic compounds, such as PEG, contribute to removing the aqueous coating of plasmid molecules, once again eliminating the barriers between the foreign DNA and the surface of the cells. This is further facilitated by keeping the cells about to be transformed on ice for approximately 10min. Once the plasmids are in position, a heat or electric shock during transformation effectively disrupts the integrity and continuity of the bacterial cell wall and cell membrane, which can result in circular DNA entering the cell. After the shock, bacteria are left to recover and repair their membranes, with a percentage of the cells having acquired an additional piece of DNA through the process.
6. Describe another assembly method in detail (such as Golden Gate Assembly).
Explain the other method in 5 - 7 sentences plus diagrams (either handmade or online).
Model this assembly method with Benchling or Asimov Kernel!
For this section, I decided to describe Golden Gate assembly, as it is one of the methods I am most familiar with. It is a versatile, highly efficient, one-pot, scarless cloning method that allows joining up to 30 DNA segments in a single reaction. As visual aids, I will use two slides from a workshop presentation we organized with other members of iGEM Athens 2022 for the 18th Autumn Assembly of the European Pharmaceutical Students Association (EPSA) held in Athens in November 2022.
A specific category of restriction endonucleases, namely type IIS restriction enzymes (such as BsaI and BsmBI), constitutes the basis of Golden Gate assembly. What distinguishes type IIS endonucleases from traditional restriction enzymes is that they recognize a specific sequence of nucleotides but cleave DNA several nucleotides downstream (therefore outside) of their recognition site. This property enables the generation of custom four-nucleotide overhangs with the use of solely one restriction enzyme (Figure 6.1).
Figure 6.1 Slide from a workshop presentation of iGEM Athens 2022 for the 18th Autumn Assembly of EPSA explaining the mechanism of function for traditional restriction enzymes compared to type IIS endonucleases.
Due to the creation of custom overhangs by just one restriction endonuclease, complex DNA constructs consisting of up to 30 distinct parts can be arranged in a specific predesignated order and assembled with an extremely low error rate in a one-pot reaction. If the design of the individual DNA segments is executed correctly, meaning with recognition sites “outward” of cleavage sites for inserts and the inverse for the selected backbone (recognition sites “inward” of cleavage sites), all parts should be assembled seamlessly (without leaving any restriction sites behind) with the right configuration (Figure 6.2). Besides the orientation of the recognition and cleavage sites, another design prerequisite is that insert fragments must not contain internal recognition sites for the chosen type IIS endonuclease, which can be removed via site-directed mutagenesis prior to assembly.
Figure 6.2 Slide from a workshop presentation of iGEM Athens 2022 for the 18th Autumn Assembly of EPSA illustrating how Golden Gate assembly enables building complex genetic circuits in a one-pot reaction.
Apart from the selected type IIS restriction enzyme(s), a T4 DNA ligase is included in the master mix too, so that both digestion and ligation occur in a single tube, typically through 30 - 60 consecutive cycles at the appropriate temperatures in a standard thermocycler. This protocol ensures that molecules of the desired final construct accumulate over time, as they lack the type IIS restriction sites, whereas incorrect products are re-digested. This recycling property secures high efficiency which, along with all the aforementioned advantages of Golden Gate assembly, render this cloning method ideal for various Synthetic Biology applications.
To model Golden Gate Assembly, I will assemble a simplified version of one of the transcriptional units I have designed for the idea I will probably pursue for my individual final project. This simplified version of the genetic circuit enables the expression of a reflectin from the common cuttlefish Sepia officinalis, namely the protein REF8 12, induced by the constitutive J23102 promoter from the Anderson Collection, mediated by the Elowitz RBS, and terminated by the double terminator B0015. Instead of writing a long passage explaining every step of the process and capturing screenshots throughout the document it, I thought it would be better to record my Benchling session of assembling the construct in a short video. As I had already uploaded all the genetic parts I needed and optimized their sequences, the video consists of roughly two parts: the first demonstrates the addition of recognition and cut sites for BsaI (the type IIS enzyme I used for the assembly) to both 5’- and 3’-sides of all parts and the second shows the actual assembly with Benchling’s respective tool. Lastly, in the interest of sharing some general information, I utilized the level 1 vector pTU1-A-lacZ as a plasmid backbone and standard Golden Gate Assembly fusion sites for all internal junctions.
Figure 6.3 Video recording the building process of the pTU1-A-REF8 vector for REF8 expression through Golden Gate Assembly. Figure created in Benchling.
Bassaglia Y, Bekel T, Da Silva C, et al. ESTs library from embryonic stages reveals tubulin and reflectin diversity in Sepia officinalis (Mollusca — Cephalopoda). Gene. 2012;498(2):203-211. doi:10.1016/j.gene.2012.01.100 ↩︎
Week 7 homework
Genetic circuits-Part II: Neuromorphic circuits and fungal biomaterials ⚙️
Part 1: Intracellular artificial neural networks (IANNs) 🧠
1. What advantages do IANNs have over traditional genetic circuits, whose input/output behaviors are Boolean functions?
IANNs offer several advantages over traditional genetic circuits, which are governed by Boolean logic, as they can integrate multiple inputs simultaneously to produce an output. Similar to biological brains, they can process information in a more adaptive manner, as they are capable of learning from cellular environments that constantly change, thus responding faster to fluctuations in their surroundings than conventional gene-regulation systems 1. Another one of their advantages is that they significantly improve decision-making accuracy inside cells by reducing noise in gene expression 2. This way, they also enable more complex computational tasks within living cells, in turn allowing the design of highly sophisticated cellular behaviors 3. This degree of scalability and control, along with their versatility, renders IANNs particularly well-suited for numerous applications in Synthetic Biology, especially in targeted therapies and personalized medicine, where the level of fine-tuning and precision that can be achieved with a genetic circuit plays a tremendously important role 23.
2. Describe a useful application for an IANN. Include a detailed description of input/output behavior, as well as any limitations an IANN might face to achieve your goal.
An important application for an IANN would be the development of a programmable “artificial pancreas” for autonomous diabetes treatment. In this system, engineered mammalian cells would contain a synthetic genetic circuit capable of sensing multiple physiological signals associated with blood glucose regulation and integrating them through neural-network-like computation 45. Unlike simple one-input genetic switches, this IANN could process combinations of glucose concentration, insulin levels, inflammatory cytokines, stress hormones such as cortisol, and metabolic indicators over time. The goal would be to mimic the decision-making behavior of pancreatic β-cells, while improving precision and adaptability in insulin delivery. Such a system could provide a long-term therapeutic treatment, especially for patients with Type 1 diabetes, reducing the need for continuous glucose monitoring devices and repeated insulin injections.
The input behavior of the IANN would involve multiple biological sensors embedded within the engineered mammalian cells. A glucose-sensitive promoter system, potentially based on carbohydrate-responsive transcription factors, such as ChREBP 6 or synthetic glucose-responsive elements, would detect elevated blood glucose levels. Additional sensors could detect inflammatory markers like IL-6 or TNF-α, since inflammation influences insulin sensitivity, while cortisol-responsive promoters could account for stress-induced glucose fluctuations. These signals would activate layered neural-network-like synthetic genetic circuits, designed to integrate weighted regulatory interactions between transcription factors, CRISPR interference mechanisms (such as the one mediated by Csy4 3, recombinases, and RNA regulators simultaneously rather than respond to glucose alone 45. The system could therefore distinguish between situations such as exercise, infection, stress, or fasting, each of which alters glucose metabolism differently.
Based on all the above, the primary output of the “artificial pancreas” IANN would be tightly controlled insulin production and secretion. When the integrated network determines that blood glucose is abnormally high and conditions are appropriate for insulin release, the engineered cells would express and secrete human insulin or insulin analogs 7. Additional outputs could include glucagon suppression factors or GLP-1-like peptides to improve glycemic control 8. The system could also include fluorescent or circulating reporter molecules that allow clinicians to monitor circuit activity noninvasively. Importantly, the network would ideally demonstrate dynamic learning-like behavior through adaptive regulatory thresholds, enabling more personalized glucose management over time. This would fundamentally improve traditional synthetic circuits that operate with rigid ON/OFF responses.
However, several limitations currently prevent IANNs from fully achieving this goal. One major challenge is the complexity of reliably engineering large intracellular genetic networks without unintended crosstalk, mutation, or metabolic burden on the host cell. Mammalian cells also exhibit noisy gene expression 9, which may result in excessive insulin production and increase the risk of hypoglycemia. Another constraint would be response speed: natural pancreatic β-cells regulate insulin secretion within minutes, whereas transcriptionally regulated synthetic circuits often respond much more slowly due to delays in transcription, translation, and protein secretion. Long-term stability is another concern, since implanted engineered cells may lose functionality or become immunogenic. Lastly, achieving true “learning” behavior analogous to computational neural networks mostly remains elusive because biological circuits exhibit limited memory capacity and constrained scalability 10.
3. Below is a diagram depicting an intracellular single-layer perceptron, where the X1 input is DNA encoding for the Csy4 endoribonuclease and the X2 input is DNA encoding for a fluorescent protein output whose mRNA is regulated by Csy4 (Tx: transcription; Tl: translation). Draw a diagram for an intracellular multi-layer perceptron where layer 1 outputs an endoribonuclease that regulates a fluorescent protein output in layer 2.
Figure 7.1 Schematic depiction of a single-layer intracellular perceptron regulated by the Csy4 endoribonuclease.
To design an intracellular mutli-layer perceptron as described in this exercise, I will need to incorporate two different endoribonucleases, regulating one layer each. The first layer will very closely resemble the neuromorphic circuit in Figure 7.1. The sole discrepancy will be that, in this case, instead of a fluorescent protein, the output will be a second endoribonuclease, more specifically one that recognizes a different RNA secondary structure than Csy4, for instance Cse3 (also known as CasE) 1112, to ensure the orthogonality of the system. Therefore, in a system designed like that, input X1 will trigger the synthesis of Csy4, which, in turn, will repress the expression of Cse3 from input X2 (Figure 7.2, purple). On the second layer now, induced by input Y1, the amount of produced Cse3 from the first layer will affect (meaning allow or repress) (Figure 7.2, yellow) the expression of its output, a blue fluorescent protein (Figure 7.2, blue), by sequestering the respective RNA molecules.
Figure 7.2 Schematic illustration of a two-layer neuromorphic circuit, where the output of the first layer (yellow) influences the output of the second layer (blue).
Part 2: Fungal materials 🍄
1. What are some examples of existing fungal materials and what are they used for? What are their advantages and disadvantages over traditional counterparts?
In general, fungal materials display several advantages compared to their conventional counterparts, mostly related to their sustainable production practices and biodegradability. Many types of “myco-materials”, as they are often called, are grown by recycling agricultural waste or other discarded organic substrates, contributing to a more sustainable circular bioeconomy with a notably lower carbon footprint than similar animal- and petroleum-based products. Unless they have undergone additional processing, they can also be biodegraded very quickly. On the other hand, many materials derived from fungi show lower durability than their traditional counterparts and may need to be enhanced with synthetic layers, ultimately rendering them less biodegradable. Another drawback involves significant challenges with their production, with costs remaining high and large-scale manufacturing still presenting limitations in particular.
More specific examples of existing fungal materials, along with their individual uses, as well as pros and cons compared to their conventional counterparts, include:
Mycelium leather: It is a mycelium-derived biomaterial, meaning it is composed of a root-like network of fungal hyphae. Its production generally requires less water, land, and energy and is faster than traditional leather, while it prevents animal slaughter, as well as the intensive use of toxic chemical compounds employed in tanneries. After the initial myco-material is generated, it is processed into sheets that resemble animal leather in texture and thickness, two features of its overall appearance that can be easily customized. Mycelium leather is mainly utilized in the fashion industry (for clothing, but also for the fabrication of other accessories, such as handbags and wallets), in footwear production, as well as in furniture and automotive interior spaces 1314, although its long-term aging properties are still being studied.
Mycelium acoustic panels: They are manufactured from mycelium-derived biomaterials, grown as breviously described. As the resulting composite myco-material has sound-absorbing qualities, it can be molded into a much wider range of shapes, forms, and aesthetic designs compared to conventional acoustic insulation panels. Furthermore, they are naturally more lightweight than their conventional counterparts and can be used for the quenching of sounds in offices and studios, for noise reduction in public spaces, but also simply in sustainable interior architecture as eco-friendly decorative materials 15. Nevertheless, they often lack in mechanical strength compared to synthetic materials and their performance consistency may vary depending on fungal growth conditions.
Mycelium bricks: They are biodegradable construction materials in which mycelium acts as a natural binder, forming lightweight solid blocks after drying and heat treatment. Their lower weight compared to conventional concrete or fired clay bricks helps reduce transportation and structural loads, while they also provide good thermal insulation. Additionally, they require far less energy expenditure than their conventional counterparts and can be used in temporary architectural structures, interior walls, insulation blocks, as well as in eco-friendly design installations 16. Mycelium bricks exhibit, however, lower compressive strength than traditional bricks, while building regulations for fungal materials are still limited in many areas across the world. On top of that, they are significantly less resistant to moisture and long-term weather exposure, which leads to their shorter lifespan in demanding outdoor conditions.
Fungal chitosan: It is a biodegradable and biocompatible polymer obtained from the cell walls of fungi, especially species from the genera Aspergillus and Mucor. This biopolymer is chemically similar to chitosan derived from crustacean shells, as they mostly contain the same biochemical compound, chitin, but is considered a more sustainable and vegan-friendly alternative. As it does not rely on animal sources (shellfish), it presents a lower risk of shellfish allergen contamination and can be produced independently of seasonal seafood waste availability than conventional chitosan. Another advantage pertains to its quality, which is generally more consistent than shellfish-derived biopolymers due to controlled fungal cultivation. Fungal chitosan is used for biomedicine, for example, drug delivery systems and wound dressings, for cosmetics and skincare products, for food preservation and packaging, as well as for water purification 17. Nonetheless, material properties can vary depending on fungal species and extraction methods, while commercial availability is still notably lower compared to conventional chitosan products.
2. What might you want to genetically engineer fungi to do and why? What are the advantages of doing synthetic biology in fungi as opposed to bacteria?
Fungi can be genetically engineered to biosynthesize an arsenal of useful compounds. Since fungi can naturally produce a wide variety of complex secondary metabolites, their rich repertoire of metabolic pathways can be further genetically modified and used for many Synthetic Biology applications, such as to synthesize medical compounds, including antibiotics, anticancer drugs, and therapeutic proteins 181920. This contribution of fungi to the biosynthesis of pharmaceuticals is especially useful considering that, unlike most bacteria, fungal cells can perform advanced post-translational modifications to the proteins they produce. Such complex post-translational modifications, especially glycosylation patterns, render fungi-synthesized therapeutic substances more stable and ensure specificity, along with proper activity of the pharmaceutical, while being more compatible with animal cells and, therefore, less likely to trigger toxic immune responses or allergies upon consumption by human patients. Another application of genetically engineered fungi concerns environmental cleanup and bioremediation, as genetically engineered fungi can break down plastics, oil, or other toxic pollutants 19. In agriculture, modified fungi can help plants absorb nutrients or resist diseases more effectively 19, while, in food technology, they can be utilized for generating alternative proteins or meat substitutes. Fungi hold significant potential as platforms for industrial production too, for example, in the production of biofuels 19. Compared to other hosts used for heterologous protein biomanufacturing, such as bacteria, fungi can generally tolerate harsher industrial conditions, such as low pH environments. In addition, engineered fungi can be employed for industrial production of enzymes, which, unlike bacteria, they readily and efficiently secrete in large amounts into their environment, facilitating the purification process 1920. Lastly, compared to bacterial microorganisms used in biotechnology, fungi can be easily cultivated on inexpensive agricultural waste, thus reducing production costs and promoting sustainability. Taking into account that fungal filamentous growth allows them to colonize solid substrates as well, modified fungi can also be harnessed for the biomanufacturing of biomaterials and biopolymers for packaging and construction, as analyzed in the previous question.
Halužan Vasle A, Moškon M. Synthetic biological neural networks: From current implementations to future perspectives. BioSystems. 2024;237:105164. doi:10.1016/j.biosystems.2024.105164 ↩︎
Chen YY, Galloway KE, Smolke CD. Synthetic biology: advancing biological frontiers by building synthetic systems. Genome Biol. 2012;13(2):240. doi:10.1186/gb-2012-13-2-240 ↩︎↩︎
Jones RD, Qian Y, Siciliano V, et al. An endoribonuclease-based feedforward controller for decoupling resource-limited genetic modules in mammalian cells. Nat Commun. 2020;11(1):5690. doi:10.1038/s41467-020-19126-9 ↩︎↩︎↩︎
Pandi A, Koch M, Voyvodic PL, et al. Metabolic perceptrons for neural computing in biological systems. Nat Commun. 2019;10(1):3880. doi:10.1038/s41467-019-11889-0 ↩︎↩︎
Saltepe B, Kehribar EŞ, Su Yirmibeşoğlu SS, Şafak Şeker UÖ. Cellular Biosensors with Engineered Genetic Circuits. ACS Sens. 2018;3(1):13-26. doi:10.1021/acssensors.7b00728 ↩︎↩︎
Ortega-Prieto P, Postic C. Carbohydrate sensing through the transcription factor CHREBP. Frontiers in Genetics. 2019;10:472. doi:10.3389/fgene.2019.00472 ↩︎
Chouhan R, Goswami S, Bajpai AK. Recent advancements in oral delivery of insulin: from challenges to solutions. In: Elsevier eBooks. ; 2017:435-465. doi:10.1016/b978-0-323-47720-8.00016-x ↩︎
Zhang J, Zheng Y, Martens L, Pfeiffer AFH. The regulation and secretion of glucagon in response to nutrient composition: unraveling their intricate mechanisms. Nutrients. 2023;15(18). doi:10.3390/nu15183913 ↩︎
Raj A, van Oudenaarden A. Nature, nurture, or chance: stochastic gene expression and its consequences. Cell. 2008;135(2):216-226. doi:10.1016/j.cell.2008.09.050 ↩︎
Yehl K, Lu T. Scaling computation and memory in living cells. Curr Opin Biomed Eng. 2017;4:143-151. doi:10.1016/j.cobme.2017.10.003 ↩︎
Niewoehner O, Jinek M, Doudna JA. Evolution of CRISPR RNA recognition and processing by Cas6 endonucleases. Nucleic Acids Res. 2014;42(2):1341-1353. doi:10.1093/nar/gkt922 ↩︎
Parikh SJ, Terron HM, Burgard LA, et al. Targeted Control of Gene Expression Using CRISPR-Associated Endoribonucleases. Cells. 2025;14(7):543. doi:10.3390/cells14070543 ↩︎
Devi R, Kaur T, Guleria G, et al. Fungal secondary metabolites and their biotechnological applications for human health. In: Elsevier eBooks. ; 2020:147-161. doi:10.1016/b978-0-12-820528-0.00010-7 ↩︎
Meyer V, Basenko EY, Benz JP, et al. Growing a circular economy with fungal biotechnology: a white paper. Fungal Biol Biotechnol. 2020;7:5. doi:10.1186/s40694-020-00095-z ↩︎↩︎↩︎↩︎↩︎
1. Explain the main advantages of cell-free protein synthesis over traditional in vivo methods, specifically in terms of flexibility and control over experimental variables. Name at least two cases where cell-free expression is more beneficial than cell production.
Compared to conventional in vivo methods, cell-free protein synthesis provides modularity and substantially higher experimental control, as all the system’s components can be readily added or removed, especially when the strategy employed is to separately produce or extract each cellular element required for the process and then combine them all together into a single reaction. Cell-free systems also offer the potential for precise control over reaction conditions, such as pH and ion concentration, while being more flexible and versatile since they allow the expression of proteins deleterious to living cells, support the integration of non-natural and non-canonical amino acids into peptide backbones, and are compatible with diverse DNA templates (linear or plasmid). Additionally, they eliminate constraints imposed by the existence of living cells. For instance, unlike traditional cell cultures, they do not need any monitoring, cultivating, or other interventions aimed at preservation, nor are they susceptible to issues of cell viability, growth limits, or stress responses. Similarly, since the cell-free apparatus exists outside of the context of a cellular platform, there are no cell-membrane barriers, facilitating access to biochemical reactions, while, at the same time, there is no interference or competition from other metabolic procedures or regulatory signals, enabling all the available resources to be channeled towards the synthesis of the desired protein, which, in addition, can later be purified more easily, without impurities. The absence of living cells can be translated into abolishing the need for cloning and cellular transformation as well, which, in turn, ensures safer handling, as no genetically modified organisms are involved in cell-free protein production. More generally, one of the method’s most significant advantages is that it is a highly efficient technique for rapid protein synthesis that can also withstand being transferred across larger distances for longer periods of time, as the entire system can be easily freeze-dried and stored for later use 1.
For more tangible examples, more specific cases where cell-free expression is more beneficial than cell-dependent protein production are presented below:
In theranostic applications, where the system has to be implanted in close proximity or inside the human body. Since no living cells are implicated, whose parts could potentially be recognized as harmful agents, the probability for a toxic immune or allergic reaction is low.
In experiments conducted to study the foundations of transcription and translation. The isolation of a cell-free platform ensures the appropriate conditions to investigate gene expression mechanisms without the background noise from other cellular processes.
For remote field testing, as cell-free systems generally require far less infrastructure than traditional cell-based production installations. Because of this, cell-free platforms can very easily be converted into portable platforms, enabling carrying out experiments, for instance, even in space.
For on-demand biomanufacturing, since, not only are all the system’s resources directed to the generation of the desired product, but also cell-free systems can achieve higher titers in considerably less time (minutes to hours instead of days). Apart from the efficiency, the desired product is less contaminated with unwanted cellular metabolites, allowing for higher purity and, therefore, for the implementation of less complex purification methods.
2. Describe the main components of a cell-free expression system and explain the role of each component.
The main input of cell-free systems is a circular or linear DNA sequence that contains the gene to be expressed (including an appropriate promoter), while the principal output is a desired protein. The first step for the expression of the gene involves its transcription, for which the enzyme RNA polymerase is required, along with Mg2+ ions, which act as essential co-factors. For the mRNA of the desired gene to be physically synthesized, the cell-free system should contain the needed building blocks too, namely nucleotides. To effectively translate the transcript into protein, the reaction should also have access to ribosomes and tRNA molecules, which will build the peptide sequence and carry the amino acids (found in the solution too) to the correct position of the nascent peptide respectively. Lastly, the energy required for this entire machinery to function can be obtained with the addition of ATP into the cell-free system.
3. Why is energy provision regeneration critical in cell-free systems? Describe a method you could use to ensure continuous ATP supply in your cell-free experiment.
Despite their many advantages, cell-free systems are also characterized by their inability to regenerate energy, mostly due to their lack of intricate cellular structures, such as intracellular compartments and membrane protein complexes, which in naturally occurring cellular systems, play a major role in energy-procuring metabolic pathways, such as glycolysis and the Krebs Cycle. For this reason, it is critical to “recharge” cell-free platforms of protein production with the frequent addition of ATP.
However, instead of constantly supplying a cell-free system with external ATP, it is more efficient to embed the capability of regenerating its energy resources into the cell-free reaction from the beginning. To achieve this, the most straightforward way involves adding two more factors to the components listed in the previous question, which can restore ATP from ADP (the product of ATP expenditure). Those two reagents are, firstly, a molecule that acts as a donor of a phosphate group and, secondly, an enzyme, a kinase in particular, that can catalyze the “reattachement” of the phosphate moiety to ADP to produce ATP in what is biochemically called a “substrate-level phosphorylation”. Fortunately, there are multiple combinations of such reagents that can readily be used in cell-free systems, with the most popular including creatine phosphate and creatine kinase 2, acetyl phosphate and acetate kinase 34, as well as polyphosphate and polyphosphate kinase 2.
4. Compare prokaryotic versus eukaryotic cell-free expression systems. Choose a protein to produce in each system and explain why.
Prokaryotic cell-free expression systems, most commonly derived from Escherichia coli extracts, are valued for their speed, low cost, and high protein yield. These systems contain the transcriptional and translational machinery needed to synthesize proteins in vitro without living cells, making them ideal for rapid protein production and synthetic biology applications. However, they have limited ability to perform complex post-translational modifications such as glycosylation or correct disulfide bond formation. A suitable protein to produce in a prokaryotic cell-free system would be insulin or green fluorescent protein (GFP). GFP is especially appropriate because it is relatively small, folds efficiently in bacterial conditions, and does not require extensive modifications to become functional, allowing high yields and straightforward analysis.
Eukaryotic cell-free expression systems, derived from sources such as wheat germ, insect cells, or rabbit reticulocytes, are more suitable for synthesizing complex eukaryotic proteins. Although these systems are generally more expensive and slower than prokaryotic systems, they better support proper protein folding, disulfide bond formation, and post-translational modifications. A good example of a protein to produce in a eukaryotic cell-free system is a monoclonal antibody or a membrane receptor such as the human epidermal growth factor receptor (EGFR). These proteins require sophisticated folding and modification machinery to function correctly, which eukaryotic systems can provide. Therefore, the choice between prokaryotic and eukaryotic cell-free expression depends largely on the structural complexity and modification requirements of the target protein.
5. How would you design a cell-free experiment to optimize the expression of a membrane protein? Discuss the challenges and how you would address them in your setup.
Designing a cell-free experiment to optimize membrane protein expression would involve systematically testing reaction conditions that improve protein synthesis, folding, and membrane insertion. I would use a eukaryotic cell-free system, such as a wheat germ or insect-cell extract, because membrane proteins often require complex folding machinery and a lipid environment. The experiment would include adding artificial membrane mimics such as liposomes, nanodiscs, or detergent micelles directly into the reaction mixture so the newly synthesized protein can insert into a membrane-like structure during translation. To optimize expression, I would vary factors such as magnesium and potassium ion concentrations, temperature, reaction duration, and the concentration of membrane additives. Protein yield and functionality could then be measured using fluorescence tags, Western blotting, or ligand-binding assays to identify the conditions that produce the highest amount of properly folded protein.
One major challenge in membrane protein expression is that these proteins are highly hydrophobic and tend to aggregate or misfold when removed from a membrane environment. Another difficulty is achieving correct orientation and functional conformation, since many membrane proteins rely on lipid interactions for stability. To address these issues, I would include nanodiscs or specific lipid compositions that resemble the protein’s natural membrane environment, helping stabilize the protein during synthesis. Molecular chaperones could also be added to assist folding and reduce aggregation. Because overexpression can overwhelm the system and produce inactive protein, I would test different DNA template concentrations and slower reaction temperatures to encourage proper folding. By combining controlled optimization with membrane-mimicking components and folding aids, the experiment would increase the likelihood of producing a functional membrane protein suitable for structural or biochemical studies.
6. Imagine you observe a low yield of your target protein in a cell-free system. Describe three possible reasons for this and suggest a troubleshooting strategy for each.
One possible reason for low protein yield is poor quality or degraded DNA template. If the plasmid or linear DNA used in the cell-free reaction is damaged, transcription efficiency will decrease and less mRNA will be available for translation. To troubleshoot this issue, I would verify DNA integrity using gel electrophoresis, measure purity with spectrophotometry, and prepare fresh, highly purified DNA templates. Using stronger promoters or optimizing codon usage could also improve transcription and translation efficiency.
A second cause may be inefficient transcription or translation conditions within the reaction mixture. Incorrect concentrations of magnesium ions, potassium ions, amino acids, or energy substrates can significantly reduce protein synthesis. To address this, I would systematically optimize reaction conditions by testing different ion concentrations, incubation temperatures, and reaction times. Small-scale screening experiments would help identify the combination that produces the highest protein yield.
A third issue could be rapid degradation of mRNA or the synthesized protein by nucleases or proteases present in the extract. Degradation reduces the amount of functional product that accumulates during the reaction. Troubleshooting strategies would include using nuclease- or protease-deficient extracts, adding RNase inhibitors or protease inhibitors, and minimizing reaction handling time to protect reaction components from contamination.
Another possible reason is improper protein folding, especially for large, complex, or membrane-associated proteins. Misfolded proteins may aggregate and become inactive, reducing the apparent yield of soluble target protein. To solve this problem, I would lower the reaction temperature to slow translation and improve folding, add molecular chaperones to assist proper protein assembly, or include detergents, liposomes, or nanodiscs if working with membrane proteins.
Finally, codon bias can limit protein production if the target gene contains codons that are rarely used by the expression system. In prokaryotic systems, rare codons can stall ribosomes and decrease translation efficiency. A useful troubleshooting strategy would be codon optimization of the gene sequence for the host extract being used or supplementing the reaction with rare tRNAs. This can improve ribosome movement and increase overall protein synthesis.
Homework question from Kate Adamala
Design an example of a useful synthetic minimal cell as follows:
Pick a function and describe it.
What would your synthetic cell do? What is the input and what is the output?
Could this function be realized by cell-free Tx/Tl alone, without encapsulation?
Could this function be realized by genetically modified natural cell?
Describe the desired outcome of your synthetic cell operation.
Design all components that would need to be part of your synthetic cell.
What would be the membrane made of?
What would you encapsulate inside? Enzymes, small molecules.
Which organism your Tx/Tl system will come from? Is bacterial OK, or do you need a mammalian system for some reason? (hint: for example, if you want to use small molecule modulated promotors, like Tet-ON, you need mammalian)
How will your synthetic cell communicate with the environment? (hint: are substrates permeable? or do you need to express the membrane channel?)
Experimental details
List all lipids and genes. (bonus: find the specific genes; for example, instead of just saying “small molecule membrane channel” pick the actual gene.)
How will you measure the function of your system?
Design of a Synthetic Minimal Cell for Saltwater Desalination
Proposed Function of the Synthetic Minimal Cell
Overview
The proposed synthetic minimal cell is designed to remove sodium chloride (NaCl) from saltwater through biologically inspired ion transport. The synthetic cell acts as a programmable microscopic desalination unit that selectively imports sodium and chloride ions from the environment and traps them internally.
The design combines:
Selective ion transport
ATP-driven active transport
Osmotic regulation
Artificial membrane engineering
Cell-free transcription/translation (Tx/Tl)
This system is inspired by natural ion-transporting cells such as kidney epithelial cells, halophilic microorganisms, and marine ion-regulating organisms.
2. What Would the Synthetic Cell Do?
Input
The input is saltwater containing:
Sodium ions (Na+)
Chloride ions (Cl−)
Water
Output
The outputs are:
Water with reduced salt concentration outside the synthetic cells.
Accumulation of NaCl inside the synthetic cells.
Optional fluorescent signal indicating transport activity.
Functional Logic
Sodium and chloride ions encounter the synthetic cell membrane.
Membrane transport proteins selectively move ions into the synthetic cell.
ATP-driven pumps concentrate ions internally against their gradients.
Internal osmoprotectants stabilize the synthetic cell.
Synthetic cells are physically separated from purified water using filtration or magnetic recovery.
The overall effect is extraction of salt ions from the surrounding water.
3. Could This Function Be Realized by Cell-Free Tx/Tl Alone Without Encapsulation?
No, not efficiently.
Desalination fundamentally depends on compartmentalization and membrane gradients. Without encapsulation:
Ion gradients cannot be maintained.
Active transport becomes impossible.
Selective accumulation of ions cannot occur.
Osmotic separation cannot be achieved.
Bulk cell-free Tx/Tl could express transport proteins, but membrane-bound compartments are essential for desalination.
Therefore, encapsulation is a core requirement for this application.
4. Could This Function Be Realized by a Genetically Modified Natural Cell?
Yes.
Halophilic bacteria or engineered yeast could accumulate salt through native transport systems.
However, synthetic minimal cells offer major advantages:
No replication
Lower biosafety concerns
No environmental evolution
Reduced metabolic waste
Higher predictability
Easier engineering of membrane composition
Simplified transport optimization
Natural cells devote significant energy to survival and growth, whereas synthetic cells can dedicate nearly all resources to desalination.
5. Desired Outcome of Synthetic Cell Operation
The desired operational outcome is:
Efficient uptake of Na+ and Cl− from saltwater.
Stable retention of ions inside the synthetic cell.
Production of desalinated external water.
Long-term membrane stability.
Low energy consumption.
Recovery and reuse of synthetic cells.
An ideal system would continuously reduce external salinity while maintaining transport activity for extended periods.
6. Components Required for the Synthetic Cell
A. Membrane System
Membrane Composition
The synthetic cell membrane would consist of highly stable phospholipid vesicles with embedded ion transport proteins.
High internal salt accumulation creates osmotic stress.
To stabilize the synthetic cell, encapsulate:
Molecule
Function
Trehalose
Osmotic protection
Glycine betaine
Protein stabilization
Proline
Osmoprotection
These molecules are commonly used by halophilic organisms.
7. Which Organism Should the Tx/Tl System Come From?
A bacterial system is appropriate.
Recommended Source
Escherichia coli cell-free Tx/Tl extract.
Why?
High protein production
Low cost
Well-characterized
Compatible with membrane protein synthesis
Easy scaling
However, membrane proteins are difficult to express.
Therefore:
Additional chaperones should be included.
Nanodiscs or detergent-assisted folding may be required.
A mammalian system is unnecessary because:
No glycosylation is required.
Ion pumps can function in bacterial-compatible systems.
Energy efficiency is better in bacterial extracts.
8. Communication with the Environment
How Will Salt Enter?
Sodium Transport
Na+/K+-ATPase actively imports sodium ions.
Chloride Transport
Halorhodopsin imports chloride ions using light energy.
Water Transport
Aquaporin Z enables rapid water equilibration.
Why Use Halorhodopsin?
Gene: hr
Source organism: Halobacterium salinarum
Advantages:
Light-powered chloride transport
No ATP required
Extremely stable in high salt
Efficient membrane insertion
This reduces external energy requirements.
9. Energy System
ATP Generation
Active ion transport requires ATP.
The synthetic cell would use a hybrid energy system:
Internal ATP Regeneration
Phosphoenolpyruvate (PEP)
Pyruvate kinase
Light-Driven Proton Gradient
Bacteriorhodopsin generates a proton gradient.
ATP synthase converts this gradient into ATP.
This creates a semi-autonomous energy cycle.
10. Experimental Details
A. Full Lipid List
Lipid
Approximate Percentage
POPC
45%
Cholesterol
25%
Cardiolipin
15%
DOPG
10%
DSPE-PEG2000
5%
B. Full Gene List
Gene
Source Organism
Function
hr
Halobacterium salinarum
Chloride pump
bop
Halobacterium salinarum
Proton pump
aqpZ
Escherichia coli
Water channel
atpA/B/E/F/H/I
Escherichia coli
ATP synthase complex
atp1a1
Mammalian sodium pump alpha subunit
Sodium transport
atp1b1
Mammalian sodium pump beta subunit
Sodium transport
sfGFP
Engineered GFP
Activity reporter
C. Membrane Protein Reconstitution
Membrane proteins would be inserted using:
Detergent-mediated reconstitution
Nanodisc-assisted insertion
Cell-free co-translational insertion
Nanodiscs improve folding and activity of membrane proteins.
D. Encapsulation Method
Recommended methods:
Microfluidic double-emulsion production
Water-in-oil emulsion transfer
Microfluidics provides:
Uniform vesicle size
High reproducibility
Controlled protein density
11. Measuring System Function
A. Salinity Measurement
Measure external salt concentration using:
Conductivity meter
Ion-selective electrodes
Flame photometry
Expected result:
Progressive reduction in external NaCl concentration.
B. Internal Ion Accumulation
Measure internal sodium/chloride using:
Sodium-sensitive fluorescent dyes
Chloride-sensitive dyes
ICP-MS (Inductively Coupled Plasma Mass Spectrometry)
Expected result:
Increasing ion concentration inside synthetic cells.
C. ATP Measurement
Use luciferase ATP assays.
Purpose:
Verify active transport energetics.
D. Membrane Integrity
Use:
Calcein leakage assay
Rhodamine membrane dyes
Cryo-electron microscopy
Purpose:
Confirm vesicle stability under osmotic stress.
E. Protein Expression Validation
Confirm transporter expression using:
SDS-PAGE
Western blotting
Fluorescence labeling
12. Potential Challenges and Proposed Solutions
Challenge
Proposed Solution
Osmotic bursting
Add cholesterol and osmoprotectants
Low ATP supply
Light-driven ATP regeneration
Membrane protein misfolding
Use chaperones and nanodiscs
Transport inefficiency
Increase transporter density
Vesicle instability
PEGylated lipids and optimized lipid ratios
Ion leakage
Use tighter membrane compositions
13. Practical Deployment Strategy
The synthetic cells could be:
Immobilized in filtration membranes
Packed into microfluidic desalination cartridges
Recovered magnetically using embedded nanoparticles
Continuously illuminated for energy generation
A practical desalination device would likely combine millions of synthetic cells in parallel.
14. Limitations of the System
Although scientifically plausible, major engineering challenges remain:
Active transport rates may be too low for industrial desalination.
ATP generation efficiency is limited.
Long-term vesicle stability remains difficult.
Membrane protein integration is technically demanding.
Synthetic cells may saturate with salt.
Therefore, this system is currently more realistic as:
A proof-of-concept synthetic biology platform
A microscale desalination system
A research tool for artificial cell engineering
rather than a full industrial replacement for reverse osmosis.
15. Broader Applications
The same framework could be adapted for:
Heavy metal removal
Radioactive ion capture
Water purification
Environmental remediation
Smart biosensing
Artificial organelles
By replacing transport proteins, synthetic cells could selectively remove many dissolved contaminants.
16. References
Schwille P et al. MaxSynBio: Avenues towards creating cells from the bottom up. Angewandte Chemie International Edition. 2018;57(41):13382-13392.
Silverman AD, Karim AS, Jewett MC. Cell-free gene expression: an expanded repertoire of applications. Nature Reviews Genetics. 2020;21:151-170.
Rigaud JL, Levy D. Reconstitution of membrane proteins into liposomes. Methods in Enzymology. 2003;372:65-86.
Noireaux V, Libchaber A. A vesicle bioreactor as a step toward an artificial cell assembly. Proceedings of the National Academy of Sciences. 2004;101(51):17669-17674.
Elani Y, Law RV, Ces O. Vesicle-based artificial cells as chemical microreactors with spatially segregated reaction pathways. Nature Communications. 2014;5:5305.
Hwang WL, Chen M, Cronin B, Holden MA, Bayley H. Asymmetric droplet interface bilayers. Journal of the American Chemical Society. 2008;130(18):5878-5879.
Gonen T, Walz T. The structure of aquaporins. Quarterly Reviews of Biophysics. 2006;39(4):361-396.
Lanyi JK. Bacteriorhodopsin. Annual Review of Physiology. 2004;66:665-688.
Kolbe M, Besir H, Essen LO, Oesterhelt D. Structure of the light-driven chloride pump halorhodopsin at 1.8 Å resolution. Science. 2000;288(5470):1390-1396.
Lee MT, Sun TL, Hung WC, Huang HW. Process of inducing pores in membranes by melittin. Proceedings of the National Academy of Sciences. 2013;110(35):14243-14248.
Kuruma Y, Ueda T. The PURE system for the cell-free synthesis of membrane proteins. Nature Protocols. 2015;10:1328-1344.
Murtas G. Artificial assembly of a minimal cell. Molecular BioSystems. 2009;5(11):1292-1297.
Phillips R, Kondev J, Theriot J, Garcia H. Physical Biology of the Cell. Garland Science. 2012.
Homework question from Peter Nguyen
Freeze-dried cell-free systems can be incorporated into all kinds of materials as biological sensors or as inducible enzymes to modify the material itself or the surrounding environment. Choose one application field — Architecture, Textiles/Fashion, or Robotics — and propose an application using cell-free systems that are functionally integrated into the material. Answer each of these key questions for your proposal pitch:
Write a one-sentence summary pitch sentence describing your concept.
How will the idea work, in more detail? Write 3-4 sentences or more.
What societal challenge or market need will this address?
How do you envision addressing the limitation of cell-free reactions (e.g., activation with water, stability, one-time use)?
A smart athletic fabric embedded with freeze-dried cell-free biosensors that activates with sweat to detect dehydration, heat stress, and harmful environmental pollutants in real time through visible color changes.
How the Idea Works
The textile would contain microcapsules filled with freeze-dried cell-free transcription/translation systems integrated directly into the fibers of sportswear or outdoor clothing. When the wearer sweats, moisture rehydrates the cell-free components and activates engineered genetic circuits designed to respond to biomarkers such as sodium concentration, pH, cortisol, or airborne toxins absorbed into sweat. Depending on the detected signal, the fabric would produce visible pigments or fluorescent proteins that change color in specific regions of the clothing. For example, a blue-to-red color shift could warn the user of dehydration, while a fluorescent signal under UV light could indicate dangerous pollution exposure during exercise in urban environments. Because the reactions are cell-free, the system avoids risks associated with living genetically modified organisms while remaining lightweight, flexible, and inexpensive to manufacture.
Societal Challenge or Market Need
This concept addresses the growing demand for wearable health-monitoring technologies that are affordable, noninvasive, and continuously accessible. Athletes, construction workers, military personnel, and people exposed to extreme heat increasingly face dehydration and heat-related illnesses, especially as climate change intensifies global temperatures. Existing wearable electronics often require batteries, sensors, and complex hardware that increase cost and reduce comfort. A biologically integrated textile could provide passive, low-cost physiological monitoring without electronics, making health tracking more accessible in both high-performance sports and low-resource settings. In addition, pollution-sensitive fabrics could help individuals monitor air quality exposure in heavily industrialized or urban areas.
Addressing Limitations of Cell-Free Reactions
Several strategies could improve the practicality of the system despite the limitations of cell-free reactions. To address activation requirements, the system intentionally uses sweat as the hydration trigger, ensuring activation only during wear. Stability could be improved by freeze-drying the Tx/Tl components with protective sugars such as trehalose and embedding them inside hydrogel microcapsules that shield them from oxygen, UV light, and mechanical stress. Because many cell-free systems are single-use, the textile could incorporate replaceable sensing patches or layered fiber compartments that sequentially activate over time, extending garment lifespan. Additionally, low-temperature storage coatings and moisture-resistant packaging could preserve functionality during shipping and storage before use.
Homework question from Ally Huang
Freeze-dried cell-free reactions have great potential in space, where resources are constrained. As described in my talk, the Genes in Space competition challenges students to consider how biotechnology, including cell-free reactions, can be used to solve biological problems encountered in space. While the competition is limited to only high school students, your assignment will be to develop your own mock Genes in Space proposal to practice thinking about biotech applications in space!
For this particular assignment, your proposal is required to incorporate the BioBits® cell-free protein expression system, but you may also use the other tools in the Genes in Space toolkit (the miniPCR® thermal cycler and the P51 Molecular Fluorescence Viewer). For more inspiration, check out https://www.genesinspace.org/ .
Provide background information that describes the space biology question or challenge you propose to address. Explain why this topic is significant for humanity, relevant for space exploration, and scientifically interesting. (Maximum 100 words)
Name the molecular or genetic target that you propose to study. Examples of molecular targets include individual genes and proteins, DNA and RNA sequences, or broader -omics approaches. (Maximum 30 words)
Describe how your molecular or genetic target relates to the space biology question or challenge your proposal addresses. (Maximum 100 words)
Clearly state your hypothesis or research goal and explain the reasoning behind it. (Maximum 150 words)
Outline your experimental plan - identify the sample(s) you will test in your experiment, including any necessary controls, the type of data or measurements that will be collected, etc. (Maximum 100 words)
Background Information (Maximum 100 words)
Long-duration space missions expose astronauts to increased radiation, microgravity, and confined living conditions, all of which can weaken immune function and promote microbial adaptation. Some bacteria become more stress-resistant and potentially more virulent in microgravity, posing risks to astronaut health and spacecraft environmental safety. Rapid, portable biological monitoring systems are therefore essential for future Moon and Mars missions where conventional laboratory infrastructure is unavailable. This proposal uses the BioBits® cell-free protein expression system to detect activation of bacterial stress-response genes associated with antibiotic resistance and oxidative stress, enabling astronauts to monitor microbial behavior quickly and safely during spaceflight.
Molecular or Genetic Target (Maximum 30 words)
The oxidative stress-response regulator gene oxyR and the antibiotic resistance-associated gene marA in Escherichia coli.
Relationship of Target to the Space Biology Challenge (Maximum 100 words)
Microgravity and space radiation can increase oxidative stress in bacteria, activating stress-response pathways that improve bacterial survival and potentially increase antibiotic resistance. The oxyR gene regulates oxidative stress defense mechanisms, while marA controls multidrug resistance and stress adaptation pathways. Monitoring the expression of these genes provides insight into how bacteria physiologically adapt to spaceflight conditions. Understanding these changes is important because altered bacterial behavior could increase infection risk, reduce antibiotic effectiveness, and compromise astronaut health during long-duration missions where medical resources are limited.
Hypothesis or Research Goal (Maximum 150 words)
This project hypothesizes that simulated spaceflight stress conditions increase activation of the oxyR and marA regulatory pathways in Escherichia coli. The research goal is to develop a rapid, portable, cell-free biosensing workflow capable of detecting bacterial stress-response gene activation during space missions. DNA regulatory sequences responsive to OxyR and MarA activation will be linked to fluorescent reporter expression within the BioBits® cell-free system. If stress-response pathways are activated, the system will produce measurable fluorescence detectable using the P51 Molecular Fluorescence Viewer. This approach would demonstrate that freeze-dried cell-free systems can function as lightweight biological monitoring tools in space without requiring living engineered cells. Such technology could support astronaut health monitoring, spacecraft environmental surveillance, and rapid microbial diagnostics during future deep-space exploration missions.
Experimental Plan (Maximum 100 words)
Escherichia coli cultures exposed to oxidative stress (hydrogen peroxide) will serve as experimental samples, while unstressed cultures will serve as controls. DNA regulatory elements responsive to oxyR and marA activation will drive GFP expression in the BioBits® cell-free system. PCR amplification of target promoter regions will be performed using the miniPCR® thermal cycler before adding templates to freeze-dried reactions. Fluorescence intensity will be measured using the P51 Molecular Fluorescence Viewer. Increased fluorescence in stressed samples compared with controls would indicate activation of bacterial stress-response pathways associated with simulated spaceflight conditions.
!!!!!!!!!
There are two major strategies currently used to make cell-free reactions. Some components, like nucleotides and amino acids, can be chemically synthesized. Other components, such as ribosomes and polymerases, still need to be produced by living cells and then separated from the cells. Since scientists have to individually create and purify each component, setting up this type of cell-free reaction is still complex and costly. However, because scientists are able to individually determine every molecule that is put into the reaction, they have tremendous control over the process which can result in high-quality proteins. The second method is to extract all the components directly from host cells all at once. Scientists grow up a large amount of cells and then break them open through a process called lysis. This makes the entire process much simpler and more cost-effective, but it also results in a less purified reaction, as the extract will still contain many unneeded cellular components.
This allows them to learn more and experiment with cellular processes that were previously too difficult to study in living cells. One example is to incorporate non-natural amino acids into the reaction. There are 20 naturally occurring amino acids, but scientists have been able to develop synthetic amino acids with unique chemical properties, and then use these non-natural amino acids to build new proteins in cell-free reactions that cannot be built in natural cells. In 2018, Kazutoyo Miura and their team used nonnatural amino acids to develop a new malaria antigen, which is a small protein that mimics a pathogen used in vaccines to “train” immune systems to fight against specific diseases. The non-natural amino acids in this antigen allow it to bind strongly to immune cells, trigger an immune response, and train them to recognize similar pathogens in the future. With many parts of the world still suffering from malaria and other diseases, we need new vaccines and treatments; using non-natural amino acids may help us discover them. Cell-free reactions don’t have cells that need to be kept alive, but they do contain sensitive molecules that require specific storage conditions. To get around this, scientists freeze-dry the reaction to make them last longer at room temperature. By freezing the reaction and then pulling all of the water out with a vacuum pump, they produce a dry solid that is stable outside of the freezer—similar to how beef left at room temperature will begin to rot, but beef jerky is stable for a long time. All the user has to do is rehydrate their reaction with water, add their DNA of interest, and transcription and translation will begin. Typically, pharmaceutical companies will produce medically-relevant proteins in large batches and ship them on ice to the patients who need them. However, the live-cell production and cold shipping processes are expensive. Freeze-dried, cell-free reactions could be shipped instead so therapeutic proteins can be produced directly in small batches on-demand, virtually anywhere in the world, at a fraction of the cost
Whittaker JW. Cell-free protein synthesis: the state of the art. Biotechnol Lett. 2013;35(2):143-152. doi:10.1007/s10529-012-1075-4 ↩︎↩︎
Kraußer F, Rabe K, Topham CM, et al. Cell-Free Reaction System for ATP Regeneration from d-Fructose. ACS Synth Biol. 2025;14(4):1250-1263. doi:10.1021/acssynbio.4c00877 ↩︎
Yadav S, Perkins AJP, Liyanagedera SBW, Bougas A, Laohakunakorn N. ATP Regeneration from Pyruvate in the PURE System. BioRxiv. September 8, 2024. doi:10.1101/2024.09.06.611674 ↩︎
Week 10 homework
Advanced imaging and measurement technology 🎞️
For your final project:
Please identify at least one (ideally many) aspect(s) of your project that you will measure. It could be the mass or sequence of a protein, the presence, absence, or quantity of a biomarker, etc.
Please describe all of the elements you would like to measure, and furthermore describe how you will perform these measurements.
What are the technologies you will use (e.g., gel electrophoresis, DNA sequencing, mass spectrometry, etc.)? Describe in detail.
My final individual project revolves around developing a lichen-based building coating that is prompted to change its color by the conditions of its environment as a means of passive heat acclimation. The biomaterial can assume two different colorations, a lighter one for hot sunny days and a darker one for days when the weather is cold and cloudy. The two colorations are mediated by two different compounds, namely the protein reflectin and the pigment eumelanin respectively. As engineering a lichen is quite challenging, especially when taking into consideration the very short time frame of the course, for my first experimental aim, I intend to design a genetic circuit that will emulate the color-changing effect of the lichen construct, although, adapted for expression in E. coli, which is simpler and easier to genetically manipulate, as proof-of-concept. After inducing the synthesis of reflectin and melanin in the bacterial system, I would like to test the responsivity and functionality of the color-shifting circuit first with a simple spectrophotometric measurement, which should be feasible given that reflectin is highly reflective when interacting with visible light, whereas eumelanin is highly absorbant. As a semi-quantitative method, I could also visualize the expression of reflectin and MelC2, an essential enzyme for the biosynthesis of eumelanin, by running an SDS-PAGE protein electrophoresis and, subsequently, Western blotting. To this end, I have attached a C-terminal tag to both proteins, more specifically a 6x-His tag to reflectin and a FLAG tag to MelC2, which will allow me to use anti-His and anti-FLAG antibodies to examine the expression of each protein in the Western blot. Alternatively, for a more precise quantification, I could purify the proteins and analyze them through mass spectrometry. This way, I could obtain both measurements about each protein’s level of expression, but also useful data both their respective sequences to verify that the proteins are synthesized as anticipated in my system. Another advantage of mass spectrometry-facilitated analysis is that, unlike SDS-PAGE and Western blots, it can be utilized to investigate other biomolecules too. Therefore, instead of indirectly quantifying eumelanin production through measurement of MelC2 expression, directly monitoring how much eumelanin has been generated would be possible. Going a step back, before the induction of protein expression, I would like to have already sequenced my final assembled DNA constructs, to validate that the plasmids constructed in the lab harbor the same sequence as the ones theoretically designed and display the anticipated functions. Lastly, apart from sequencing the plasmids before the bacterial transformation, it is prudent to do the same with colonies identified as positive transformants through the selection process by extracting their plasmids and isolating the insert containing the genetic cassette(s) responsible for the different colorations. The isolation of the insert can be easily achieved either by performing a strategic restriction digestion or, in case the plasmid lacks restriction sites, by amplifying the insert through PCR and, subsequently, visualizing the result of the reaction with an agarose gel electrophoresis in both scenarios.
Waters Part I: Molecular weight
We will analyze an eGFP standard on a Waters Xevo G3 QTof MS system to determine the molecular weight of intact eGFP and observe its charge state distribution in the native and denatured (unfolded) states. The conditions for LC-MS analysis of intact protein cause it to unfold and be detected in its denatured form (due to the solvents and pH used for analysis).
1. Based on the predicted amino acid sequence of eGFP (see below) and any known modifications, what is the calculated molecular weight?
eGFP amino acid sequence with C-terminal linker and 6x-His tag
MVSKGEELFTGVVPILVELDGDVNGHKFSVSGEGEGDATYGKLTLKFICTTGKLPVPWPTLVTTLTYGVQCFSRYPDHMKQHDFFKSAMPEGYVQERTIFFKDDGNYKTRAEVKFEGDTLVNRIELKGIDFKEDGNILGHKLEYNYNSHNVYIMADKQKNGIKVNFKIRHNIEDGSVQLADHYQQNTPIGDGPVLLPDNHYLSTQSALSKDPNEKRDHMVLLEFVTAAGITLGMDELYK LE HHHHHH
By using the molecular weight calculator provided by the ExPASy portal, the molecular weight of the N-terminally tagged eGFP presented above was calculated to be MWth = 28,006.60Da.
2. Calculate the molecular weight of the eGFP using the adjacent charge state approach described in the recitation. Select two charge states from the intact LC-MS data (Figure 10.1).
Figure 10.1 Mass Spectrum of intact eGFP protein from the Waters Xevo G3 LC-MS (a mass spectrometer with 30,000 resolution) with individual charge state peaks labeled with m/z values.
2.1 Determine z for each adjacent pair of peaks (n, n+1) using the formula: z = (m/zn+1-1)/(m/zn-m/zn+1).
For the calculation of the charge, I chose the following two consecutive measurements from Figure 10.1: m/zn+1 = 848.9758 and m/zn = 875.4421. Considering that the charge in the n state of the protein (zn) is equal to the protein’s number of charges as carried by protons (nH) and by applying the mathematical formula shown above, zn = nH = z = 32.0398. Therefore, zn = 32 approximately and zn+1 = 33.
2.2 Determine the MW of the protein using the relationship between m/zn, MW, and zn.
Based on the calculations of the previous segment and by implementing the formula MW = (m/znxzn)-zn, the experimentally measured MW of eGFP is MWexp = 27,982.15Da.
2.3 Calculate the accuracy of the measurement using the deconvoluted MW from 2.2 and the predicted weight of the protein from 2.1 using the formula:
accuracy = |MWexp-MWth|/MWth.
By applying the mathematical formula above, the accuracy of the measurement is approximately 8.73x10⁻⁴.
3. Can you observe the charge state for the zoomed-in peak in the mass spectrum for the intact eGFP in Figure 10.1? If yes, what is it? If no, why not?
The peaks in the zoomed-in frame included in Figure 10.1 are not very clearly separated, probably due to the resolution of the instrument in this m/z range. Based solely on this, it is not easy to calculate the corresponding charge. However, by counting the number of peaks to the right of the m/zn peak, the charge of the peak shown in the close-up of Figure 10.1 should be around 19.
Waters Part II: Secondary/Tertiary structure
We will analyze eGFP in its native, folded state and compare it to its denatured, unfolded state on a quadrupole time-of-flight MS. We will be doing MS-only analysis (no liquid chromatography, also known as “direct infusion” experiments) on the Waters Xevo G3-QToF MS.
1. Based on learnings in the lab, please explain the difference between native and denatured protein conformations. For example, what happens when a protein unfolds? How is that determined with a mass spectrometer? What changes do you see in the mass spectrum between the native and denatured protein analyses (Figure 10.2)?
Figure 10.2 Comparison of the mass spectra between denatured (top) and native (bottom) eGFP standard on the Waters Xevo G3 QTof MS.
In their native conformation, proteins remain fully functional and folded, as they retain their secondary and tertiary structures. However, in their denatured state, proteins have lost their native folding due to denaturing agents (such as increased heat and acidic or basic conditions). Since these factors disrupt the bonds established by amino acid residue interactions (hydrogen bonds, disulfide bridges, hydrophobic interactions), the denaturation process removes the second and tertiary structures of proteins, allowing them to unravel into a long chain of amino acids (primary structure). Due to the proteins fully or partially unfolding, a larger surface area of the protein molecules is exposed, potentially from cavities and grooves hidden in its native conformation, enabling protons to be attached to a greater number of amino acid residues (mainly to their side chains) during the ionization phase of mass spectrometry. This is bolstered by the significantly higher number of peaks observed at the leftmost part of the denatured eGFP spectrogram (Figure 10.2, top) compared to the corresponding part of the native protein’s spectrum (Figure 10.2, bottom). The fewer peaks in the latter indicate a lower number of entities carrying a larger amount of charges, which in the denatured eGFP spectrum is substantially increased due to the denaturation process and the exposition of larger domains of the protein to ionization. The greater number of peaks in the top image of Figure 10.2 also shows that eGFP exists in many slightly different but clearly discernible denatured states, each with a discrete m/z ratio. In contrast to that, the native eGFP’s spectrogram (Figure 10.2, bottom) presents only a few peaks which are mostly found towards the rightmost segment of the graph, consistent with the lower charge obtained by the more compact folded native conformation of the protein during ionization. Lastly, the spectrum for native eGFP, at the bottom image of Figure 10.2, includes a small number of peaks to the left, which could be attributed to eGFP molecules that were partially denatured or even broken apart into shorter peptides due to the conditions of the analysis, thus collecting more charges per unit of mass.
2. Zooming into the native mass spectrum of eGFP from the Waters Xevo G3 QTof MS (see Figure 10.3), can you discern the charge state of the peak at m/z = ~2,800? What is the charge state? How can you tell?
Figure 10.3 Native eGFP mass spectrum from the Waters Xevo G3 Q-Tof MS. The inset is a zoomed-in view of the charge state at m/z = ~2,600 on a mass spectrometer with 30,000 resolution.
Once again, to calculate the charge state of the peak at approximately m/z = 2,800, I used the formula z = (m/zn+1-1)/(m/zn-m/zn+1) and two measurements from the two consecutive peaks close to m/z = 2,600 and m/z = 2,800 respectively as illustrated in the spectrogram in Figure 10.3, namely m/zn+1 = 2,547.4929 and m/zn = 2,799.4199. Based on these data, the charge state of native eGFP around m/z = 2,800 is zn = 10.11 = ~10.
Waters Part III: Peptide mapping and primary structure
We will digest the eGFP protein standard into peptides using trypsin (an enzyme that selectively cleaves the peptide bond after Lysine (K) and Arginine (R) residues. The resulting peptides will be analyzed on the Waters BioAccord LC-MS to measure their molecular weights and fragmented to confirm the amino acid sequence within each peptide – generating a “peptide map”. This process is used to confirm the primary structure of the protein.
1. How many lysines (K) and arginines (R) are in eGFP? Please circle or highlight them in the eGFP sequence given in Waters Part I question 1 above.
The amino acid chain of the C-terminally tagged eGFP previously presented contains 20 lysine and 6 arginine amino acid residues.
eGFP amino acid sequence with C-terminal linker and 6x-His tag
MVSKGEELFTGVVPILVELDGDVNGHKFSVSGEGEGDATYGKLTLKFICTTGKLPVPWPTLVTTLTYGVQCFSRYPDHMKQHDFFKSAMPEGYVQERTIFFKDDGNYKTRAEVKFEGDTLVNRIELKGIDFKEDGNILGHKLEYNYNSHNVYIMADKQKNGIKVNFKIRHNIEDGSVQLADHYQQNTPIGDGPVLLPDNHYLSTQSALSKDPNEKRDHMVLLEFVTAAGITLGMDELYK LE HHHHHH
2. How many peptides will be generated from tryptic digestion of eGFP?
By utilizing the peptide mass tool provided by the ExPASy portal and by following the relevant guide on the week 10 homework page, the 6x-His C-terminally tagged eGFP should be digested into 19 peptides of MW >500Da (which are shown in full detail in Figure 10.4A) and 8 more smaller peptides (as seen in Figure 10.4B) after treatment with trypsin. So, eGFP should be broken apart into 27 peptides in total after trypsin digestion.
Figure 10.4 Overview of the peptides that occur after the 6x-His C-terminally tagged eGFP previously demonstrated is digested with trypsin. Both peptides with MW >500Da (A) and smaller peptides (B, highlighted in black) are generated after the digestion according to the ExPASy PeptideMass tool.
3. Based on the LC-MS data for the Peptide Map data generated in lab (please use Figure 5a as a reference), how many chromatographic peaks do you see in the eGFP peptide map between 0.5 and 6 minutes? You may count all peaks that are >10% relative abundance.
Figure 10.5 Total ion chromatogram (TIC) of the eGFP peptide map. The peak at 2.78 minutes is circled and its MS data are shown in the mass spectrum in Figure 10.6.
To determine which peaks in the chromatogram are >10% relative abundance, I decided to define the peak at 4.87 minutes (the highest peak in the graph) as 100% relative abundance. Since this peak corresponds to approximately 12x106 ion count, only the peaks corresponding to an ion count of 1.2x10⁶ or above should be taken into consideration. Based on this criterion, the peaks in the peptide map between 0.5 and 6 minutes that should be included in the count are at 0.61, 0.79, 1.43, 1.80, 1.85, 1.93, 2.17, 2.26, ~2.46, 2.54, 2.78, 3.27, 3.53, 3.59, 3.70, 4.30, 4.48, 4.64, and 4.87 minutes, therefore 19 peaks in total.
4. Assuming all the peaks are peptides, does the number of peaks match the number of peptides predicted from question 2 above? Are there more peaks in the chromatogram or fewer?
Indeed, the number of peptides that have a MW >500Da (as predicted by ExPASy) matches the number of chromatographic peaks detected between 0.5 and 6 minutes to have >10% relative abundance, which is 19.
5. Identify the mass-to-charge (m/z) of the peptide shown in Figure 10.6. What is the charge (z) of the most abundant charge state of the peptide (use the separation of the isotopes to determine the charge state). Calculate the mass of the singly charged form of the peptide ([M+H]+) based on its m/z and z.
Figure 10.6 Mass spectrum figure to show the m/z for the chromatographic peak at 2.78 minutes from Figure 10.5 above. The inset is a zoom-in of the peak at m/z = 525.76, to discern the isotope peaks.
By observing the different isotopes of the molecule eluted at 2.78 minutes in the inset of Figure 10.6, the different m/z ratios are 525.76712 for the leftmost peak (corresponding to the molecule’s monoisotopic mass), 526.25918 for the peak immediately to the right, 526.76845 for the following peak to the right, and 527.26098 for the rightmost peak of the chromatogram. Based on these measurements, the isotope spacing between each pair of consecutive peaks appears to be Δm/z = ~0.5 (Table 10.1), which corresponds to a charge of z = 2 for the most abundant state of the molecule according to the formula z = 1/(Δm/z). Finally, by utilizing the basic formula for m/z = (M+nH)/n, where n = z = 2 in our case and by solving it as an equation with the variable M as the unknown, the mass of the singly charged form of the peptide should be [M+H]+ = 1,050.53424.
Table 10.1 Δm/z calculations for all combinations of two consecutive peaks depicted in the chromatographic inset of Figure 10.6.
m/z for peak to the left
m/z for peak to the right
Δm/z
1
525.76712
526.25918
0.49206
2
526.25918
526.76845
0.50927
3
526.76845
527.26098
0.49253
6. Identify the peptide based on comparison to expected masses in the PeptideMass tool. What is mass accuracy of measurement? Please calculate the error in ppm.
Based on a comparison of the result for the previous question ([M+H]+ = 1,050.53424) and the masses of the peptides expected to occur after the digestion of eGFP with trypsin, the peptide that was eluted after 2.78 minutes is probably FEGDTLVNR, which was found to have a theoretical mass of 1,050.5214 according to ExPASy (at the ninth row of the table shown in Figure 10.4A). By applying the formula for accuracy provided above, the accuracy of the mass’ measurement is 1.22x10⁻⁵. After multiplying the accuracy with 106 (to convert to ppm), the error of the measurement is 12.2ppm, so slightly above 10ppm, which is the identification threshold for peptides.
7. What is the percentage of the sequence that is confirmed by peptide mapping? (See Figure 10.7)
Figure 10.7 Amino acid coverage map of eGFP based on BioAccord LC-MS peptide identification data.
The percentage of the sequence that is confirmed by peptide mapping is 88% or 218 out of the protein’s 247 amino acids (Figure 10.7).
Waters Part IV: Oligomers
We will determine Keyhole Limpet Haemocyanin (KLH)’s oligomeric states using charge detection mass spectrometry (CDMS). CDMS single-particle measurements of KLH allow us to make direct mass measurements to determine what oligomeric states (that is, how many protein subunits combine) are present in solution. Using the known masses of the polypeptide subunits (Table 10.2) for KLH, identify where the following oligomeric species are on the spectrum shown below from the CDMS (Figure 10.8):
Based on the subunit masses given in Table 10.2 and the number of subunits comprising each oligomeric state of KLH provided by the description above (with “deca” -“δέκα”- meaning “ten”), I calculated the mass for the four different oligomers as presented below.
7FU decamer: 340kDax10 = 3,400kDa = 3.40MDa, so the peak at 3.40MDa highlighted in Figure 10.8 with a black arrow.
8FU didecamer: 400kDax20 = 8,000kDa = 8.00MDa. The peak closest to this result is the one at 8.33MDa (denoted in Figure 10.8 with a red arrow), which, however, displays a discrepancy of ~330kDa. I could not find anything about this variation in the available literature, so my current hypothesis is that these 330kDa could be attributed to a petidic linker-like feature joining the two decamers together.
8FU 3-decamer: 400kDax30 = 12,000kDa = 12.00MDa. Once again, the closest peak closest to this mass is not exactly at the result calculated, but at 12.67MDa (as denoted in Figure 10.8 with a purple arrow). A substantial discrepancy between the theoretically calculated and the experimentally measured mass of the oligomer is observed here as well, albeit doubled (2x330kDa = ~670kDa) in this case. This phenomenon further supports the hypothesis analyzed above, that the additional mass corresponds to a peptide linker contributing to the association of individual decamers, as, for the addition of a third decamer towards the formation of the KLH tridecamer, another linker module, therefore another ~330kDa, would be required.
8FU 4-decamer: 400kDax40 = 16,000kDa = 16.00MDa. Based on the linker-related hypothesis described previously, a KLH 8FU tetramer would need three linker units to be assembled, so 16.00MDa combined with an additional 3x330kDa = ~1MDa, and therefore would have a mass of approximately 17MDa. Surprisingly, there are no visible peaks at 16 - 17MDa in the CDMS data in Figure 10.8, but a measurement of very low signal (signified with a green arrow in Figure 10.8). This area could be interpreted as the detected 8FU 4-decamer of KLH, with one possible explanation for the very low intensity of the signal being that the more decameric modules a multi-decamer KLH complex contains the more unstable it is. This molecular instability renders the multi-protein complex more vulnerable to the preparation conditions before the actual MS detection. Taking this into consideration, the more vulnerable a protein complex is the fewer the intact molecules that reach the detector, hence the low signal in Figure 10.8.
Figure 10.8 Mass spectrum of Keyhole Limpet Haemocyanin (KLH) acquired on the CDMS. The peaks corresponding to discrete oligomers of KLH are signified with arrows of different colors.
Waters Part V: Did I make GFP?
Please fill out Table 10.3 with the data you acquired from the lab work done at the Waters Immerse Lab in Cambridge or else the data screenshots in this document if you were unable to have lab work done at Waters.
Table 10.3 Data gathered from eGFP-related MS measurements.
Theoretical MW
Observed/measured MW on the intact LC-MS
Mass error
28.007kDa
27.982kDa
870ppm
The mass error from the accuracy calculation is 870ppm, which is much higher than the 30 - 50ppm threshold for proteins, therefore I cannot confidently claim that what was measured was eGFP.
Week 11 homework
Bioproduction and cloud labs 🥼
Part A: The 1,536 Pixel Artwork Canvas | Collective artwork
Contribute at least one pixel to the global artwork experiment before the editing ends on Sunday 19/04 at 11.59pm EST. A personalized URL was sent to the email address associated with your Discourse account, and you can discuss the artwork on the Discourse. Make a note on your HTGAA webpages including:
what you contributed to the community bioart project (e.g., “I made part of the DNA on the bottom right plate”)
what you liked about the project, and
what about this collaborative art experiment could be made better for next year.
What survived of my main contributions to the bioart project are initiating and adding several pixels in the DNA double helix positioned in the left part of the bottom right plate. I also painted some of the Electra2 blue pixels in the background of the same plate (Figure 11.1).
Figure 11.1 The final selected picture generated through the collaborative biopixel artwork project, where I have framed the area roughly containing my contributions in a yellow rectangle. #evolving_ducks
What I liked about the project: It was one of the few times during this course that I felt connected to other HTGAA students from all around the world. I also liked that we were free to choose what we wanted to draw on the canvas and I really enjoyed interacting with the interface/tool, as it was very intuitive and user-friendly. Thank you, Ronan!
What about this collaborative art experiment could be made better for next year: Adding more colors for the next bioart experiment would be great, while I would also like to see a more pixel-dense version of the plate surface area, so that the resolution of the final created picture is sharper. Given that each represents a well in one out of four 384-well plates, I suppose my suggestion means making the canvas bigger by adding more plates in its periphery. Finally, although I did like that there was no specific subject to depict in the artwork, it would be nice if next time there were two instead of one projects: one without a topic (like this year), so that students are given full creative freedom to unfold their bio-drawing talent, and one with a particular theme, so that they are encouraged to truly collaborate and exchange artistic ideas with other HTGAA participants in the context a shared goal.
Part B: Cell-free protein synthesis | Cell-free reagents
1. Referencing the cell-free protein synthesis reaction composition (the middle box outlined in yellow on the image above, also listed below), provide a 1-2 sentence description of what each component’s role is in the cell-free reaction.
E. coli lysate
BL21(DE3) Star lysate (includes T7 RNA polymerase): This lysate provides the core molecular machinery required for cell-free transcription and translation, including ribosomes, tRNAs, enzymes, and translation factors extracted from E. coli. The BL21(DE3) strain also contains T7 RNA polymerase, which enables strong transcription from T7 promoters commonly used in cell-free expression systems.
Salts/Buffer
Potassium Glutamate: Potassium glutamate helps maintain ionic strength and mimics the intracellular environment of bacterial cells, supporting proper ribosome function and protein synthesis. It also stabilizes enzymes and improves translation efficiency.
HEPES-KOH pH 7.5: HEPES-KOH acts as a buffering agent that maintains a stable pH during the reaction. Stable pH is essential because transcription and translation enzymes are highly sensitive to pH changes.
Magnesium Glutamate: Magnesium ions are critical cofactors for ribosomes, RNA polymerases, and many enzymes involved in transcription and translation. Magnesium glutamate provides the optimal magnesium concentration needed for efficient protein synthesis.
Potassium Phosphate Monobasic: This compound contributes to phosphate buffering and helps maintain ionic balance within the reaction. It also supports nucleotide metabolism and energy transfer processes.
Potassium Phosphate Dibasic: Potassium phosphate dibasic works together with the monobasic form to stabilize pH and maintain phosphate equilibrium. Proper buffering improves reaction stability and protein production efficiency.
Energy/Nucleotide system
Ribose: Ribose serves as a precursor for nucleotide synthesis and energy metabolism within the cell-free system. It can help sustain transcriptional activity by supporting RNA-related metabolic pathways.
Glucose: Glucose functions as an energy source that helps regenerate ATP during the reaction. Continuous ATP regeneration is necessary because transcription and translation consume large amounts of energy.
AMP: AMP is one of the nucleotide building blocks involved in RNA synthesis and cellular energy cycling. It also participates in ATP regeneration pathways within the reaction mixture.
CMP: CMP provides cytidine nucleotides required for RNA transcription. Adequate nucleotide availability is essential for sustained mRNA production.
GMP: GMP supplies guanosine nucleotides necessary for RNA synthesis and energy metabolism. It contributes directly to the formation of mRNA transcripts.
UMP: UMP provides uridine nucleotides used during RNA transcription. Balanced nucleotide concentrations improve transcription efficiency and reduce premature termination.
Guanine: Guanine can be salvaged and converted into guanine nucleotides for RNA synthesis. Supplementing guanine helps support continuous nucleotide recycling during the reaction.
Translation mix (amino acids)
17 Amino Acid Mix: This mixture supplies most of the amino acids required for protein synthesis by ribosomes. These amino acids are incorporated into the growing polypeptide chain during translation.
Tyrosine: Tyrosine is added separately because it may be less stable or required at different concentrations than other amino acids. It is an essential building block for many proteins.
Cysteine: Cysteine is supplied separately because it is chemically reactive and prone to oxidation in solution. It is important for forming disulfide bonds and stabilizing protein structure.
Additives
Nicotinamide: Nicotinamide acts as a precursor for NAD+ and related cofactors involved in metabolic and energy-regeneration reactions. It helps support enzymatic activity and prolong reaction efficiency.
Backfill
Nuclease-Free Water: Nuclease-free water is used to bring the reaction mixture to the correct final volume while preventing degradation of DNA and RNA templates. The absence of nucleases is critical for maintaining stable transcription and translation.
2. Describe the main differences between the 1-hour optimized PEP-NTP master mix and the 20-hour NMP-Ribose-Glucose master mix (2 - 3 sentences).
The easiest to spot difference between the two master mixes is the presence of potassium phosphate monobasic and dibasic solely in the 20-hour one, as they are needed in a longer-lasting reaction to stabilize the pH and regulate phosphate equilibrium both for nucleic acid synthesis but also for energy regeneration. Since I mentioned energy regeneration, another discrepancy between the two reactions can be seen under the “Energy/Nucleotide system” section. The one-hour reaction utilizes NTPs for fast transcription, as well as PEP-Mono and maltodextrin for immediate energy provision due to its very short duration. On the contrary, the 20-hour reaction used NMPs, which can be converted to NTPs and can be employed for energy recovery along with ribose and glucose (that are not included in the one-hour master mix) given enough time. As a last observation of components that differ between the two reactions, the shorter one includes more additives, such as spermidine and DMSO, than the 20-hour protein synthesis, as they can boost translation efficiency and stabilize mRNA structure for faster result acquisition.
Part C: Planning the global experiment | Cell-free master mix design
1. Given the 6 fluorescent proteins we used for our collaborative painting, identify and explain at least one biophysical or functional property of each protein that affects expression or readout in cell-free systems. (Hint: options include maturation time, acid sensitivity, folding, oxygen dependence, etc.) (1 - 2 sentences each).
To obtain more information about each fluorescence protein, I navigated to their respective pages on the Fluorescent Protein Database (FPBase), as well as scientific papers describing their biochemical properties:
sfGFP: It is a basic (constitutively fluorescent) green fluorescent protein of natural (cnidarian) origin. It is reported to form very rapidly-maturing monomers or weak dimers with moderate acid sensitivity 1. The protein molecules are oxygen-dependent for correct fluorophore formation 2.
mRFP1: It is a monomeric constitutively fluorescent red fluorescent protein of natural (cnidarian) origin. It is characterized by a longer maturation time (slow maturation) and very low acid sensitivity 1, while it requires molecular oxygen for chromophore formation as a derivative of DsRed 3.
mKO2: It is a constitutively fluorescent orange fluorescent protein of natural (cnidarian) origin. It has moderate acid sensitivity and is O2-dependent for the maturation of its chromophore. It is monomeric 4 and displays rapidly-maturing fluorescent protein kinetics 5.
mTurquoise2: It is a monomeric constitutively fluorescent cyan fluorescent protein of natural (cnidarian) origin. It demonstrates rapid maturation and low acid sensitivity 1, whereas it needs molecular oxygen for fluorophore formation being a GFP derivative 3.
mScarlet_I: It is a synthetic constitutively fluorescent red fluorescent protein. It is reported to be a rapidly-maturing monomer with moderate acid sensitivity 6 that depends on aerobic conditions for chromophore formation 7.
Electra2: It is a constitutively fluorescent blue fluorescent protein of natural (cnidarian) origin. It forms efficiently-maturing stable monomers, while it shows high resistance to acidic environments and requires oxygen to fluoresce 8.
2. Create a hypothesis for how adjusting one or more reagents in the cell-free mastermix could improve a specific biophysical or functional property you identified above, in order to maximize fluorescence over a 36-hour incubation. Clearly state the protein, the reagent(s), and the expected effect.
Based on information I gathered about the fluorescent proteins we used for the bioart project (presented in the previous question) and on the specific purpose of each reagent in the cell-free protein synthesis master mix (as elaborated on in Part B), I modified the concentration of the following reagents for synthesis of specific fluorescent proteins:
A comprehensive list of all reagents and their respective concentrations in the cell-free reactions that have been customized to the unique properties of each fluorescent protein can be seen in Table 11.1.
Table 11.1 Master mix reagent concentrations for six different wells from the bio-artwork after they have been individually tailored to maximize fluorescence of one out of the six fluorescent proteins used in the project, each represented in a different well.
Reagent
mTurquoise2 (Q4-B5)
sfGFP (Q2-D11)
mRFP1 (Q1-J6)
Electra2 (Q3-F19)
mKO2 (Q4-M11)
mScarlet_I (Q1-D9)
Cell Lysate
6.000 μL
6.000 μL
6.000 μL
6.000 μL
6.000 μL
6.000 μL
DNA Template
2.000 μL
2.000 μL
2.000 μL
2.000 μL
2.000 μL
2.000 μL
Nuclease-Free Water
1.100 μL
0.950 μL
1.250 μL
1.100 μL
1.000 μL
1.000 μL
Potassium Glutamate
312.563 mM
312.563 mM
314.750 mM
312.563 mM
312.563 mM
312.563 mM
Magnesium Glutamate
10.100 mM
11.350 mM
11.350 mM
10.100 mM
10.100 mM
10.100 mM
HEPES-KOH pH 7.5
45.000 mM
50.000 mM
45.000 mM
45.000 mM
50.000 mM
50.000 mM
17 Amino Acid Mix
4.500 mM
4.500 mM
4.063 mM
4.500 mM
4.500 mM
4.500 mM
Tyrosine pH 12
4.125 mM
4.125 mM
4.063 mM
4.125 mM
4.125 mM
4.125 mM
Cysteine
4.000 mM
4.000 mM
4.000 mM
4.000 mM
4.000 mM
4.000 mM
Ribose
11.625 g/L
11.625 g/L
11.625 g/L
11.625 g/L
11.625 g/L
11.625 g/L
AMP
1.000 mM
1.000 mM
0.750 mM
1.000 mM
1.000 mM
1.000 mM
CMP
0.375 mM
0.375 mM
0.375 mM
0.375 mM
0.375 mM
0.375 mM
GMP
-
-
-
-
-
-
UMP
0.375 mM
0.375 mM
0.375 mM
0.375 mM
0.375 mM
0.375 mM
Guanine
0.156 mM
0.156 mM
0.156 mM
0.156 mM
0.156 mM
0.156 mM
Glucose
2.000 g/L
2.000 g/L
2.000 g/L
2.000 g/L
2.000 g/L
2.000 g/L
Potassium phosphate dibasic
10.000 mM
10.000 mM
10.000 mM
10.000 mM
10.000 mM
10.000 mM
Potassium phosphate monobasic
10.000 mM
10.000 mM
10.000 mM
10.000 mM
10.000 mM
10.000 mM
Nicotinamide
3.500 mM
3.500 mM
3.500 mM
3.500 mM
3.500 mM
3.500 mM
Shinoda H, Shannon M, Nagai T. Fluorescent proteins for investigating biological events in acidic environments. International Journal of Molecular Sciences. 2018;19(6):1548. doi:10.3390/ijms19061548 ↩︎↩︎↩︎
Stepanenko OV, Stepanenko OV, Kuznetsova IM, Shcherbakova DM, Verkhusha VV, Turoverov KK. Distinct effects of guanidine thiocyanate on the structure of superfolder GFP. PLoS ONE. 2012;7(11):e48809. doi:10.1371/journal.pone.0048809 ↩︎
Kaida A, Miura M. Differential dependence on oxygen tension during the maturation process between monomeric Kusabira Orange 2 and monomeric Azami Green expressed in HeLa cells. Biochem Biophys Res Commun. 2012;421(4):855-859. doi:10.1016/j.bbrc.2012.04.102 ↩︎
Sakaue-Sawano A, Kurokawa H, Morimura T, et al. Visualizing spatiotemporal dynamics of multicellular cell-cycle progression. Cell. 2008;132(3):487-498. doi:10.1016/j.cell.2007.12.033 ↩︎
Bindels DS, Haarbosch L, van Weeren L, et al. mScarlet: a bright monomeric red fluorescent protein for cellular imaging. Nat Methods. 2017;14(1):53-56. doi:10.1038/nmeth.4074 ↩︎
Pavlou A, Cinquemani E, Geiselmann J, de Jong H. Maturation models of fluorescent proteins are necessary for unbiased estimates of promoter activity. Biophys J. September 21, 2022. doi:10.1016/j.bpj.2022.09.021 ↩︎
Hashimura H, Nakagawa H, Sawai S. Use of blue fluorescent protein Electra2 for live-cell imaging in Dictyostelium discoideum. microPublication Biology. 2025. doi:10.17912/micropub.biology.001774 ↩︎
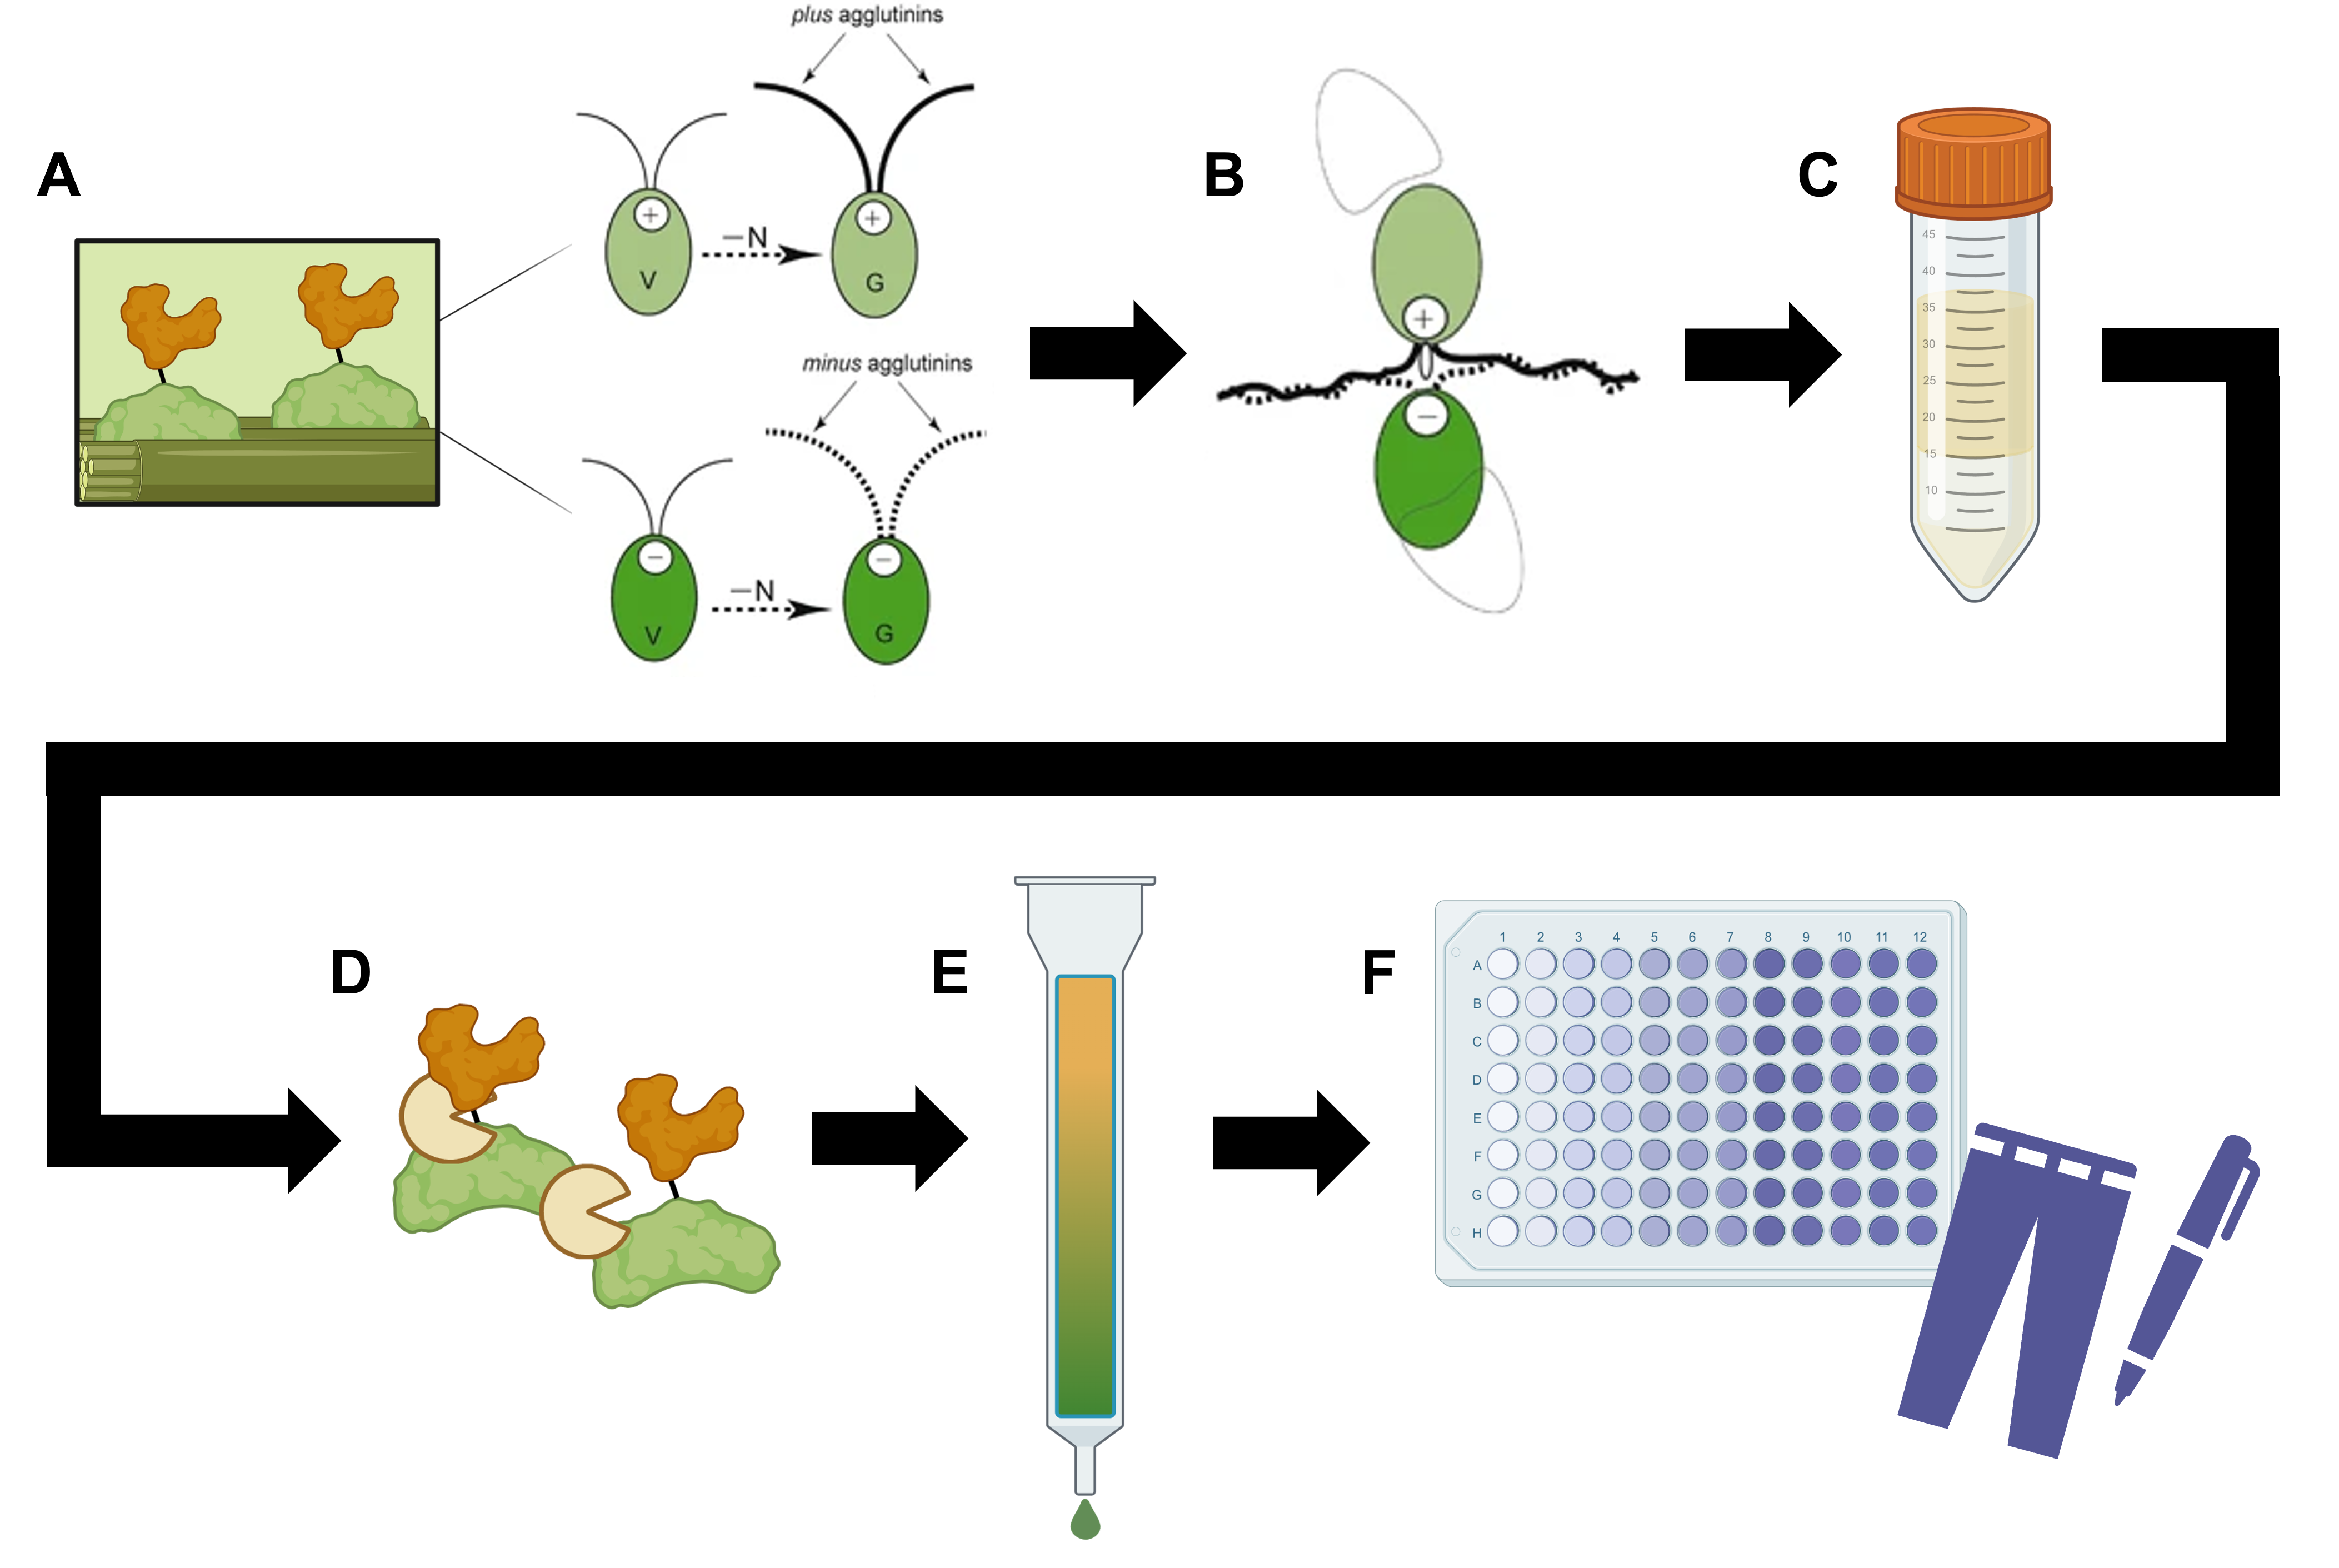
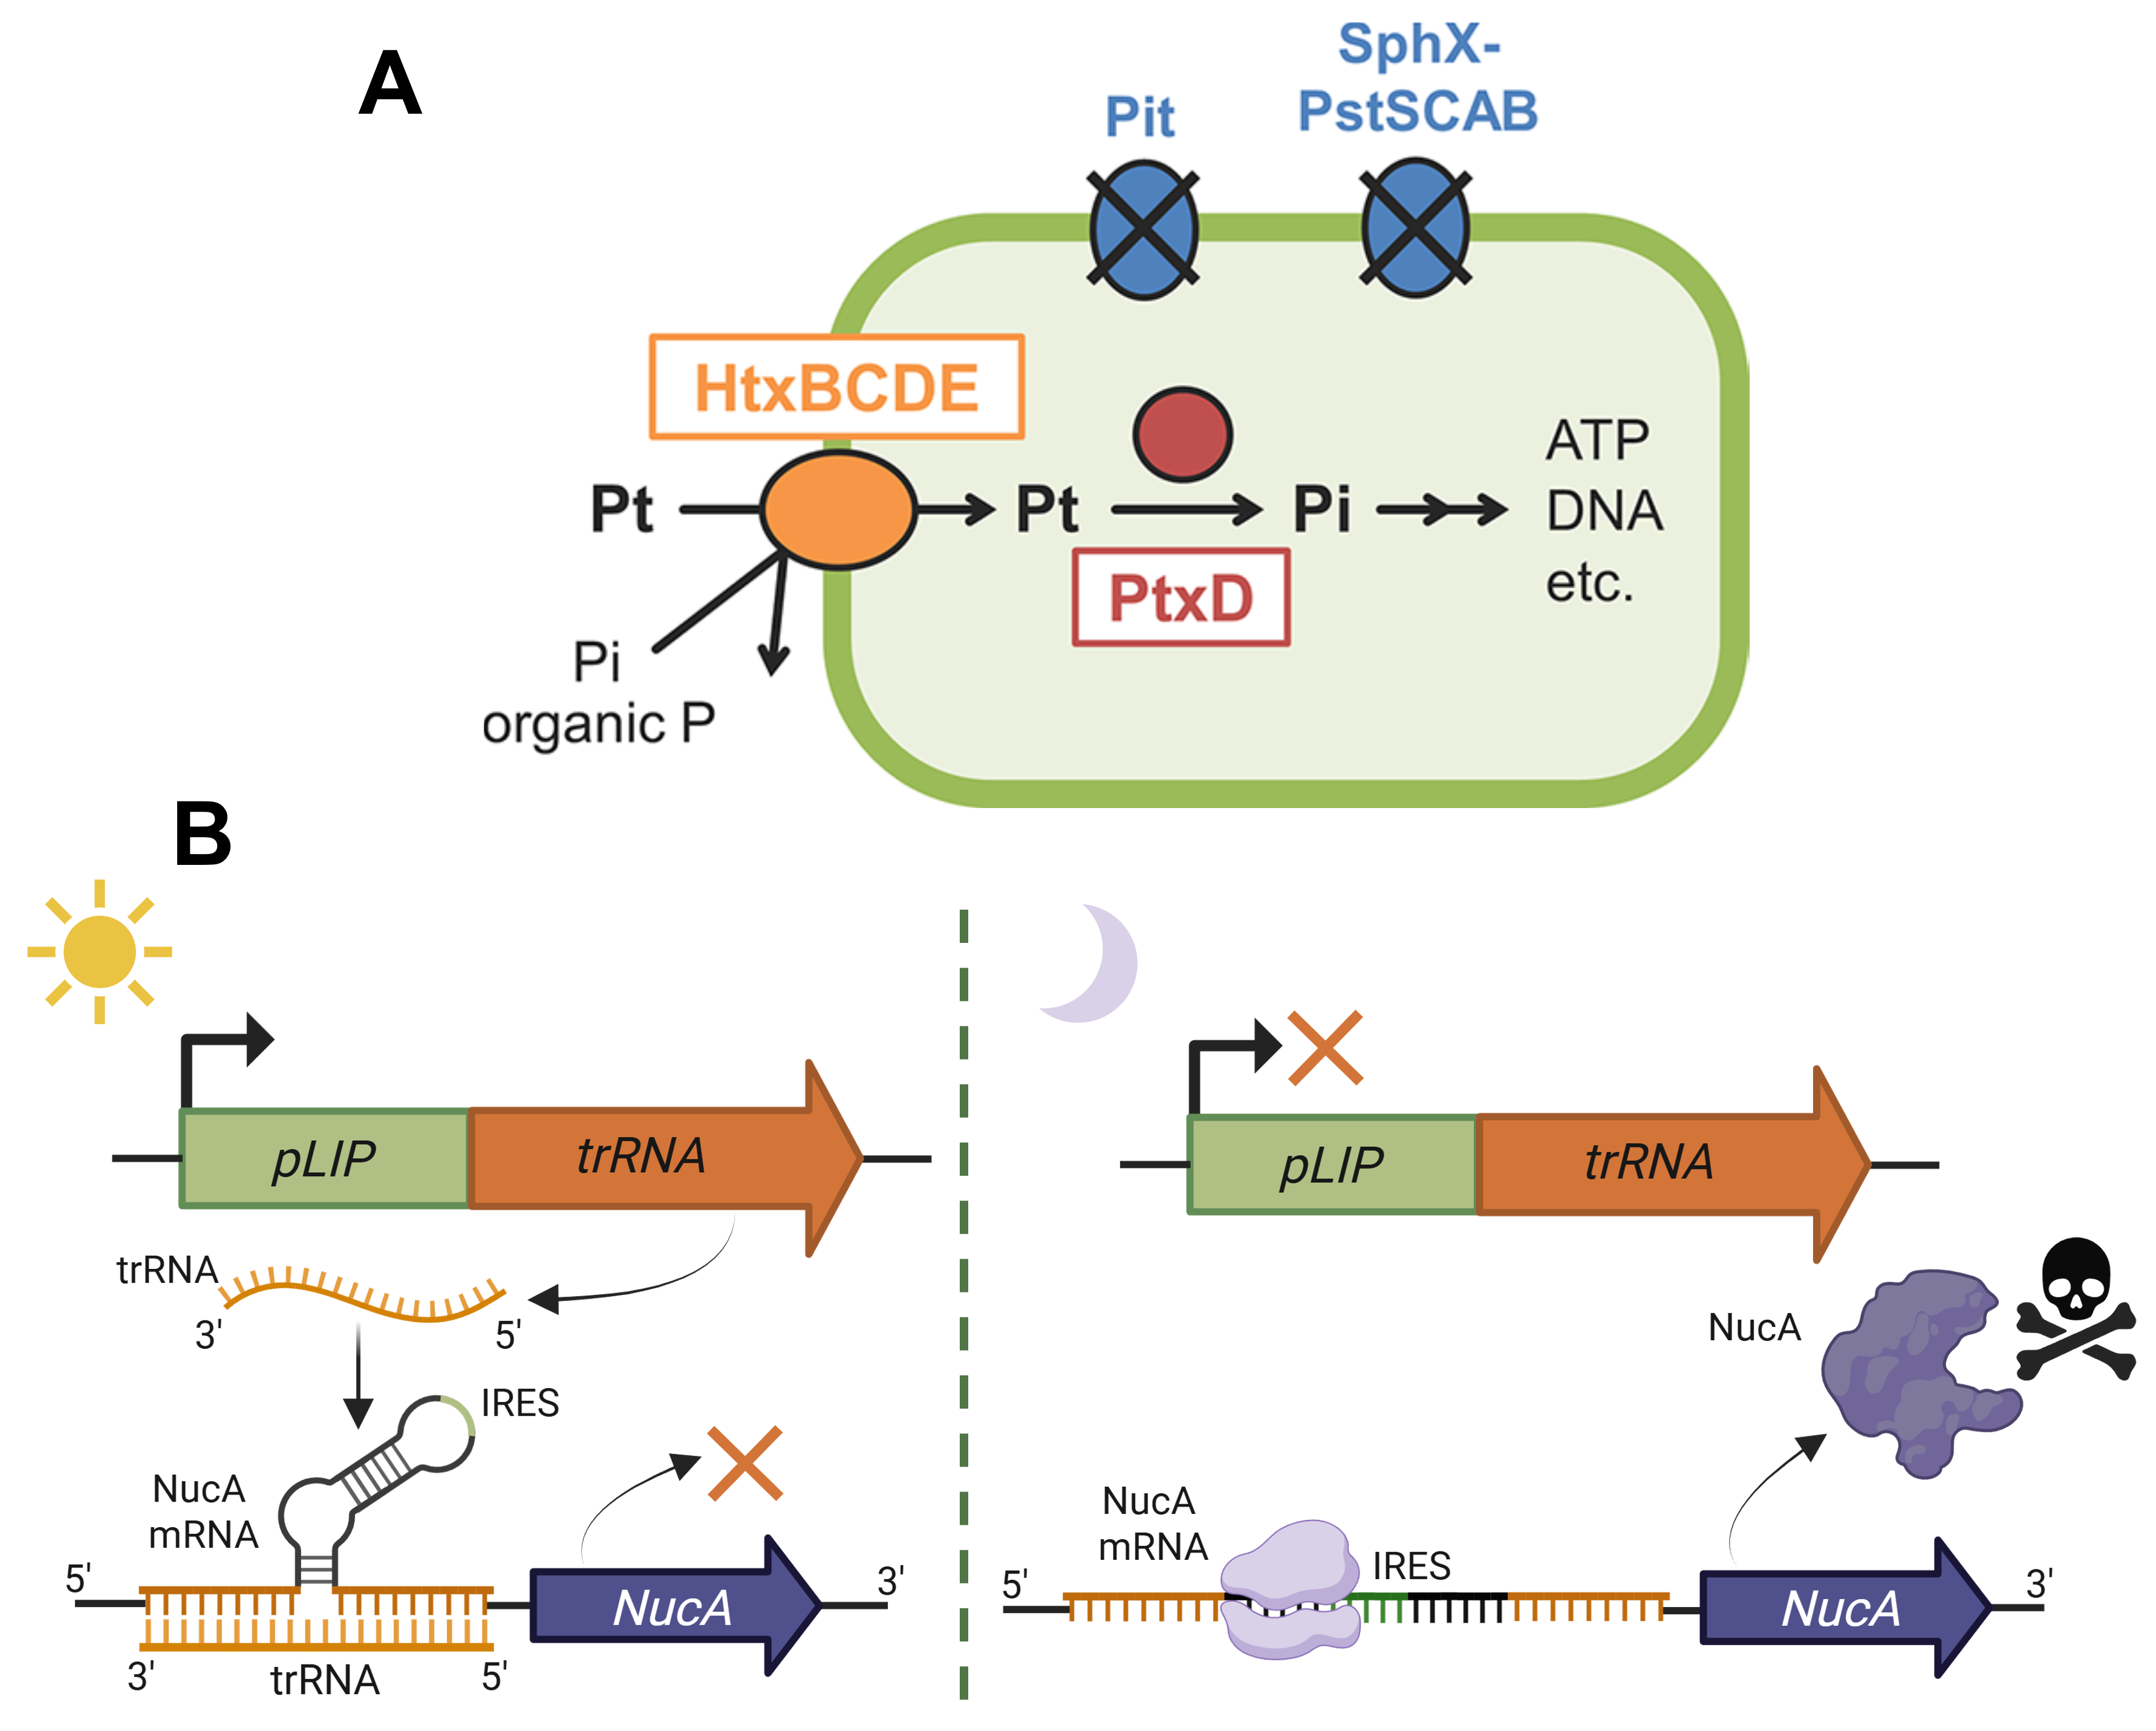
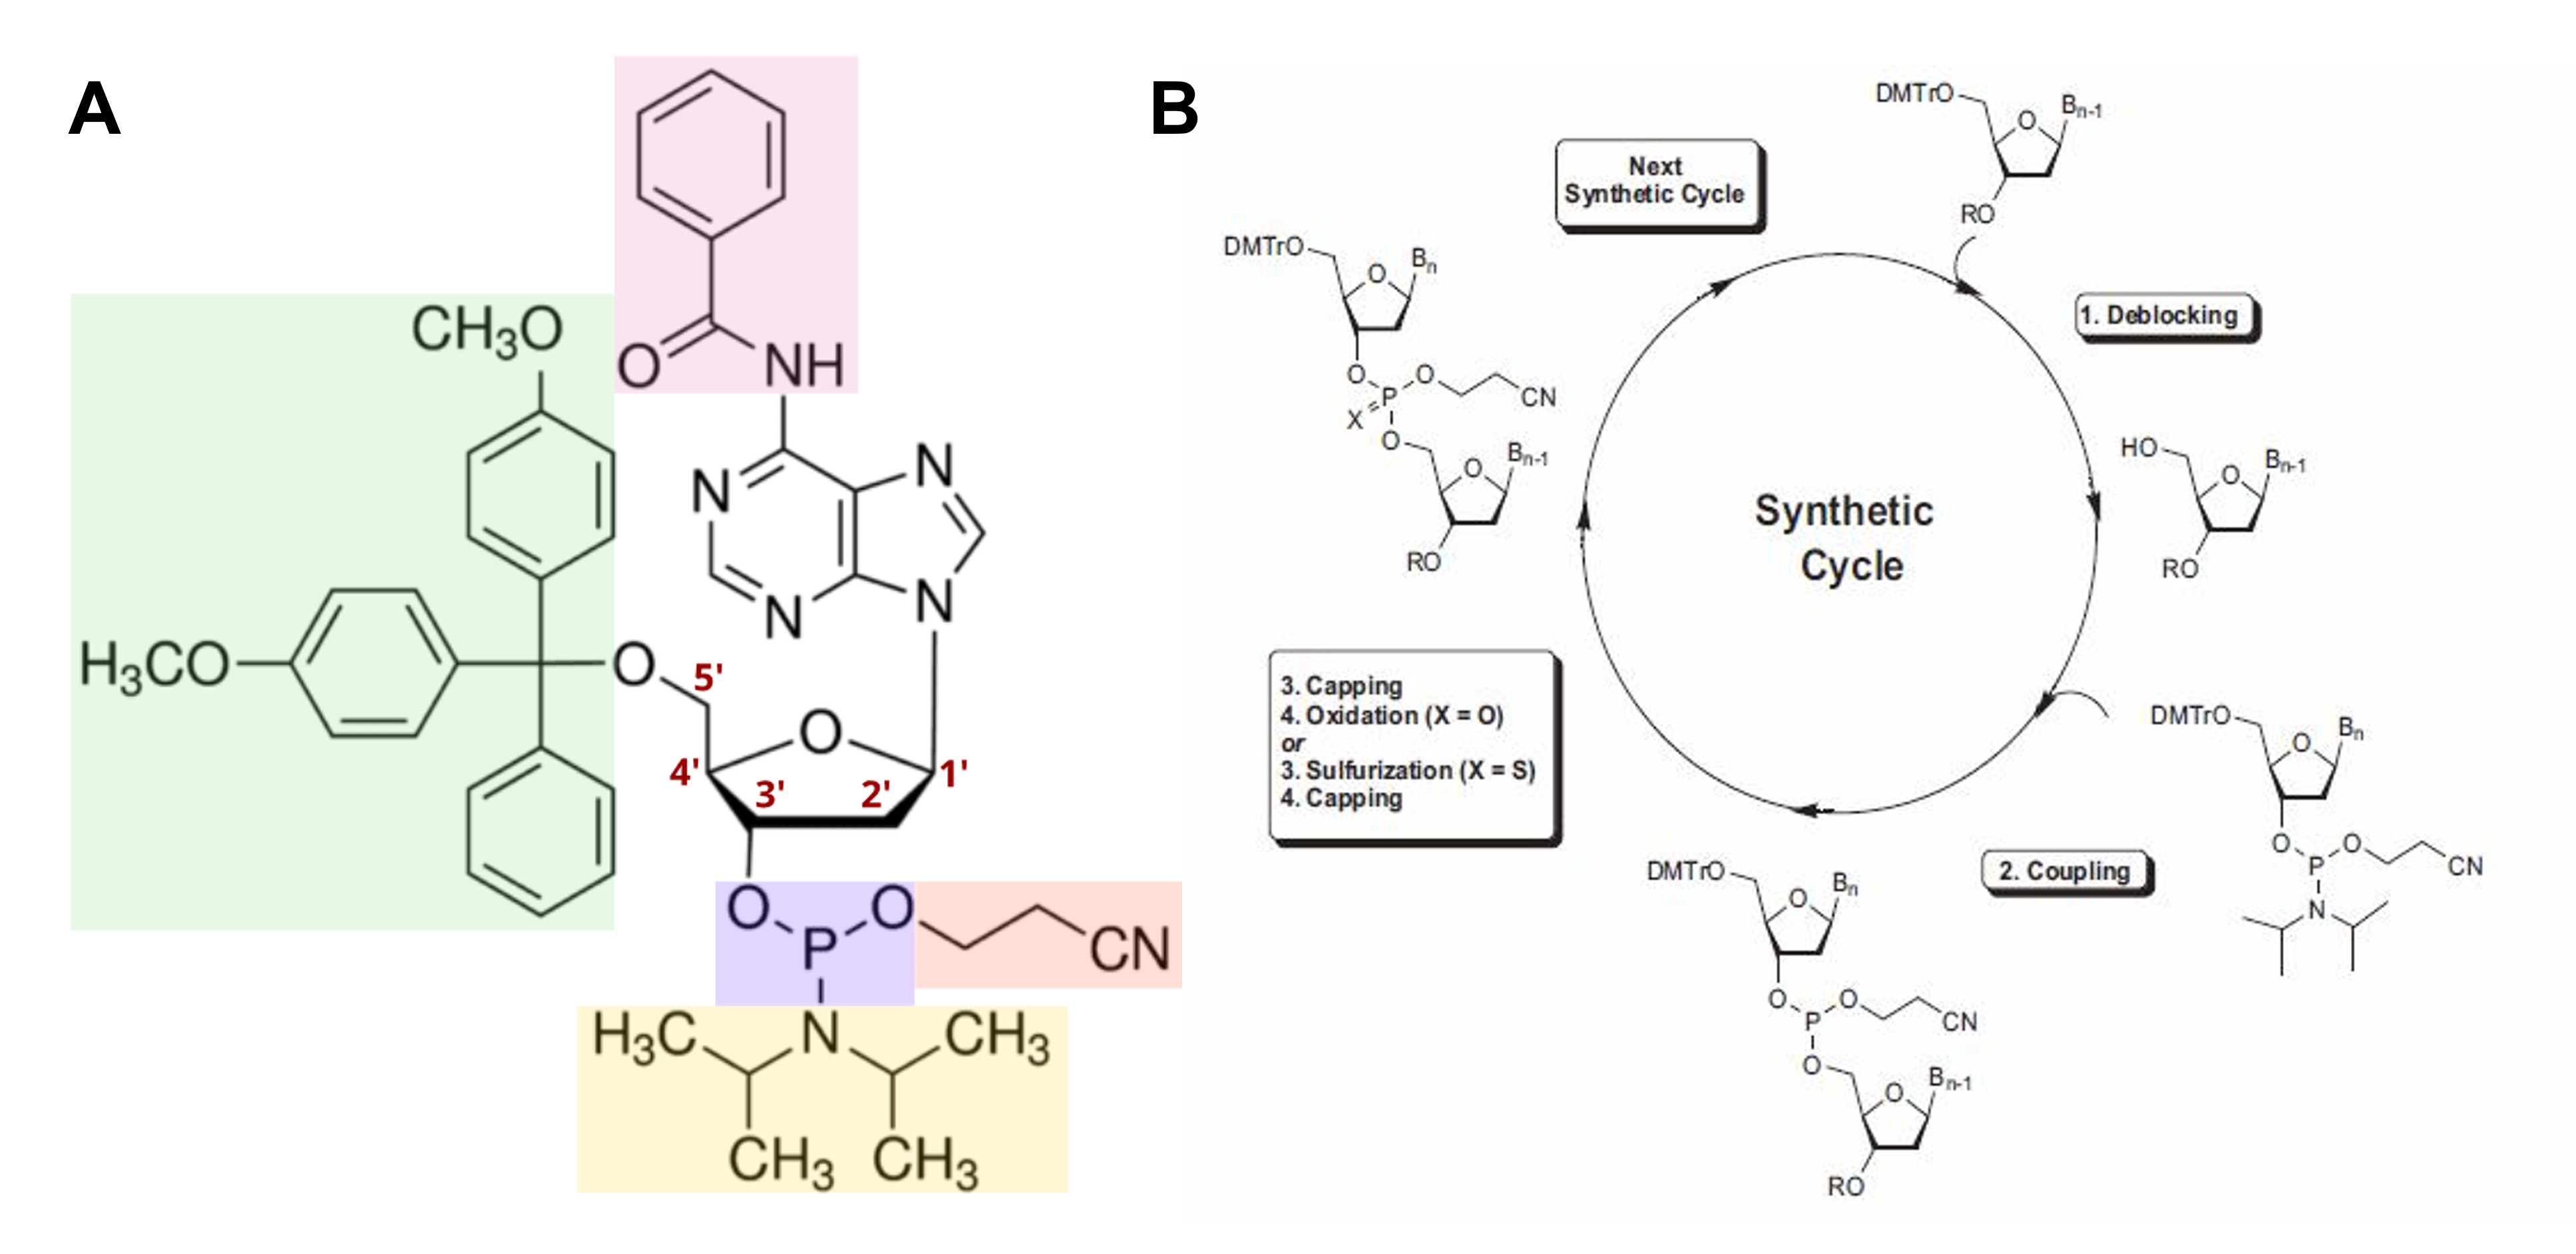
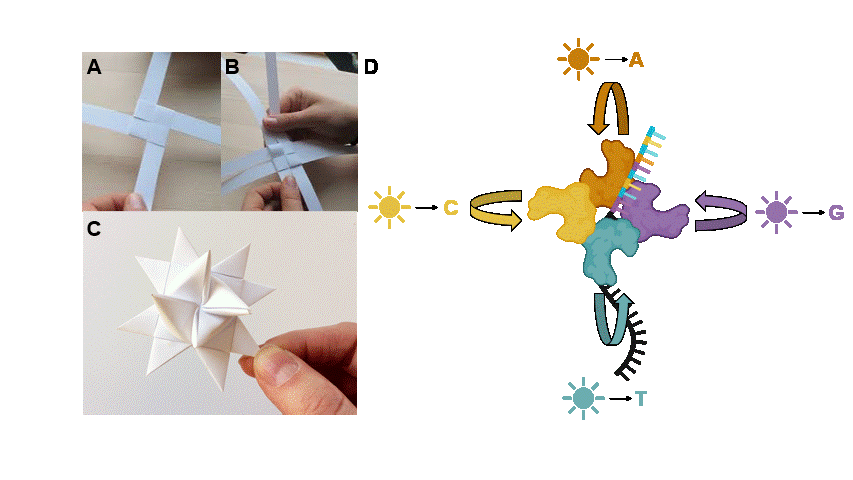
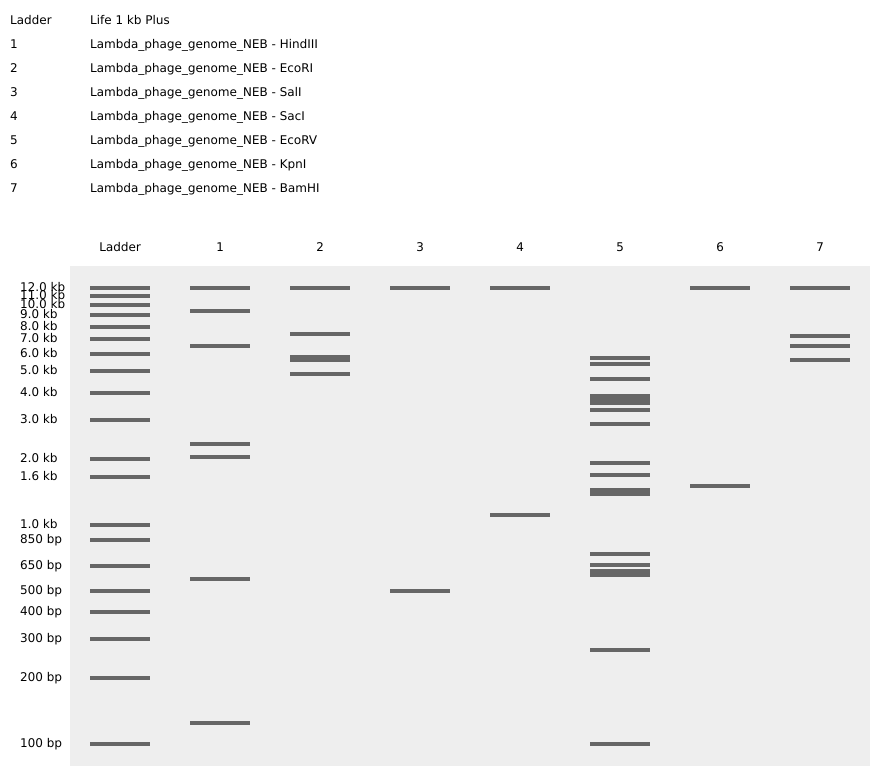
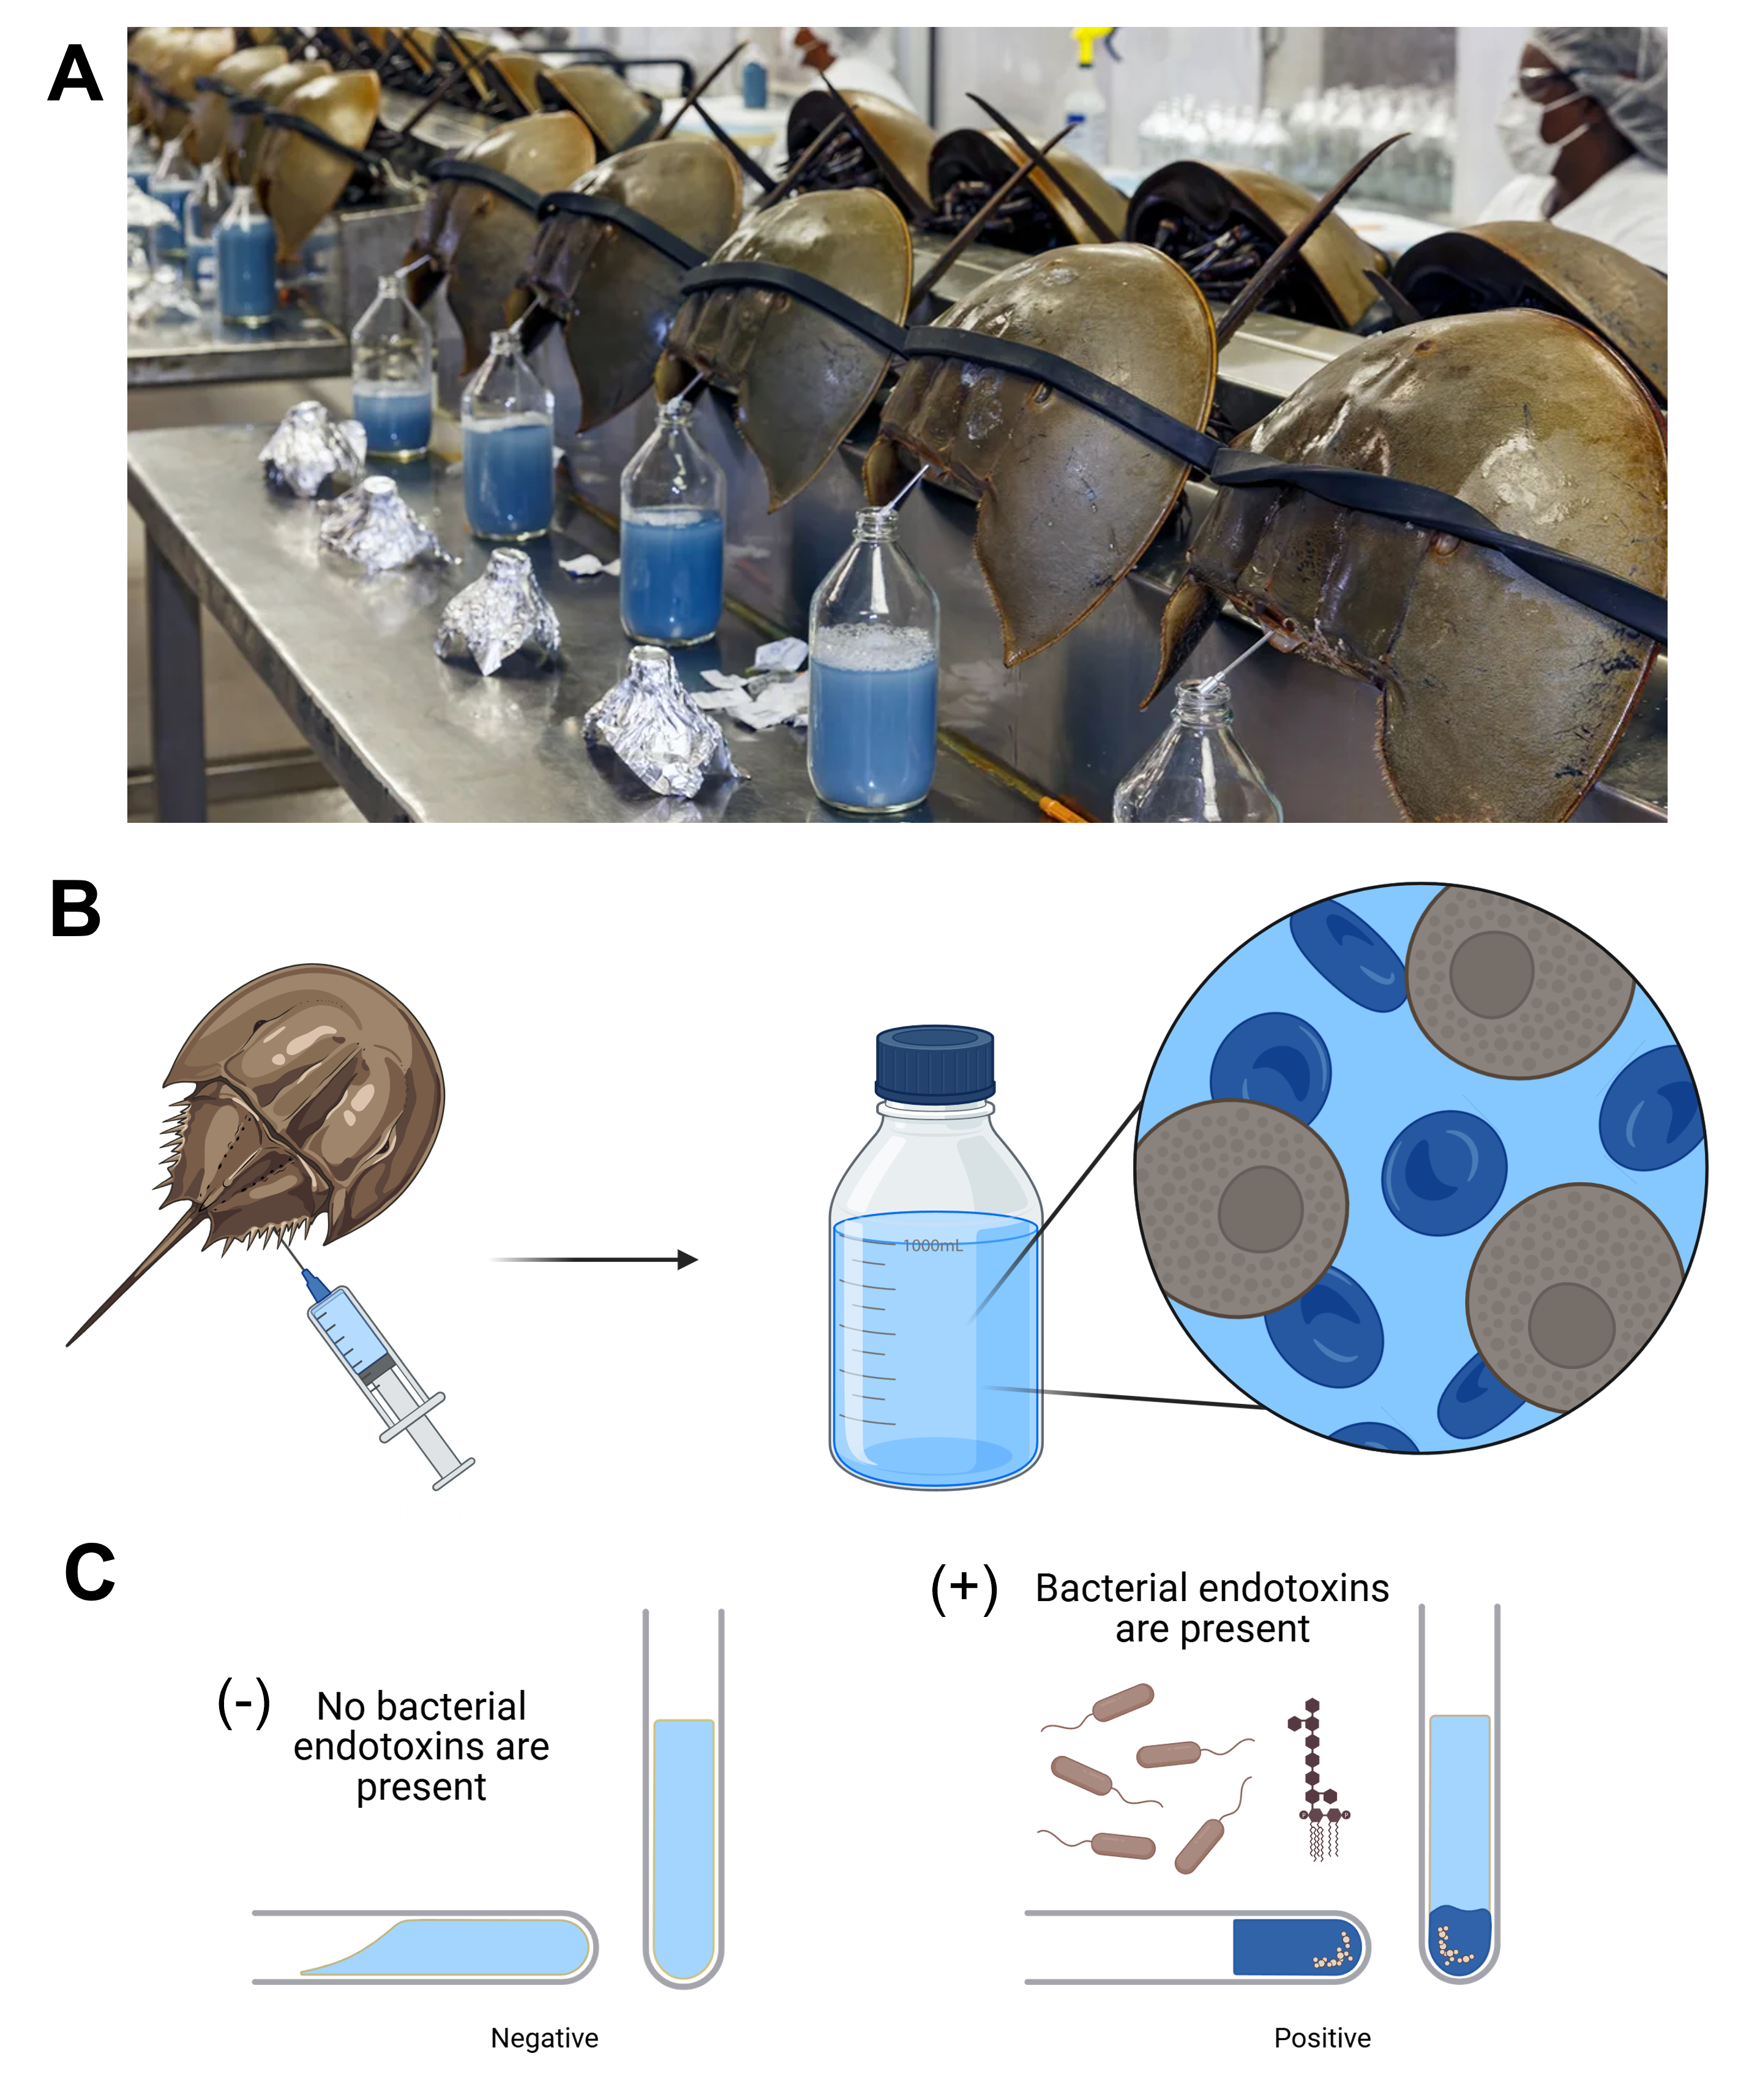
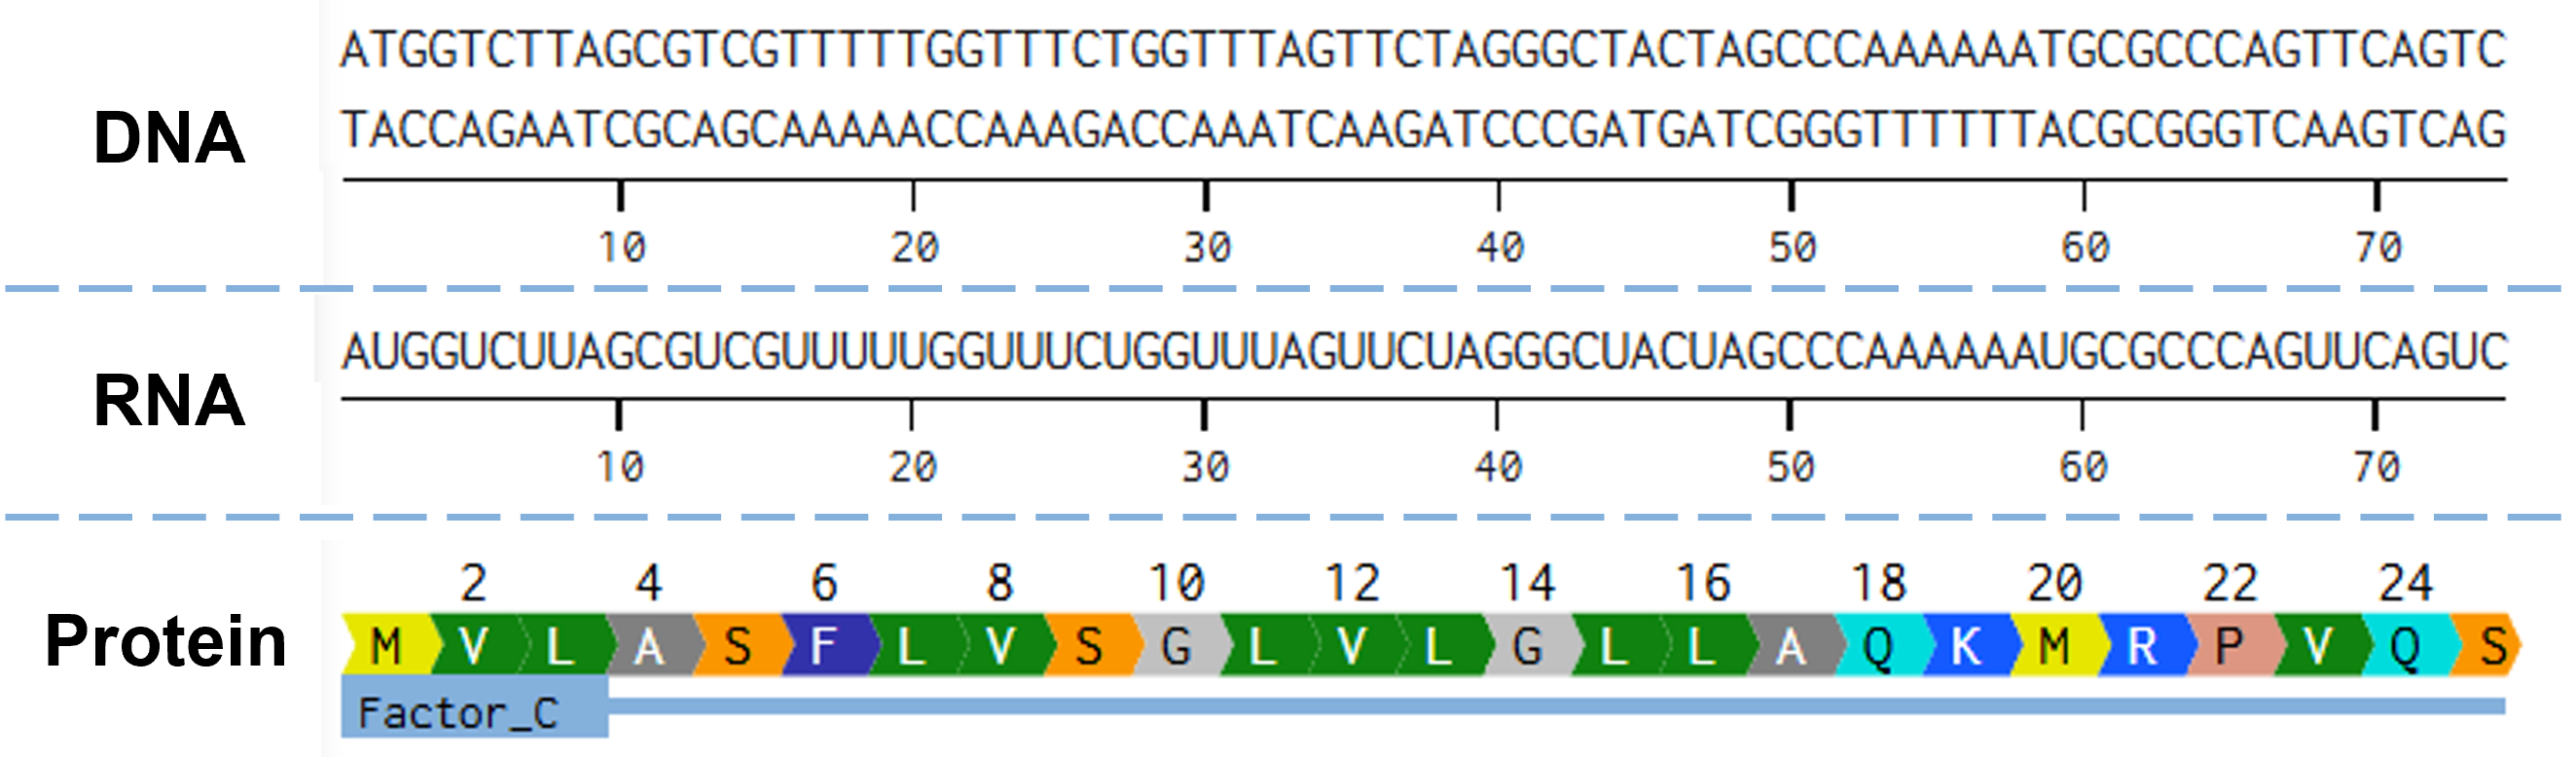

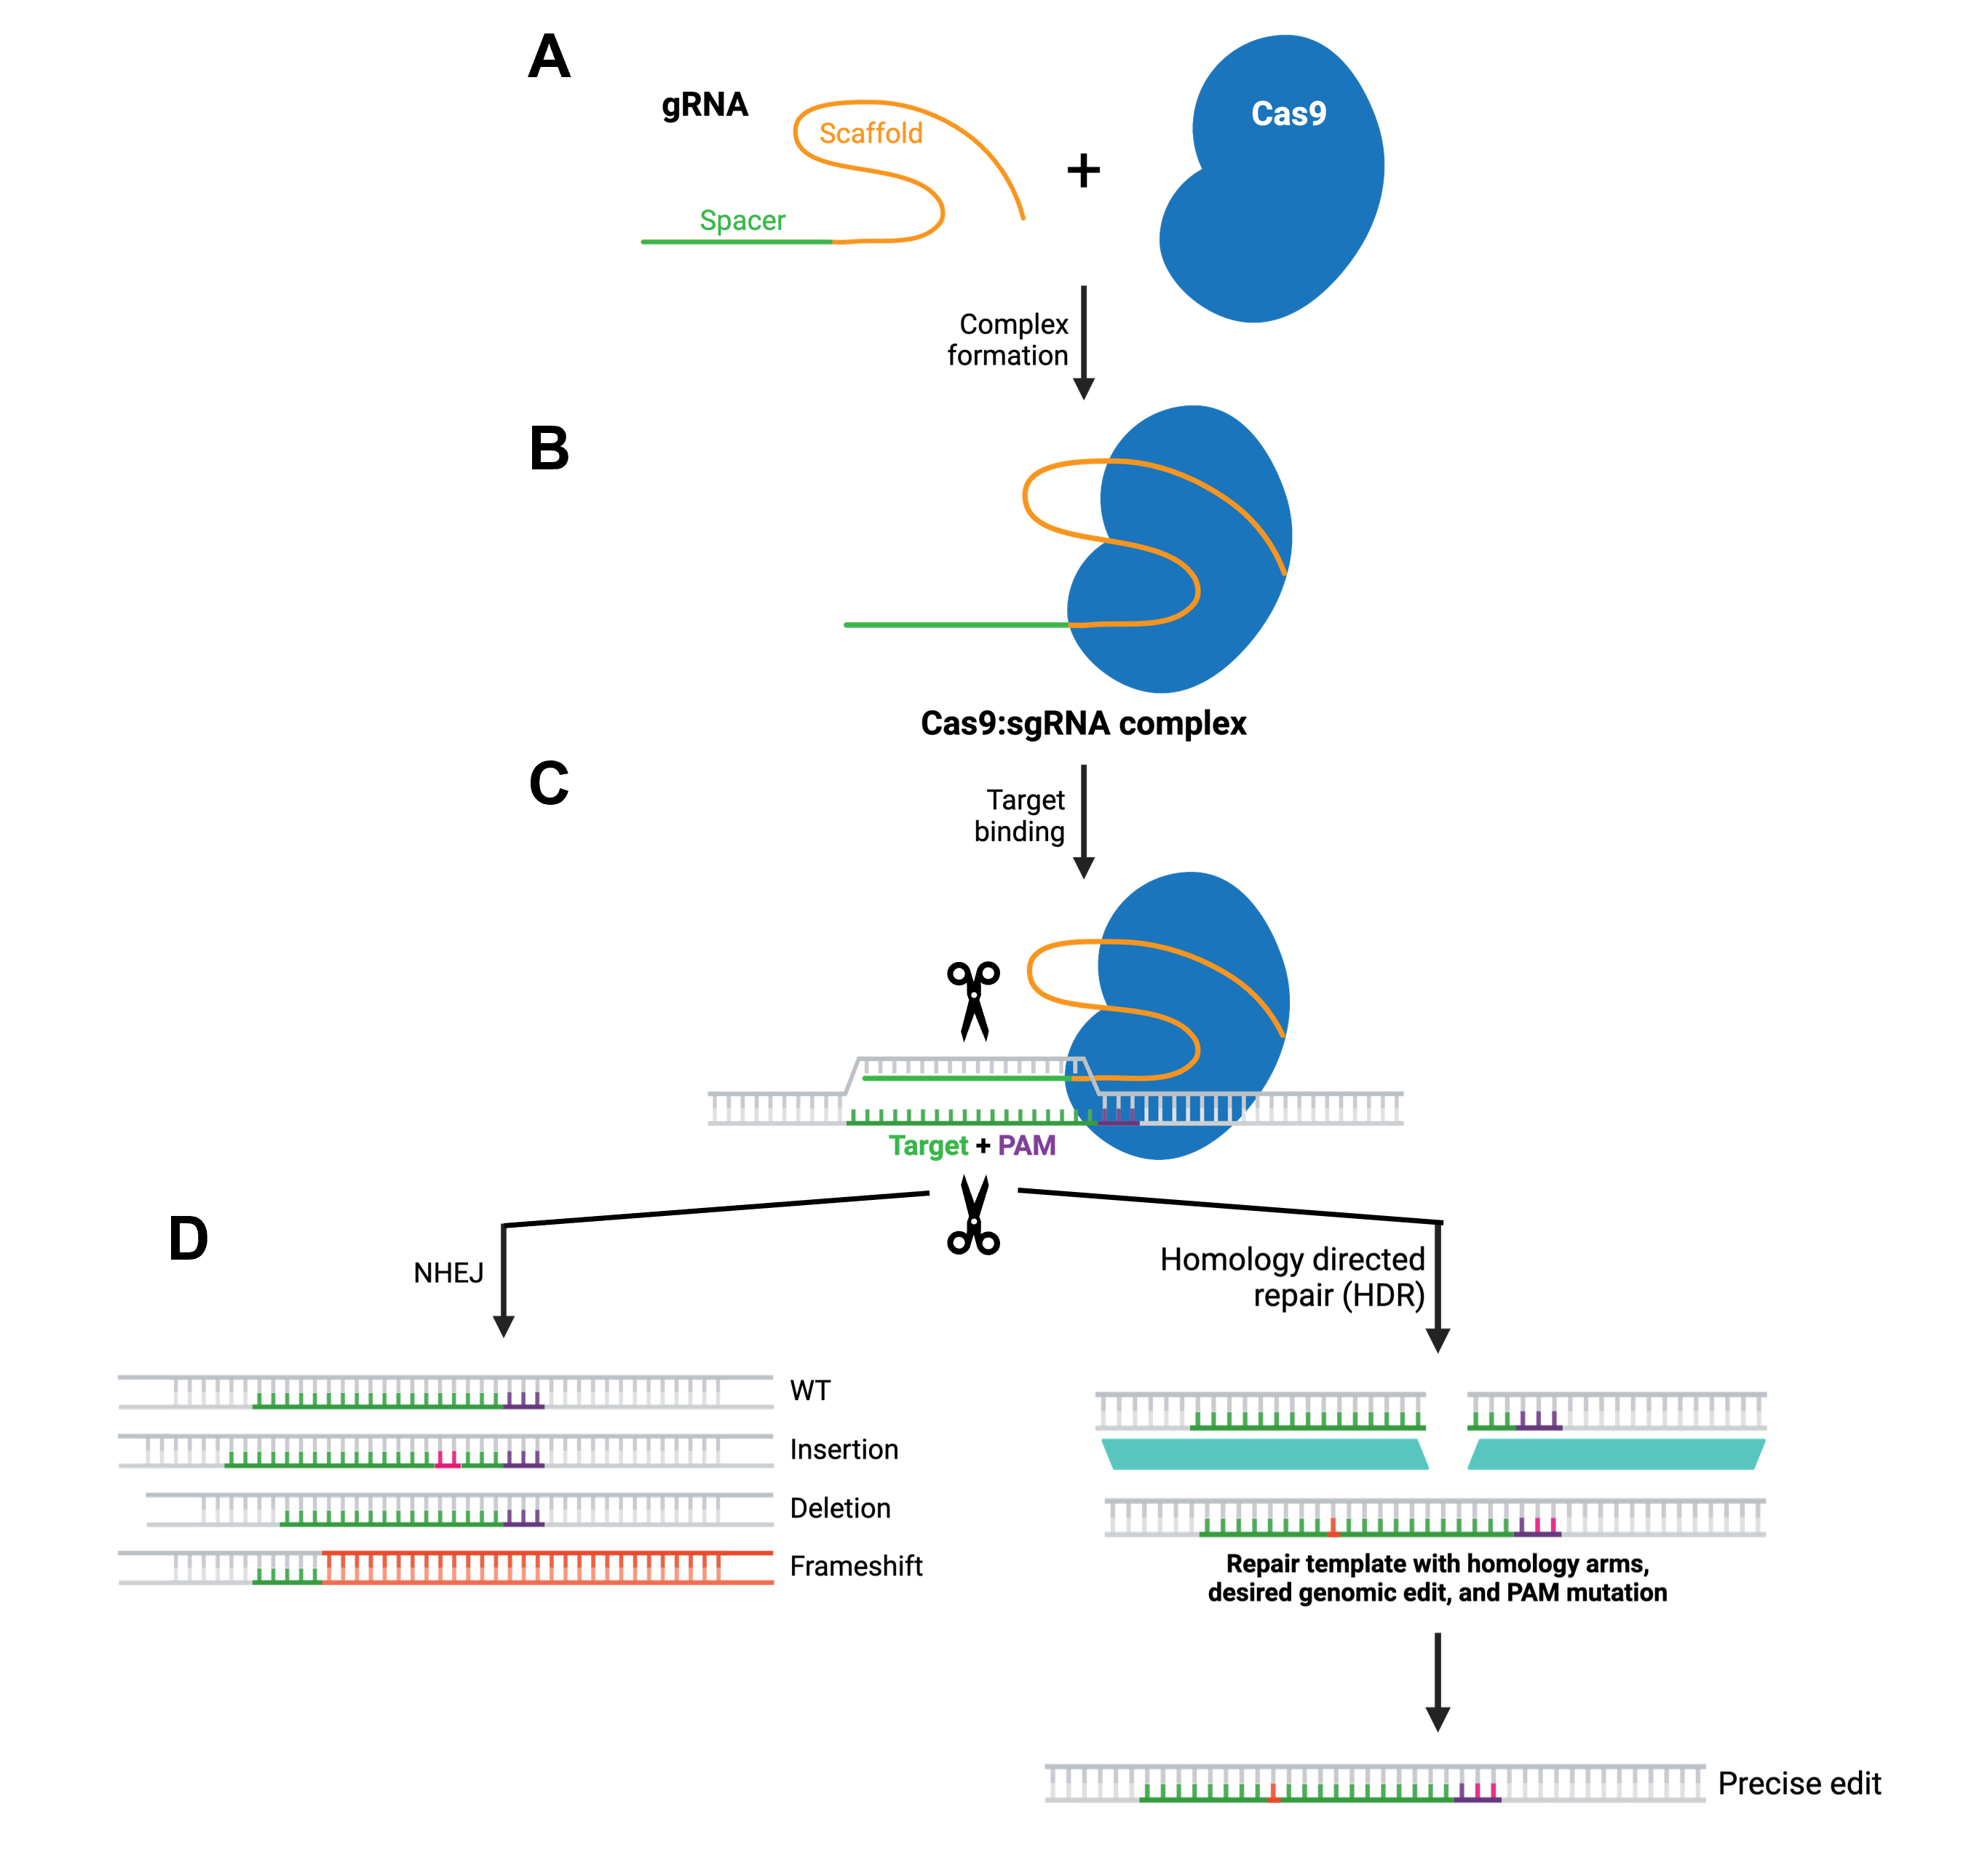


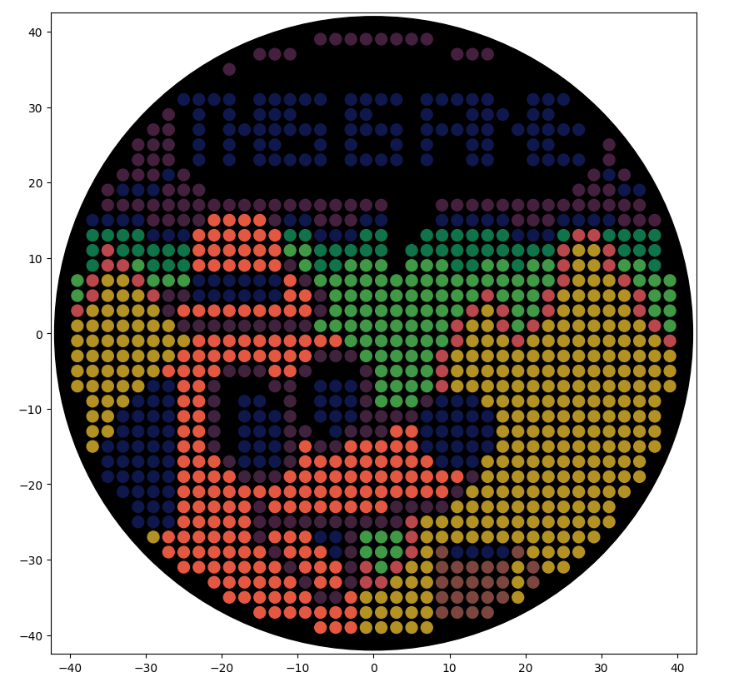
 Figure 3.4 Combinatorial characterization of parts from the Rhodo-Box toolkit using a semiautomated cloning workflow on the Opentrons OT2 platform. (A) General layout of the semiautomated workflow, combining five promoters (red) with six RBSs (green), and characterizing four terminators (blue) with eGFP. (B) Heat-map representing the combinatorial promoters and RBSs' strengths in *R. sphaeroides*. (C) Normalized fluorescence of tested terminators T0, B0010, B0015, J95029 expressed in combinations of P~J23100~ and P~J95025~ with B0034 and B0030. Graphs (B, C) represent the average fluorescence values normalized with OD~600~, with the standard deviation of three technical replicates depicted in (C). Figure from Kostanjšek et al., 2026 [^1].

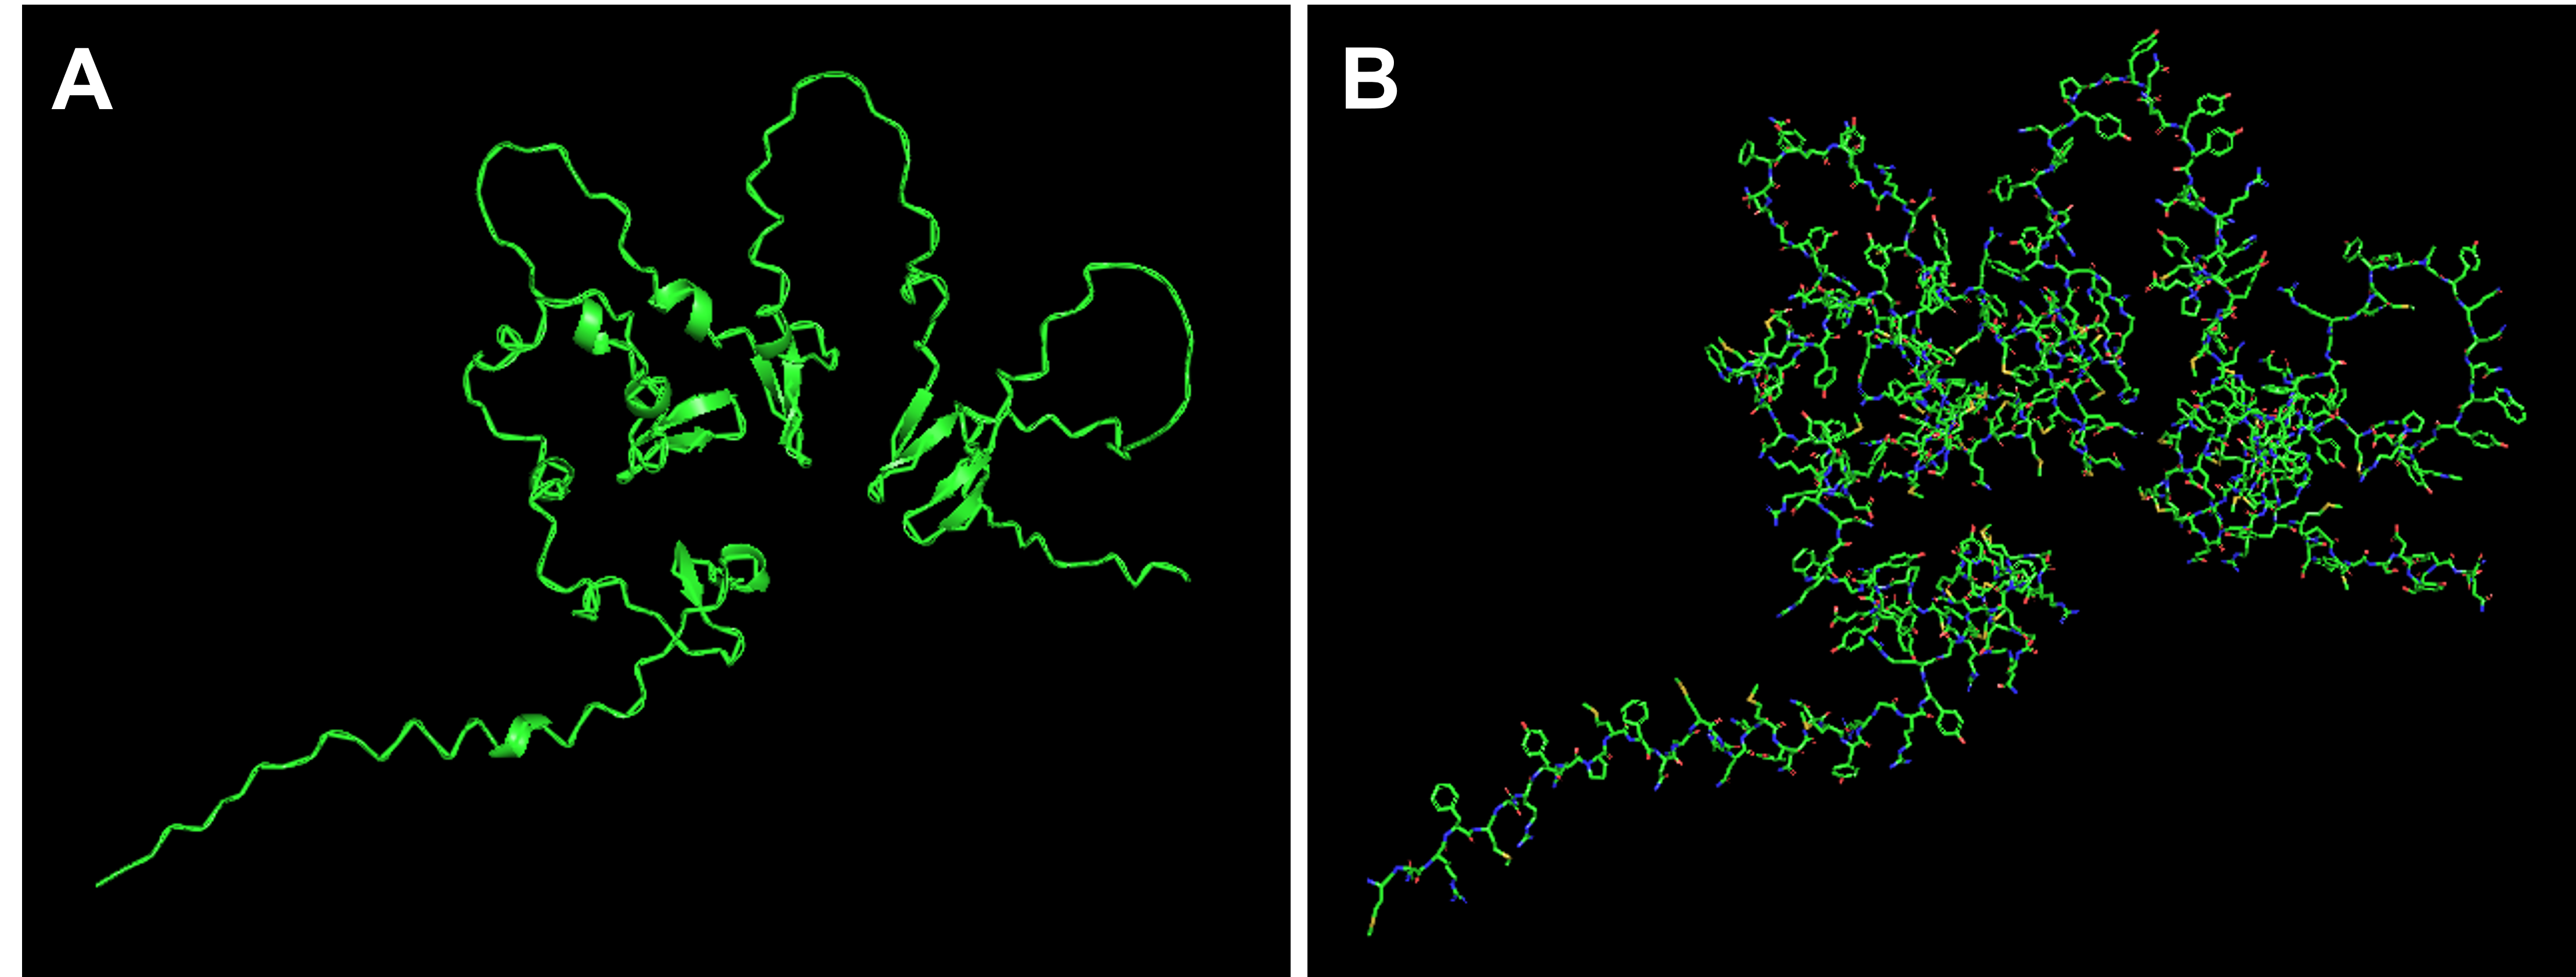
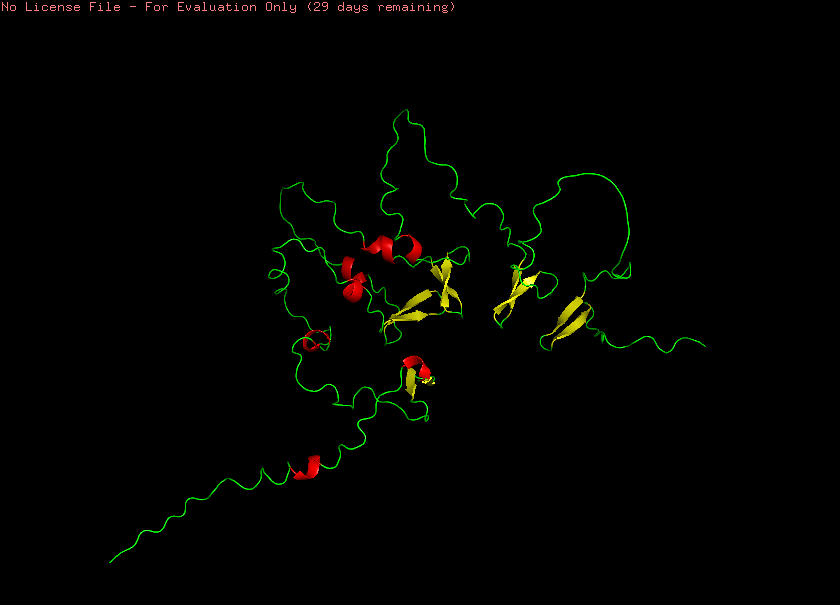
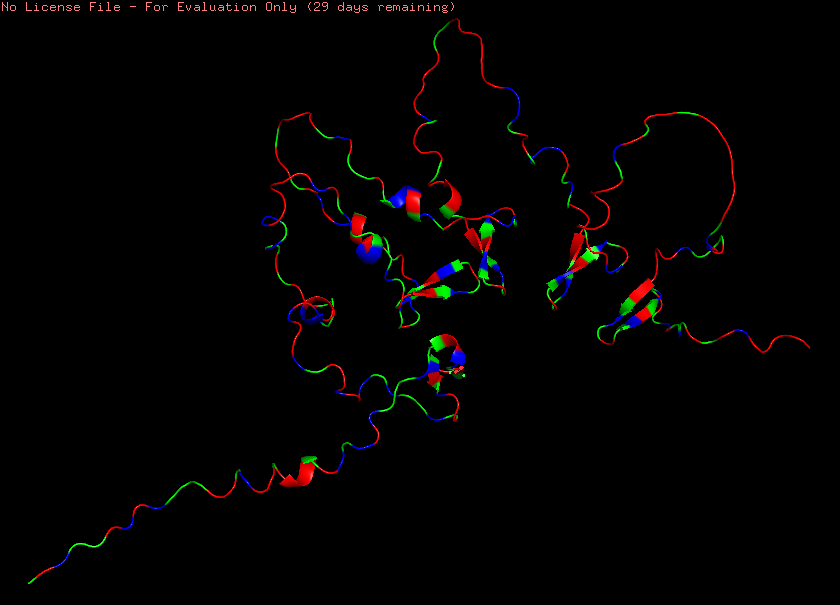
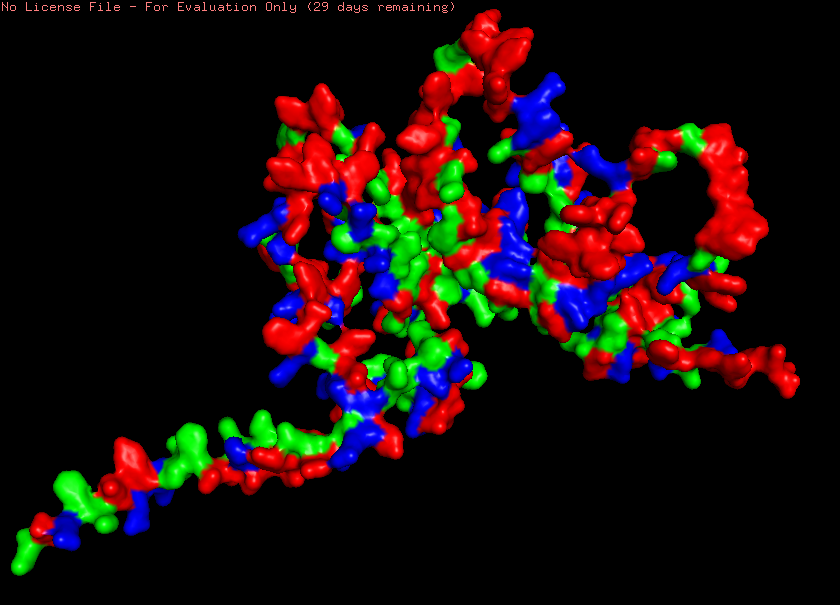
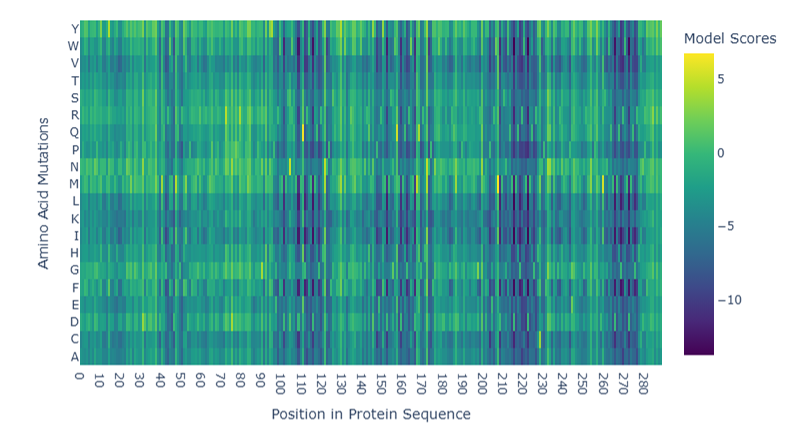
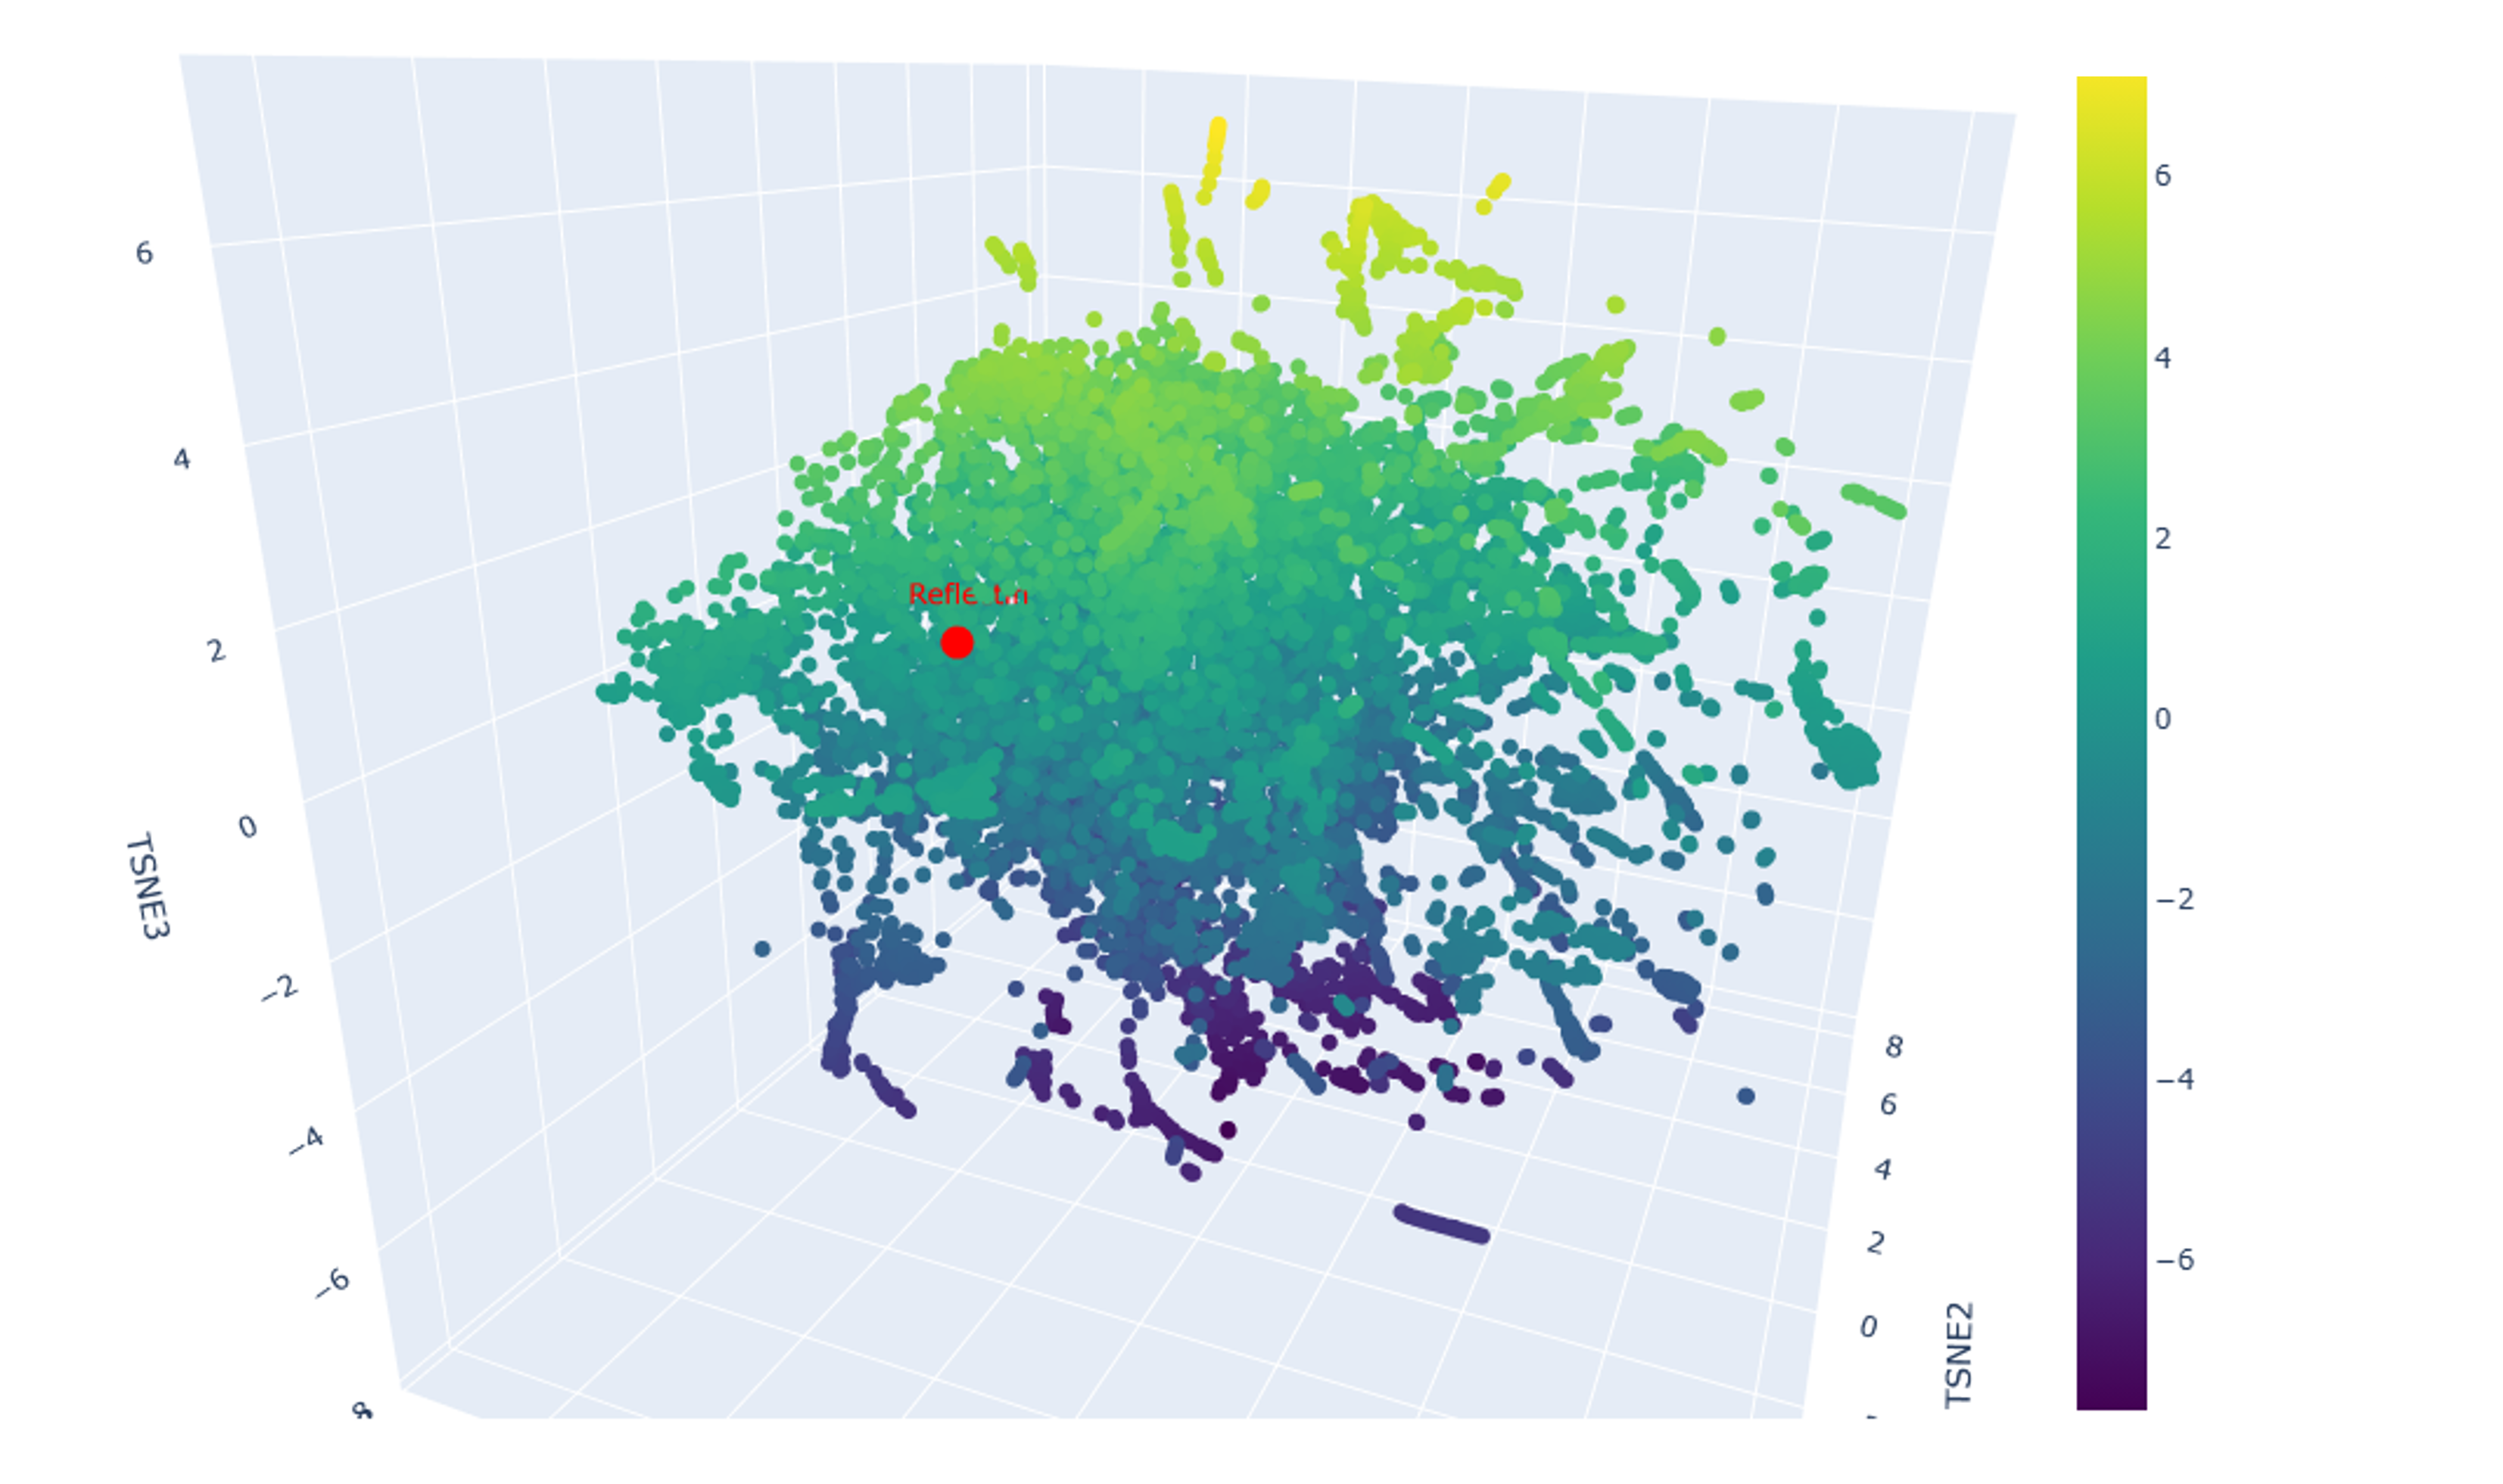
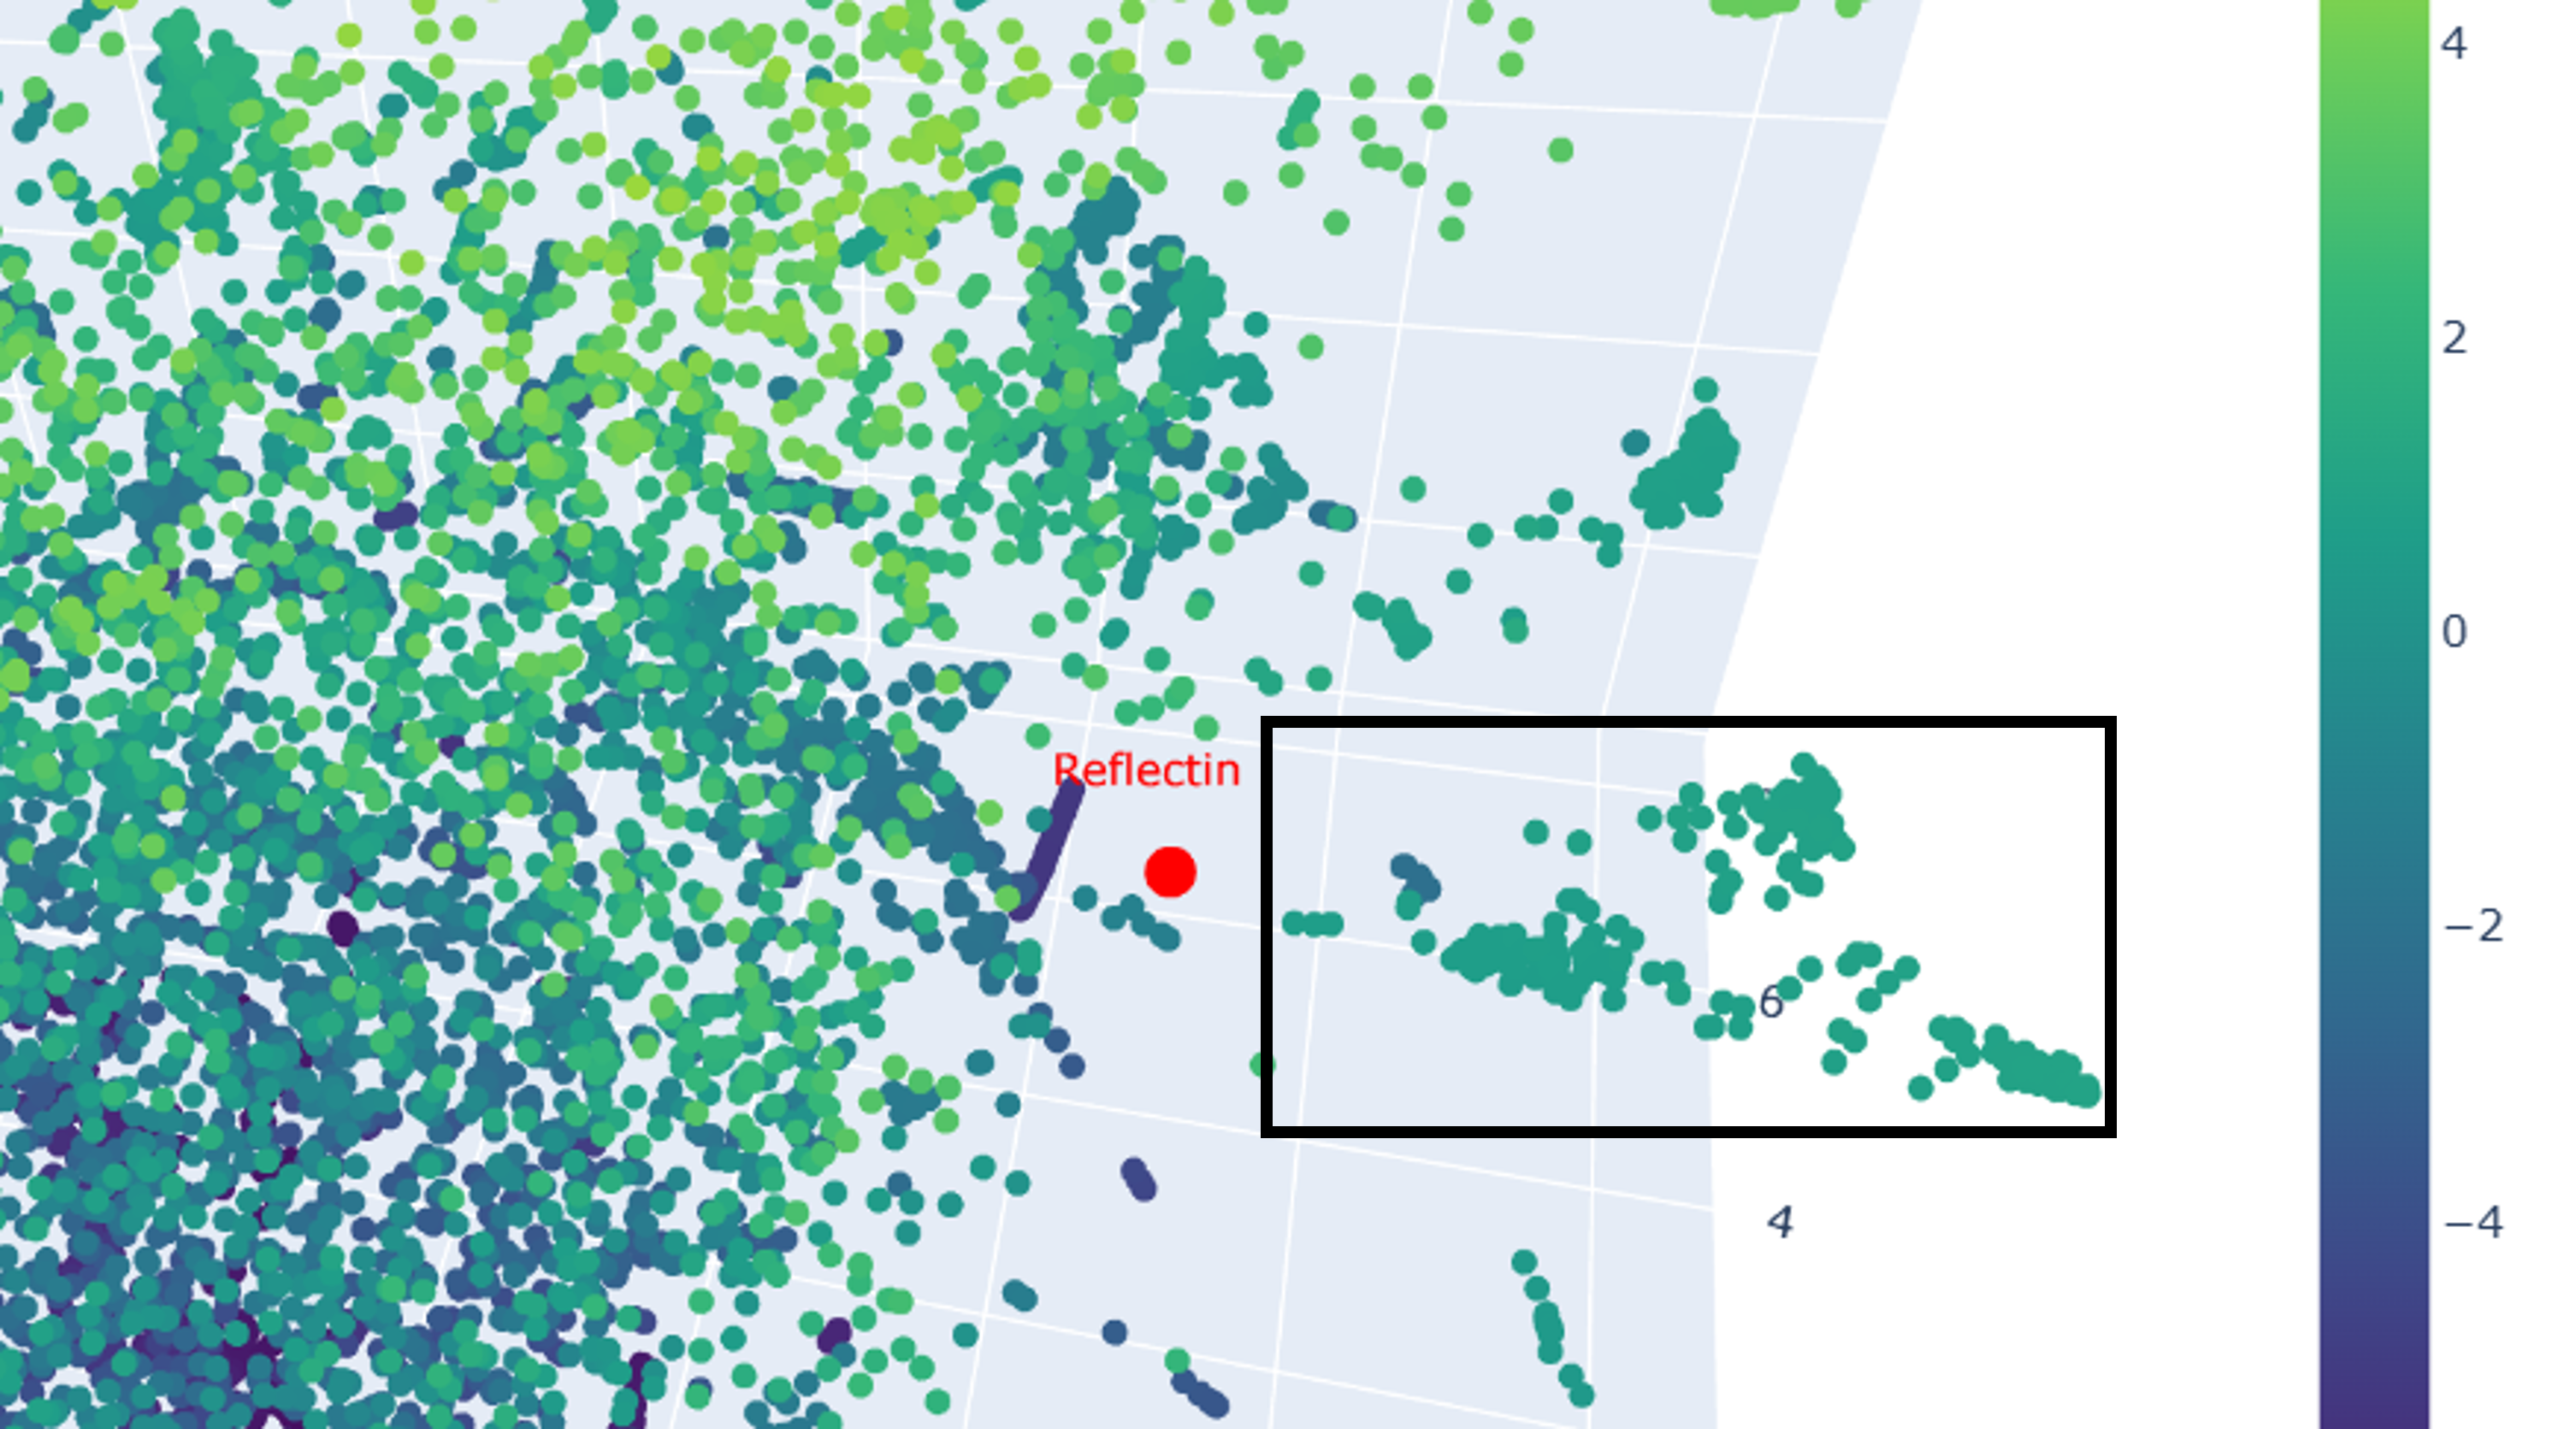
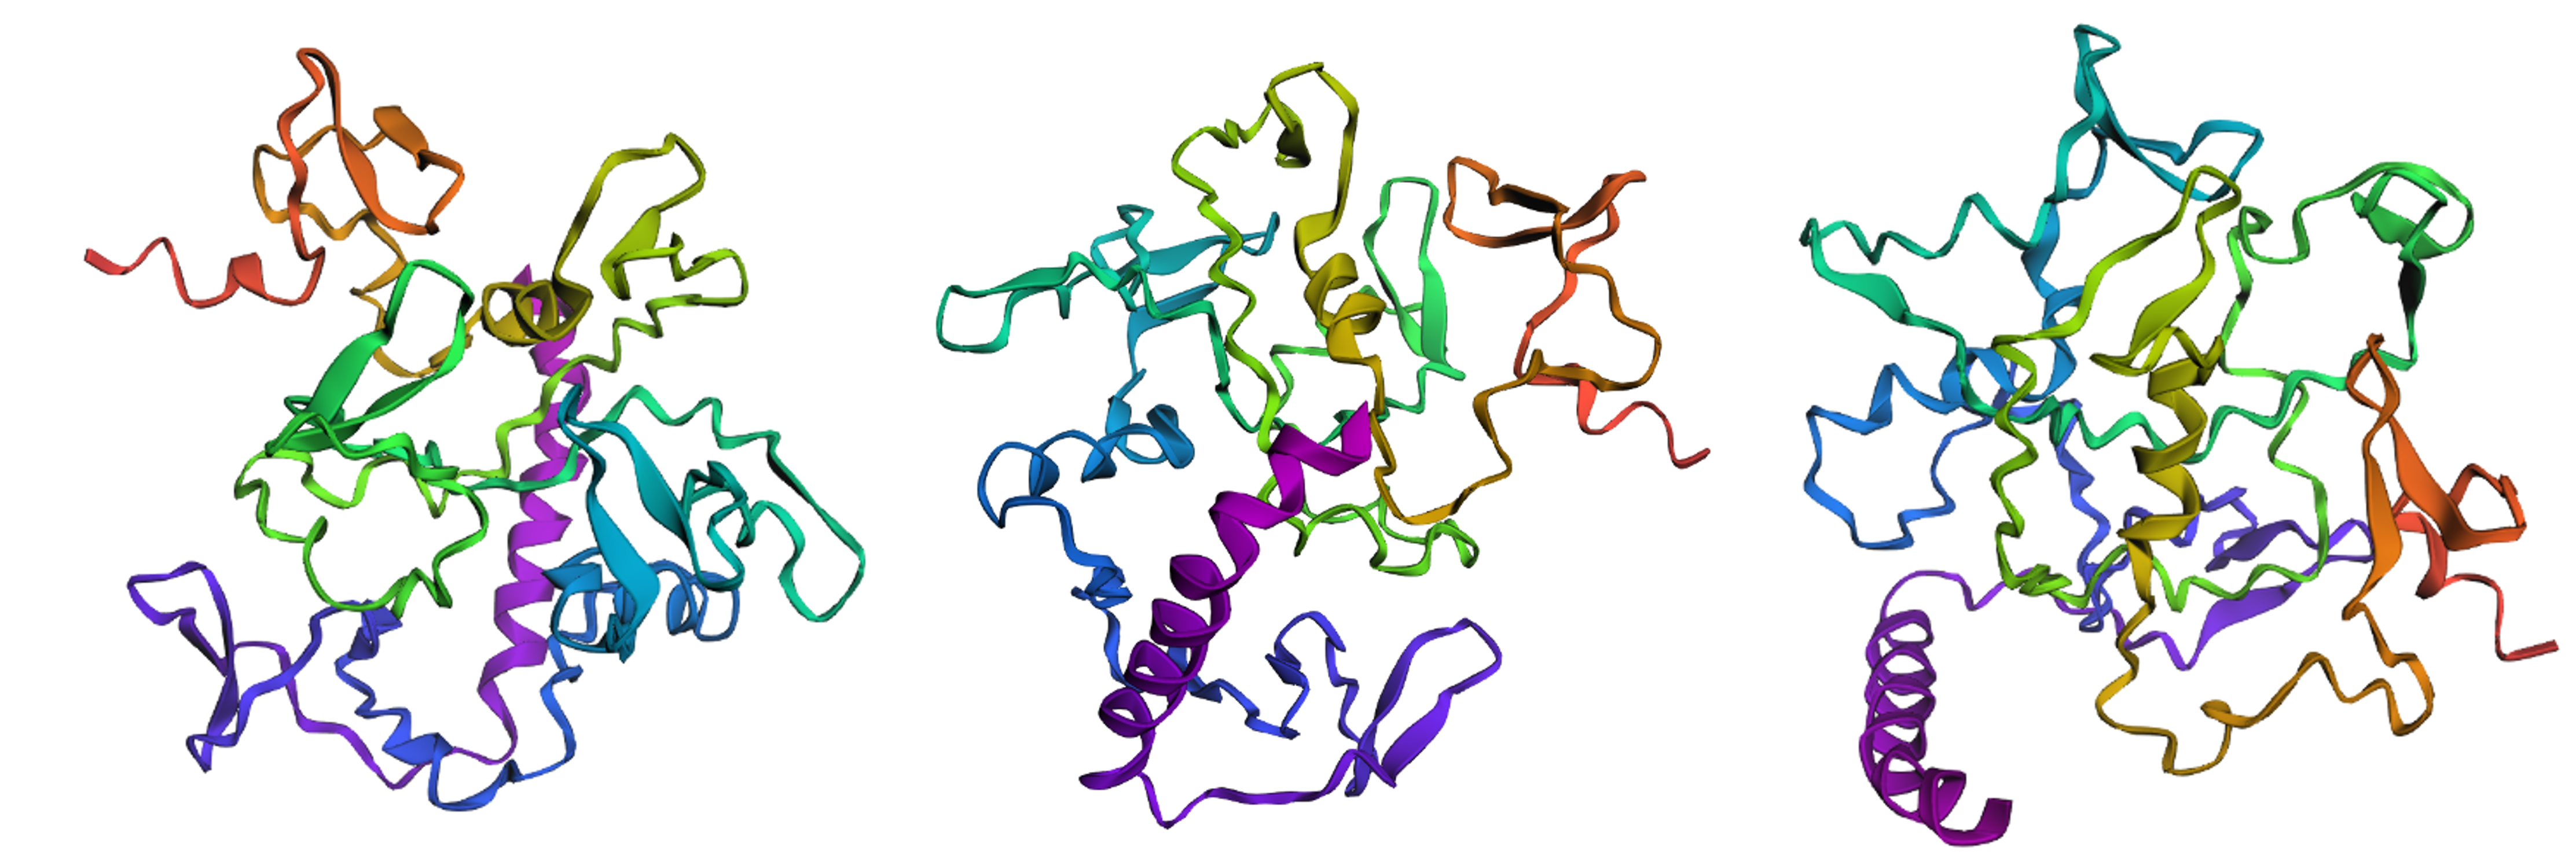
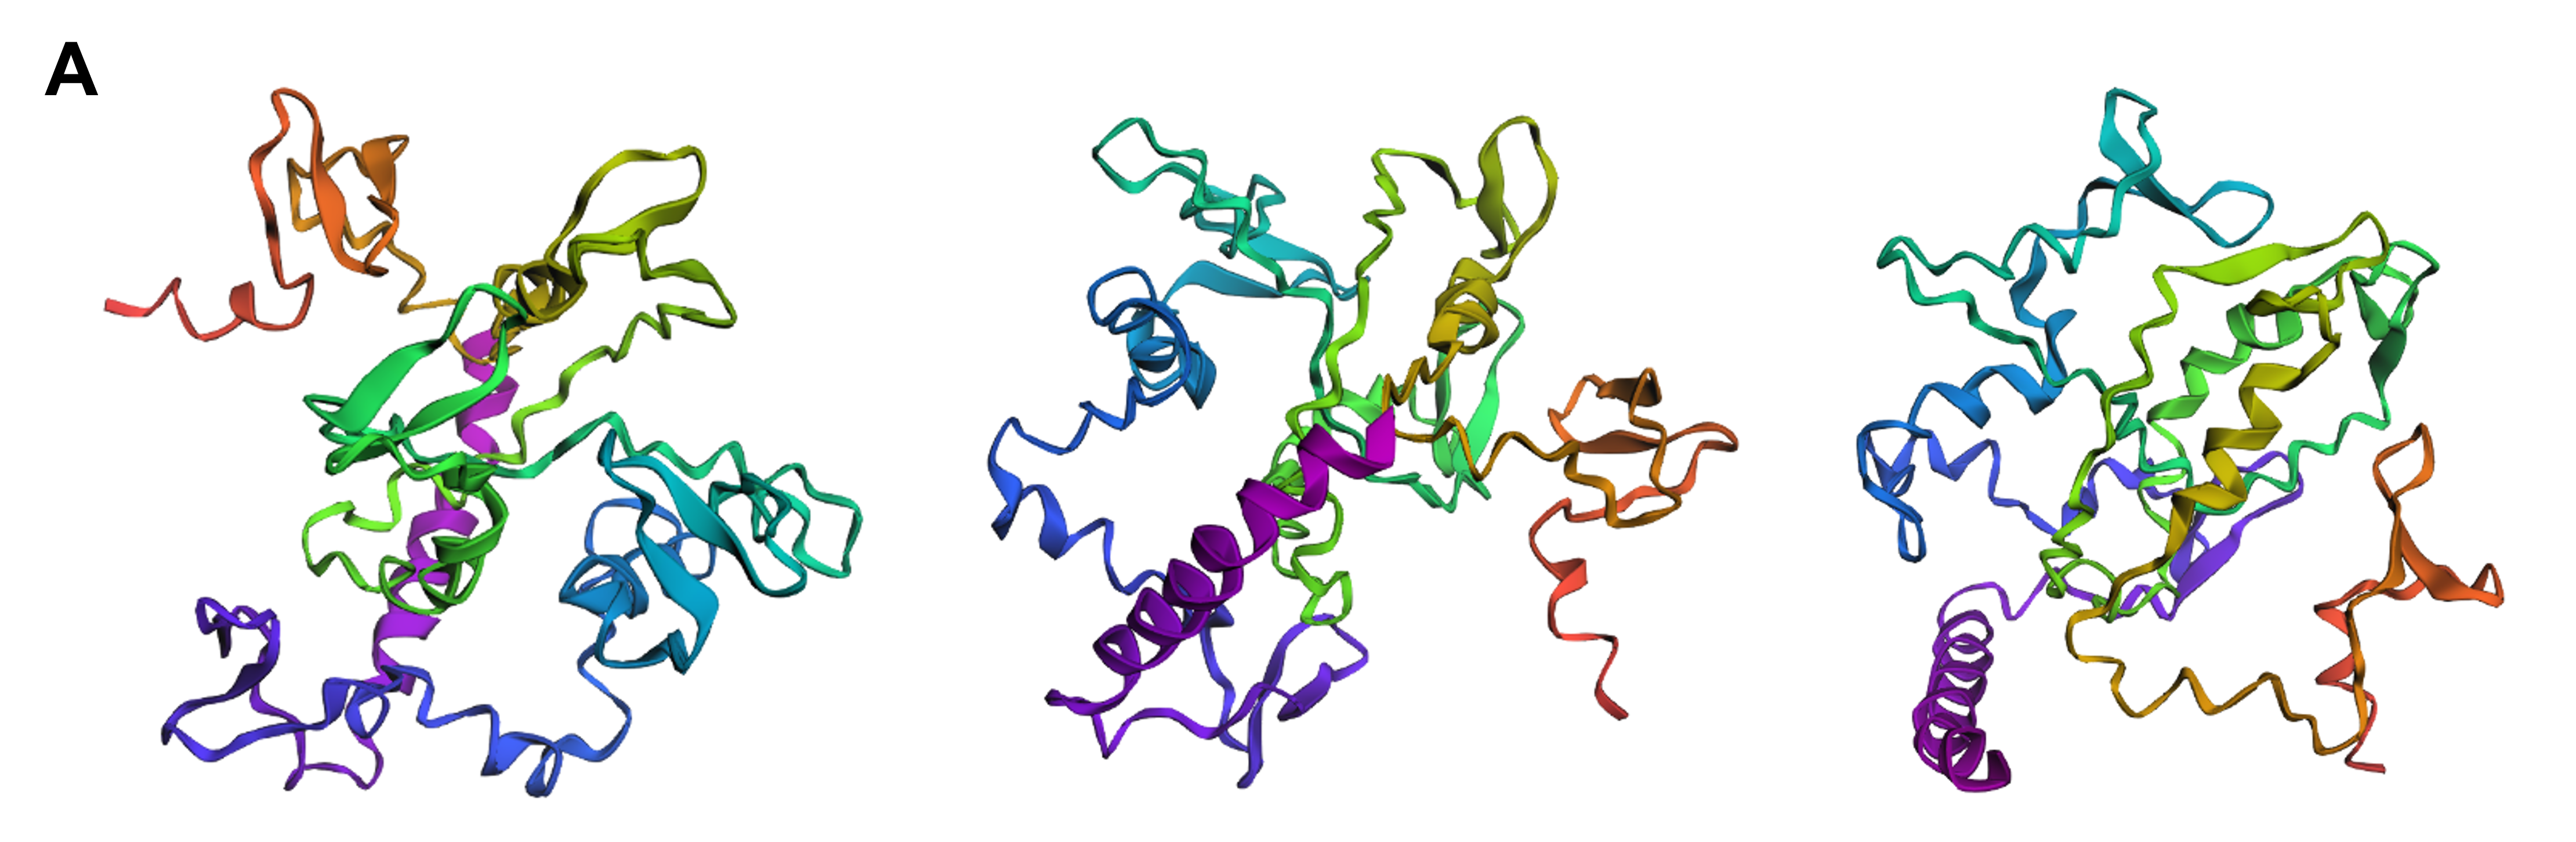
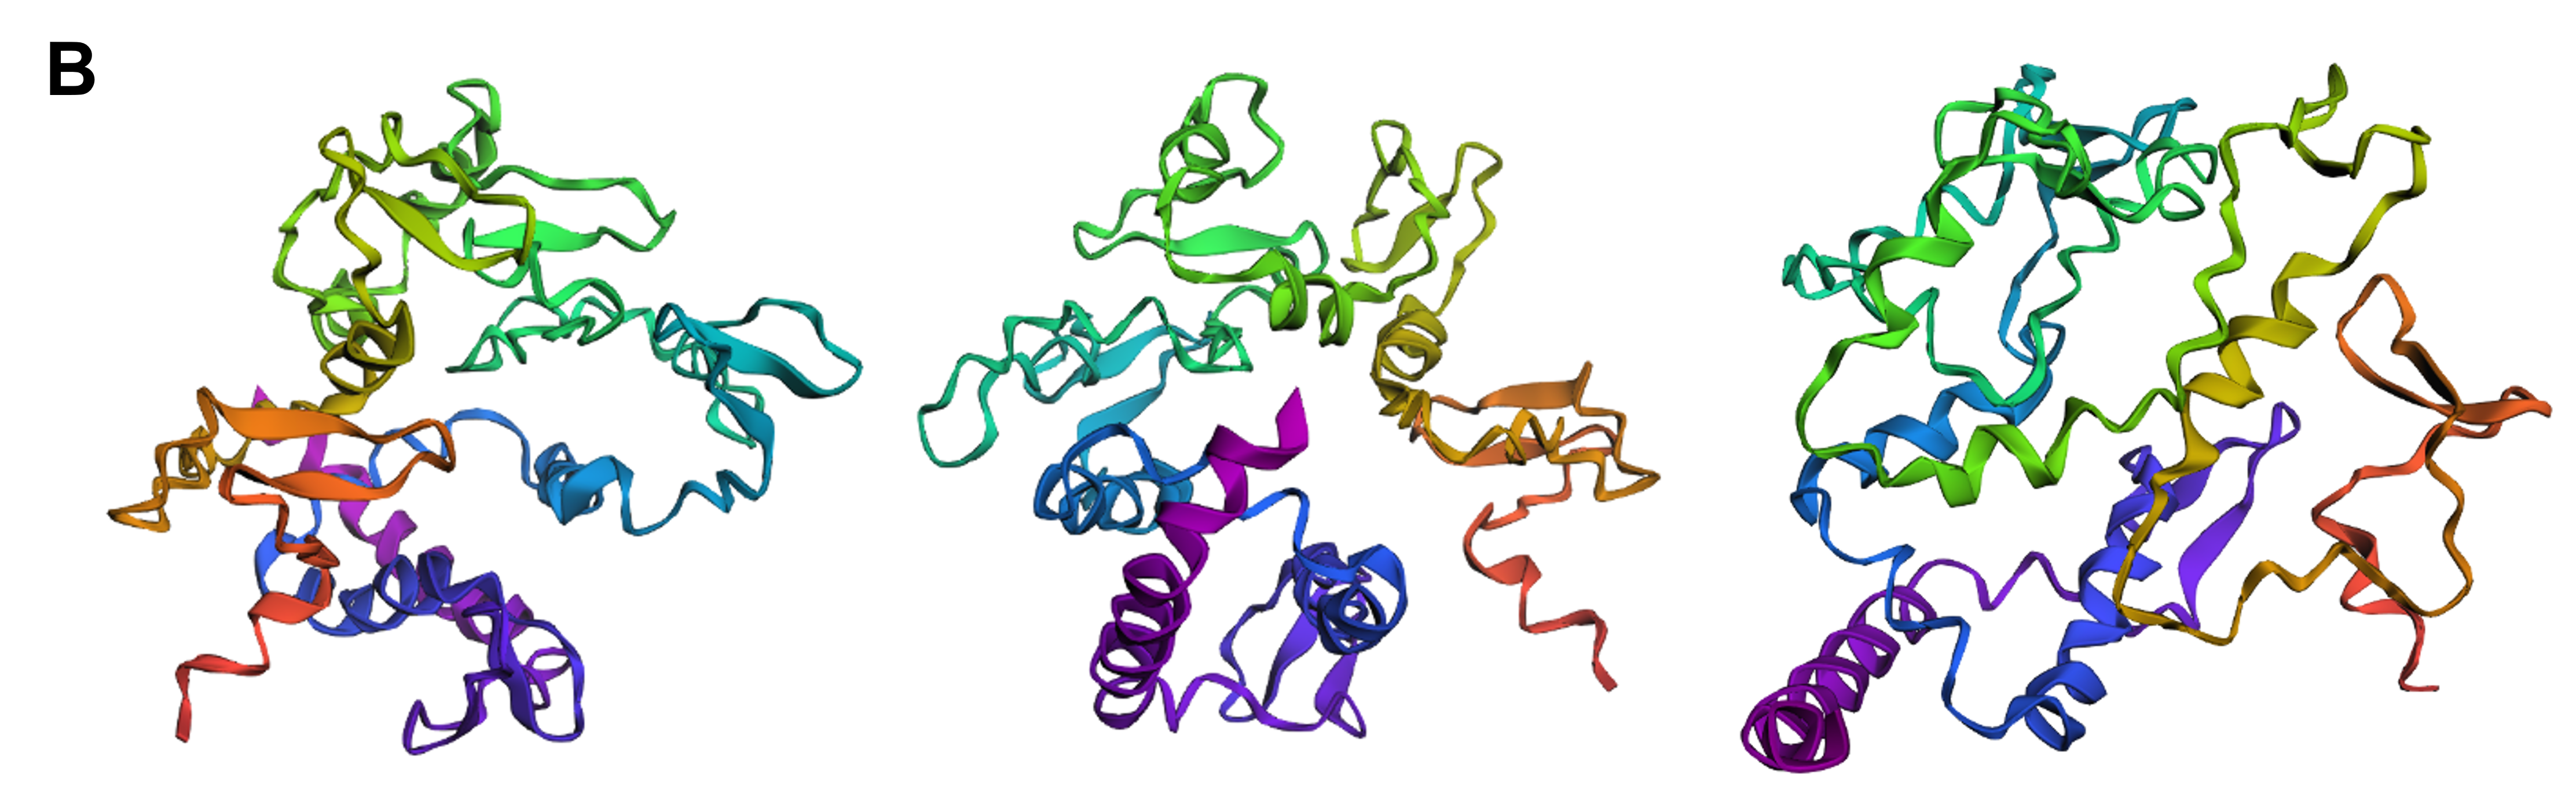
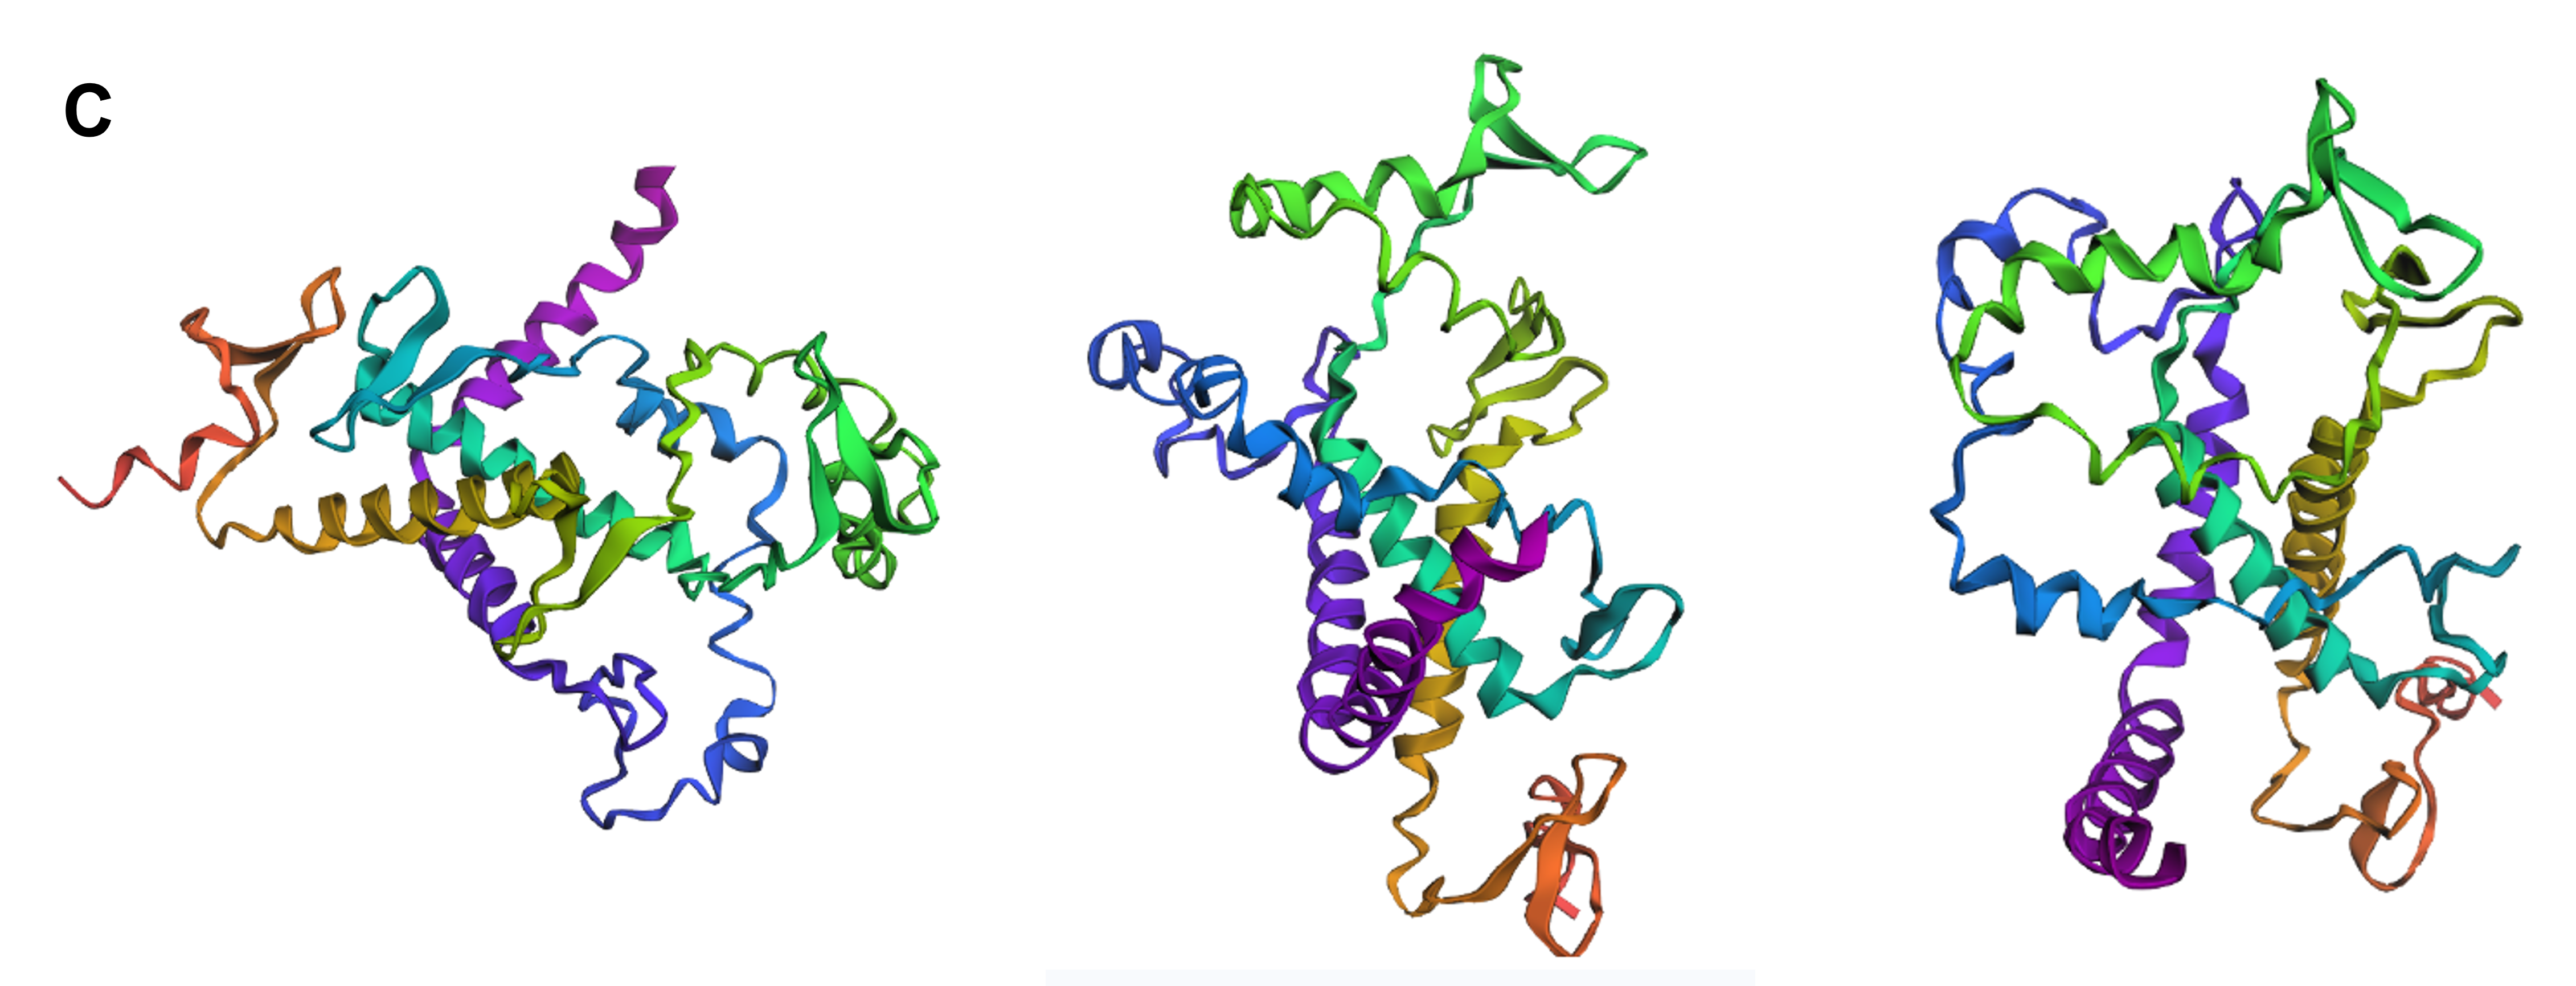
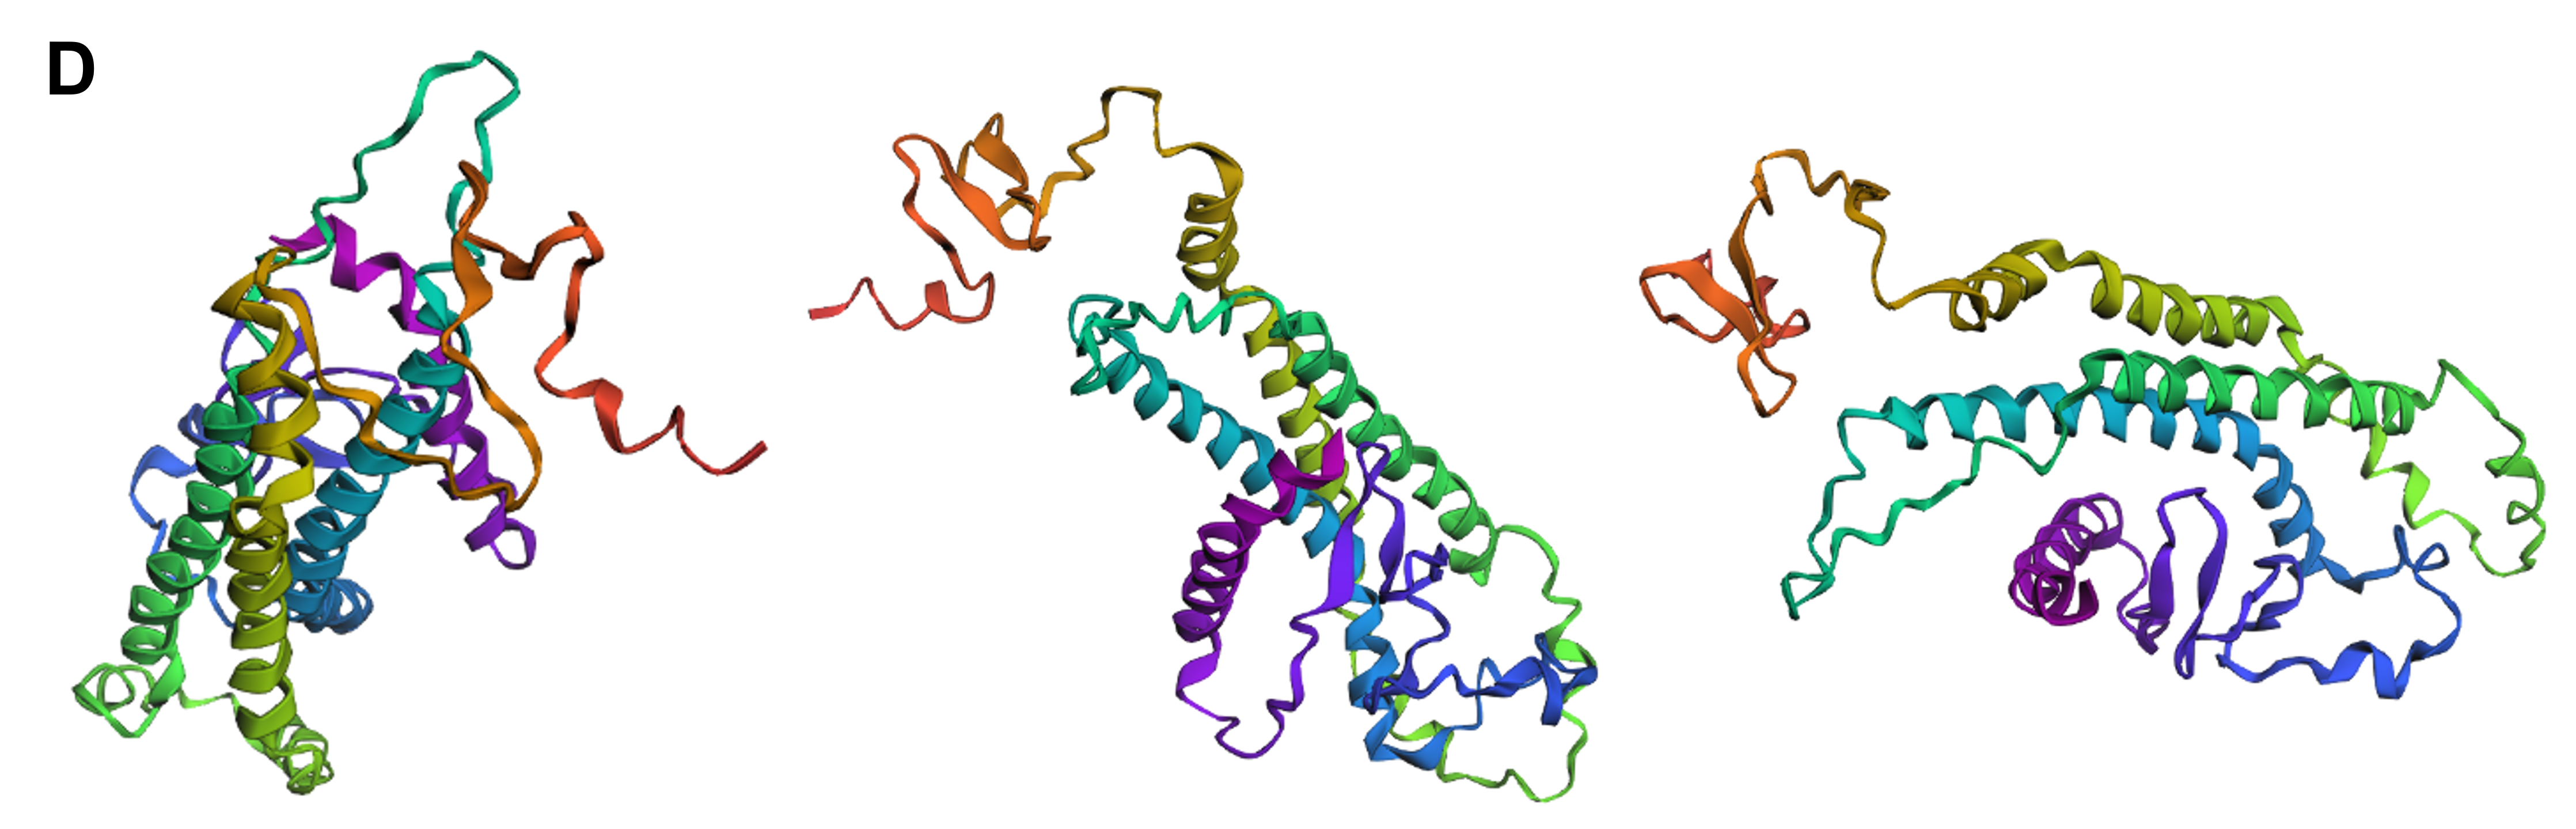
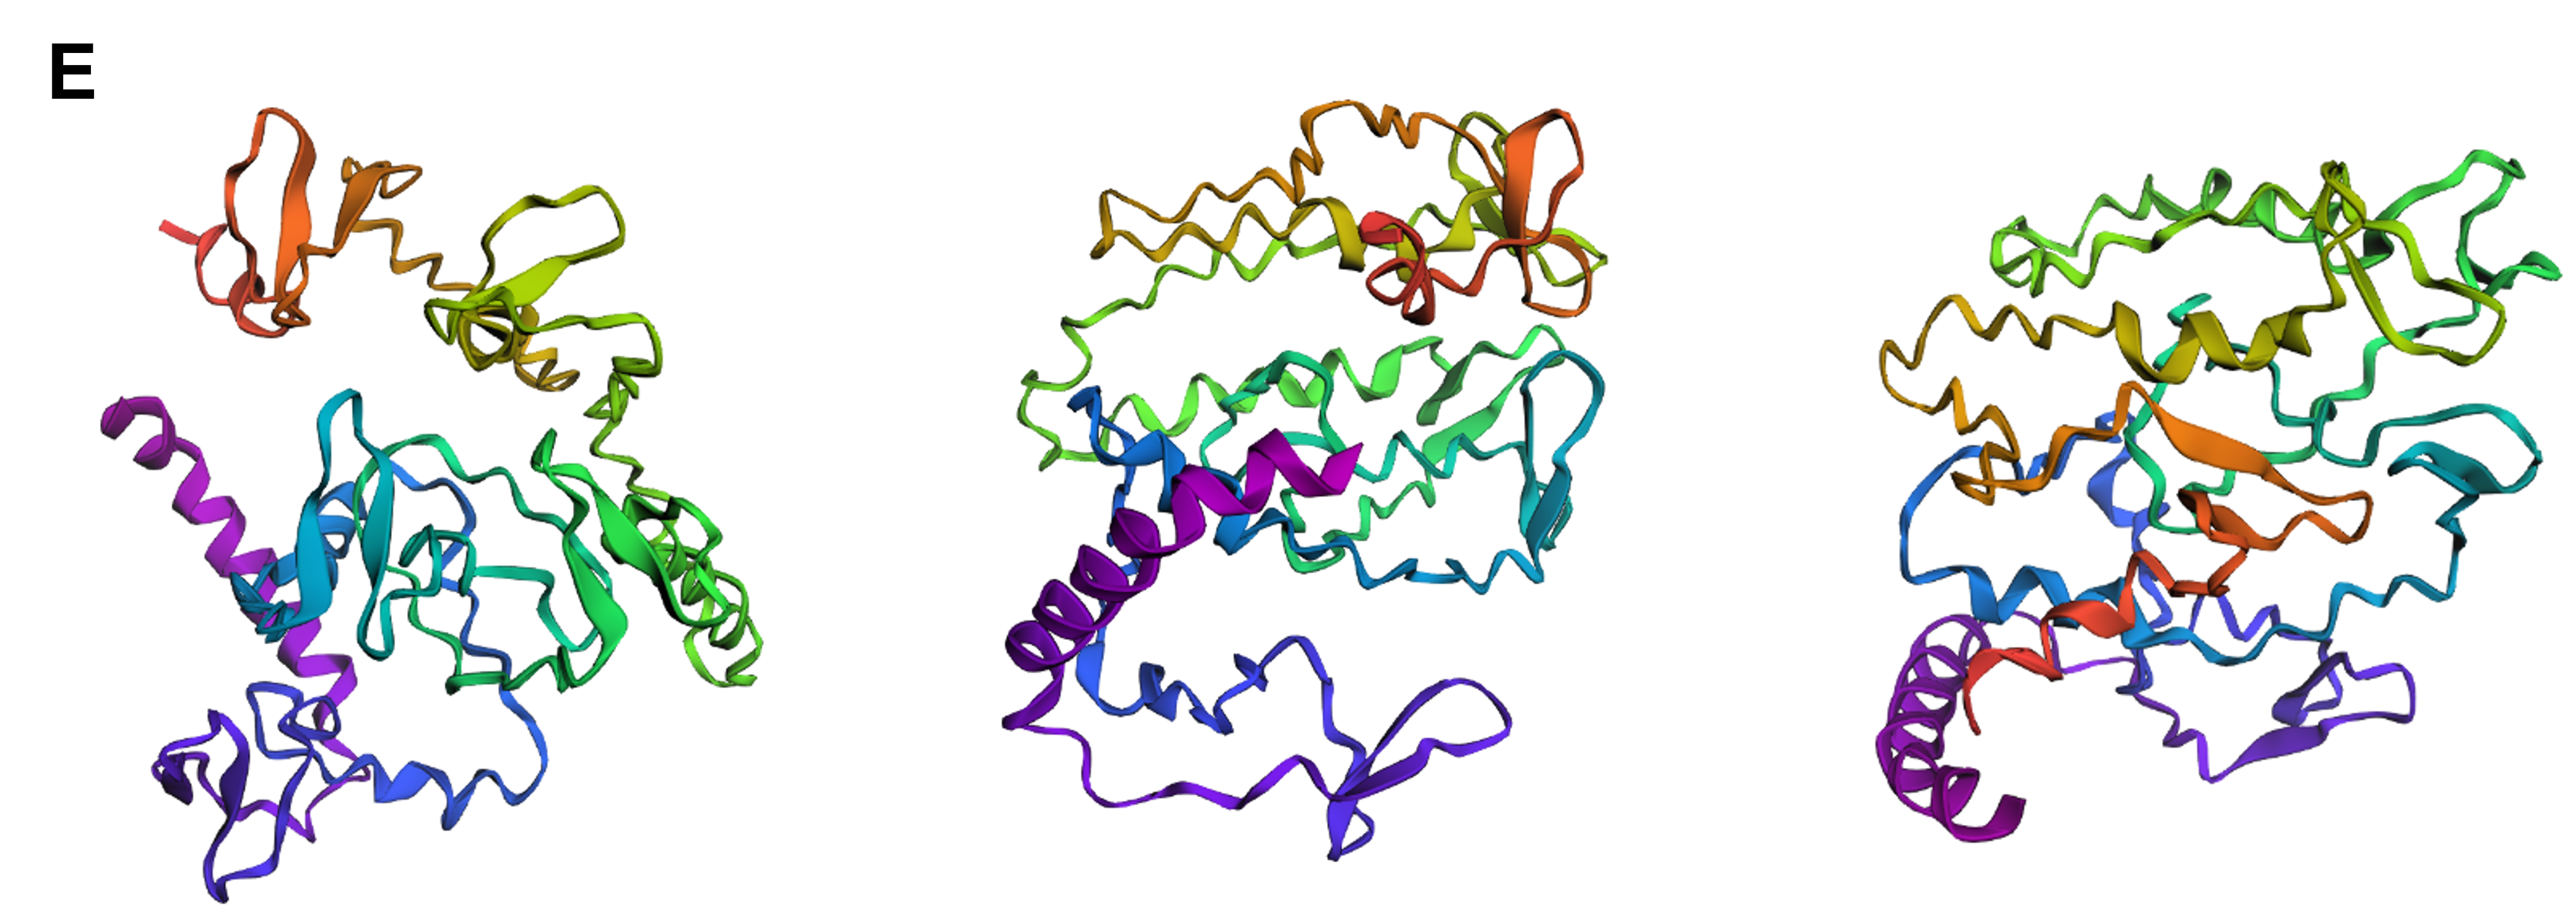
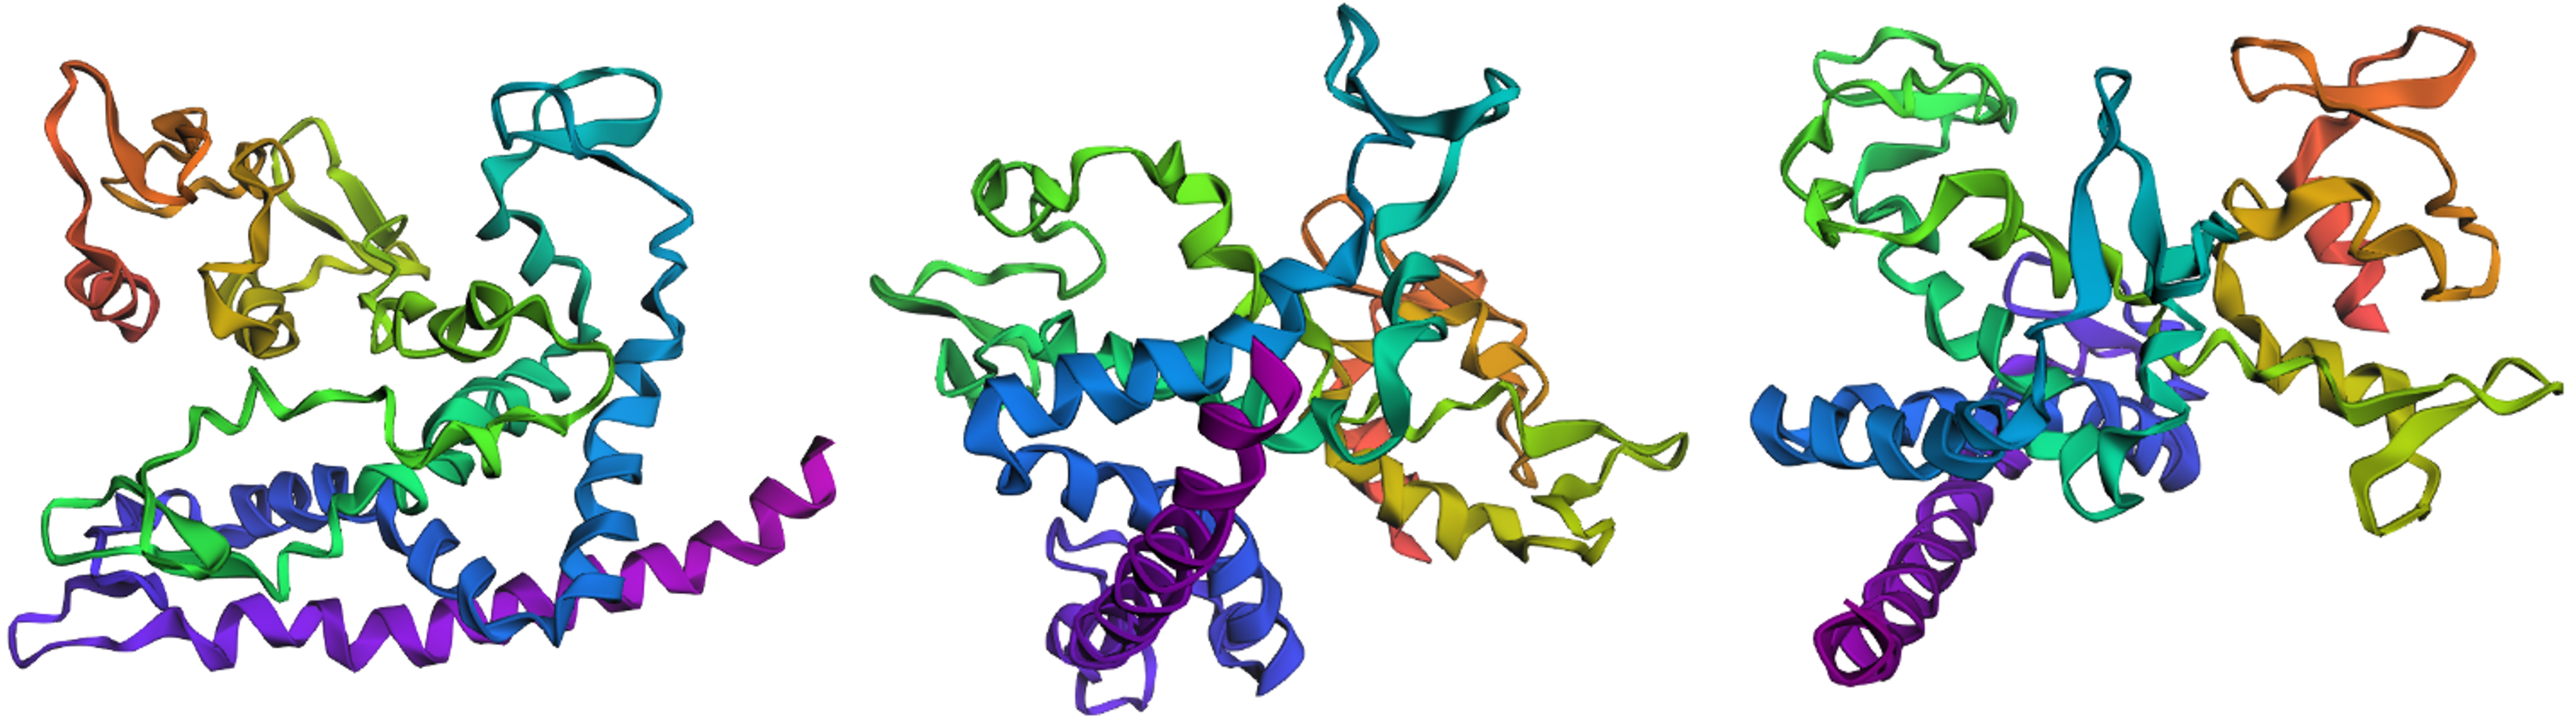
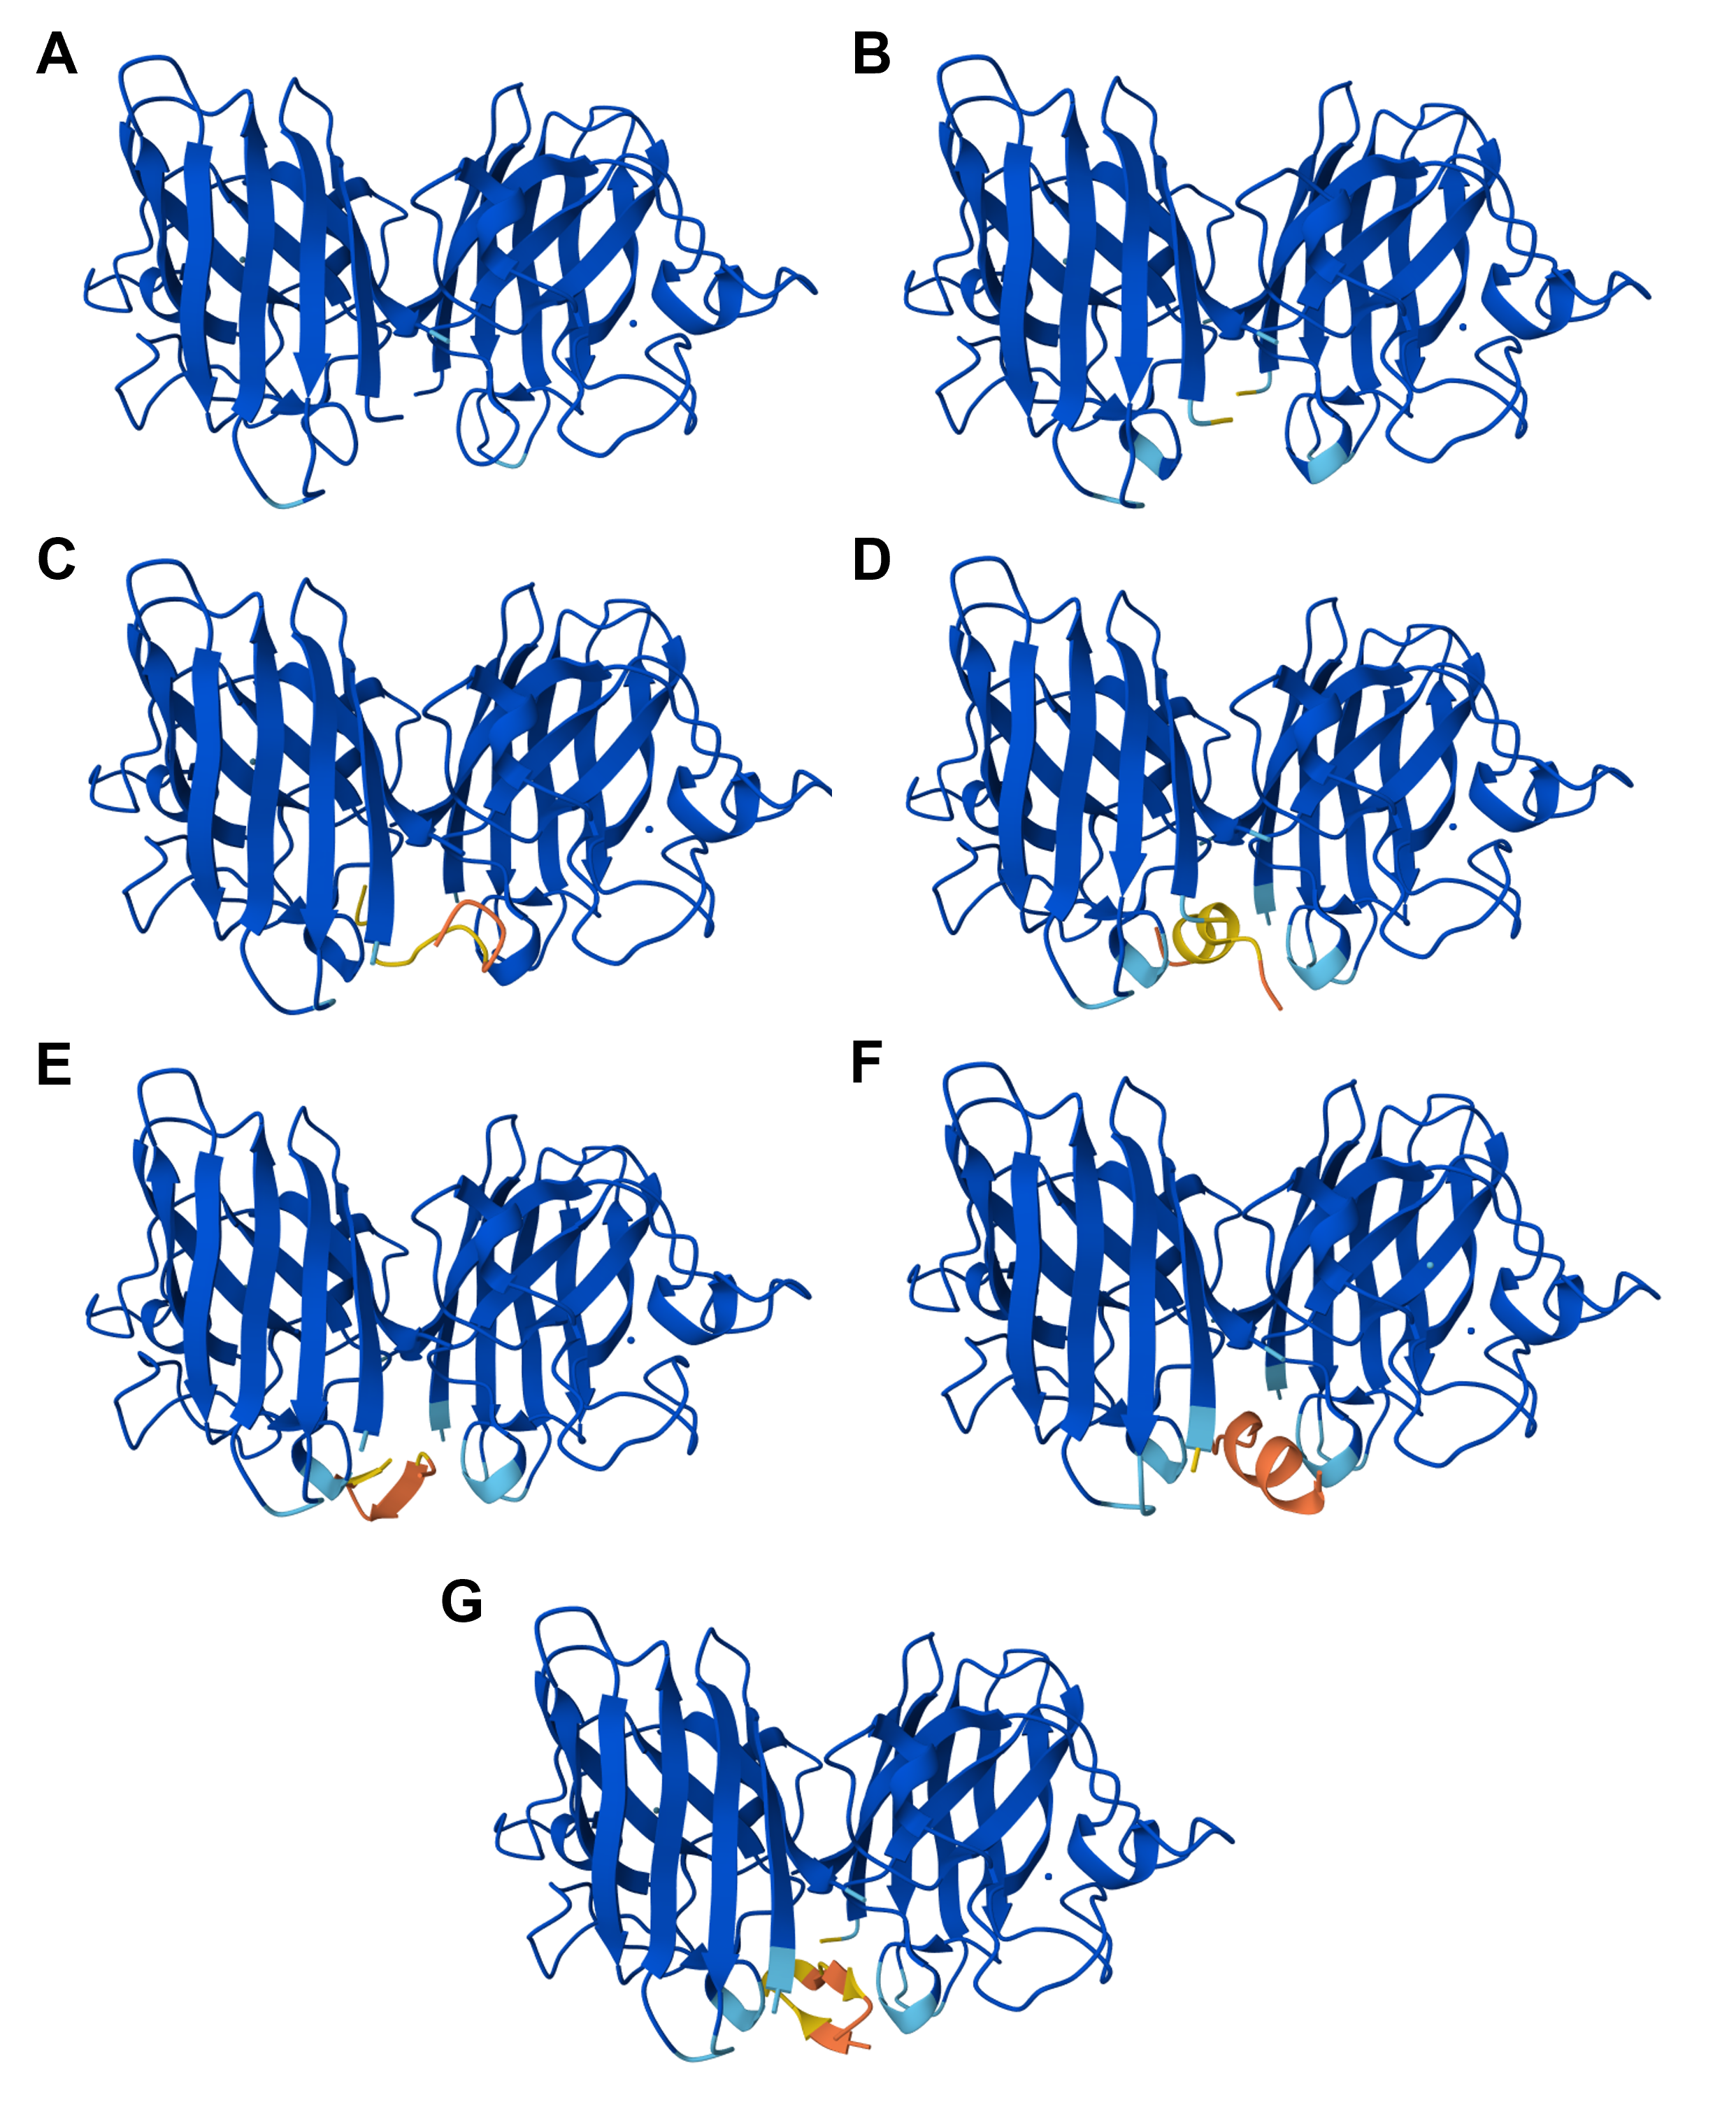
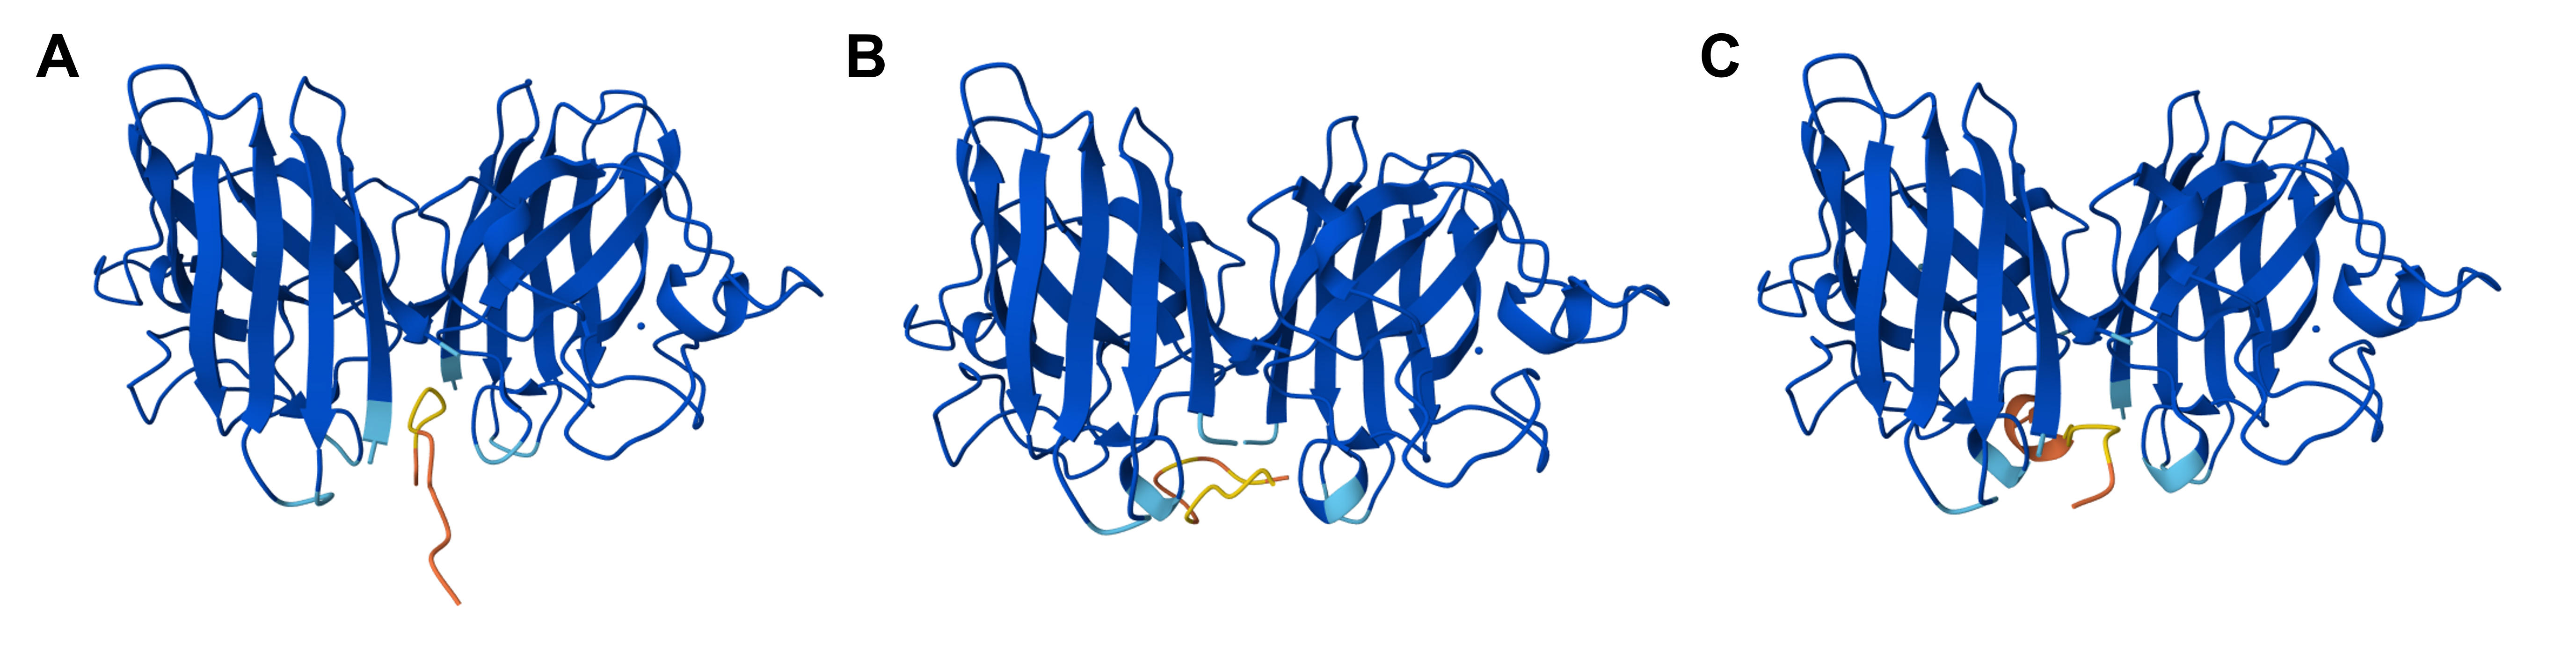
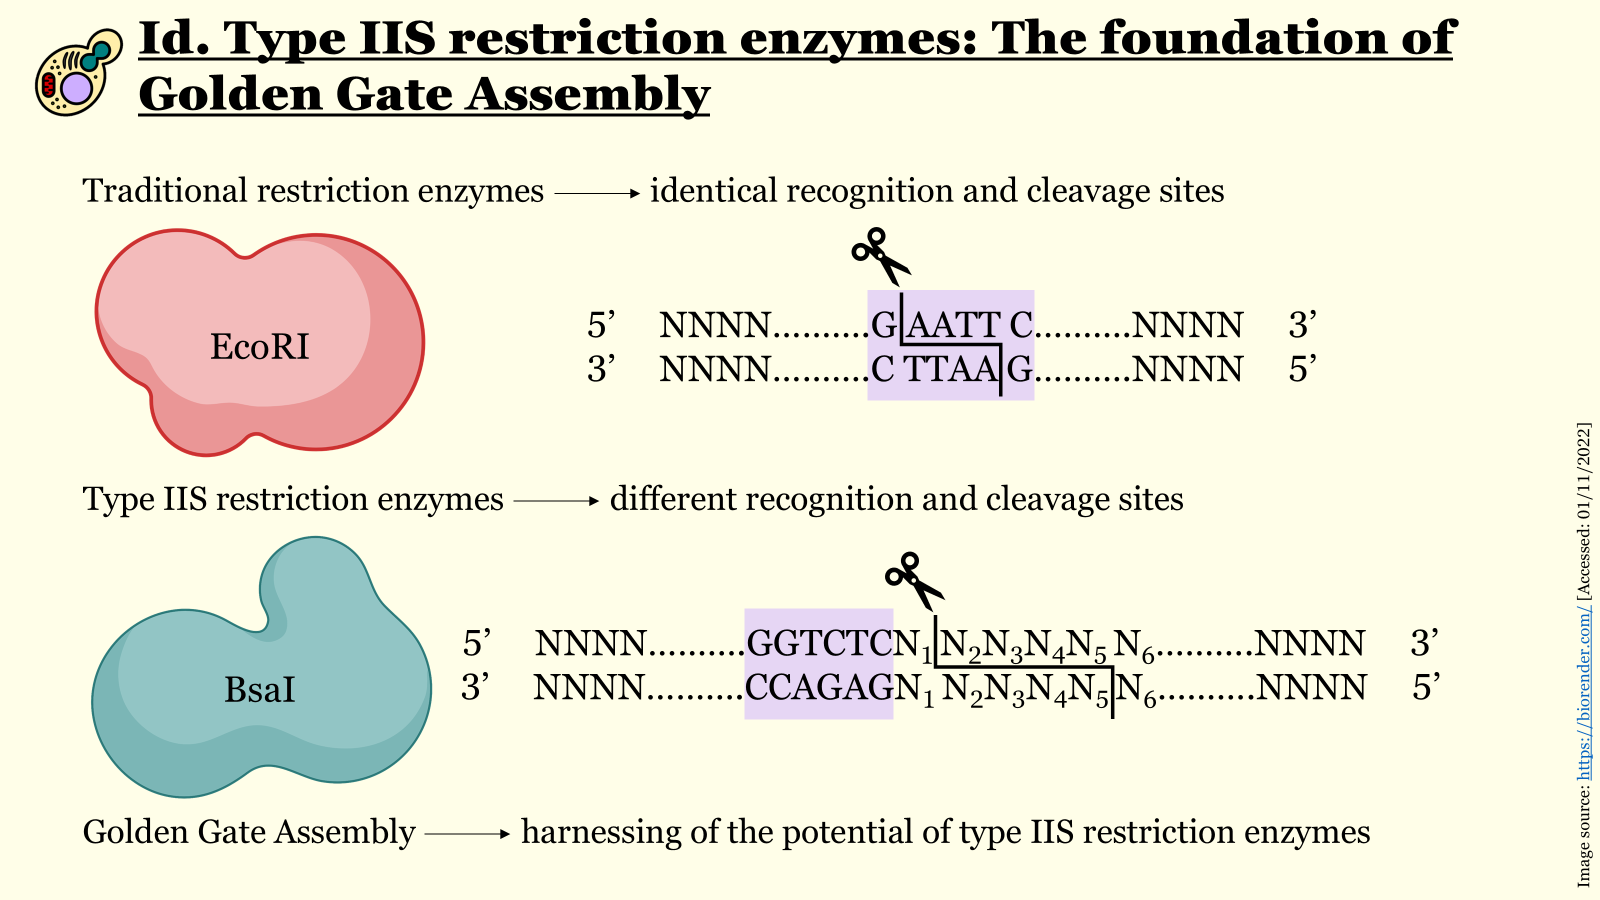
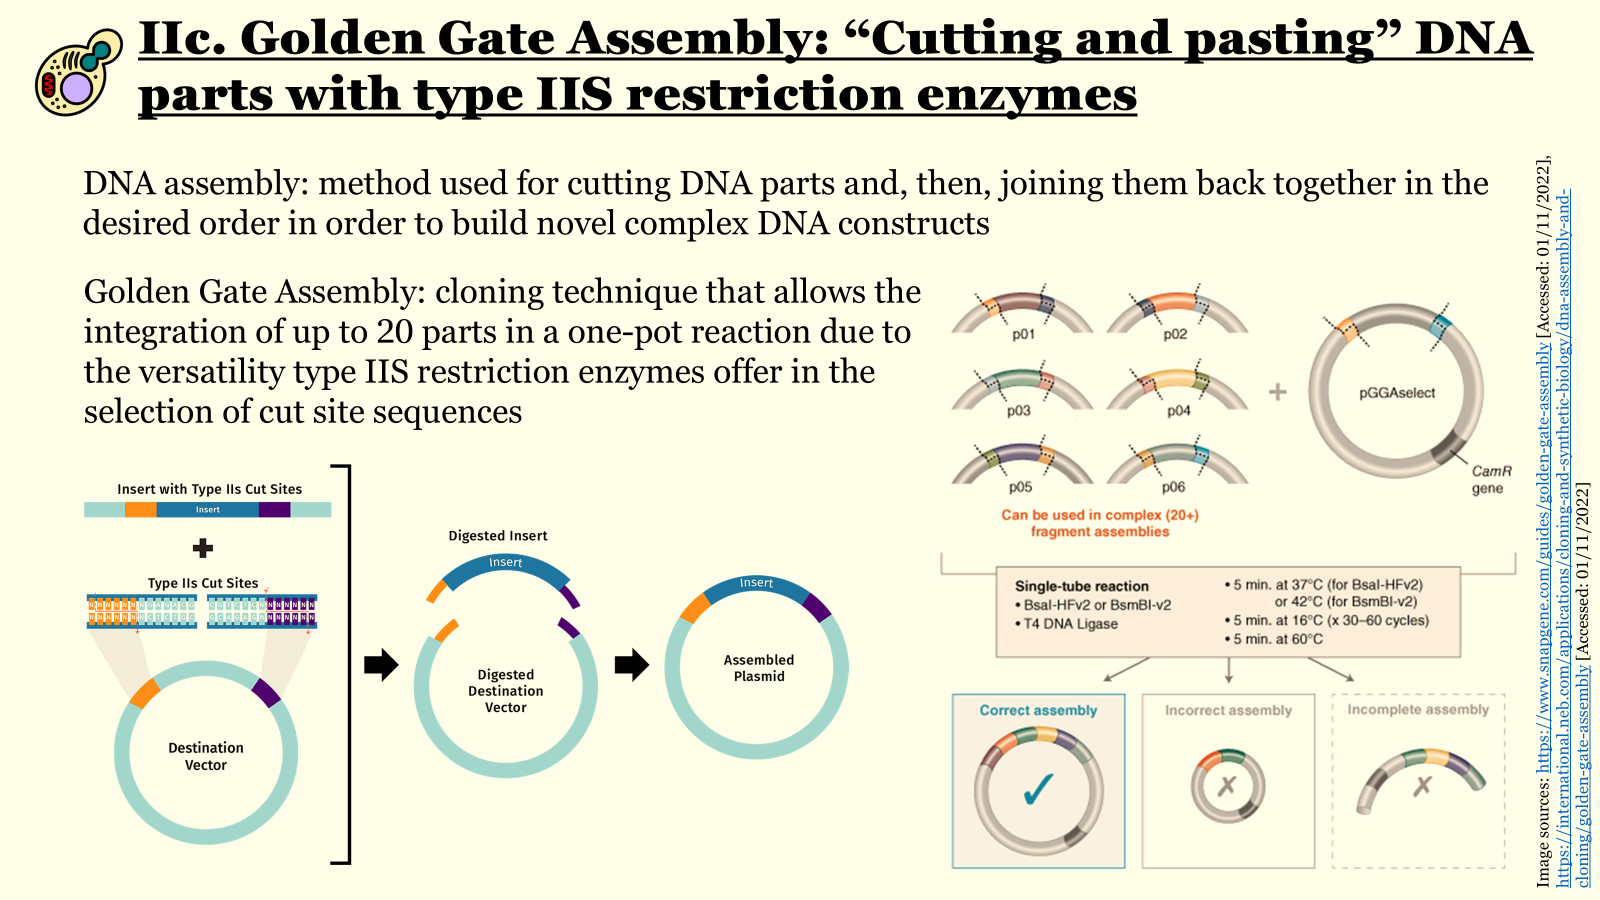

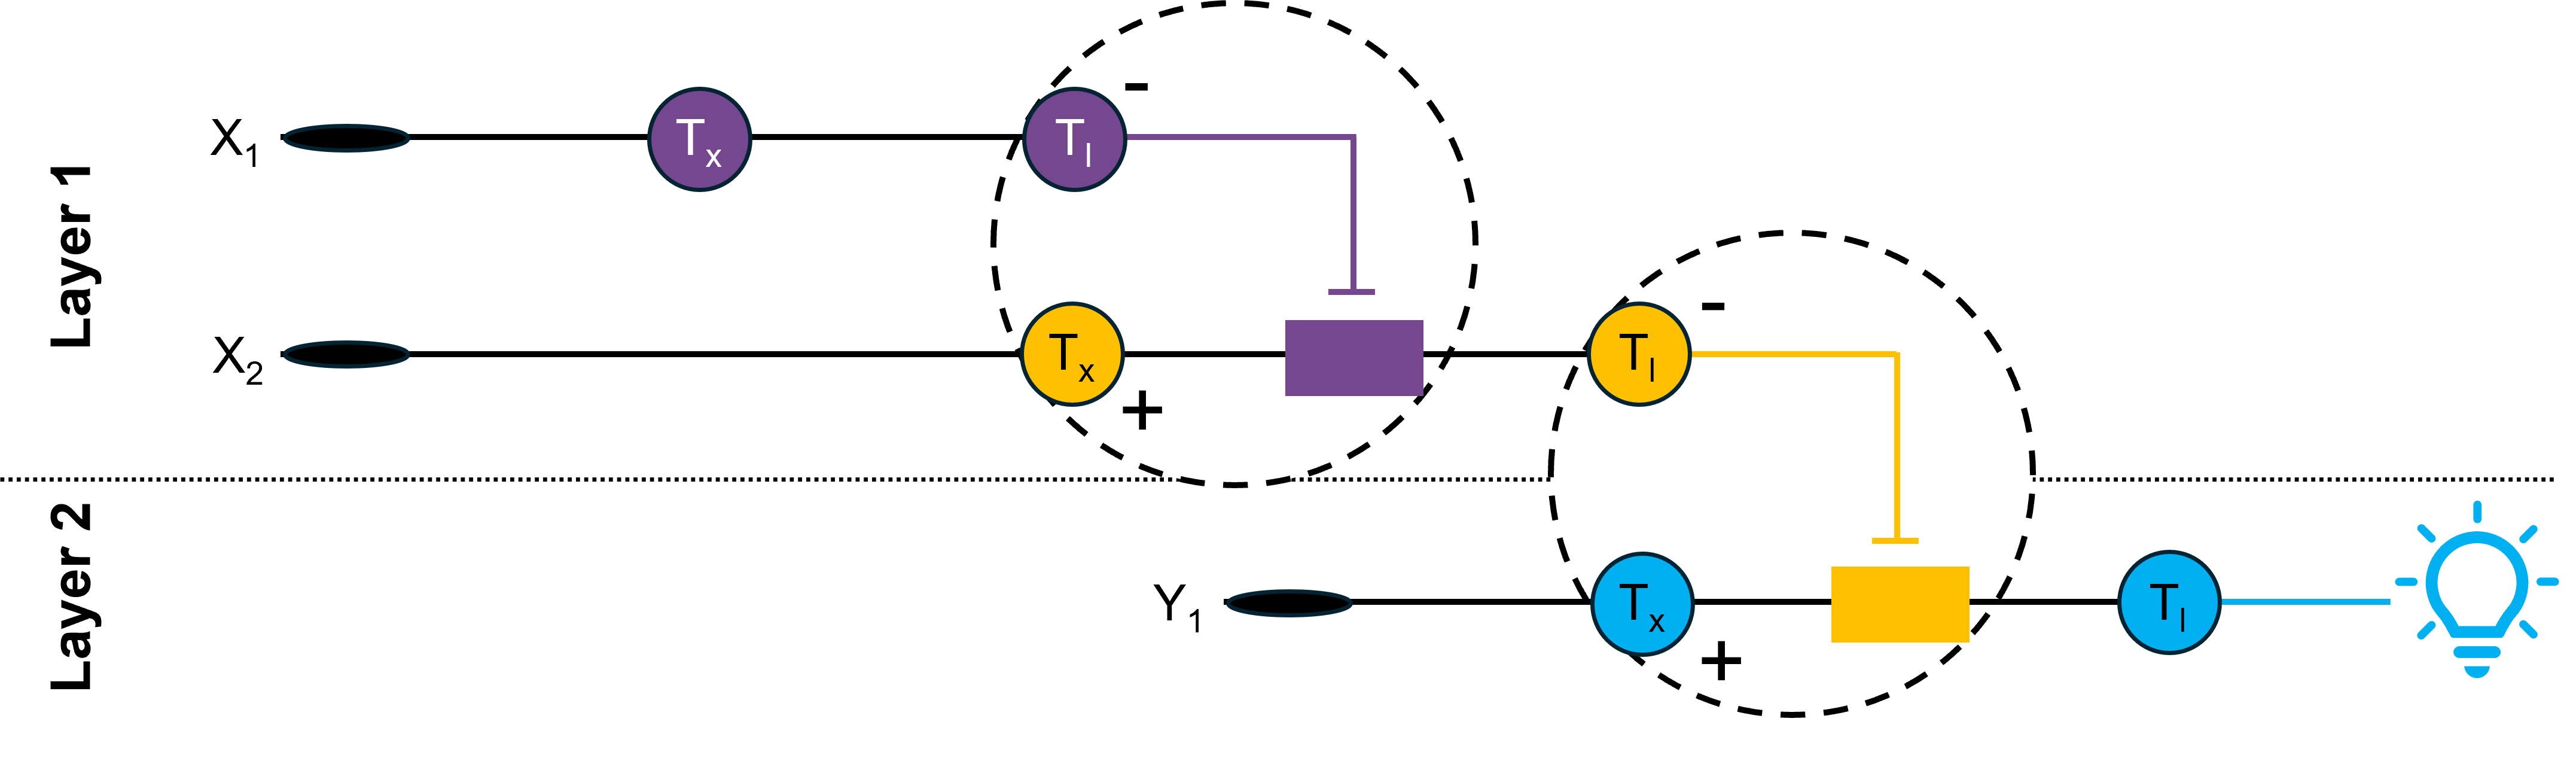
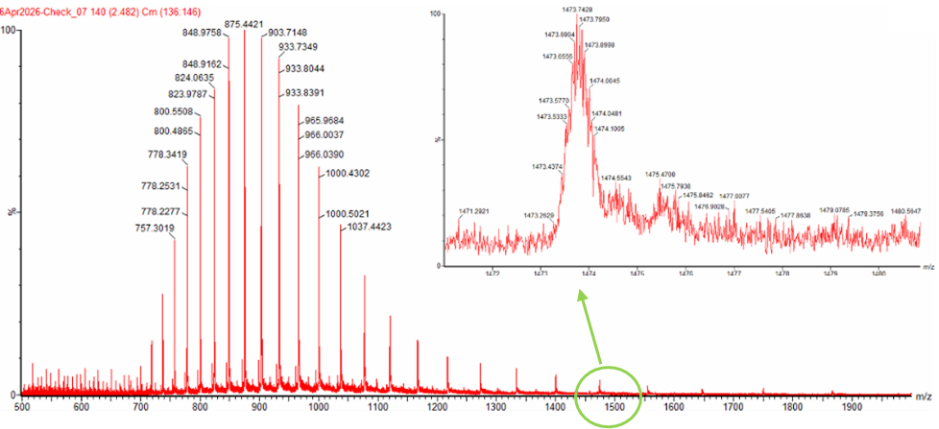
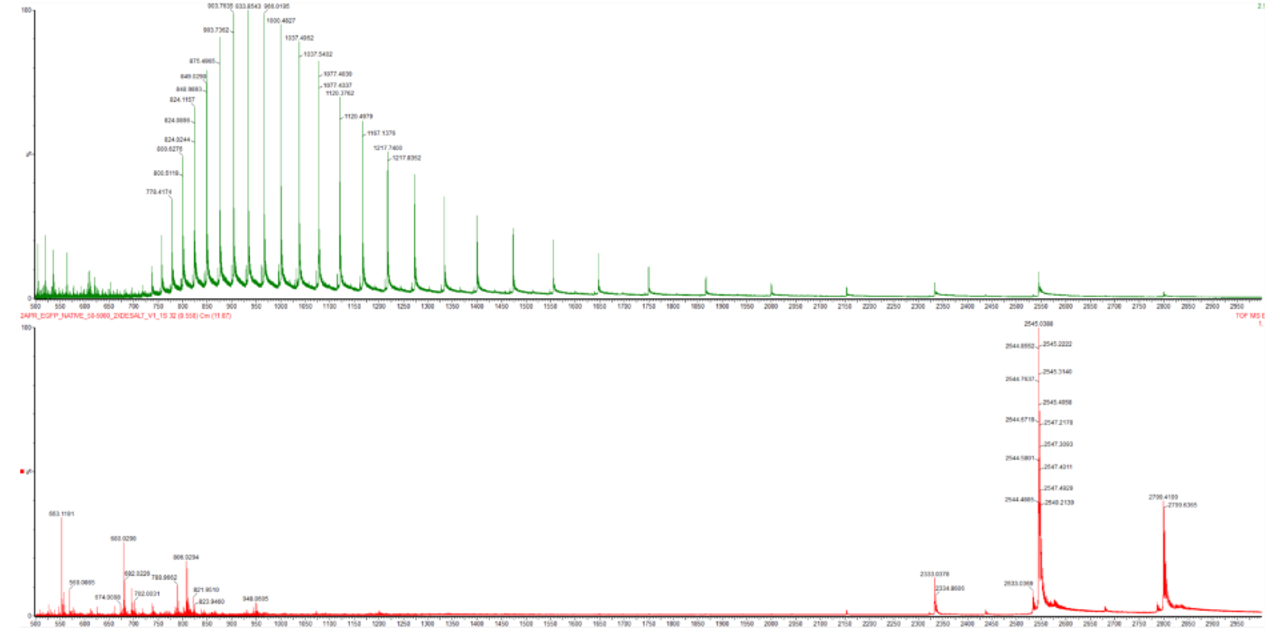
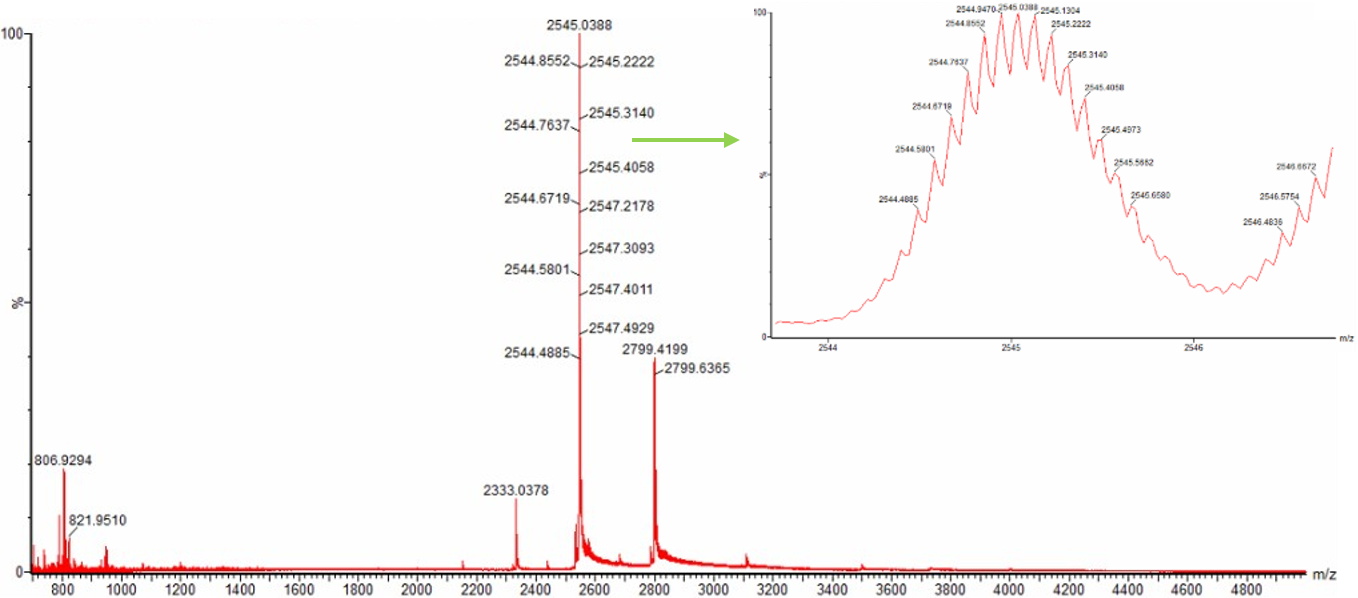
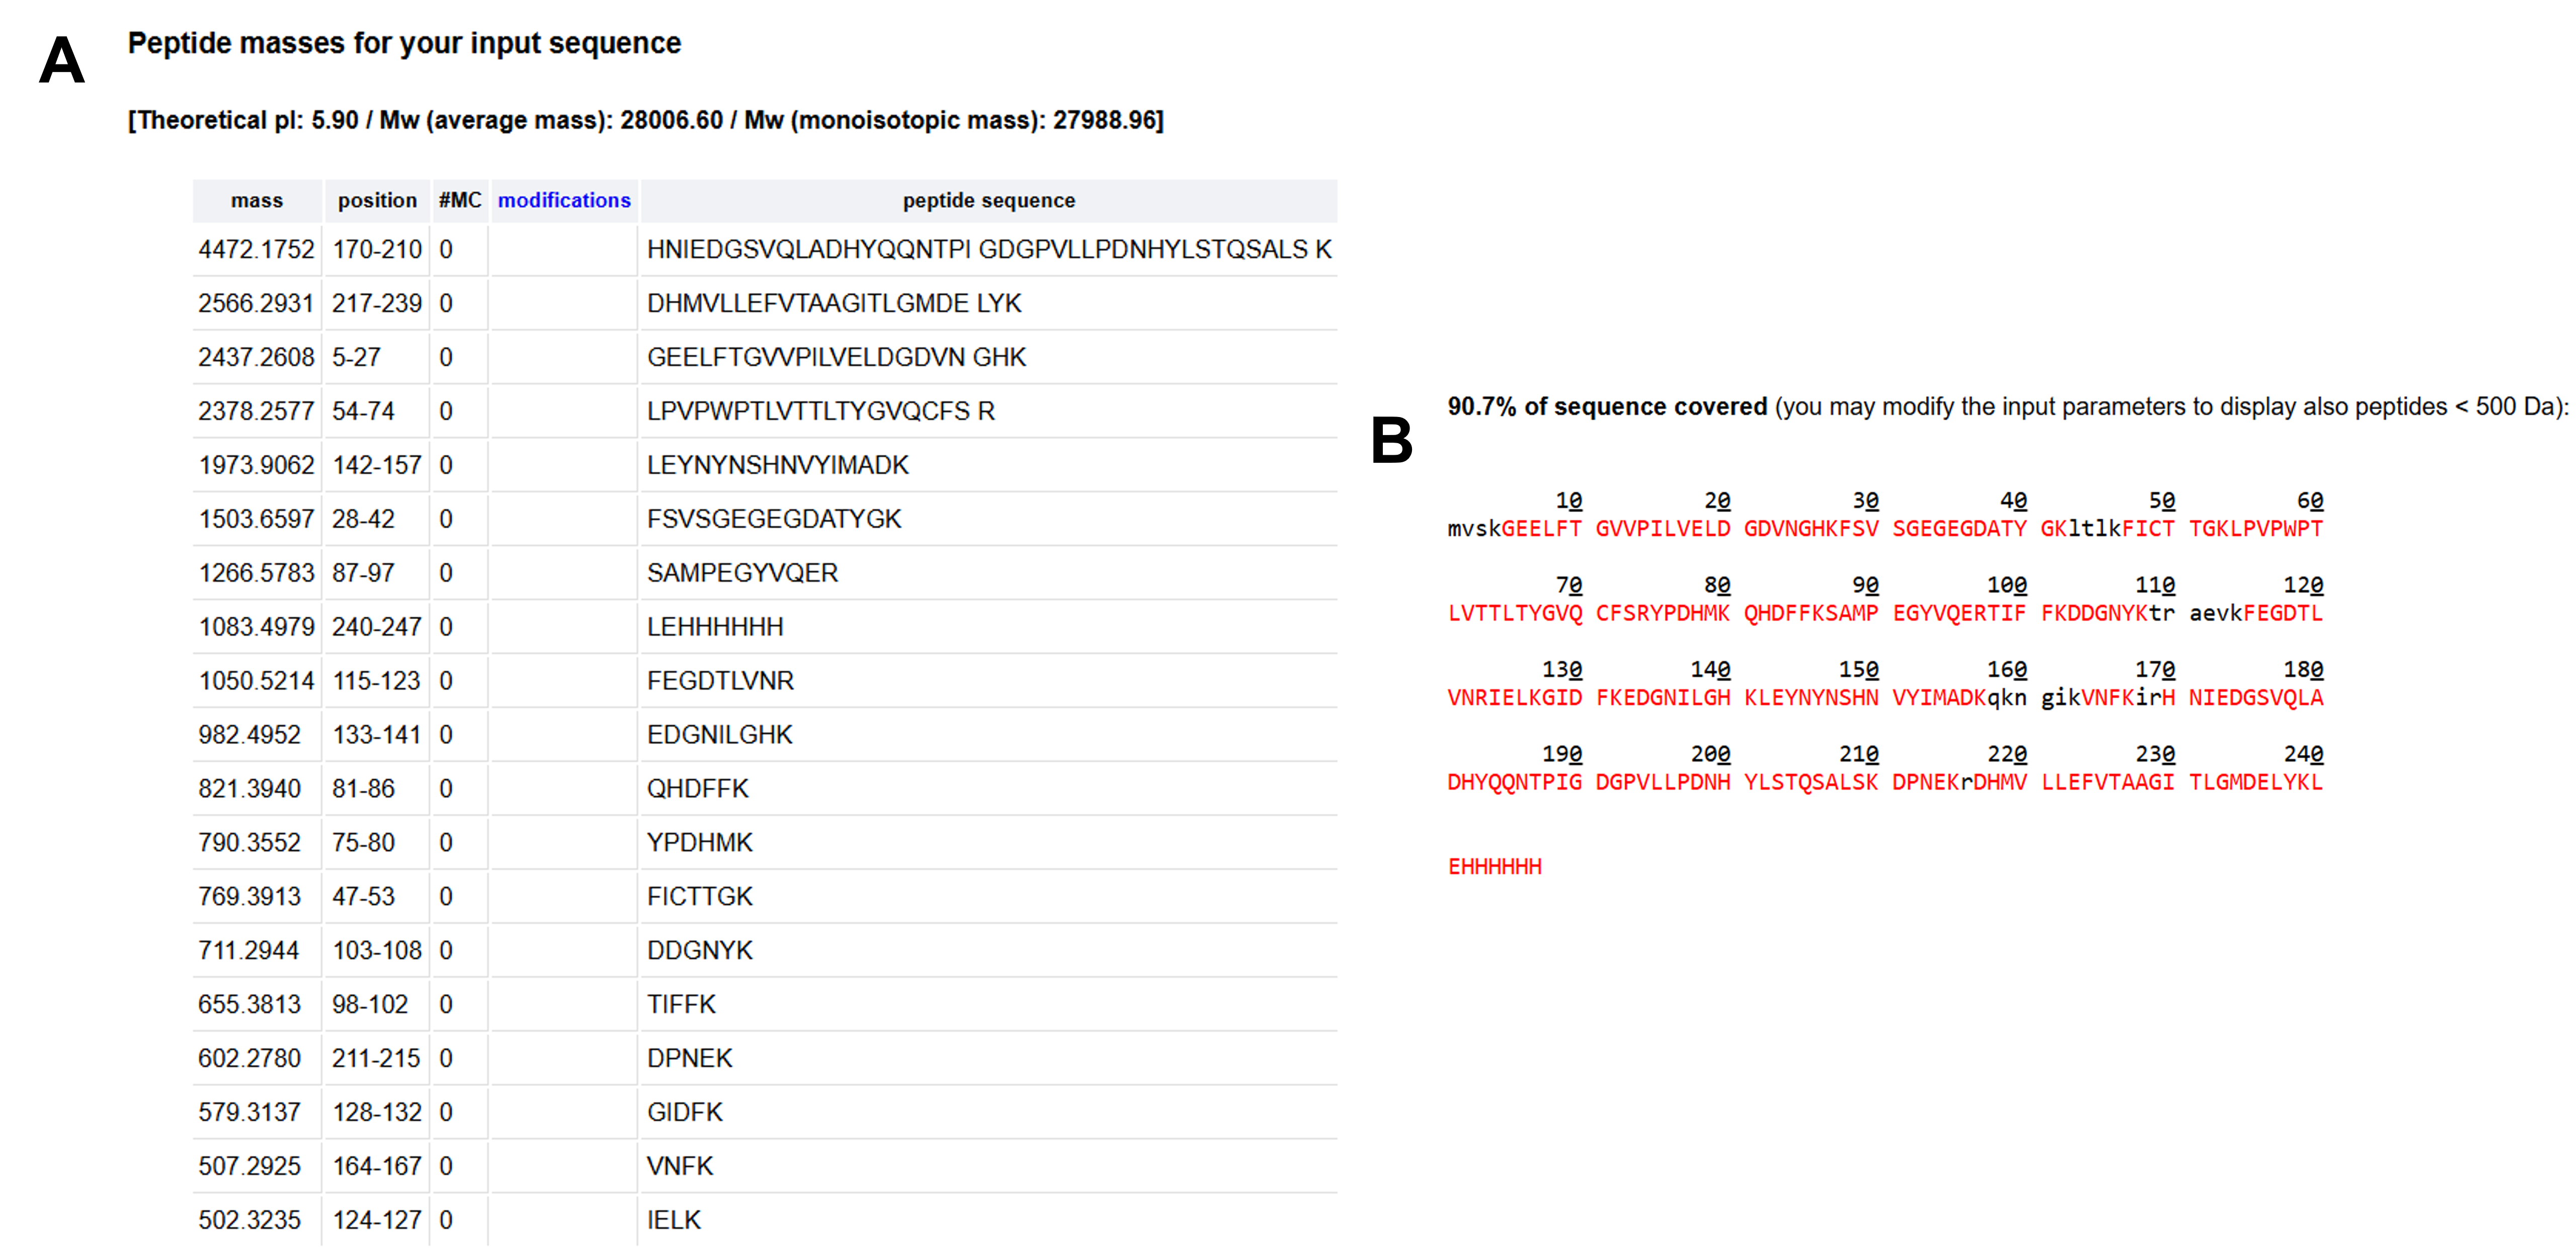
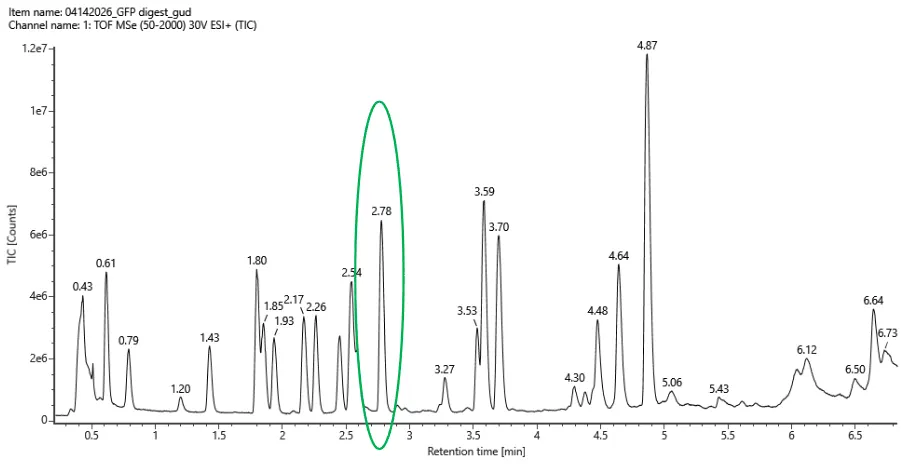
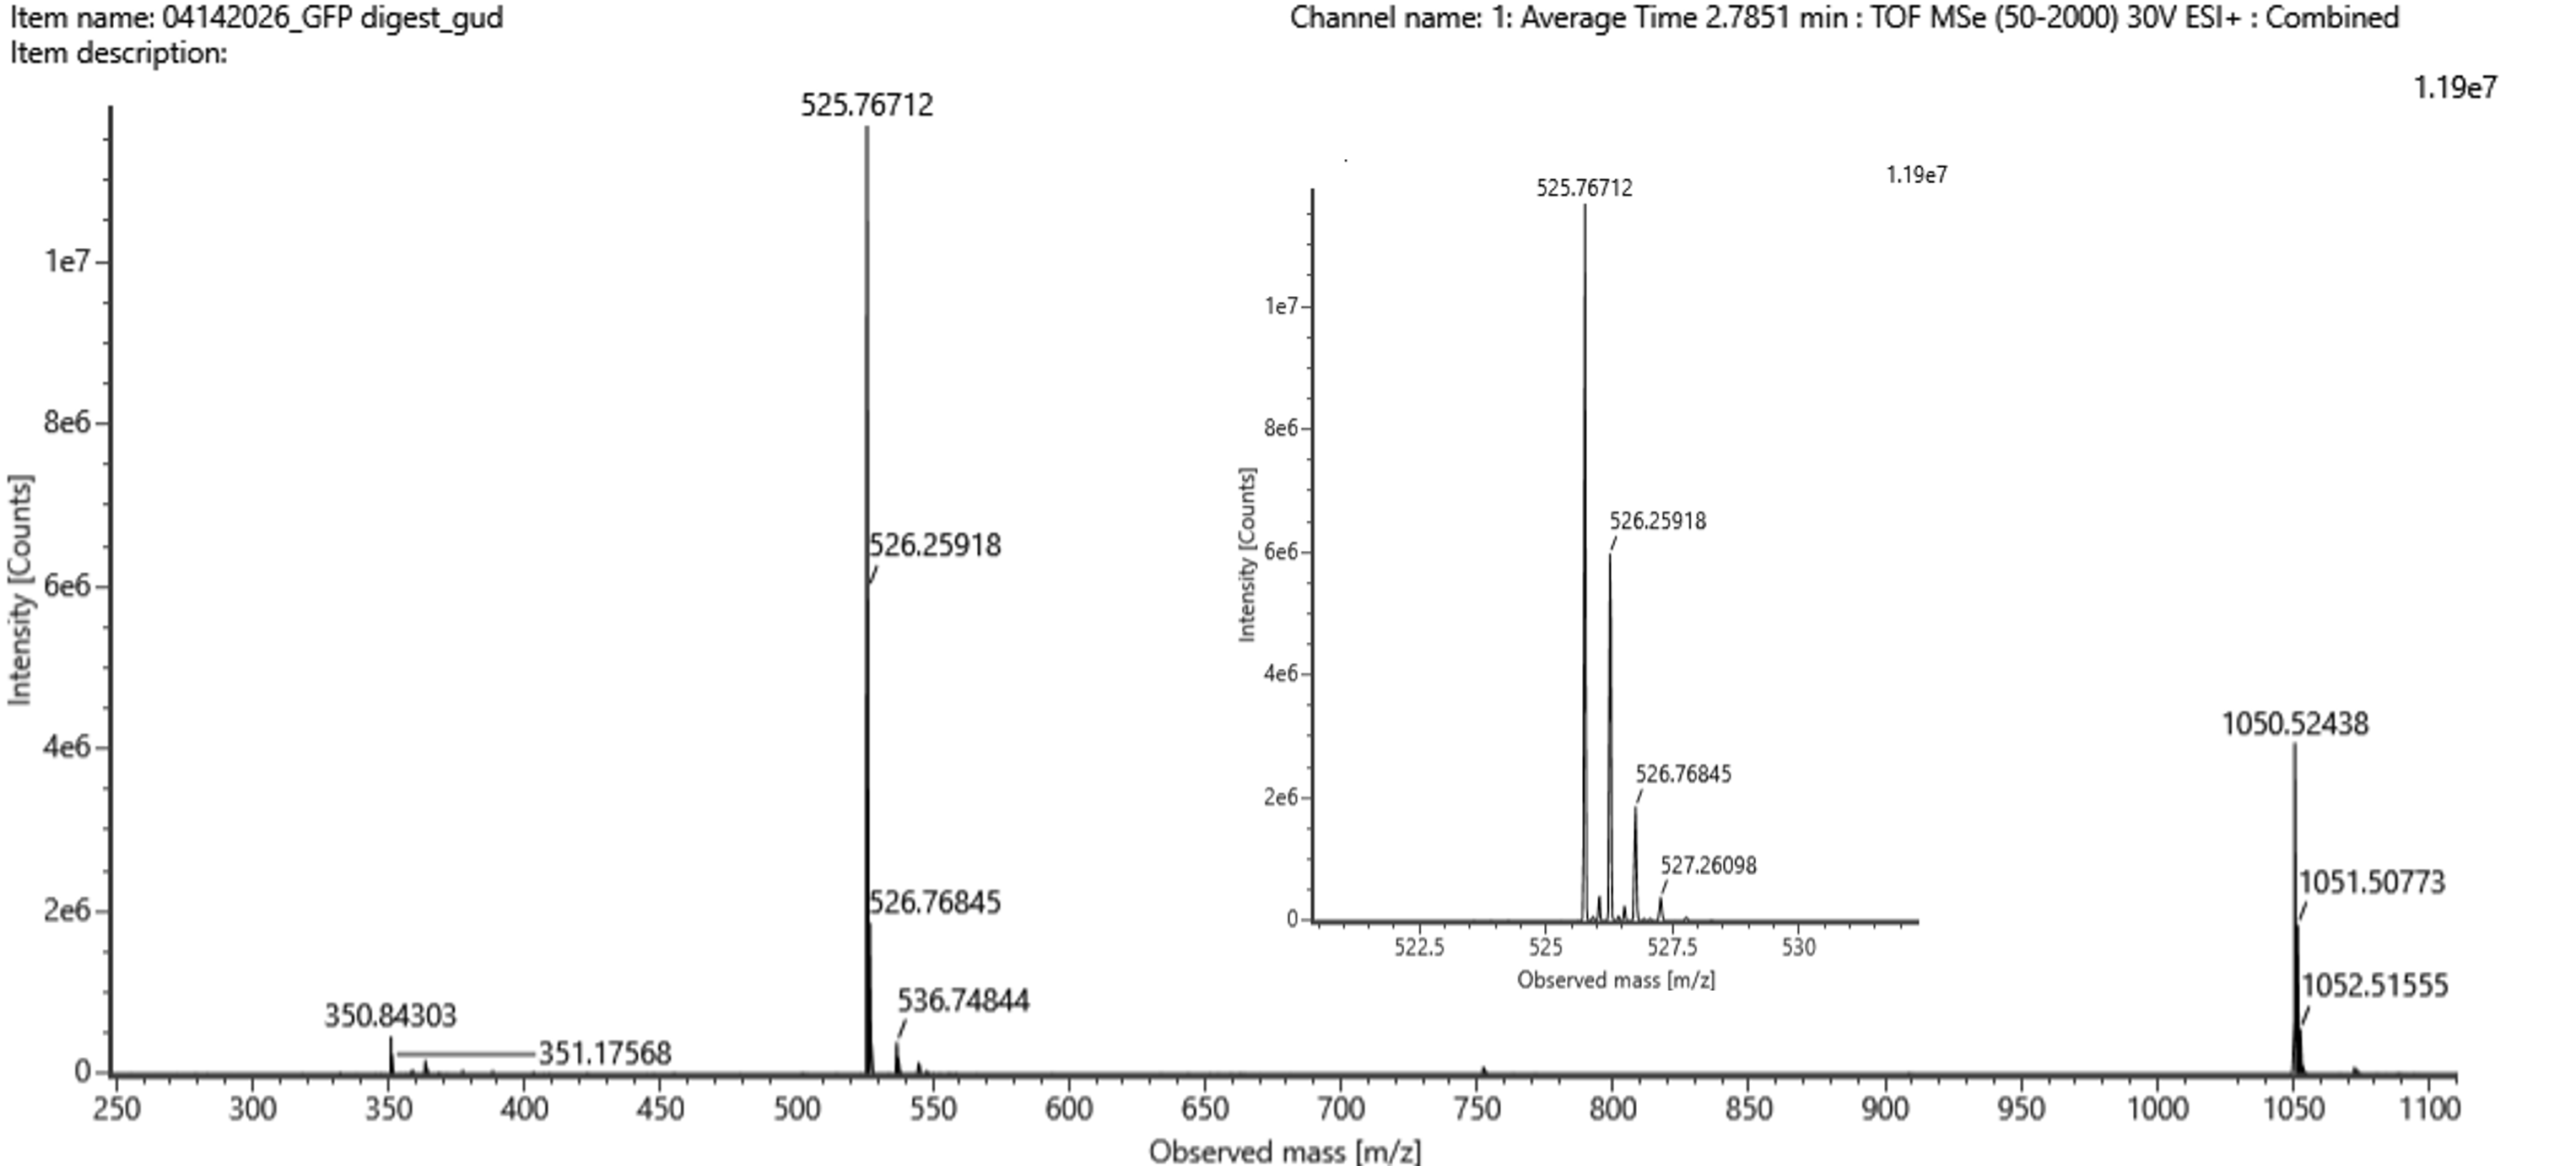
 Figure 10.7 Amino acid coverage map of eGFP based on BioAccord LC-MS peptide identification data.