Week 10 homework
Advanced imaging and measurement technology 🎞️
For your final project:
- Please identify at least one (ideally many) aspect(s) of your project that you will measure. It could be the mass or sequence of a protein, the presence, absence, or quantity of a biomarker, etc.
- Please describe all of the elements you would like to measure, and furthermore describe how you will perform these measurements.
- What are the technologies you will use (e.g., gel electrophoresis, DNA sequencing, mass spectrometry, etc.)? Describe in detail.
My final individual project revolves around developing a lichen-based building coating that is prompted to change its color by the conditions of its environment as a means of passive heat acclimation. The biomaterial can assume two different colorations, a lighter one for hot sunny days and a darker one for days when the weather is cold and cloudy. The two colorations are mediated by two different compounds, namely the protein reflectin and the pigment eumelanin respectively. As engineering a lichen is quite challenging, especially when taking into consideration the very short time frame of the course, for my first experimental aim, I intend to design a genetic circuit that will emulate the color-changing effect of the lichen construct, although, adapted for expression in E. coli, which is simpler and easier to genetically manipulate, as proof-of-concept. After inducing the synthesis of reflectin and melanin in the bacterial system, I would like to test the responsivity and functionality of the color-shifting circuit first with a simple spectrophotometric measurement, which should be feasible given that reflectin is highly reflective when interacting with visible light, whereas eumelanin is highly absorbant. As a semi-quantitative method, I could also visualize the expression of reflectin and MelC2, an essential enzyme for the biosynthesis of eumelanin, by running an SDS-PAGE protein electrophoresis and, subsequently, Western blotting. To this end, I have attached a C-terminal tag to both proteins, more specifically a 6x-His tag to reflectin and a FLAG tag to MelC2, which will allow me to use anti-His and anti-FLAG antibodies to examine the expression of each protein in the Western blot. Alternatively, for a more precise quantification, I could purify the proteins and analyze them through mass spectrometry. This way, I could obtain both measurements about each protein’s level of expression, but also useful data both their respective sequences to verify that the proteins are synthesized as anticipated in my system. Another advantage of mass spectrometry-facilitated analysis is that, unlike SDS-PAGE and Western blots, it can be utilized to investigate other biomolecules too. Therefore, instead of indirectly quantifying eumelanin production through measurement of MelC2 expression, directly monitoring how much eumelanin has been generated would be possible. Going a step back, before the induction of protein expression, I would like to have already sequenced my final assembled DNA constructs, to validate that the plasmids constructed in the lab harbor the same sequence as the ones theoretically designed and display the anticipated functions. Lastly, apart from sequencing the plasmids before the bacterial transformation, it is prudent to do the same with colonies identified as positive transformants through the selection process by extracting their plasmids and isolating the insert containing the genetic cassette(s) responsible for the different colorations. The isolation of the insert can be easily achieved either by performing a strategic restriction digestion or, in case the plasmid lacks restriction sites, by amplifying the insert through PCR and, subsequently, visualizing the result of the reaction with an agarose gel electrophoresis in both scenarios.
Waters Part I: Molecular weight
We will analyze an eGFP standard on a Waters Xevo G3 QTof MS system to determine the molecular weight of intact eGFP and observe its charge state distribution in the native and denatured (unfolded) states. The conditions for LC-MS analysis of intact protein cause it to unfold and be detected in its denatured form (due to the solvents and pH used for analysis).
1. Based on the predicted amino acid sequence of eGFP (see below) and any known modifications, what is the calculated molecular weight?
eGFP amino acid sequence with C-terminal linker and 6x-His tag
MVSKGEELFTGVVPILVELDGDVNGHKFSVSGEGEGDATYGKLTLKFICTTGKLPVPWPTLVTTLTYGVQCFSRYPDHMKQHDFFKSAMPEGYVQERTIFFKDDGNYKTRAEVKFEGDTLVNRIELKGIDFKEDGNILGHKLEYNYNSHNVYIMADKQKNGIKVNFKIRHNIEDGSVQLADHYQQNTPIGDGPVLLPDNHYLSTQSALSKDPNEKRDHMVLLEFVTAAGITLGMDELYK LE HHHHHH
By using the molecular weight calculator provided by the ExPASy portal, the molecular weight of the N-terminally tagged eGFP presented above was calculated to be MWth = 28,006.60Da.
2. Calculate the molecular weight of the eGFP using the adjacent charge state approach described in the recitation. Select two charge states from the intact LC-MS data (Figure 10.1).
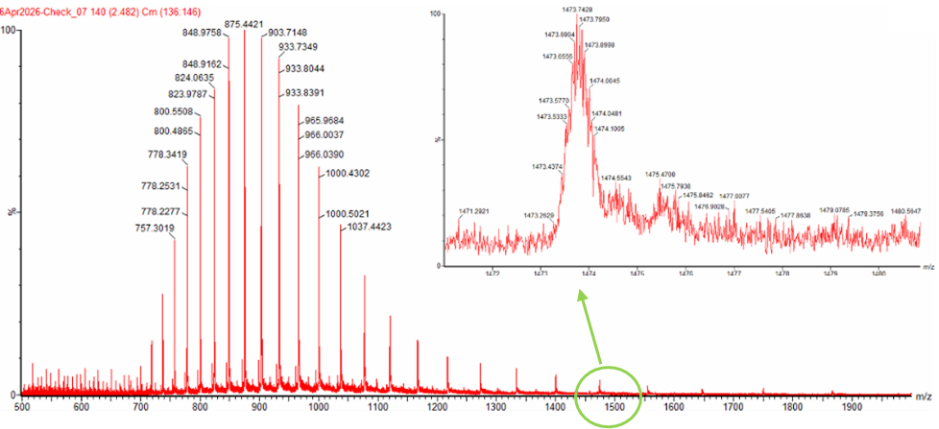 Figure 10.1 Mass Spectrum of intact eGFP protein from the Waters Xevo G3 LC-MS (a mass spectrometer with 30,000 resolution) with individual charge state peaks labeled with m/z values.
2.1 Determine z for each adjacent pair of peaks (n, n+1) using the formula: z = (m/zn+1-1)/(m/zn-m/zn+1).
For the calculation of the charge, I chose the following two consecutive measurements from Figure 10.1: m/zn+1 = 848.9758 and m/zn = 875.4421. Considering that the charge in the n state of the protein (zn) is equal to the protein’s number of charges as carried by protons (nH) and by applying the mathematical formula shown above, zn = nH = z = 32.0398. Therefore, zn = 32 approximately and zn+1 = 33.
2.2 Determine the MW of the protein using the relationship between m/zn, MW, and zn.
Based on the calculations of the previous segment and by implementing the formula MW = (m/znxzn)-zn, the experimentally measured MW of eGFP is MWexp = 27,982.15Da.
2.3 Calculate the accuracy of the measurement using the deconvoluted MW from 2.2 and the predicted weight of the protein from 2.1 using the formula:
accuracy = |MWexp-MWth|/MWth.
By applying the mathematical formula above, the accuracy of the measurement is approximately 8.73x10⁻⁴.
3. Can you observe the charge state for the zoomed-in peak in the mass spectrum for the intact eGFP in Figure 10.1? If yes, what is it? If no, why not?
The peaks in the zoomed-in frame included in Figure 10.1 are not very clearly separated, probably due to the resolution of the instrument in this m/z range. Based solely on this, it is not easy to calculate the corresponding charge. However, by counting the number of peaks to the right of the m/zn peak, the charge of the peak shown in the close-up of Figure 10.1 should be around 19.
Waters Part II: Secondary/Tertiary structure
We will analyze eGFP in its native, folded state and compare it to its denatured, unfolded state on a quadrupole time-of-flight MS. We will be doing MS-only analysis (no liquid chromatography, also known as “direct infusion” experiments) on the Waters Xevo G3-QToF MS.
1. Based on learnings in the lab, please explain the difference between native and denatured protein conformations. For example, what happens when a protein unfolds? How is that determined with a mass spectrometer? What changes do you see in the mass spectrum between the native and denatured protein analyses (Figure 10.2)?
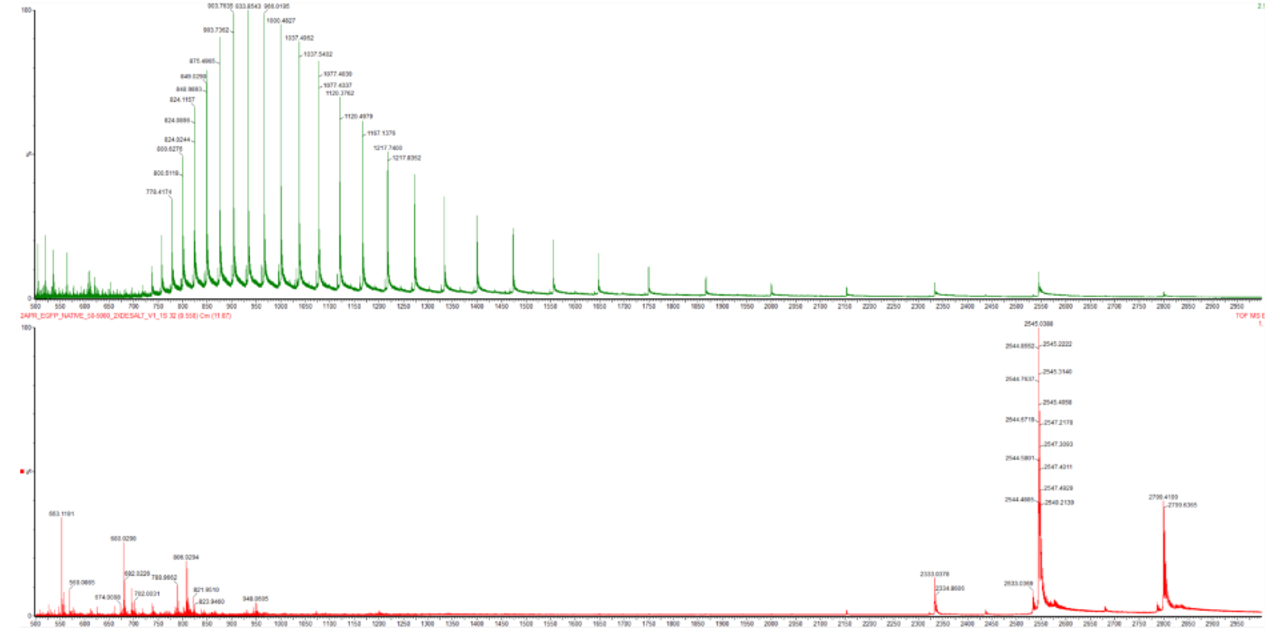 Figure 10.2 Comparison of the mass spectra between denatured (top) and native (bottom) eGFP standard on the Waters Xevo G3 QTof MS.
In their native conformation, proteins remain fully functional and folded, as they retain their secondary and tertiary structures. However, in their denatured state, proteins have lost their native folding due to denaturing agents (such as increased heat and acidic or basic conditions). Since these factors disrupt the bonds established by amino acid residue interactions (hydrogen bonds, disulfide bridges, hydrophobic interactions), the denaturation process removes the second and tertiary structures of proteins, allowing them to unravel into a long chain of amino acids (primary structure). Due to the proteins fully or partially unfolding, a larger surface area of the protein molecules is exposed, potentially from cavities and grooves hidden in its native conformation, enabling protons to be attached to a greater number of amino acid residues (mainly to their side chains) during the ionization phase of mass spectrometry. This is bolstered by the significantly higher number of peaks observed at the leftmost part of the denatured eGFP spectrogram (Figure 10.2, top) compared to the corresponding part of the native protein’s spectrum (Figure 10.2, bottom). The fewer peaks in the latter indicate a lower number of entities carrying a larger amount of charges, which in the denatured eGFP spectrum is substantially increased due to the denaturation process and the exposition of larger domains of the protein to ionization. The greater number of peaks in the top image of Figure 10.2 also shows that eGFP exists in many slightly different but clearly discernible denatured states, each with a discrete m/z ratio. In contrast to that, the native eGFP’s spectrogram (Figure 10.2, bottom) presents only a few peaks which are mostly found towards the rightmost segment of the graph, consistent with the lower charge obtained by the more compact folded native conformation of the protein during ionization. Lastly, the spectrum for native eGFP, at the bottom image of Figure 10.2, includes a small number of peaks to the left, which could be attributed to eGFP molecules that were partially denatured or even broken apart into shorter peptides due to the conditions of the analysis, thus collecting more charges per unit of mass.
2. Zooming into the native mass spectrum of eGFP from the Waters Xevo G3 QTof MS (see Figure 10.3), can you discern the charge state of the peak at m/z = ~2,800? What is the charge state? How can you tell?
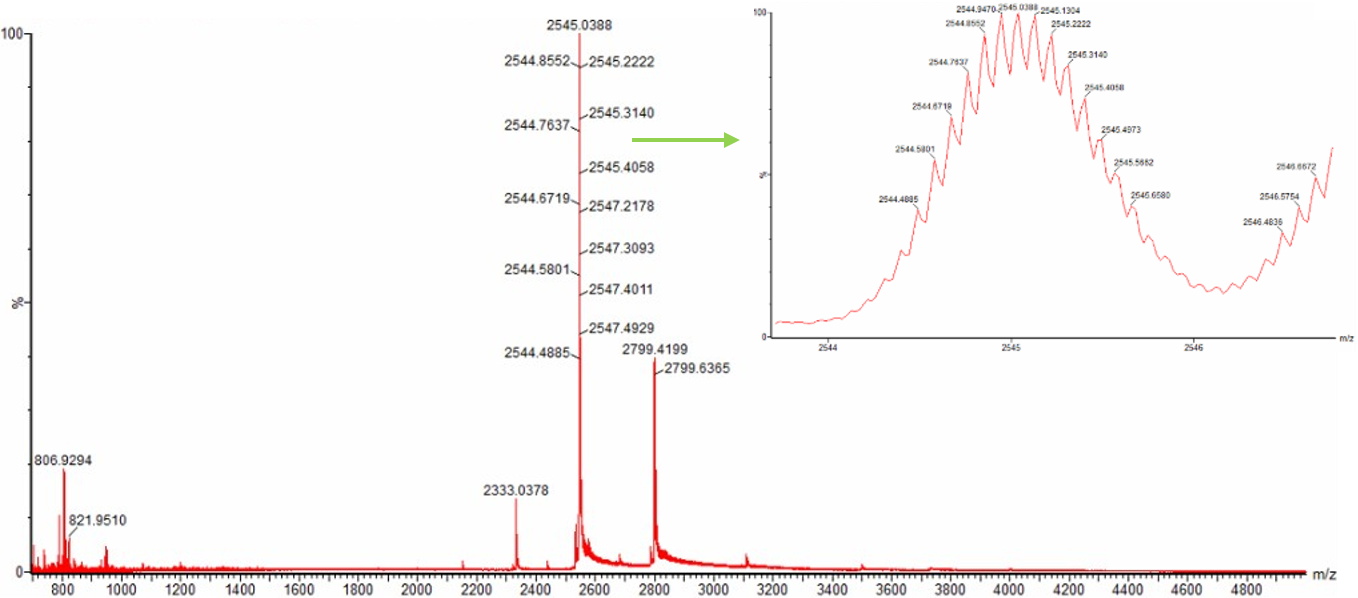 Figure 10.3 Native eGFP mass spectrum from the Waters Xevo G3 Q-Tof MS. The inset is a zoomed-in view of the charge state at m/z = ~2,600 on a mass spectrometer with 30,000 resolution.
Once again, to calculate the charge state of the peak at approximately m/z = 2,800, I used the formula z = (m/zn+1-1)/(m/zn-m/zn+1) and two measurements from the two consecutive peaks close to m/z = 2,600 and m/z = 2,800 respectively as illustrated in the spectrogram in Figure 10.3, namely m/zn+1 = 2,547.4929 and m/zn = 2,799.4199. Based on these data, the charge state of native eGFP around m/z = 2,800 is zn = 10.11 = ~10.
Waters Part III: Peptide mapping and primary structure
We will digest the eGFP protein standard into peptides using trypsin (an enzyme that selectively cleaves the peptide bond after Lysine (K) and Arginine (R) residues. The resulting peptides will be analyzed on the Waters BioAccord LC-MS to measure their molecular weights and fragmented to confirm the amino acid sequence within each peptide – generating a “peptide map”. This process is used to confirm the primary structure of the protein.
1. How many lysines (K) and arginines (R) are in eGFP? Please circle or highlight them in the eGFP sequence given in Waters Part I question 1 above.
The amino acid chain of the C-terminally tagged eGFP previously presented contains 20 lysine and 6 arginine amino acid residues.
eGFP amino acid sequence with C-terminal linker and 6x-His tag
MVSKGEELFTGVVPILVELDGDVNGHKFSVSGEGEGDATYGKLTLKFICTTGKLPVPWPTLVTTLTYGVQCFSRYPDHMKQHDFFKSAMPEGYVQERTIFFKDDGNYKTRAEVKFEGDTLVNRIELKGIDFKEDGNILGHKLEYNYNSHNVYIMADKQKNGIKVNFKIRHNIEDGSVQLADHYQQNTPIGDGPVLLPDNHYLSTQSALSKDPNEKRDHMVLLEFVTAAGITLGMDELYK LE HHHHHH
2. How many peptides will be generated from tryptic digestion of eGFP?
By utilizing the peptide mass tool provided by the ExPASy portal and by following the relevant guide on the week 10 homework page, the 6x-His C-terminally tagged eGFP should be digested into 19 peptides of MW >500Da (which are shown in full detail in Figure 10.4A) and 8 more smaller peptides (as seen in Figure 10.4B) after treatment with trypsin. So, eGFP should be broken apart into 27 peptides in total after trypsin digestion.
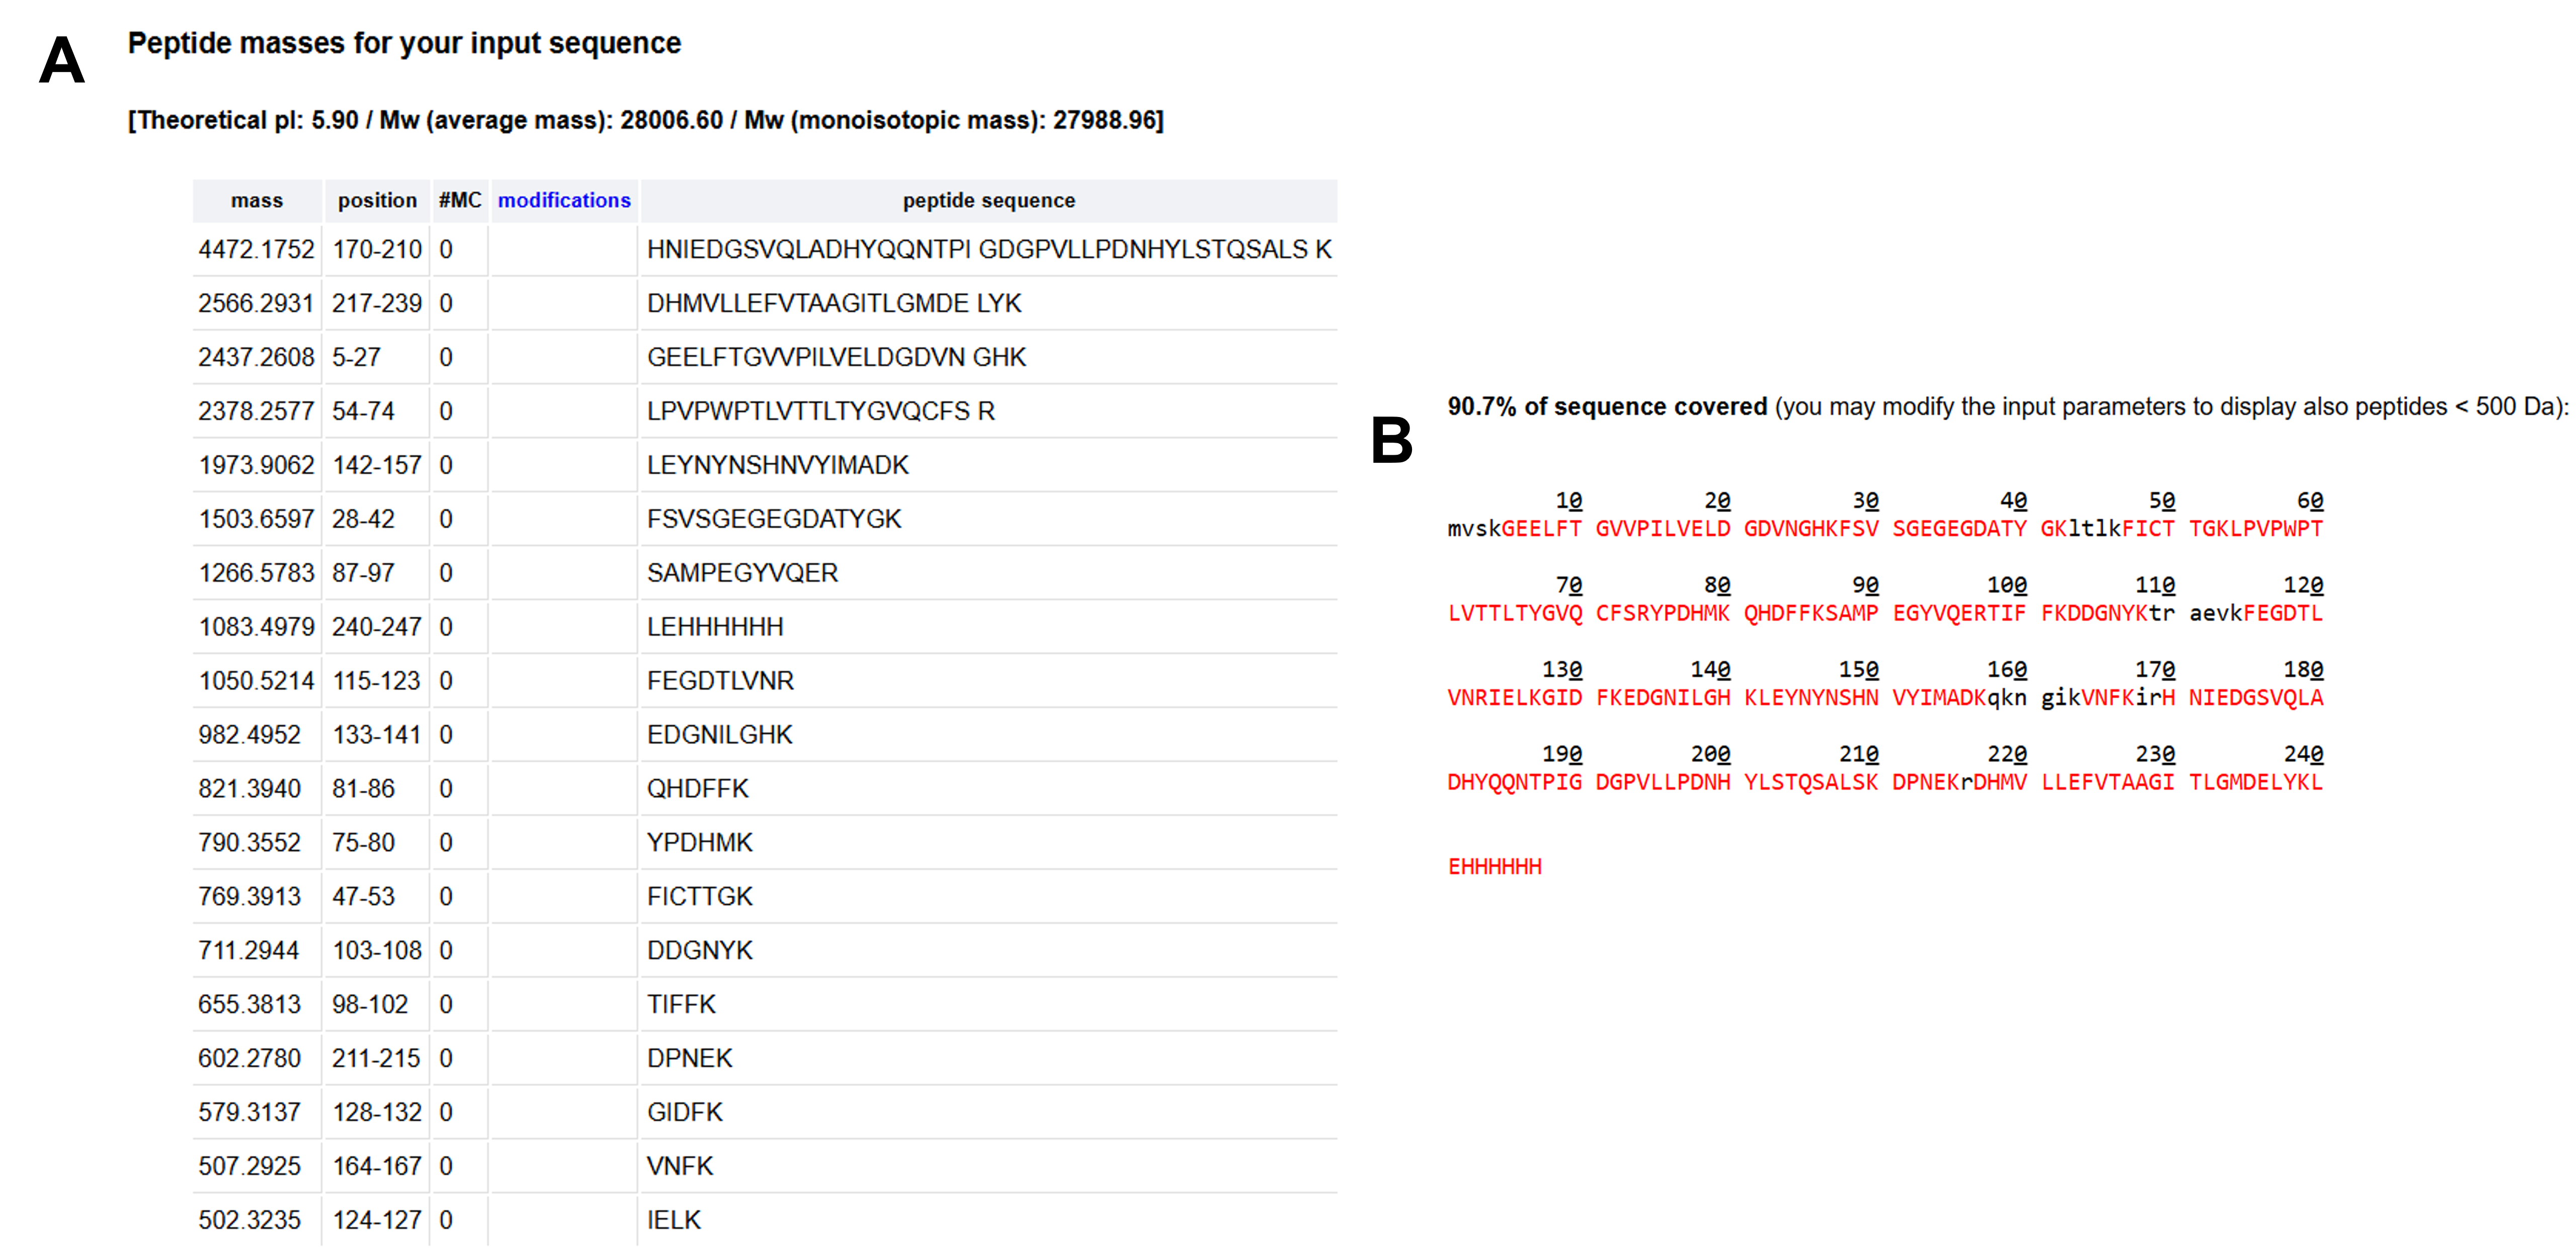 Figure 10.4 Overview of the peptides that occur after the 6x-His C-terminally tagged eGFP previously demonstrated is digested with trypsin. Both peptides with MW >500Da (A) and smaller peptides (B, highlighted in black) are generated after the digestion according to the ExPASy PeptideMass tool.
3. Based on the LC-MS data for the Peptide Map data generated in lab (please use Figure 5a as a reference), how many chromatographic peaks do you see in the eGFP peptide map between 0.5 and 6 minutes? You may count all peaks that are >10% relative abundance.
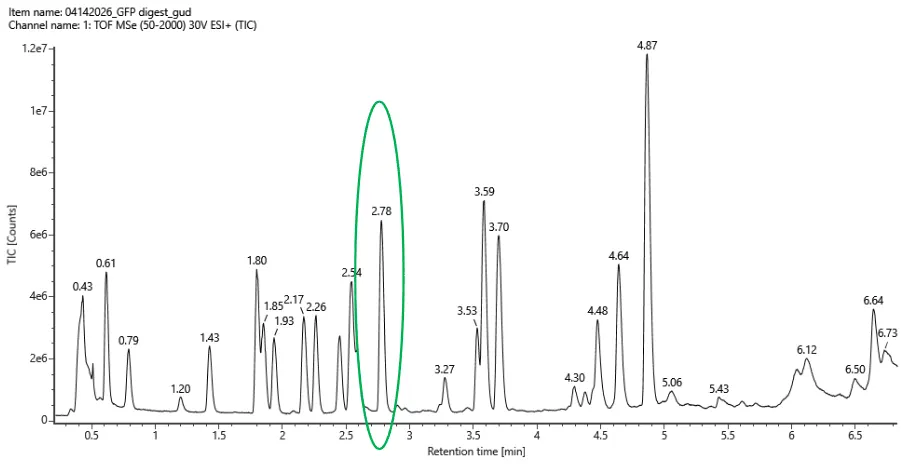 Figure 10.5 Total ion chromatogram (TIC) of the eGFP peptide map. The peak at 2.78 minutes is circled and its MS data are shown in the mass spectrum in Figure 10.6.
To determine which peaks in the chromatogram are >10% relative abundance, I decided to define the peak at 4.87 minutes (the highest peak in the graph) as 100% relative abundance. Since this peak corresponds to approximately 12x106 ion count, only the peaks corresponding to an ion count of 1.2x10⁶ or above should be taken into consideration. Based on this criterion, the peaks in the peptide map between 0.5 and 6 minutes that should be included in the count are at 0.61, 0.79, 1.43, 1.80, 1.85, 1.93, 2.17, 2.26, ~2.46, 2.54, 2.78, 3.27, 3.53, 3.59, 3.70, 4.30, 4.48, 4.64, and 4.87 minutes, therefore 19 peaks in total.
4. Assuming all the peaks are peptides, does the number of peaks match the number of peptides predicted from question 2 above? Are there more peaks in the chromatogram or fewer?
Indeed, the number of peptides that have a MW >500Da (as predicted by ExPASy) matches the number of chromatographic peaks detected between 0.5 and 6 minutes to have >10% relative abundance, which is 19.
5. Identify the mass-to-charge (m/z) of the peptide shown in Figure 10.6. What is the charge (z) of the most abundant charge state of the peptide (use the separation of the isotopes to determine the charge state). Calculate the mass of the singly charged form of the peptide ([M+H]+) based on its m/z and z.
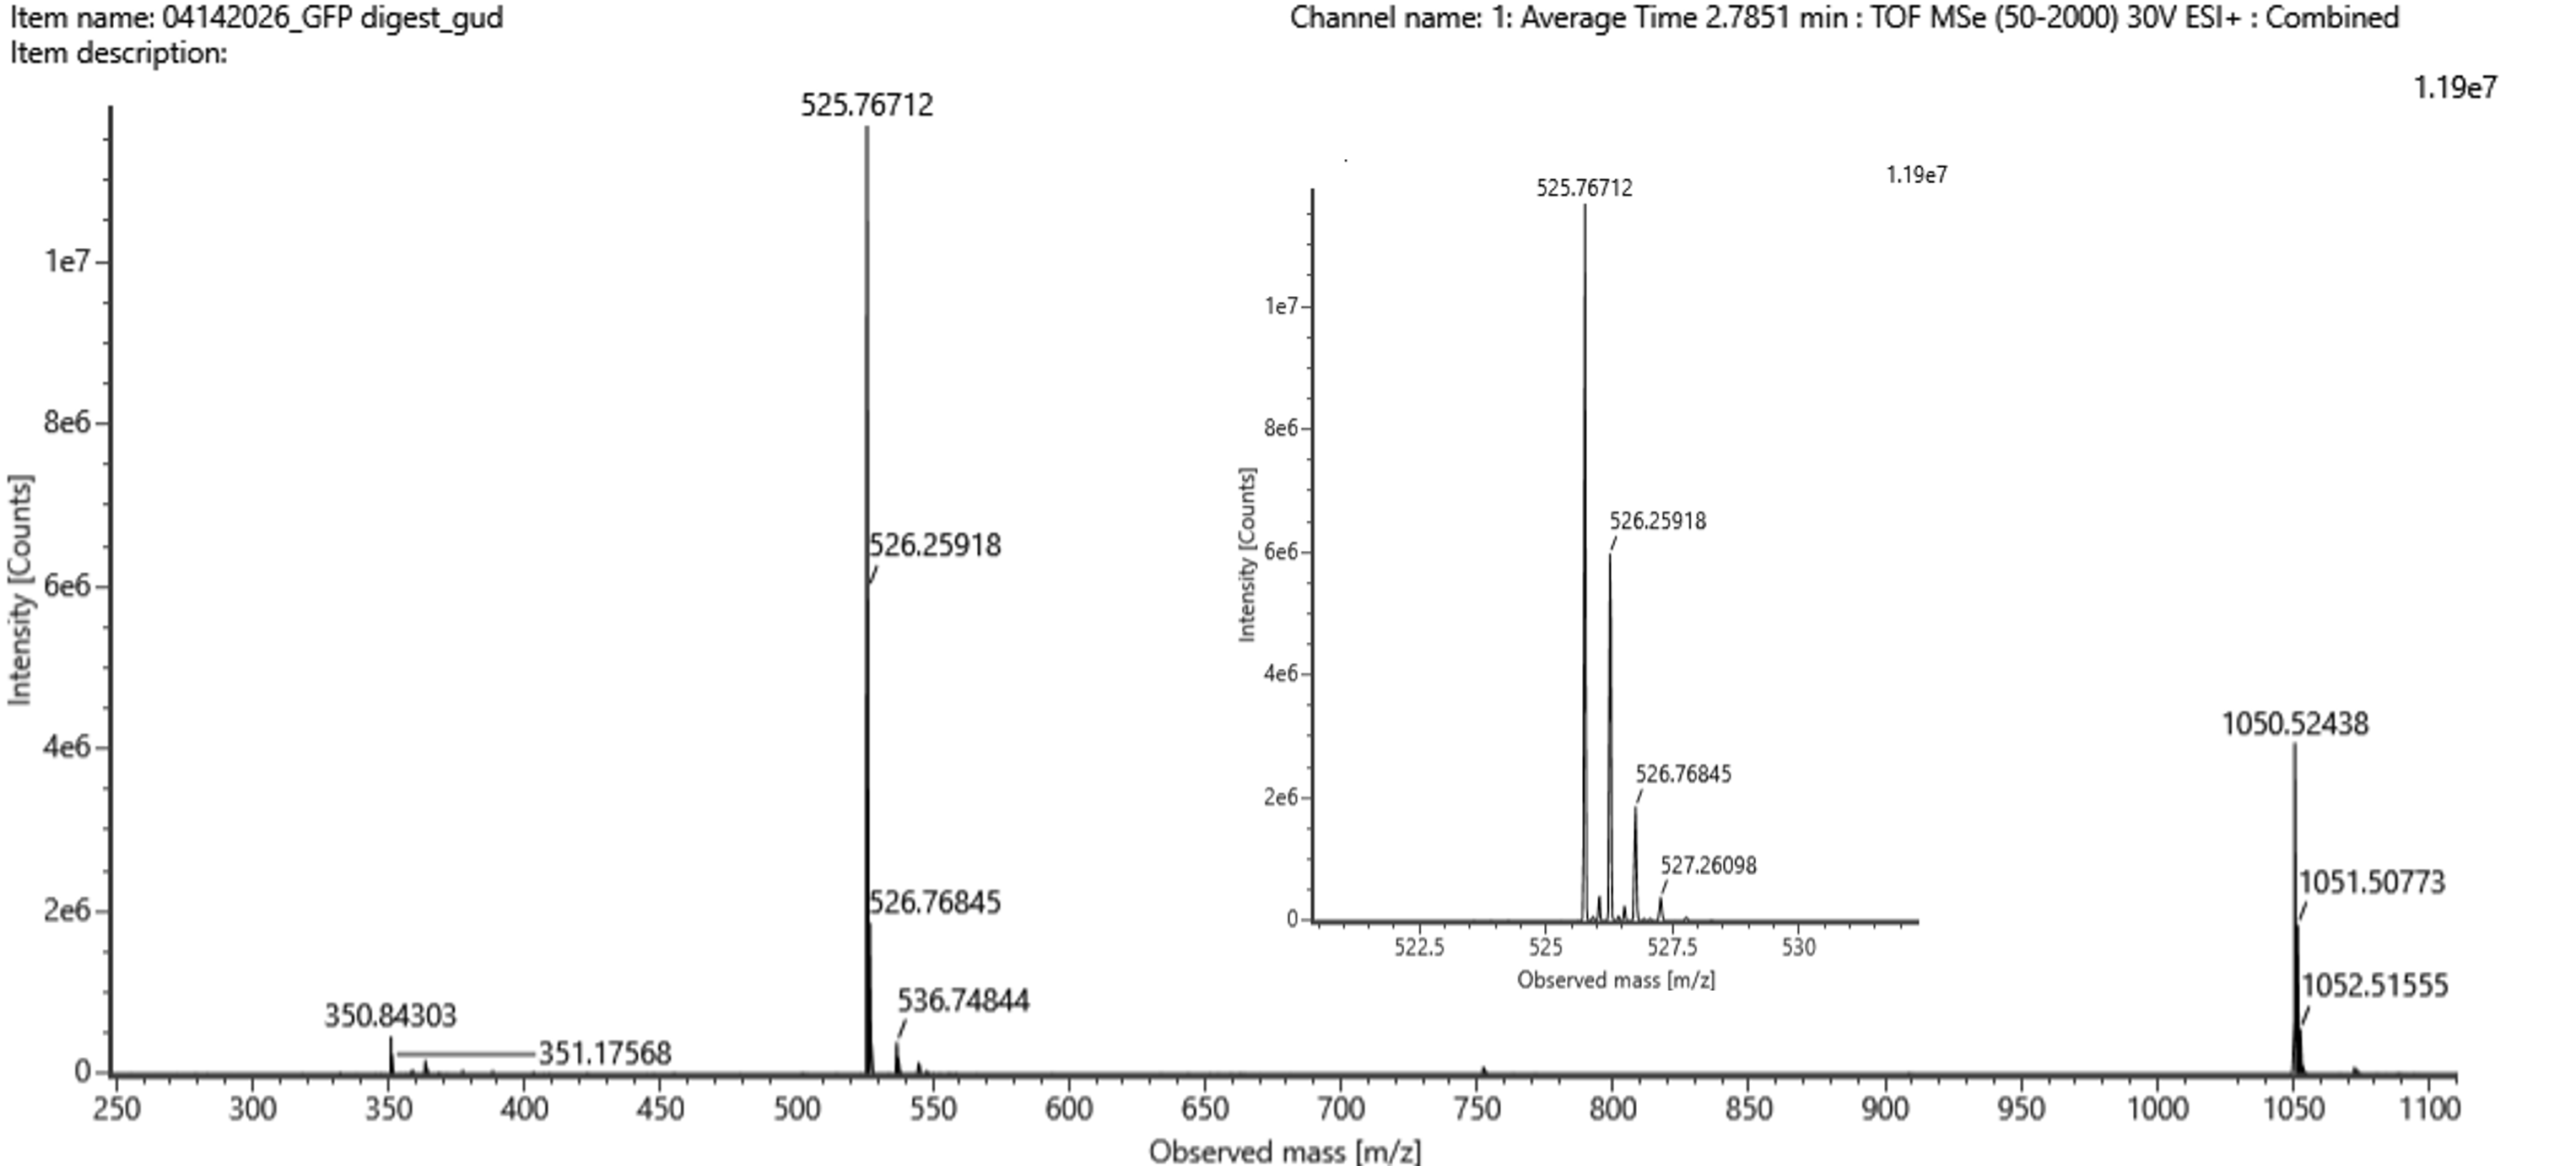 Figure 10.6 Mass spectrum figure to show the m/z for the chromatographic peak at 2.78 minutes from Figure 10.5 above. The inset is a zoom-in of the peak at m/z = 525.76, to discern the isotope peaks.
By observing the different isotopes of the molecule eluted at 2.78 minutes in the inset of Figure 10.6, the different m/z ratios are 525.76712 for the leftmost peak (corresponding to the molecule’s monoisotopic mass), 526.25918 for the peak immediately to the right, 526.76845 for the following peak to the right, and 527.26098 for the rightmost peak of the chromatogram. Based on these measurements, the isotope spacing between each pair of consecutive peaks appears to be Δm/z = ~0.5 (Table 10.1), which corresponds to a charge of z = 2 for the most abundant state of the molecule according to the formula z = 1/(Δm/z). Finally, by utilizing the basic formula for m/z = (M+nH)/n, where n = z = 2 in our case and by solving it as an equation with the variable M as the unknown, the mass of the singly charged form of the peptide should be [M+H]+ = 1,050.53424.
Table 10.1 Δm/z calculations for all combinations of two consecutive peaks depicted in the chromatographic inset of Figure 10.6.
| m/z for peak to the left | m/z for peak to the right | Δm/z | |
|---|---|---|---|
| 1 | 525.76712 | 526.25918 | 0.49206 |
| 2 | 526.25918 | 526.76845 | 0.50927 |
| 3 | 526.76845 | 527.26098 | 0.49253 |
6. Identify the peptide based on comparison to expected masses in the PeptideMass tool. What is mass accuracy of measurement? Please calculate the error in ppm.
Based on a comparison of the result for the previous question ([M+H]+ = 1,050.53424) and the masses of the peptides expected to occur after the digestion of eGFP with trypsin, the peptide that was eluted after 2.78 minutes is probably FEGDTLVNR, which was found to have a theoretical mass of 1,050.5214 according to ExPASy (at the ninth row of the table shown in Figure 10.4A). By applying the formula for accuracy provided above, the accuracy of the mass’ measurement is 1.22x10⁻⁵. After multiplying the accuracy with 106 (to convert to ppm), the error of the measurement is 12.2ppm, so slightly above 10ppm, which is the identification threshold for peptides.
7. What is the percentage of the sequence that is confirmed by peptide mapping? (See Figure 10.7)
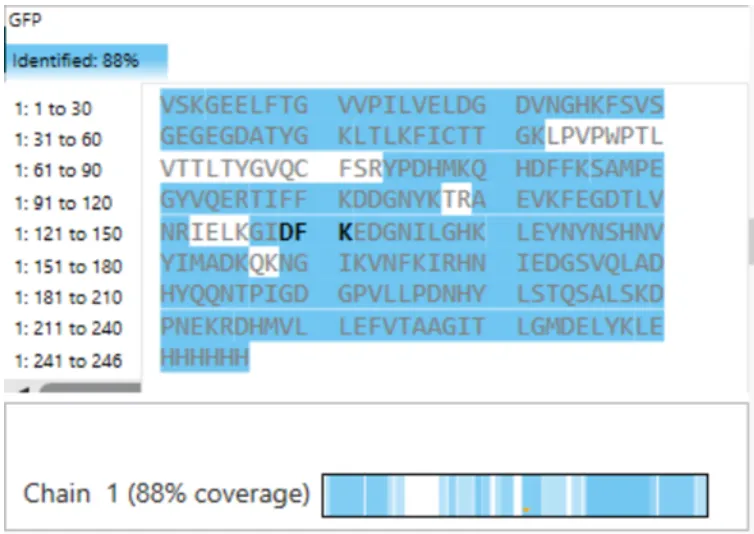 Figure 10.7 Amino acid coverage map of eGFP based on BioAccord LC-MS peptide identification data.
The percentage of the sequence that is confirmed by peptide mapping is 88% or 218 out of the protein’s 247 amino acids (Figure 10.7).
Waters Part IV: Oligomers
We will determine Keyhole Limpet Haemocyanin (KLH)’s oligomeric states using charge detection mass spectrometry (CDMS). CDMS single-particle measurements of KLH allow us to make direct mass measurements to determine what oligomeric states (that is, how many protein subunits combine) are present in solution. Using the known masses of the polypeptide subunits (Table 10.2) for KLH, identify where the following oligomeric species are on the spectrum shown below from the CDMS (Figure 10.8):
- 7FU decamer
- 8FU didecamer
- 8FU 3-decamer
- 8FU 4-decamer
Table 10.2 Keyhole Limpet Haemocyanin (KLH) subunit masses.
| Polypeptide subunit name | Subunit mass |
|---|---|
| 7FU | 340kDa |
| 8FU | 400kDa |
Based on the subunit masses given in Table 10.2 and the number of subunits comprising each oligomeric state of KLH provided by the description above (with “deca” -“δέκα”- meaning “ten”), I calculated the mass for the four different oligomers as presented below.
- 7FU decamer: 340kDax10 = 3,400kDa = 3.40MDa, so the peak at 3.40MDa highlighted in Figure 10.8 with a black arrow.
- 8FU didecamer: 400kDax20 = 8,000kDa = 8.00MDa. The peak closest to this result is the one at 8.33MDa (denoted in Figure 10.8 with a red arrow), which, however, displays a discrepancy of ~330kDa. I could not find anything about this variation in the available literature, so my current hypothesis is that these 330kDa could be attributed to a petidic linker-like feature joining the two decamers together.
- 8FU 3-decamer: 400kDax30 = 12,000kDa = 12.00MDa. Once again, the closest peak closest to this mass is not exactly at the result calculated, but at 12.67MDa (as denoted in Figure 10.8 with a purple arrow). A substantial discrepancy between the theoretically calculated and the experimentally measured mass of the oligomer is observed here as well, albeit doubled (2x330kDa = ~670kDa) in this case. This phenomenon further supports the hypothesis analyzed above, that the additional mass corresponds to a peptide linker contributing to the association of individual decamers, as, for the addition of a third decamer towards the formation of the KLH tridecamer, another linker module, therefore another ~330kDa, would be required.
- 8FU 4-decamer: 400kDax40 = 16,000kDa = 16.00MDa. Based on the linker-related hypothesis described previously, a KLH 8FU tetramer would need three linker units to be assembled, so 16.00MDa combined with an additional 3x330kDa = ~1MDa, and therefore would have a mass of approximately 17MDa. Surprisingly, there are no visible peaks at 16 - 17MDa in the CDMS data in Figure 10.8, but a measurement of very low signal (signified with a green arrow in Figure 10.8). This area could be interpreted as the detected 8FU 4-decamer of KLH, with one possible explanation for the very low intensity of the signal being that the more decameric modules a multi-decamer KLH complex contains the more unstable it is. This molecular instability renders the multi-protein complex more vulnerable to the preparation conditions before the actual MS detection. Taking this into consideration, the more vulnerable a protein complex is the fewer the intact molecules that reach the detector, hence the low signal in Figure 10.8.
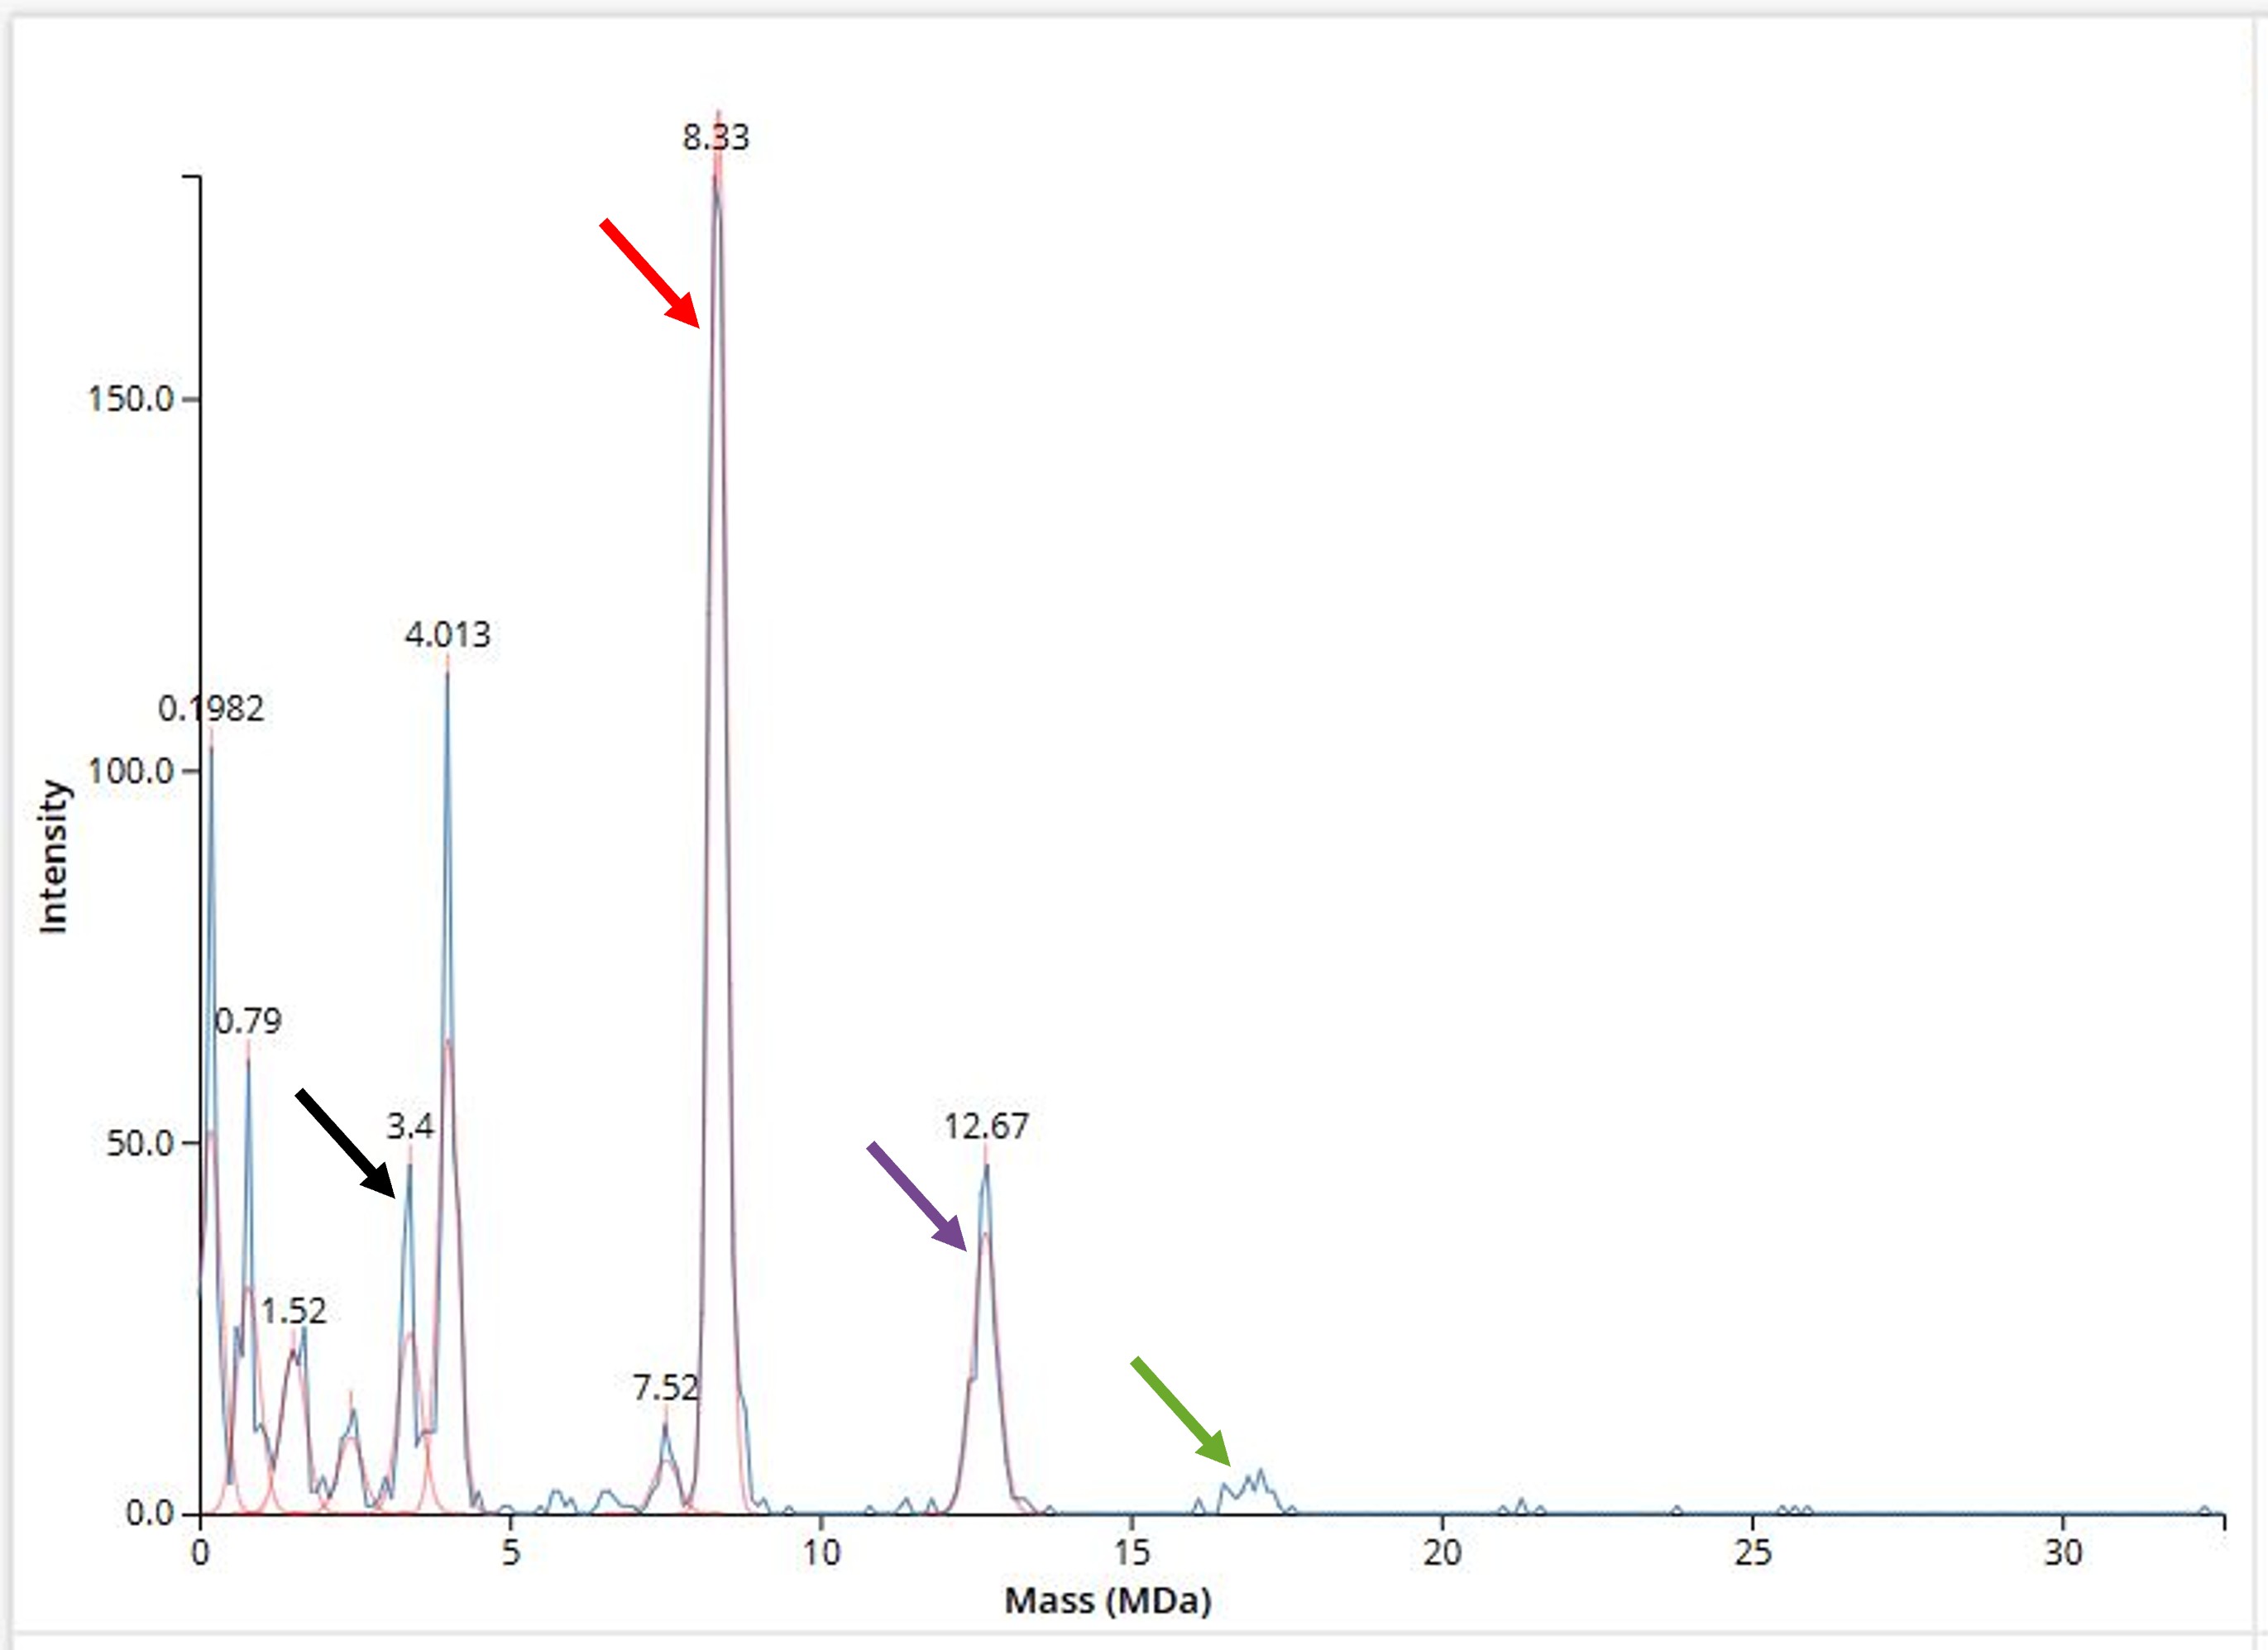 Figure 10.8 Mass spectrum of Keyhole Limpet Haemocyanin (KLH) acquired on the CDMS. The peaks corresponding to discrete oligomers of KLH are signified with arrows of different colors.
Waters Part V: Did I make GFP?
Please fill out Table 10.3 with the data you acquired from the lab work done at the Waters Immerse Lab in Cambridge or else the data screenshots in this document if you were unable to have lab work done at Waters.
Table 10.3 Data gathered from eGFP-related MS measurements.
| Theoretical MW | Observed/measured MW on the intact LC-MS | Mass error |
|---|---|---|
| 28.007kDa | 27.982kDa | 870ppm |
The mass error from the accuracy calculation is 870ppm, which is much higher than the 30 - 50ppm threshold for proteins, therefore I cannot confidently claim that what was measured was eGFP.