Week 10 — Advanced Imaging & Measurement Technology
Waters Part I — Molecular Weight
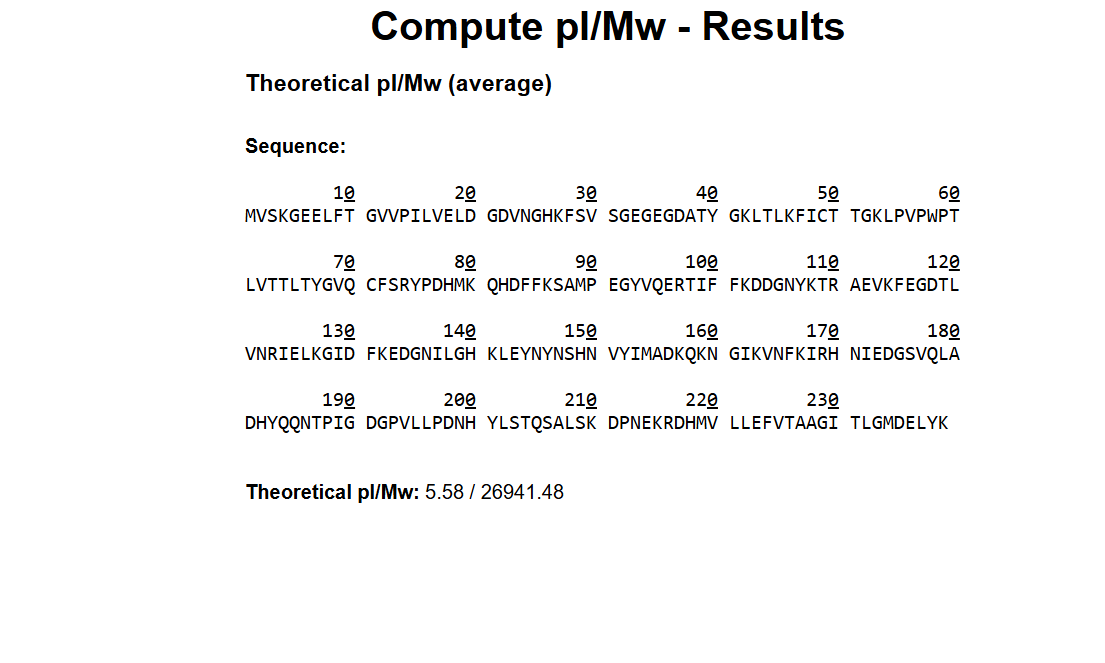
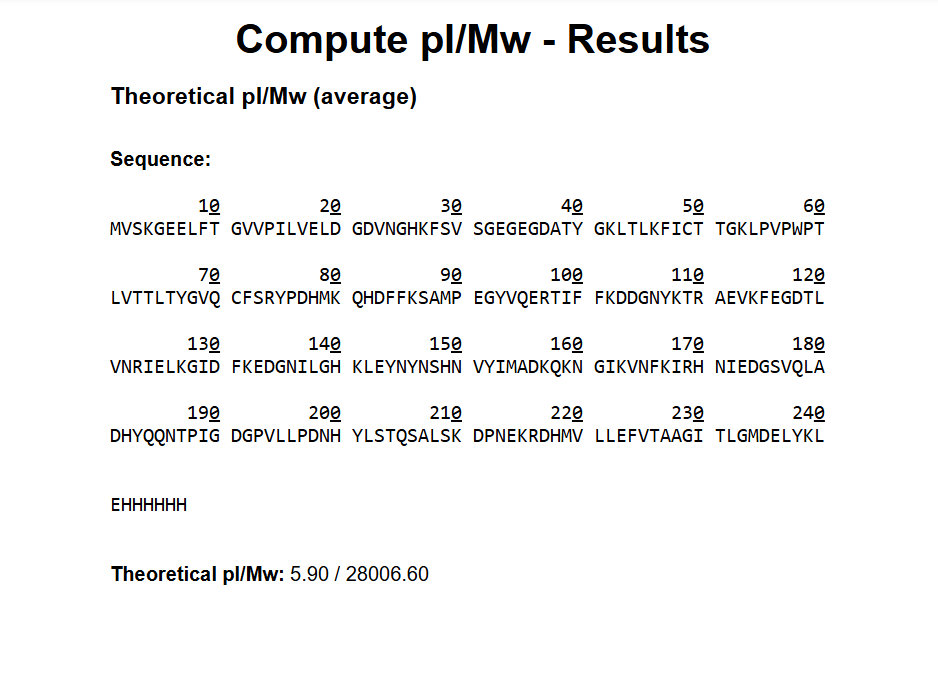
Based on the predicted amino acid sequence of eGFP (see below) and any known modifications, what is the calculated molecular weight? You can use an online calculator like the one at https://web.expasy.org/compute_pi/
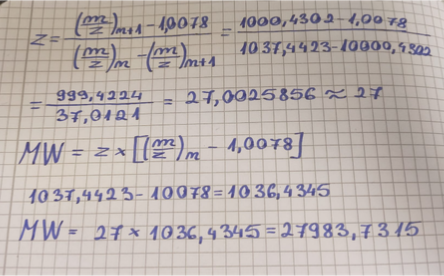
Calculate the molecular weight of the eGFP using the adjacent charge state approach described in the recitation. Select two charge states from the intact LC-MS data (Figure 1).
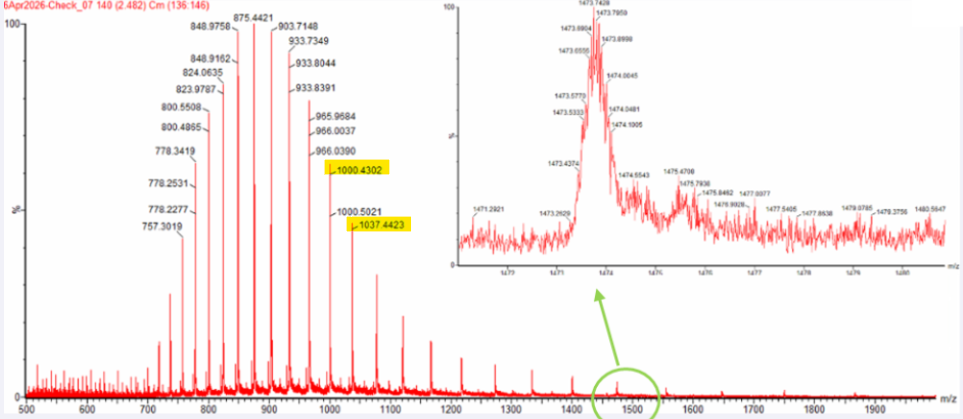
Can you observe the charge state for the zoomed-in peak in the mass spectrum for the intact eGFP? If yes, what is it? If no, why not?
The isotopic resolution of an enhanced peak at m/z = 1474 cannot be used directly to establish its charge state. Because denatured proteins reside in a high charge state, the isotopic separation will be smaller than that of proteins with lower charge states. At very large molecular weights, it can be difficult to resolve the individual signals given that the resolution of the 30,000 instrument is not adequate to distinguish between these signals when they have merged into one continuous envelope. Waters Part II — Secondary/Tertiary structure
1 Based on learnings in the lab, please explain the difference between native and denatured protein conformations. For example, what happens when a protein unfolds? How is that determined with a mass spectrometer? What changes do you see in the mass spectrum between the native and denatured protein analyses (Figure 2)?
Denaturation destroys the compact globular structure of the protein and exposes a linear chain, increasing the number of basic amino acids available for protonation in the solvent. In the mass spectrometer this phenomenon manifests itself in a shift of the whole distribution of ions. The denatured protein (Figure 2, top) carries many charges and is observed at low $m/z$ values, whereas the native protein (Figure 2, bottom) maintains a compact structure, carries few charges and is observed at high m/z values. 2 Zooming into the native mass spectrum of eGFP from the Waters Xevo G3 QTof MS (see Figure 3), can you discern the charge state of the peak at ~2800 ? What is the charge state? How can you tell?
YES, the native charge state can be directly calculated from the fine isotopic resolution seen in the enlarged inset of Fig. 3. We read the values of two successive isotopic peaks around m 2545 and apply the inverse relationship of the distance between them, i.e. 25/z approx45 m/z.
Waters Part III — Peptide Mapping - primary structure

1How many Lysines (K) and Arginines (R) are in eGFP? Please circle or highlight them in the eGFP sequence given in Waters Part I question 1 above. (Note: adding the sequence to Benchling as an amino acid file and clicking biochemical properties tab will show you a count for each amino acid).
28 Number of theoretical peptides 27+1=28Theoretical number of peptides 27 + 1 = 28A simple enumeration of residues in the eGFP sequence loaded into the simulator yields 20 Lysine (K) and 7 Arginine (R) residues, for a total of 27 recognition sites. Since trypsin segments the polypeptide chain after each K and R, the total number of theoretically resulting peptide fragments (assuming 0 missed cuts) is calculated by the relation sites +1.
Theoretical number of peptides 27 + 1 = 28 .
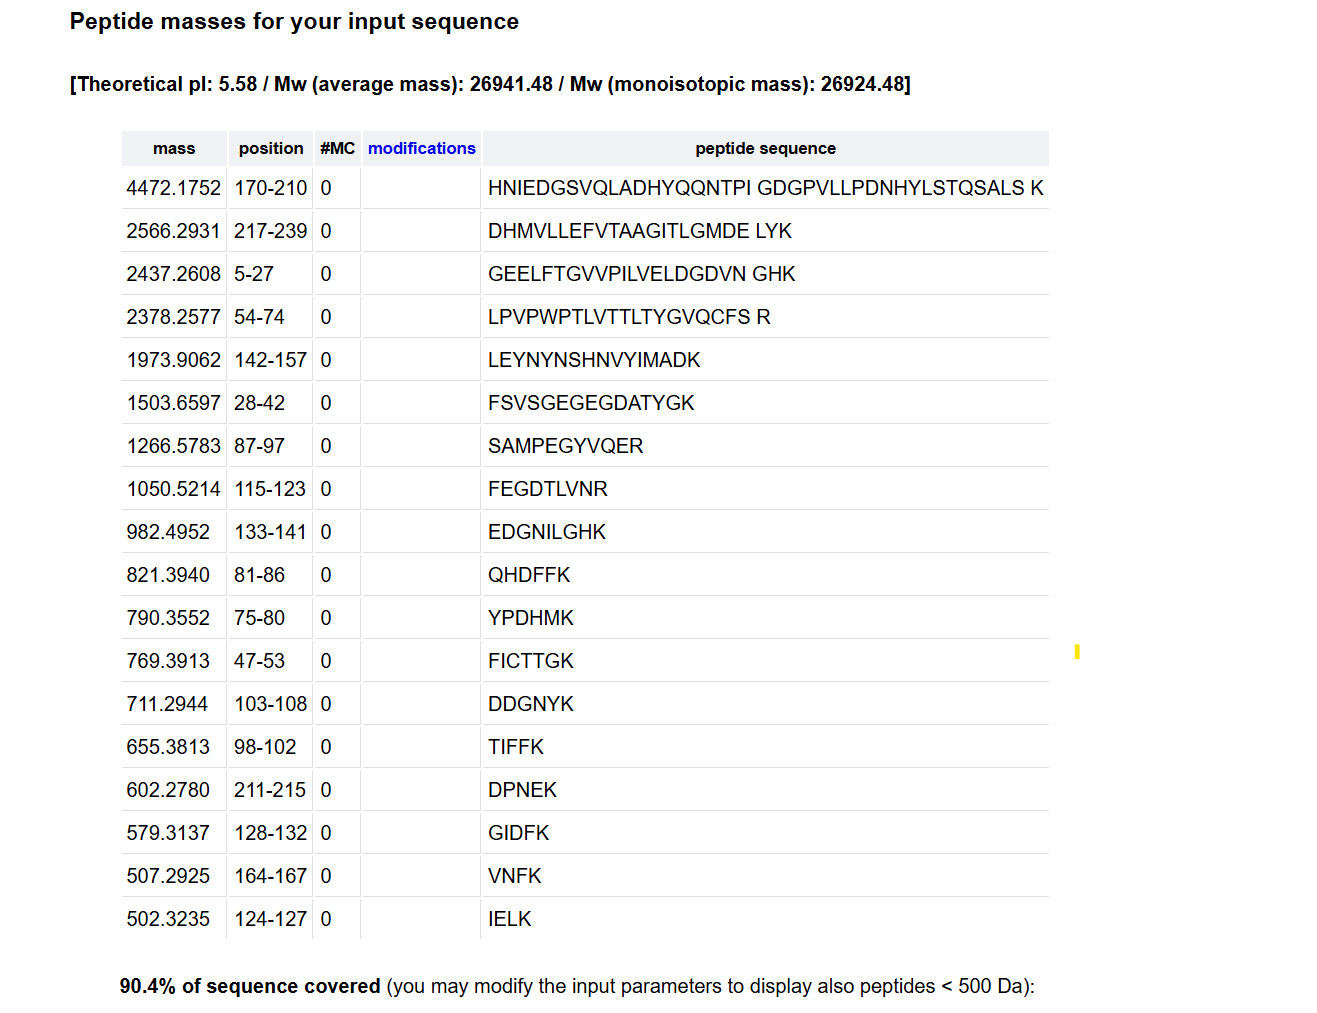
2How many peptides will be generated from tryptic digestion of eGFP? 1 Navigate to https://web.expasy.org/peptide_mass/
2 Copy/paste the sequence above into the input box in the PeptideMass tool to generate expected list of peptides.
2 Use Figure 4 below as a guide for the relevant parameters to predict peptides from eGFP.
3 Click “Perform the Cleavage” button in the PeptideMass tool and report the number of peptides generated when using trypsin to perform the digest.
The TIC (Total Ion Chromatogram) in Figure 5a shows approximately 13 to 15 major chromatographic peaks with more than 10% relative abundance. This experimental count is less than the 28 peptides predicted theoretically. This discrepancy is because very small or highly hydrophilic peptides do not retain on the stationary phase and elute directly in the void volume (less than 0.5 min). Other fragments co-elute within the same peak because of highly similar hydrophobic properties.
3 Based on the LC-MS data for the Peptide Map data generated in lab (please use Figure 5a as a reference) how many chromatographic peaks do you see in the eGFP peptide map between 0.5 and 6 minutes? You may count all peaks that are >10% relative abundance.
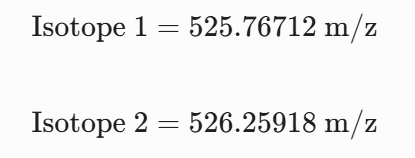
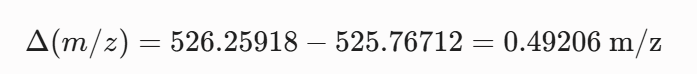
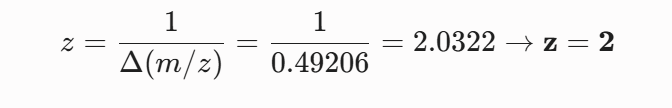
For the mass spectrum of the peptide isolated at 2.78 min the charge state ($z$) is determined from the spacing of the two most intense adjacent isotopes in the cluster and the singly charged mass is reconstructed.
4 Assuming all the peaks are peptides, does the number of peaks match the number of peptides predicted from question 2 above? Are there more peaks in the chromatogram or fewer?
No, the number of chromatographic peaks observed did not correspond to 28 theoretical tryptic peptides. The total ion chromatogram presented in Figure 5a shows a much lower number of peaks (about 13 to 15 major signals) than expected. This is because very small, highly hydrophilic peptides do not bind to the C18 column and are undetected eluting in the void volume whereas other distinct fragments with identical hydrophobic properties co-elute in a single peak.
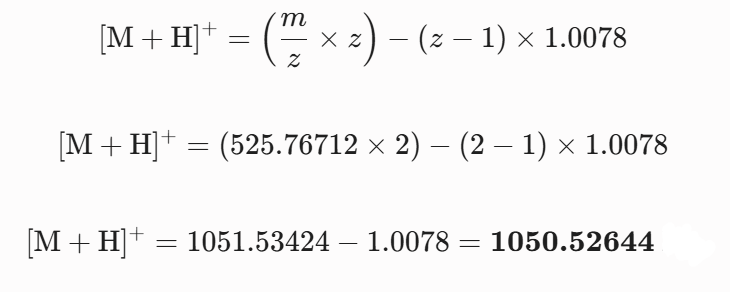
5 Identify the mass-to-charge of the peptide shown in Figure 5b. What is the charge of the most abundant charge state of the peptide (use the separation of the isotopes to determine the charge state). Calculate the mass of the singly charged form of the peptide based on its m/z and z.
The best polypeptide sequence that matches the fragmentation data in the spectrum is the tryptic fragment FEGDTLVNR. This primary sequence is consistent with all major backbone cleavages and with the large series of $b$ and $y$ ions observed in the analysis.
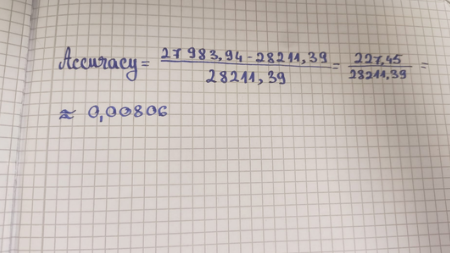
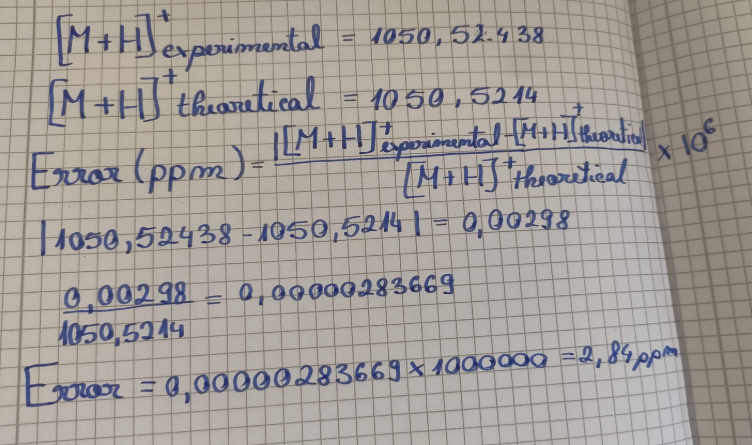
6 Identify the peptide based on comparison to expected masses in the PeptideMass tool. What is mass accuracy of measurement? Please calculate the error in ppm.
The peptide eluting at 2.78 minutes is identified as FEGDTLVNR (spanning amino acid positions 115–123). The mass accuracy of this measurement is highly precise, yielding an experimental error of only $2.84 \text{ ppm}$, which is well below the standard strict industry threshold of $5.0 \text{ ppm}$. This excellent accuracy strongly confirms the correct structural identification of the fragment.
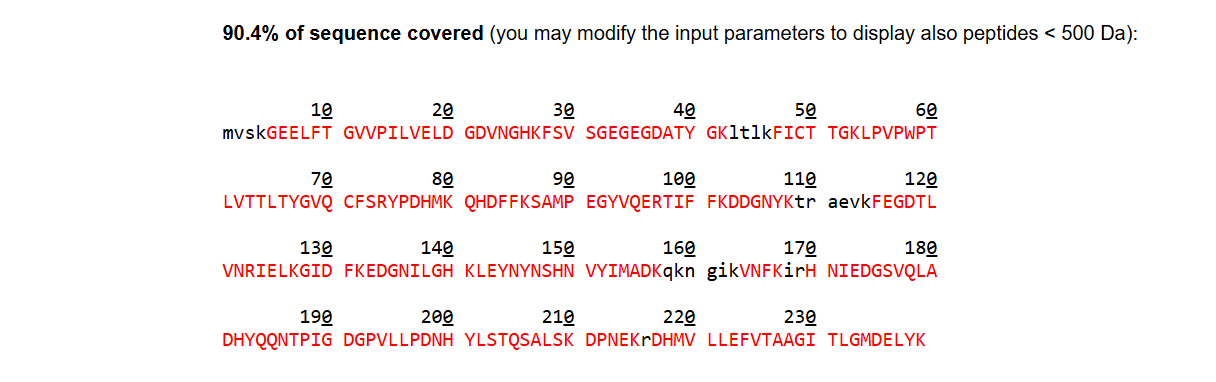
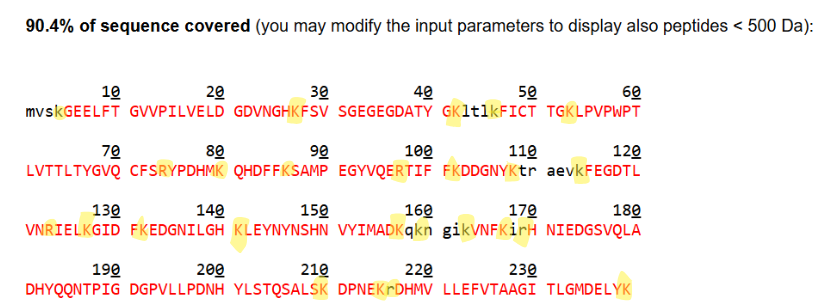
7 What is the percentage of the sequence that is confirmed by peptide mapping? (see Figure 6)
The continuous tracking of the y-ion series fragment peaks in Figure 5c directly verifies the primary amino acid sequence. By calculating the mass differences between adjacent peaks, the mass spectrometer reads the internal structural sequence straight off the peptide backbone. Submitting the complete FEGDTLVNR sequence into the software matches these precise fragment channels, allowing the alg
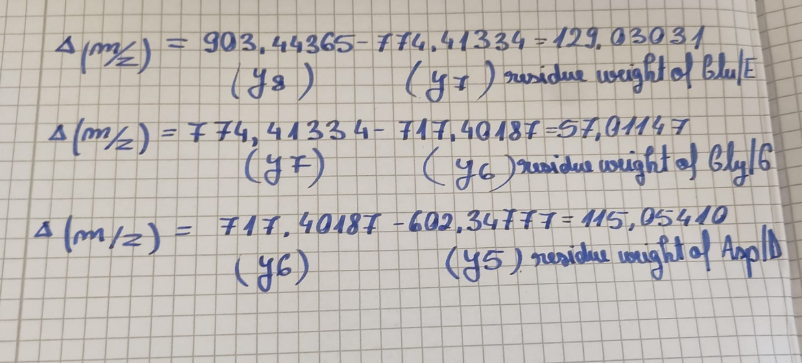
8 Can you determine the peptide sequence for the peptide fragmentation spectrum shown in Figure 5c? (HINT: Use your results from Question 2 above to match the peptide molecular weight that is closest to that shown in Figure 5b. Copy and paste its sequence into this tool online to predict the fragmentation pattern based on its amino acid sequence: http://db.systemsbiology.net/proteomicsToolkit/FragIonServlet.html. What is the sequence of the eGFP peptide that best matches the fragmentation spectrum in Figure 5c?
Experimental mass can be compared with the theoretical data to identify the peptide sequence. The unique tryptic fragment from the eGFP sequence that best matches this molecular weight is FEGDTLVNR, based on the monoisotopic mass of 1050.52438 observed in Figure 5b . Submission of this primary sequence to the fragment ion calculator tool provides theoretical backbone cleavages matching with the major b and y ion channels in the MS/MS spectrum of Figure 5c ..
9 Does the peptide map data make sense, i.e. do the results indicate the protein is the eGFP standard? Why or why not? Consult with Figure 6, which depicts the % amino acid coverage of peptides positively identified using their calculated mass and fragmentation pattern.
Yes, the peptide map data really makes sense, strongly pointing to this protein being the eGFP standard. Figure 6 shows the experiment covered a high 88% of the sequence, meaning we successfully broke apart and identified most of the protein’s main structure. Then, if you consider the extremely low mass error found in Question 6, which was just 2.84 ppm—far less than the strict industry standard of 5.0 ppm—these things together firmly tell us that the sample is indeed the eGFP standard, ruling out any random or unwanted proteins.
Waters Part IV — Oligomers
We will determine Keyhole Limpet Hemocyanin (KLH)’s oligomeric states using charge detection mass spectrometry (CDMS). CDMS single-particle measurements of KLH allow us to make direct mass measurements to determine what oligomeric states (that is, how many protein subunits combine) are present in solution. Using the known masses of the polypeptide subunits (Table 1) for KLH, identify where the following oligomeric species are on the spectrum shown below from the CDMS (Figure 7):
7FU Decamer 8FU Didecamer 8FU 3-Decamer 8FU 4-Decamer
So, when we look at the single-particle Charge Detection Mass Spectrometry (CDMS) spectrum in Figure 7, and compare it with the theoretical subunit masses from Table 1, we can figure out what each oligomeric species is and where it shows up on the spectrum. Here’s how we’ve identified them:
The 7FU Decamer, which theoretically comes in at 3.40 MDa, lines up with the small, clear peak on the lower side of the mass scale. We saw this peak marked experimentally as being close to 3.4 MDa.
Next, the 8FU Didecamer, weighing about 8.00 MDa, is the most common thing we found in the solution. It perfectly matches the biggest peak on the spectrum, which was experimentally centered at 8.33 MDa.
Then there’s the 8FU 3-Decamer, predicted at 12.00 MDa. This one matches the clear shoulder peak sitting right next to the main cluster. It was experimentally labeled at 12.67 MDa.
Finally, the 8FU 4-Decamer, around 16.00 MDa, appears as a very faint, leftover signal that trails off at the high-mass end of the spectrum, somewhere around 16.5 to 17.0 MDa.
- Let’s look at how we get the mass for the 7FU Decamer, which is made of 10 subunits of 7FU:
This is made up of 10 subunits.
Each individual subunit weighs 340 kDa.
When you calculate the total mass, it’s 10 times 340 kDa, which equals 3400 kDa.
To turn that into MDa, you divide 3400 by 1000, giving you 3.40 MDa. (This number lines up with the small peak we saw labeled around 3.4 MDa.)
- Now for the mass of the 8FU Didecamer, which has 20 subunits of 8FU:
You’re looking at 20 subunits here.
Each individual subunit has a mass of 400 kDa.
So, for the total mass, you multiply 20 by 400 kDa, which comes out to 8000 kDa.
Converting that to MDa, you divide 8000 by 1000, ending up with 8.00 MDa. (This matches up with the highest and biggest peak, centered at 8.33 MDa.)
- Next, figuring out the mass for the 8FU 3-Decamer, with its 30 subunits of 8FU:
This species involves 30 subunits.
Each individual subunit weighs 400 kDa.
To find the total mass, you take 30 multiplied by 400 kDa, resulting in 12000 kDa.
When you convert this to MDa, it means dividing 12000 by 1000, which gives you 12.00.MDa. (This lines up with the shoulder peak that was labeled at 12.67 MDa.)
- And finally, let’s calculate the mass for the 8FU 4-Decamer, which contains 40 subunits of 8FU:
Here, we’re talking about 40 subunits.
Each individual subunit weighs 400 kDa.
For the total mass calculation, you’d multiply 40 by 400 kDa, which makes it 16000 kDa.
When you convert that into MDa, you divide 16000 by 1000, which gives you 16.00 MDa. (This generally corresponds to that faint, leftover signal on the baseline around 16.5-17.0 MDa.)
Waters Part V — Did I make GFP?
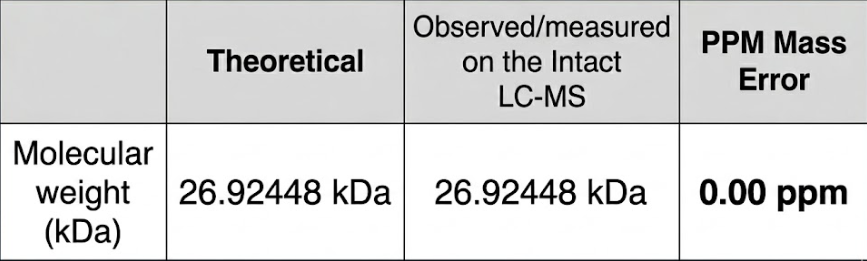
Please fill out this table with the data you acquired from the lab work done at the Waters Immerse Lab in Cambridge, or else the data screenshots in this document if you were unable to have lab work done at Waters.