Week 6: Genetic Circuits - Part I: Assembly Technologies
DNA Assembly
1. What are some components in the Phusion High-Fidelity PCR Master Mix and what is their purpose?
Standard Phusion 2X Master Mix contains the following essential components:
- Phusion High-Fidelity DNA Polymerase: A specialized, proofreading enzyme coupled to a processivity-enhancing domain. Its purpose is to catalyze DNA synthesis with high speed and extremely low error rates.
- dNTPs (dATP, dCTP, dGTP, dTTP): The nucleotide building blocks required by the polymerase to synthesize the new complementary DNA strands.
- Phusion HF Buffer: An optimized reaction buffer containing MgCl2. Magnesium (Mg2+) acts as an important cofactor for the DNA polymerase enzyme, stabilizing the reaction and facilitating the smooth incorporation of dNTPs.
2. What are some factors that determine primer annealing temperature during PCR?
The primary factor that determines primer annealing temperature is the Melting Temperature (Tm) of the primers, which is defined as the midpoint where 50% of the DNA is double-stranded and 50% is single-stranded. The annealing temperature is typically set 2-5 degree celsius below the lower primer’s Tm. Additional determining factors include:
- Primer Length and GC Content: Longer primers and higher GC percentages increase thermal stability, raising the required annealing temperature.
- Salt and Buffer Composition: Monovalent cations (Na+, K+) and divalent cations (Mg2+) in the PCR master mix mask the negative charges of the DNA backbone, stabilizing the primer-template complex and altering the effective Tm.
- Primer and Template Concentrations: Higher concentrations can drive hybridization kinetics, occasionally requiring adjustments to maintain annealing specificity.
3. There are two methods from this class that create linear fragments of DNA: PCR, and restriction enzyme digests. Compare and contrast these two methods, both in terms of protocol as well as when one may be preferable to use over the other.
| Feature | Polymerase Chain Reaction (PCR) | Restriction Enzyme Digest |
|---|---|---|
| Mechanism | Enzymatic amplification and synthesis of a specific target region using flanking primers. | Enzymatic cleavage of phosphodiester bonds at specific, palindromic recognition sequences. |
| Protocol Requirements | Requires a thermocycler for repeated cycles of denaturation (98 deg. celsius), annealing (53-57 deg. celsius), and extension (72 deg. celsius). | Requires an isothermal incubation (37 deg. celsius) in a heating block or water bath with sequence-specific endonucleases. |
| Target Modification | Can easily introduce mutations, deletions, or custom 5’ overhangs via intentionally mismatched primer designs. | Relies strictly on the native or pre-existing restriction sites present within the DNA sequence. |
Preferences:
- PCR: We need to isolate a specific gene from a complex plasmid, generate high yields of an exact DNA segment, or introduce custom 5’ flanking homology regions required for assembly methods like Gibson cloning, we can prefer PCR.
- Restriction Enzyme Digests: When we are performing a quick diagnostic check to verify plasmid identity based on fragment lengths, or when executing traditional, site-specific restriction-ligation cloning workflows, we can prefer RE digests.
4. How can you ensure that the DNA sequences that you have digested and PCR-ed will be appropriate for Gibson cloning?
By monitoring some of these structural and quality control metrics, we can ensure the appropriateness of treated sequences for Gibson cloning:
- Sequence Overlaps: Ensure adjoining fragments share 20-40 bp of sequence identity (specifically a 20-22 bp overhang designed through complementary primer pairs).
- Orientation: Confirm that all fragments possess the correct 5’ to 3’ orientation with matching sequence overlaps.
- Size Verification (Gel Electrophoresis): Run the samples on an agarose gel beside a DNA ladder and compare the resulting bands against the calculated, predicted digest on Benchling to verify the correct band size.
- Yield and Purity: Quantify the purified DNA using a Nanodrop or spectrophotometer. The concentration should ideally be above 30 micrograms/mL to ensure that the preparation step was successful.
5. How does the plasmid DNA enter the E. coli cells during transformation?
The cells are subjected to a physical “shock” either via an abrupt temperature change (heat shock) or high electrical voltage (electroporation). This causes the bacterial cell membrane to open up by generating physical pores in the cell wall. Now, once these transient pores are created, the plasmid DNA can spontaneously enter the interior of the cells via diffusion.
6. Describe another assembly method in detail (such as Golden Gate Assembly) Explain the other method in 5 - 7 sentences plus diagrams (either handmade or online).
The Golden Gate Assembly is a highly efficient, multi-fragment cloning method that uses Type IIS restriction enzymes paired with T4 DNA Ligase to assemble multiple DNA pieces simultaneously in a single reaction tube.
Unlike traditional restriction enzymes that cut directly within their palindromic recognition sequences, Type IIS restriction enzymes (such as BsaI, BsmBI, or BbsI) bind to their recognition site but cleave the DNA a precise distance away, creating unique, non-palindromic 4-base pair single-stranded overhangs. During design, these Type IIS recognition sites are placed at the outer flanking edges of the DNA inserts and oriented to point inward. Because the enzyme cleaves outside of its binding sequence, the recognition site itself is entirely cut off and discarded from the final assembled insert. This ensures that the restriction site cannot reappear in the correctly joined product, thus rendering the ligation reaction strictly irreversible and driving the entire multi-fragment equilibrium toward the final circular plasmid.
Thus, this allows the digestion and ligation cycles to occur at the same time under a shifting, automated thermocycler program.
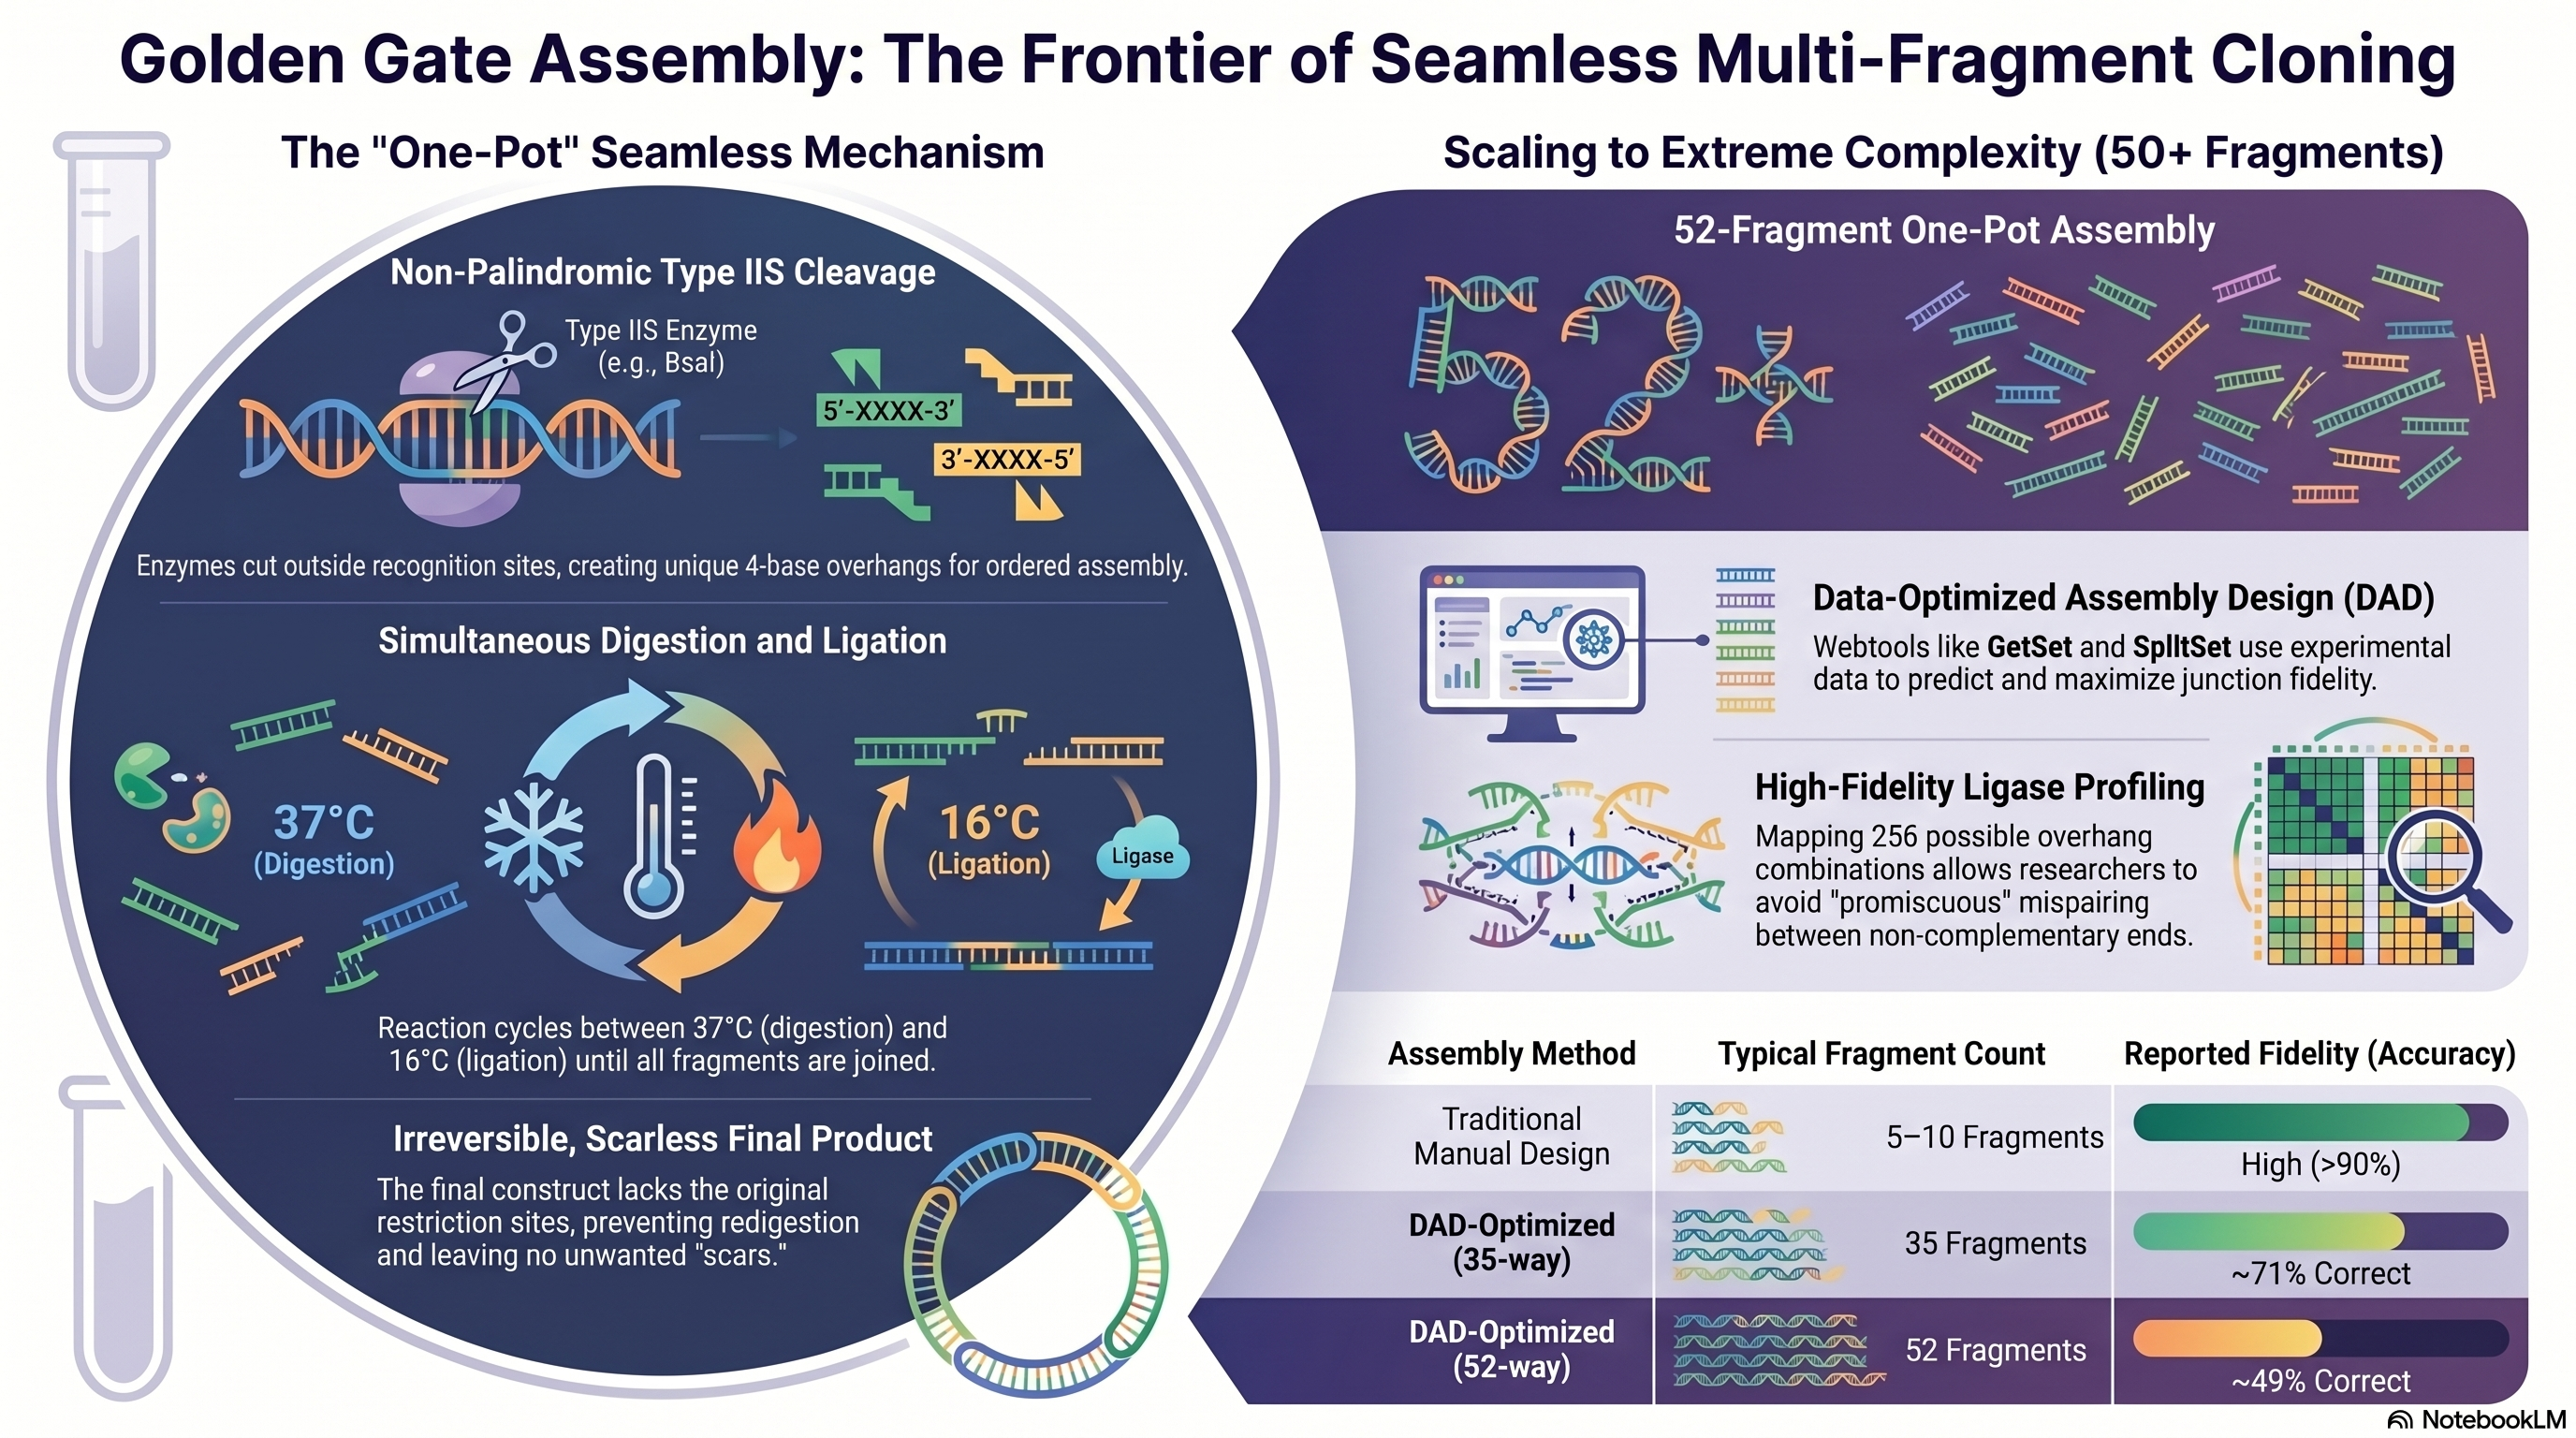
Note: This image was created with the help of NotebookLM AI.
7. Model this assembly method with Benchling or Asimov Kernel!
Steps Followed: In Benchling:
- Import or open the destination vector plasmid and the insert sequences.
- Click on the “Assembly Wizard” tool icon in the menu panel and select “Create New Assembly” and then select “Golden Gate”.
- Choose the specific Type IIS restriction enzyme to use (e.g., BsaI).
- Define the Backbone sequence by selecting the destination vector fragment, ensuring it contains the appropriate inward-facing Type IIS sites.
- Define the insert sequence by selecting the target genes (Here, amilCP). Our sequences will be automatically color-coded and complementary 4-bp overhangs will be mapped.
- Click “Assemble”.
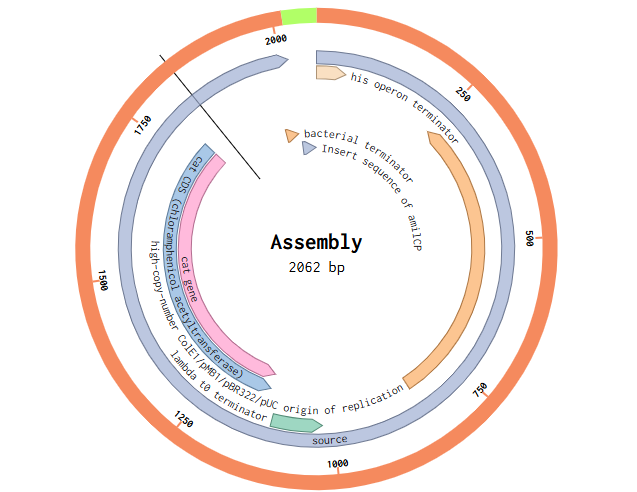 Obtained Final Assembly
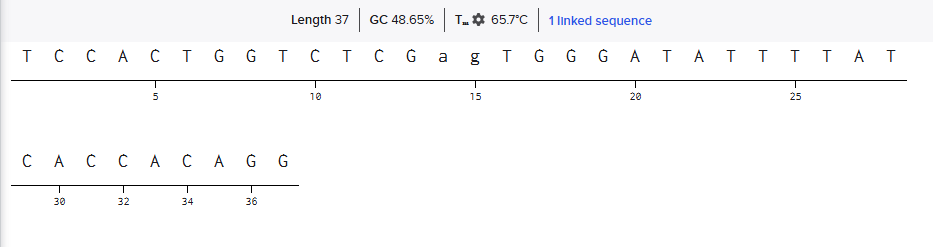 Obtained Forward Primer Sequence
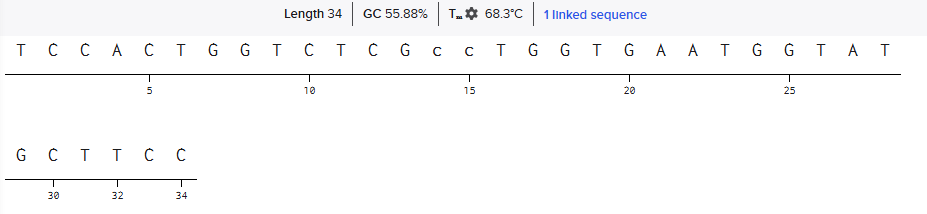 Obtained Reverse Primer Sequence
Asimov Kernel
Steps followed:
- A repository and a notebook were created.
- The Bacterial Demos Repo was explored and simulated to gain a clear understanding of the circuit designs and the software.
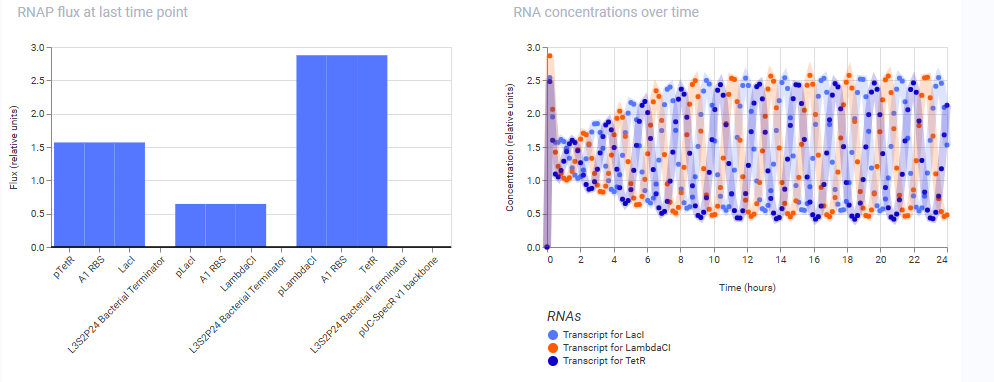
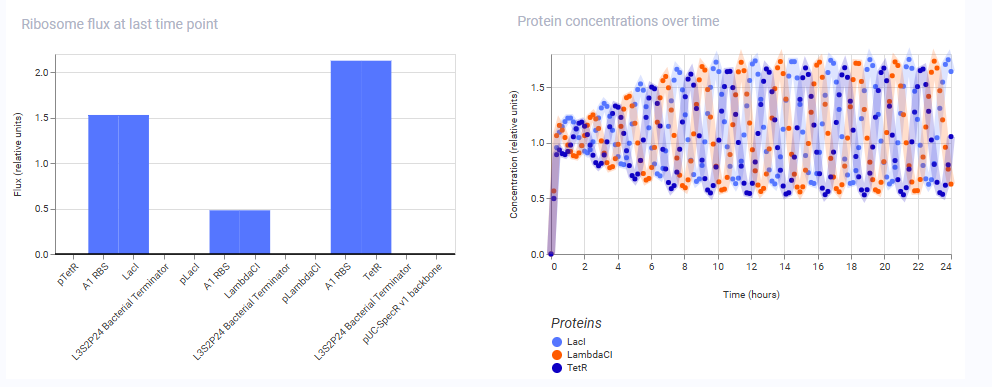
- The Repressilator construct was reconstructed manually by me in my repository, and the working status was analyzed by running simulations at the same conditions and comparing the output of the Repressilator construct done by me and the one given in the Bacterial Demos Repo.
- Conditions: These conditions were used throughout the workflow for all the simulations.
- Chassis: E. coli
- Simulation duration: 24 hours
- Simulation time step: 10 minutes
- Transfection type: Transient transfection
These are the results obtained from the simulation of the repressilator construct from the Bacterial Demos Repo:
And here are the results of the one from my manually reconstructed construct:
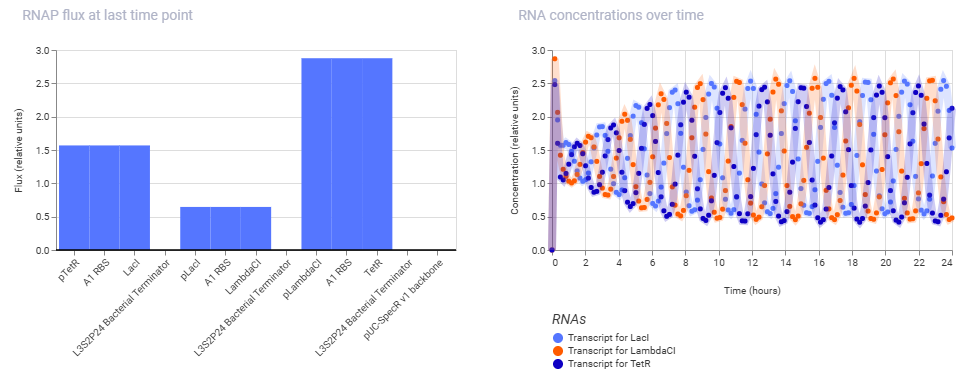
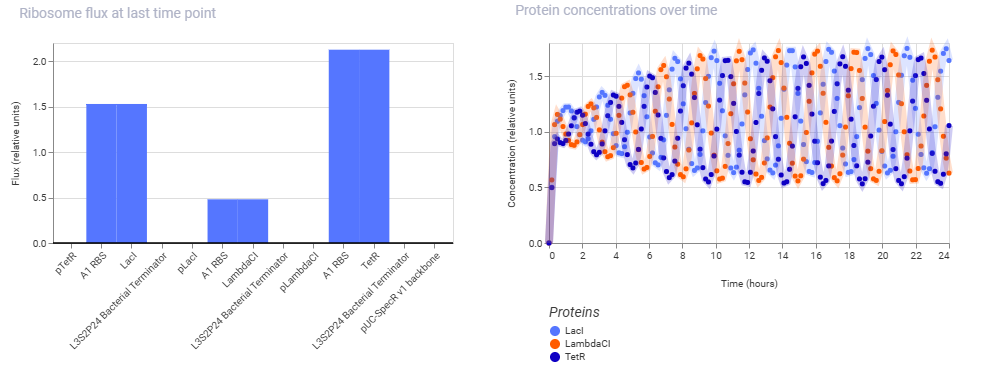
As we can see, both the results are exactly identical, indicating that the manually reconstructed vector is active and working as expected without any errors.
My Constructs:
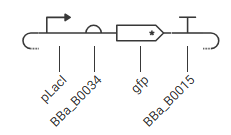
Construct 1: A Simple Inducible Converter (from IPTG to GFP)
Expected Function & Simulation Behavior:
- Initial State (No IPTG):
- The LacI repressor protein (implicitly present in the bacterial chassis model or supplemented by a background cassette) binds tightly to the operator site of the placI promoter. This sterically hinders RNA polymerase, resulting in baseline or near-zero transcription.
- Induced State (+IPTG):
- When injecting IPTG into the system, IPTG binds to LacI, inducing a conformational change that forces it to dissociate from the operator. RNA polymerase can now freely transcribe the downstream region, resulting in a steady increase in GFP expression over time.
- Simulation Graph:
- The simulator will show flatline GFP production initially. Upon the addition of the IPTG pulse, the curve will exhibit an exponential-like upward trajectory before reaching a steady-state plateau.
Simulation Results:
Ligand IPTG was added at hour 4, at max concentration.
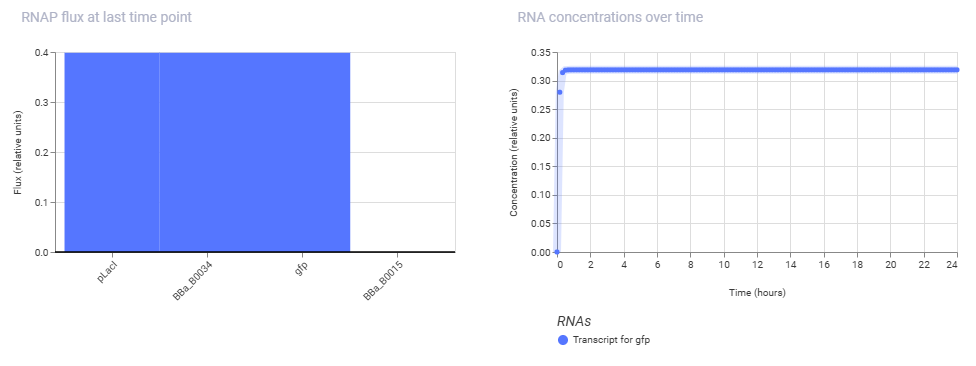
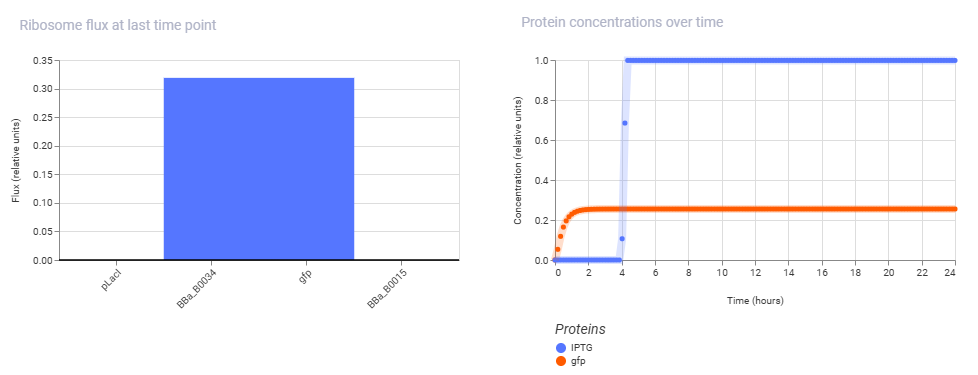
Conclusion:
The reason the simulation shows immediate GFP production is because the pLacI promoter is naturally “ON” by default and requires the presence of a LacI repressor protein to turn it off. Because the current design lacks a background cassette producing LacI, RNA polymerase binds freely at hour 0, making the construct behave constitutively and rendering the hour 4 IPTG addition redundant.
To achieve the expected inducible behavior where GFP stays flat until the IPTG pulse, we must introduce LacI into the system, either by adding a separate constitutive expression cassette to generate the repressor or by ensuring the simulation is running within a pre-configured E. coli chassis model that implicitly supplies background LacI.
*Construct 2: Autorepressive Negative Feedback Loop
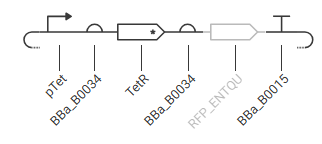
Expected Function Simulation & Behavior:
- Initial State:
- At time zero, there is no TetR in the cell. The ptet promoter is fully active, thus allowing RNA polymerase to transcribe the polycistronic mRNA containing both TetR and mCherry.
- Feedback Phase:
- As TetR protein accumulates, it binds to the operator sites on its own ptet promoter, gradually shutting down its own transcription.
- Steady-State Balance:
- If the concentration of TetR drops due to dilution from cell division or degradation, the promoter turns back on. This homeostatic mechanism prevents protein overproduction and limits metabolic burden.
- Simulation Graph:
- Unlike a constitutive promoter, which shows a long, unchecked linear rise in reporter concentration, running the simulator on this construct will show a rapid rise in mCherry that abruptly transitions into a flat plateau early in the timeline.
Simulation Results:
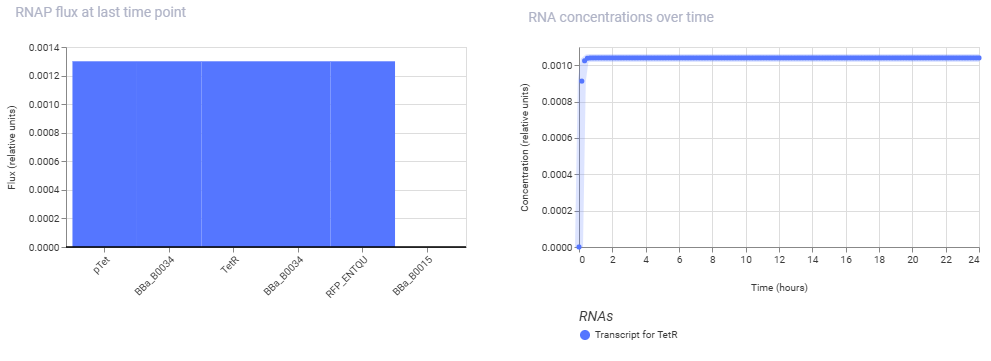
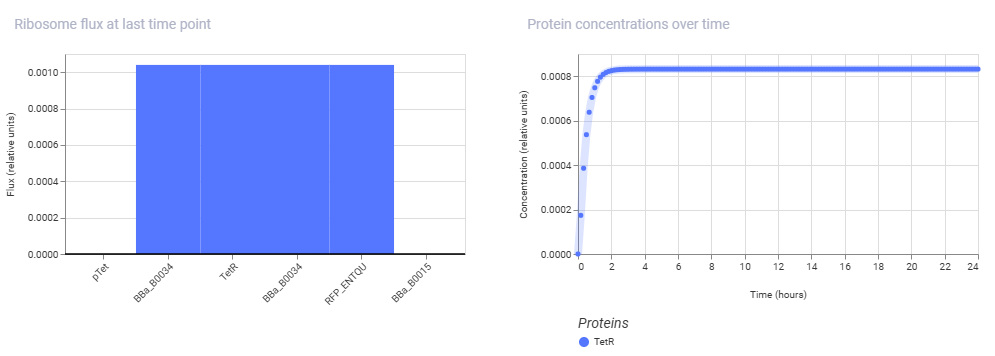
Conclusion: The second construct is successfully demonstrating the classic homeostatic behavior of a negative feedback loop. Instead of being high indefinitely or showing a long delay, the TetR protein concentration curve climbs sharply from hour 0 and abruptly locks into a flat, highly stable steady-state plateau by hour 2. This happens because the pTet promoter is completely open initially, but as TetR protein rapidly accumulates, it binds back to its own promoter’s operator sites to shut down its own transcription.
The simulator’s steady-state line shows the exact equilibrium point where the rate of new TetR production perfectly balances out the rate of protein decay or dilution, proving that the autorepressive circuit design is functioning correctly.
Construct 3: Single-Stage Genetic Cascade
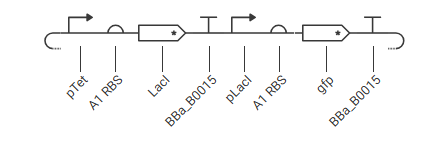
Cassette A: pTet, A1 RBS, LacI, BBa_B0015 Cassette B: pLacI, A1 RBS, gfp, BBa_B0015
Expected Function Simulation & Behavior:
- Baseline State (No Inducer):
- The ptet promoter is active, continuously producing LacI protein. This accumulated LacI binds to the plac promoter on Cassette B (starting from pLacI promoter), severely repressing the production of GFP. The system is in a GFP-Off state.
- Induced State (+aTc):
- Adding aTc to the simulation binds and inactivates the background TetR (releasing ptet into an even stronger “on” state, maintaining LacI). Alternatively, if we add an input that stops Cassette A, GFP flips.
- Turning GFP ON:
- We should introduce IPTG to inhibit the LacI currently on Cassette B. The LacI falls off plac promoter, and GFP expression is activated.
- Simulation Graph:
- By tracking LacI and GFP simultaneously in the Asimov Simulator, we will observe an inverse relationship. When LacI expression peaks, GFP will fall to baseline.
Simulation Output:
aTC was added as a ligand at the maximum concentration from hour 00.
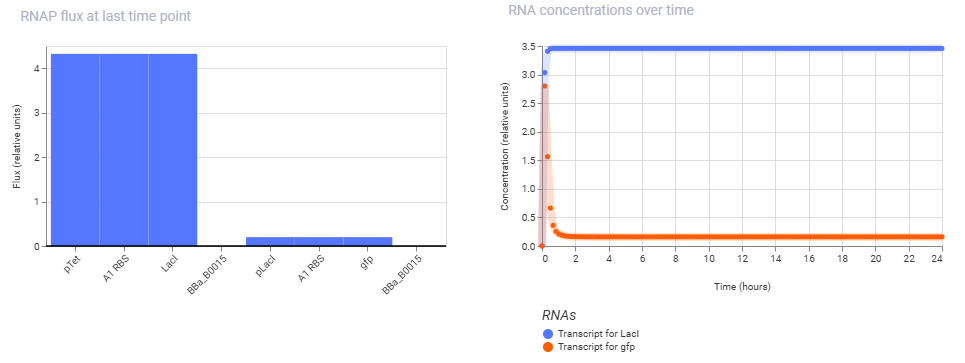
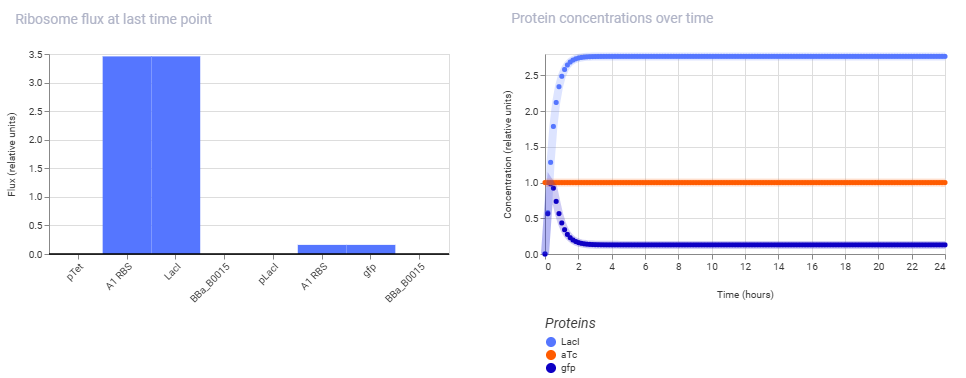
Conclusion:
By ensuring the upstream pTet promoter is fully active, LacI is produced rapidly from hour 0, climbing to a high steady state of ~2.7 relative units. As a direct consequence of this repressor accumulating in the cell, the downstream pLacI promoter is shut down, leading to a rapid decline in GFP expression within the first two hours, dropping from its initial peak to a near-zero baseline. Thus the simulation successfully captures a functional cascade where the high-expression state of the first cassette successfully forces the second cassette into a “OFF” state.
Thank you!