Week 10: Advanced Imaging and Measurement Technology
Final Project
For my final project, I will need to sequence the genetic circuit that I ultimately construct as well as the concentration of the IL-10, Decorin, and Bxb1 and PhiC31 integrase that is produced by the circuit.
- In order to sequence the genertic circuit, the most common method would be to use Sanger Sequencing, which utilizes electrophoresis after the synthesis in order to properly sort and sequence the circuit based on lengths and the base that terminated sequencing
- In order to measure the concentrations of the IL-10, Decorin, and Bxb1 and PhiC31 integrase produced by my genetic circuit, I can use Mass Spectroscopy. After harvesting the expression cells at the appropriate time points, I will use the spike-in standards strategy and then calculate the ratio of my endogenous peptide signal to the heavy standard signal, calculating the concentration based on the moles of the protein measured divided by the volume of my original sample.
Waters Pt. 1: Molecular Weight
For the following calculations, I will be using the provided eGFP sequence
Using an online calculator, it was found that the expected molecular weight of this sequence would be 28006.60 g/mol. In order to calculate the experimental molecular weight of eGFP using the figure below.
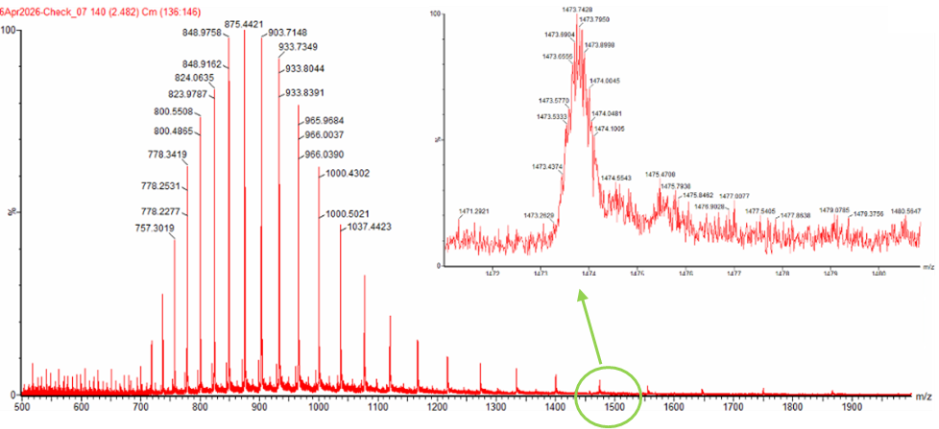
I’m going to start by selecting my n peak at the value 933.7349 and my n+1 peak at 903.7148. Using the formula provided, we get that:
$z=\frac{903.7148}{933.7349-903.7148}=30.10$
From this, we know that the charge of the first peak (n) is 30 and the charge for the second peak (n+1) is 31.
Using the first peak, we can calculate the molecular weight by rearranging the formula of calculate the mass to charge ratio to $MW=z*(\frac{m}{z_n})-z$
$MW=(30)*(933.7349)-30=28,081 Da$
We can also double check this number by using our n+1 peak and doing the same calculations.
$MW=(31)*(903.7148)-31=28,032 Da$
This gives us an accuracy of Percent error $=\frac{|28,032 Da-28,006 Da|}{28,006 Da}= 0.09%$
It is possible to estimate the charge state based on the zoomed in peaks by observing the spacing, since the spaces are $\Delta m/z=\frac{1}{z}$. Since the spacing between the peaks is roughly 0.05-0.07 m/z units, we find that $z=\frac{1}{\Delta m/z}=\frac{1}{0.05-0.07}=14-20$. This gives a rough approximation of the charge.
Waters Pt. 3: Peptide Mapping–Primary Structure
Firstm I analyzed the provided eGFP sequence for the lysine (K) and arginine (R) residues, highlighting and bolded them respectively.
MVSKGEELFTG VVPILVELDG DVNGHKFSVS GEGEGDATYG KLTLKFICTT GKLPVPWPTL VTTLTYGVQC FSRYPDHMKQ HDFFKSAMPE GYVQERTIFF KDDGNYKTRA EVKFEGDTLV NRIELKGIDF KEDGNILGHK LEYNYNSHNV YIMADKQKNG IKVNFKIRHN IEDGSVQLAD HYQQNTPIGD GPVLLPDNHY LSTQSALSKD PNEKRDHMVL LEFVTAAGIT LGMDELYKLE HHHHHH
After counting, this gives 19 lysine and 6 arginine residues, so 25 total cleavage sites. Using trypsin, the cleavage results in 19 peptides.
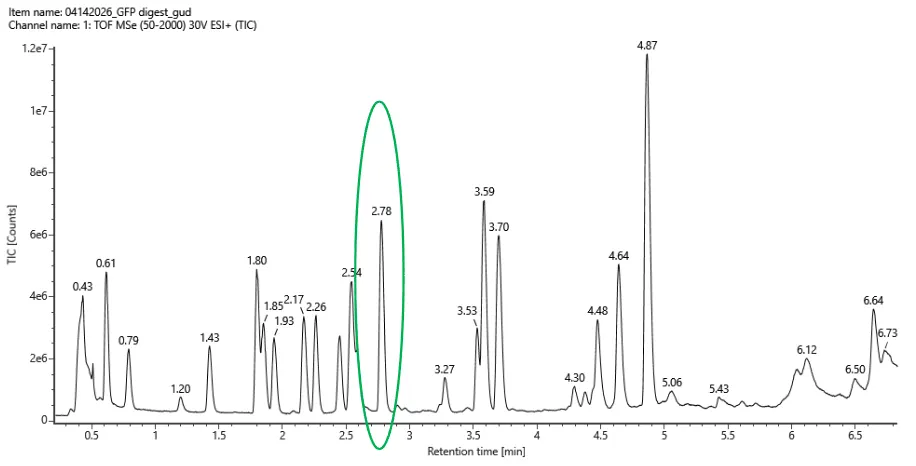
Based on the Peptide Map data, the talest peak is at 4.87 minutes, with 1.2x10⁷ counts, so the 10% cutoff would be at about 1.2x10⁶ counts. From this, there are 14 chromatographic peaks that are relevant. This does not match the number of predicted peptides, which was predicted to be 19, meaning there are fewer peptides present in the chromatogram.
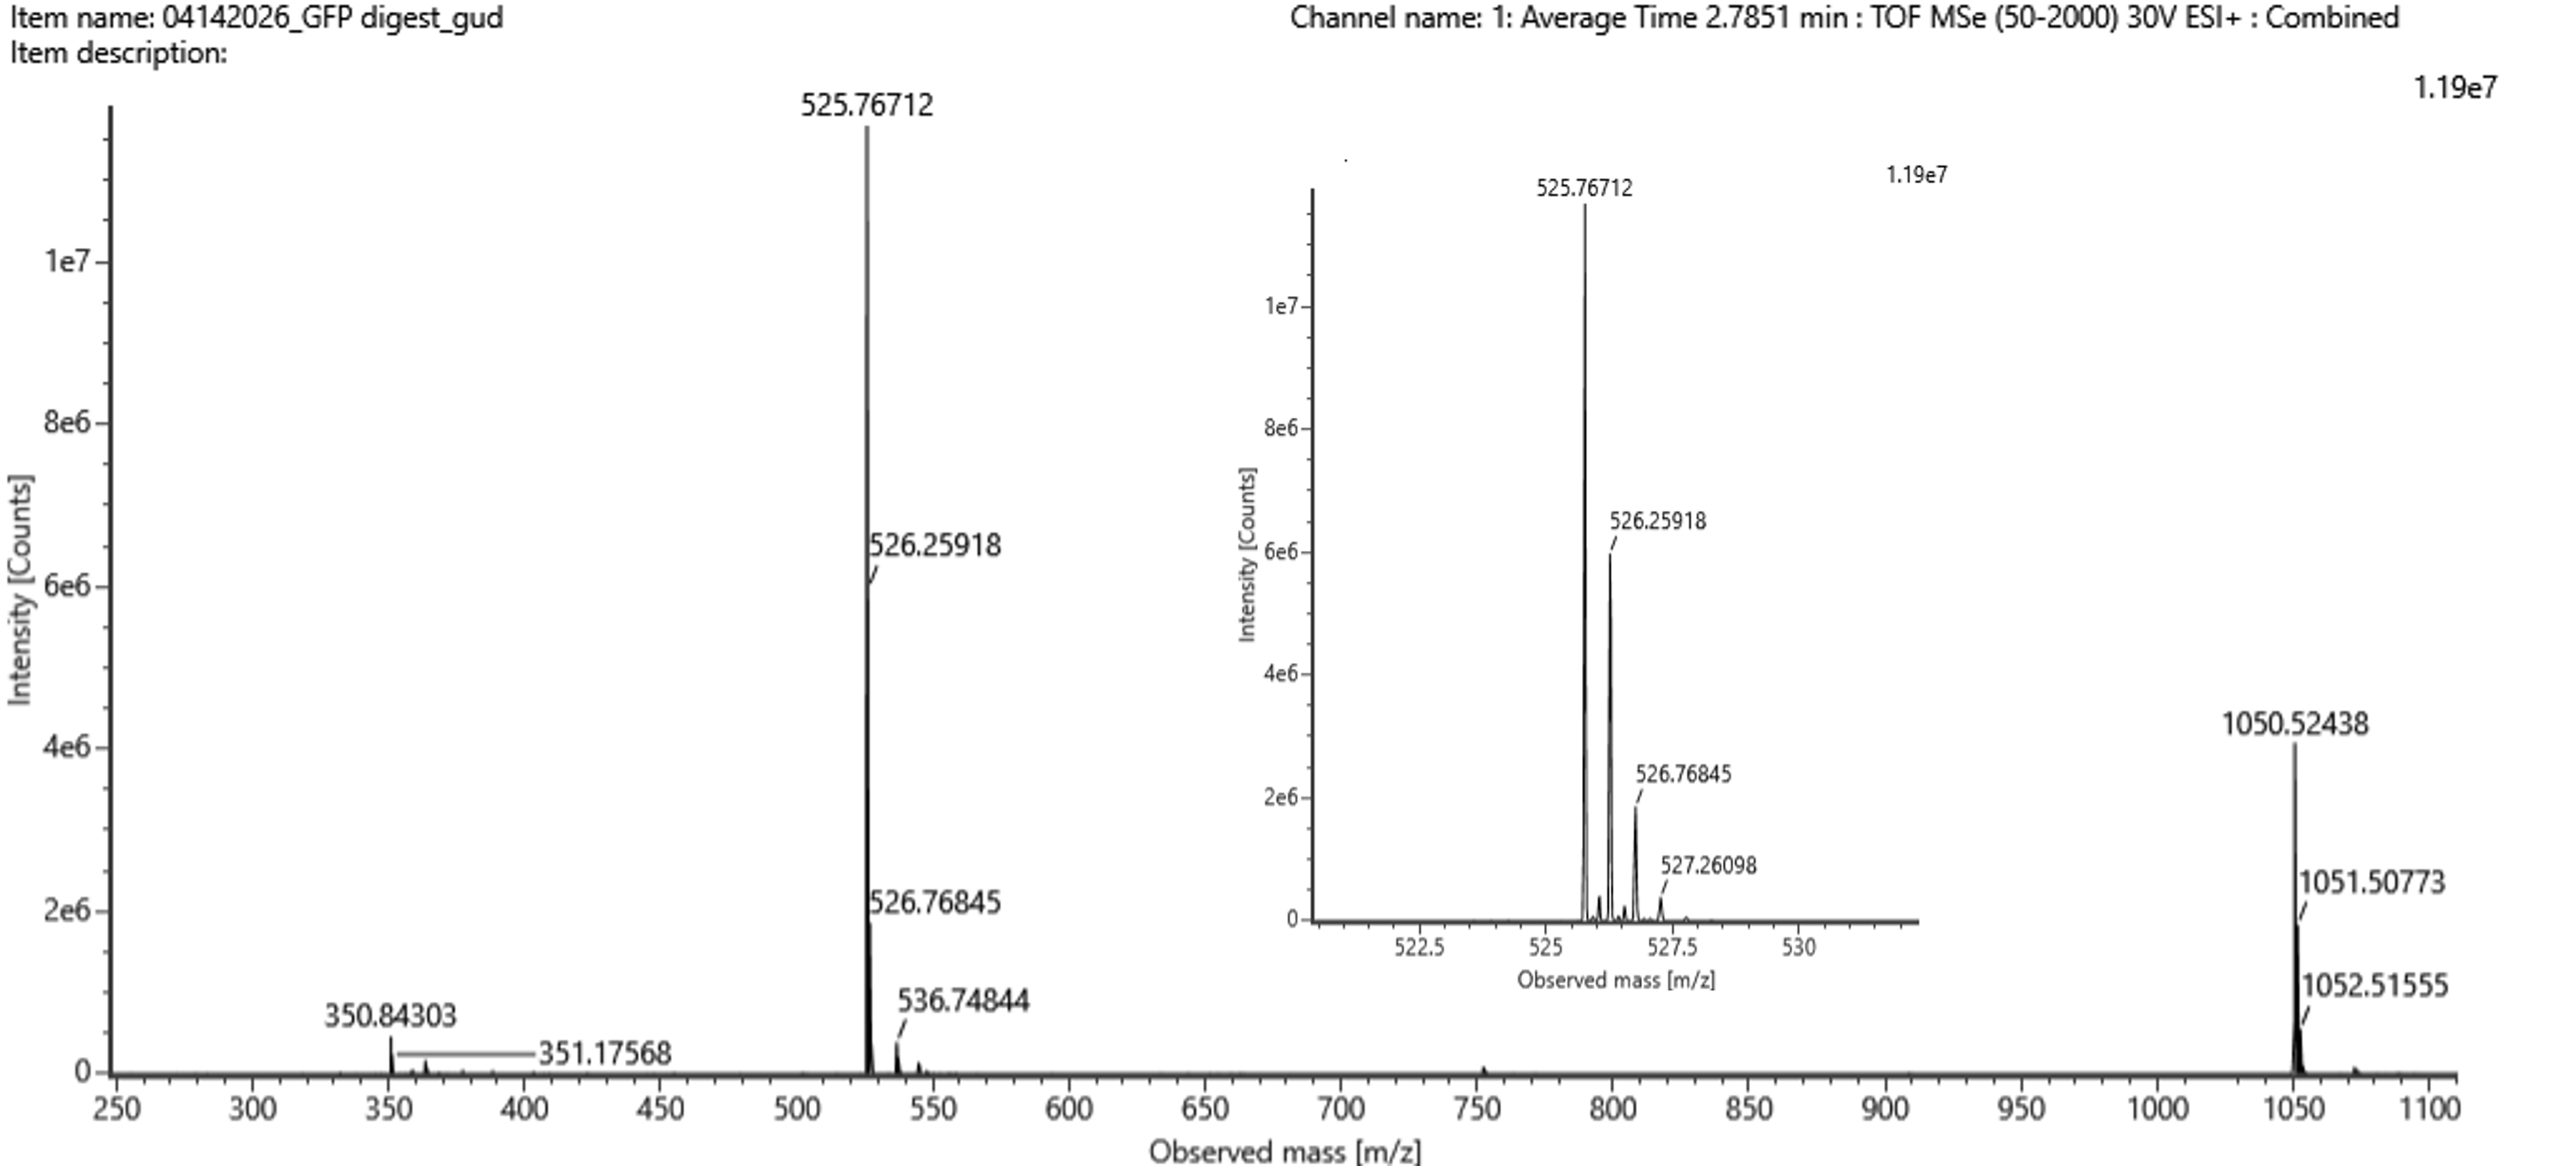
From this figure, the most abundant peak is at 525.767712. From this, M+1 would be 526.25918 and M+2 would be 526.76845, with the spacing of 0.4921 and 0.5093 accordingly, making the average spacing 0.50. This means, that $z=\frac{1}{\Delta m/z}=\frac{1}{0.50}=2$
To calculate the charged mass, we can use the equation $[M+H]^+=(m/zz)-(z-1)$, which comes out to be $[M+H]^+=(525.767122)-(1)=1050.527 Da$. Based on this mass, we can assume this peak is corresponding to the peptide FEGDTLVNR, which the tool estimated to be 1050.5214. Given, we find that percent error$=\frac{|1050.527 Da-1050.5214 Da|}{1050.527 Da}=0.0005%$.
The percentage of the sequence that is confirmed by the peptide mapping is 88%.
Waters Pt. 4: Oligomers
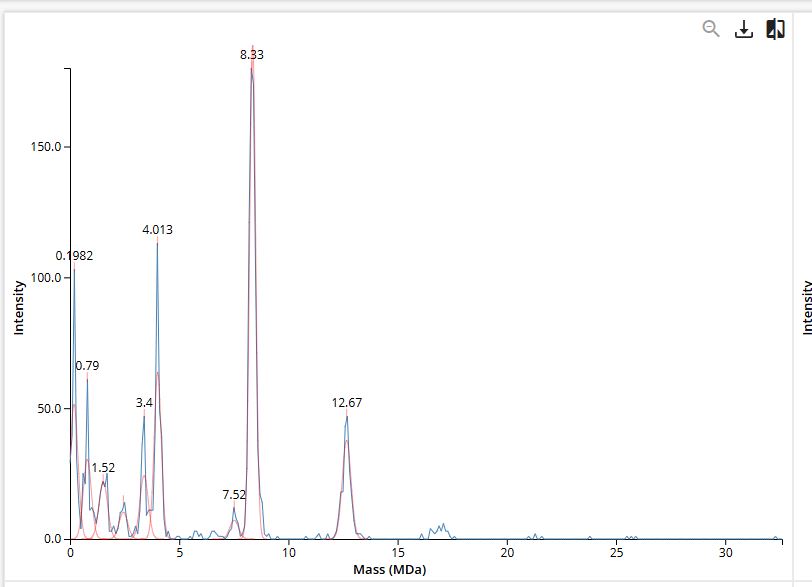
First, we need to calculate the expected masses of each oligometric species.
| Species | Subunits | Expected Mass |
|---|---|---|
| 7FU Decamer | 10 x 340 kDa | 3.40 MDa |
| 8FU-Didecamer | 20 x 400 kDa | 8.00 MDa |
| 8FU 3-Decamer | 30 x 400 kDa | 12.00 MDa |
| 8FU 4-Decamer | 40 x 400 kDa | 16.00 MDa |
Comparing this to the mass spectrum obtained, we find that all of the oligomers are present on the spectrum as a distinct peak except for the 8FU 4-Decamer and that the 8FU-Didecamer is the most abundant.
Waters Pt. 5: Did I make GFP?
Based on the images provided, I calculated that
| Theoretical | Observed/measured on the Intact LC-MS | PPM Mass error | |
|---|---|---|---|
| Molecular weight (kDa) | 28.006 kDa | 28.032 kDa | +9.4 ppm |