Week 06 HW: Genetic Circuits Part I
Part one 1: What are some components in the Phusion High-Fidelity PCR Master Mix, and what is their purpose? Phusion DNA Polymerase, Nucleotides, Optimised Phusion HF Reaction Buffer with MgCl2 - All at 2X concentration Generates long templates with high accuracy and speed, unattainable with a single enzyme, as per the Thermo Scientific protocol. It states that the error rate of Phusion DNA Polymerase is determined to be 4.4 × 10⁻⁷ in Phusion HF Buffer, which is approximately 50-fold lower than that of Thermus aquaticus DNA polymerase, and 6-fold lower than that of Pyrococcus furiosus DNA polymerase. Attached below are graphs that support these claims by comparing with traditional polymerase. The annealing temperature is at 60 degrees for all. https://documents.thermofisher.com/TFS-Assets/LSG/brochures/phusion-high-fidelity-dna-polymerases-flyer.pdf https://documents.thermofisher.com/TFS-Assets/LSG/manuals/MAN0012771_Phusion_HiFi_PCR_MasterMix_100rxn_UG.pdf
2: What are some factors that determine primer annealing temperature during PCR? Length and composition of primers determine annealing temperature. https://pmc.ncbi.nlm.nih.gov/articles/PMC332522/
3: There are two methods from this class that create linear fragments of DNA: PCR, and restriction enzyme digests. Compare and contrast these two methods, both in terms of protocol and in terms of when one may be preferable to the other. PCR is used for DNA synthesis and restriction digestion (RD) for fragmenting and recognising proteins/amplicons. Protocol Comparison : PCR requires thermal cycling to denature DNA, anneal primers, and extend new strands RD’s protocol involves incubating the DNA with the specific enzyme at its optimal temperature for a set time (30-60 minutes).
4: How can you ensure that the DNA sequences that you have digested and PCR-ed will be appropriate for Gibson cloning? 1; Ensure that your DNA construct has orientation from 5’ to 3’ covering target region with around 15bp complementary overlap ends. 2; Digest parental template to decrease noise and measure DNA size & concentration via electrophoresis and nanodrop. This will help to get good amount of DNA concentration for vector. Refer established protocols to confirm.
5: How does the plasmid DNA enter the E. coli cells during transformation? Whe electrical current/pulses are applied there is pore formation in e.coli. this allows dna to enter via diffusion inside e.coli cells. The pores in cell membrane are temporary and close during recovery in warm media.
Part 2: Assignment:DNA assembly on Asimov Kernel Link : https://kernel.asimov.com/htgaa-2026/repositories/repository/5fa19bb5-9e6a-4bd1-a545-0a312898f1cc/folder/4aaa06dd-54b3-4d6f-a588-c11c452d0a97 1: Exploring the Bacterial Demos Repository
I explored the devices in the Bacterial Demos Repository to understand how genetic parts work together. I ran the Simulator on several example constructs using the instructions in the Info panel. Key observations:
- Constructs are built from modular parts: promoters, coding sequences (CDS), and terminators
- The simulator models protein expression over time based on transcription, translation, and degradation rates
- Changing simulator parameters (e.g. degradation rate, copy number) significantly affects the output curves
- The Repressilator construct in the Bacterial Demos repo showed clear oscillating protein expression across all three repressors, confirming the circuit produces the expected periodic behaviour
2: Recreating the Repressilator
The Repressilator is a synthetic genetic oscillator first described by Elowitz and Leibler (2000). It consists of three genes arranged in a mutually repressive loop.
Each protein represses the next promoter in the loop, creating a negative feedback cycle that produces oscillating protein expression.
Construct Diagram & Simulator results
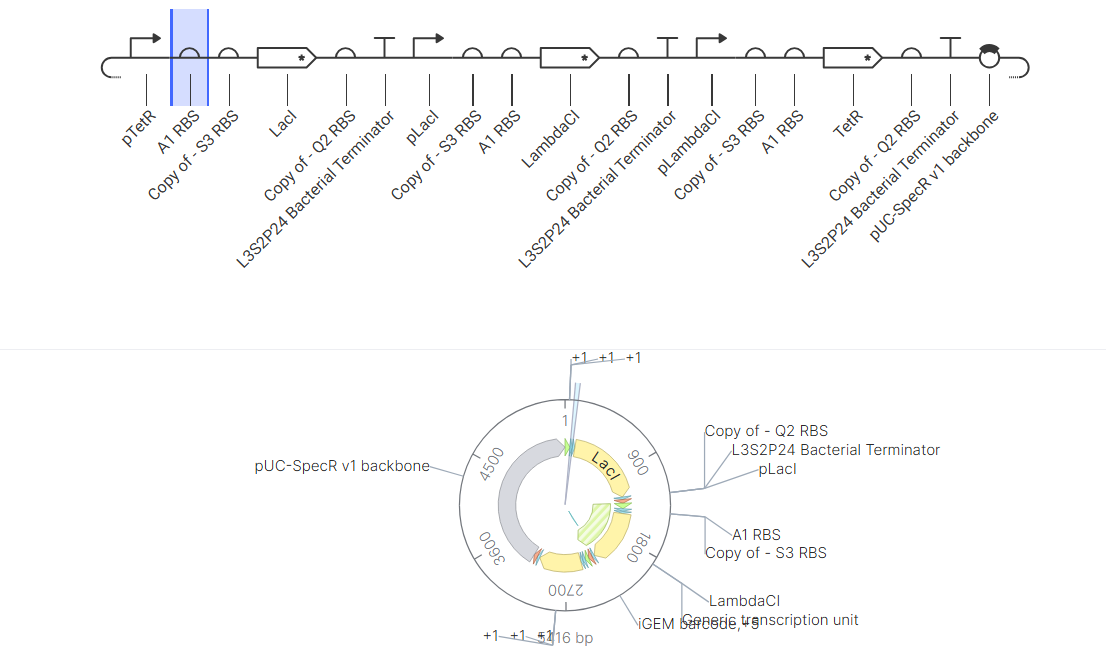
The ossiclation didn’t match as expected at first, I played around a bit and worked with typical bacterial promoters and repressors to change and get desired effect. As seen in the simulator results it worked .
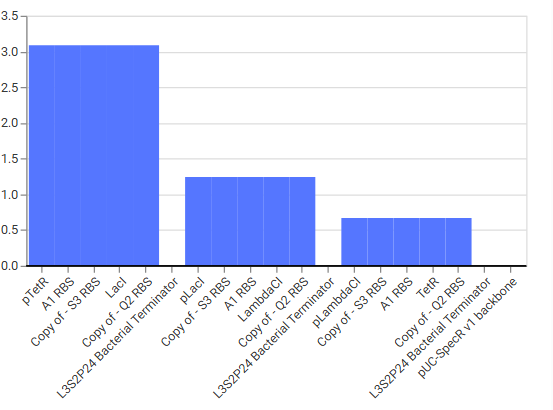
Construct 1: Simple Toggle Switch
Design Rationale This construct is a bistable toggle switch based on the Gardner et al. (2000) design. Two repressors (LacI and TetR) mutually repress each other:
- pLac drives tetR expression → TetR protein is produced
- pTet drives lacI expression → LacI protein is produced
- LacI represses pLac, TetR represses pTet
This creates two stable states:
- State A: LacI is high, TetR is low (LacI wins)
- State B: TetR is high, LacI is low (TetR wins) The system should remain locked in one state until an external signal (e.g. IPTG to inhibit LacI, or aTc to inhibit TetR) flips it to the other state.
Construct & Simulator Diagram
The simulator showed one protein dominating and the other being suppressed, confirming bistable behaviour.
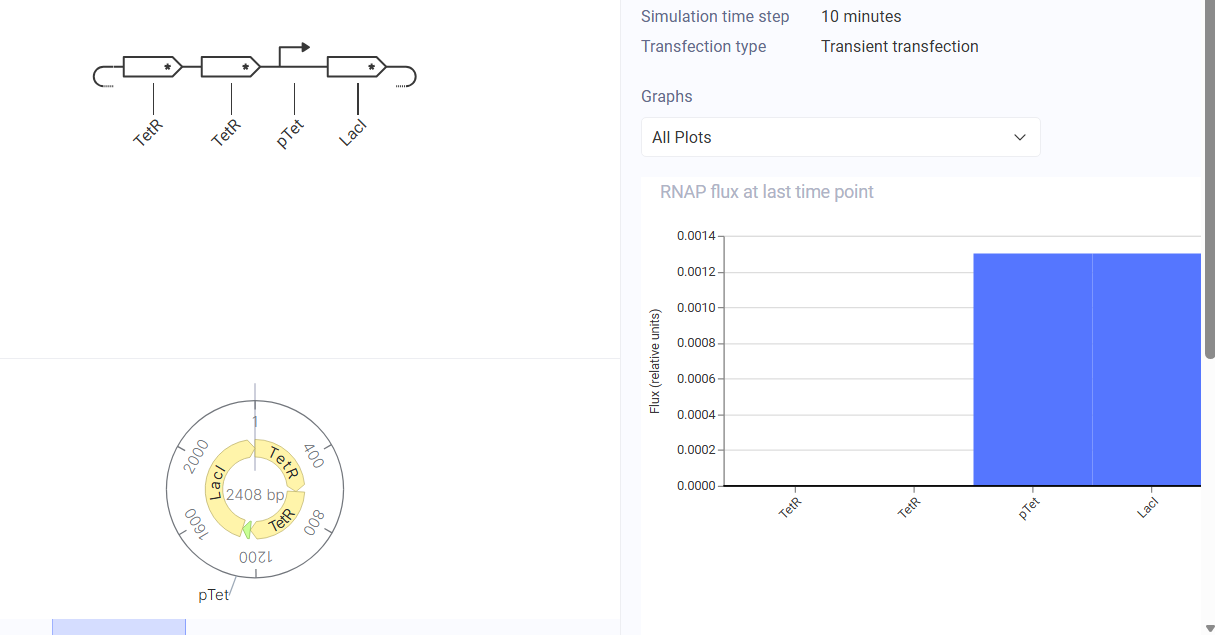
Construct 2: Negative Autoregulation
Design Rationale This construct tests simple negative autoregulation — one of the most common regulatory motifs found in natural genomes. The LacI protein represses its own promoter (pLac), creating a self-limiting feedback loop.
Negative autoregulation has two known biological benefits: 1 It speeds up the response time of gene expression compared to unregulated expression 2 It reduces noise and cell-to-cell variability in protein levels
Construct Diagram and Simulator Results
The simulator showed LacI expression rising then plateauing at a low level, consistent with negative autoregulation.
Construct 3: Constitutive GFP Reporter
Design Rationale This is the simplest possible construct is a constitutive promoter driving GFP expression with no regulatory feedback of any kind. There is no repressor or activator involved.
This construct serves as a baseline control to compare against the regulated constructs above. Without any feedback, GFP should accumulate at a rate determined purely by:
- Transcription rate (set by the promoter strength)
- Translation rate (set by the ribosome binding site)
- Protein degradation rate
Construct and Simulator Results
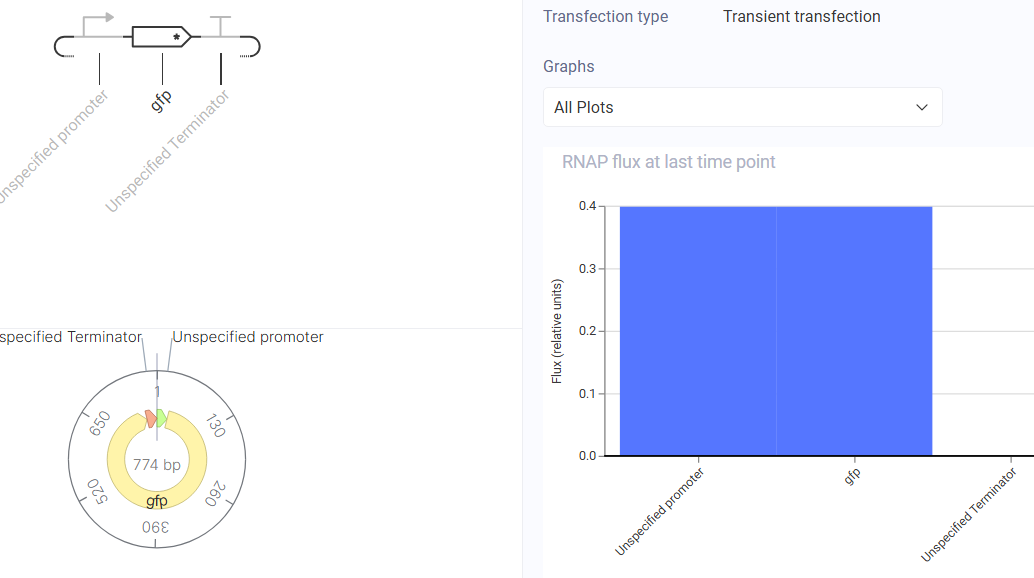
The simulator showed GFP expression rising and reaching a stable plateau as expected.
There was no oscillation, confirming this is a stable unregulated system. The plateau
level was higher than the self-regulated LacI in Construct 2, which makes sense
without negative feedback there is nothing to limit accumulation beyond the natural
degradation rate. This confirms that negative autoregulation (Construct 2) does
meaningfully reduce steady state protein levels.
References
- Elowitz, M.B. & Leibler, S. (2000). A synthetic oscillatory network of transcriptional regulators. Nature, 403, 335–338.
- Gardner, T.S., Cantor, C.R. & Collins, J.J. (2000). Construction of a genetic toggle switch in Escherichia coli. Nature, 403, 339–342.