Application Idea: The development of an engineered bacterial biosensor for real-time hydration detection as a preventive health measure in aging populations.
An engineered skin bacterium, applied as a lotion on the wrist or forearm, could detect body hydration levels and generate an electric current detectable by an electronic wearable component.
Why develop this application? Water is vital for health, and yet, neglecting hydration is common. The elderly are particularly vulnerable. Dehydration perturbs the gastrointestinal (GI) tract, leading to difficulty passing stool and overall adverse effects on GI health.
PART 1 Benchling & In-silico Gel Art Make a free account at benchlig.com Import the Lambda DNA Genome sequence of the lambda phage at the NCBI database.
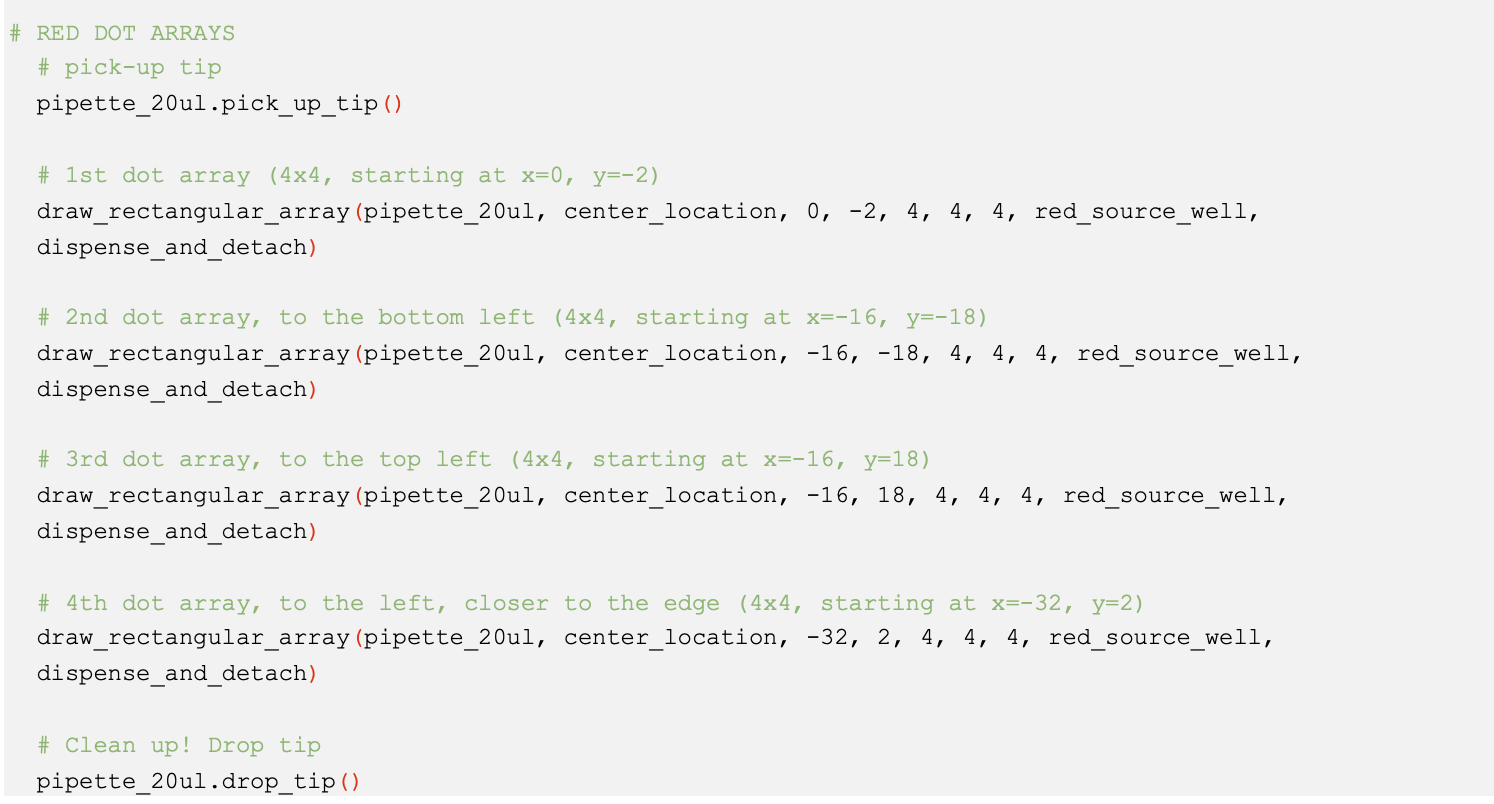
Create a Python file Generate an artistic design using the GUI at opentrons-art.rcdonovan.com Using the coordinates from the GUI, follow the instructions in the HTGAA26 Opentrons CoLab to write your own Python script that draws your design. To become familiar with the Python Opentrons API, I adopted a dot array script from the example scripts and reproduced it with changes to create different patterns of assorted dot arrays.
Part A. Conceptual Questions Answer any NINE of the following questions: 1. How many molecules of amino acids do you take with a piece of 500 grams of meat? (on average, an amino acid is ~100 Daltons)
Based on Gemini AI: 100 Dalton = 1.66054e-22 gram
Part A: SOD1 Binder Peptide Design Superoxide dismutase 1 (SOD1) is a cytosolic enzyme that converts superoxide radicals into hydrogen peroxide and oxygen. In its native state, it forms a stable homodimer and binds copper and zinc.
Mutations in SOD1 cause familial Amyotrophic Lateral Sclerosis (ALS). Among them, the A4V mutation (Ala to Val at residue 4) leads to one of the most aggressive forms of the disease. The mutation subtly destabilizes the N-terminus, perturbs folding energetics, and promotes toxic aggregation.
Assignment: DNA Assembly Answer the following questions about the protocol in:
What are some components in the Phusion High-Fidelity PCR Master Mix, and what is their purpose?
Below are the components found in the New England Biolab’s Phusion HF PCR Master Mix:
•Phusion DNA Polymerase: It performs 5’ → 3’ polymerase activity and 5’ → 3’exonuclease (proofreading) activity with greater fidelity, >50x better in comparison to regular Taq polymerase. Because it is a fusion polymerase with an Sso7d domain, it adds nucleotides more quickly, reducing the required extension time. Due to the exonuclease activity. Phusion polymerase produces blunt ends.
Assignment Part 1: Intracellular Artificial Neural Networks (IANNs) 1. What advantages do IANNs have over traditional genetic circuits, whose input/output behaviors are Boolean functions?
A Boolean function is based on a binary system where it can only assign two values, such as "true" or "false", or as in numeric values: "0" or "1". This is akin to digital systems. Complexities in the biological systems cannot be adequately represented by binary input/output. Because signals in biological systems, such as concentrations of regulatory proteins, vary in gradation. So, a Boolean genetic circuit would have limitations in interpreting the complexities of a biological system. IANNs are based on analog systems where weights are implemented. Examples of weights include variable concentrations of regulatory proteins, promoter strengths, and RBS efficiencies. These make positive or negative regulatory output. IANNs also integrate dose-response analysis, from inhibitory to non-inhibitory concentrations of a typical sigmoidal curve. IANNs consider biases such as taking into account whether promoters could be leaky. Advantageous parts are the ability to handle a great level of complexity due to the gradation that living systems have. 2. Describe a useful application for an IANN; include a detailed description of input/output behavior, as well as any limitations an IANN might face to achieve your goal.
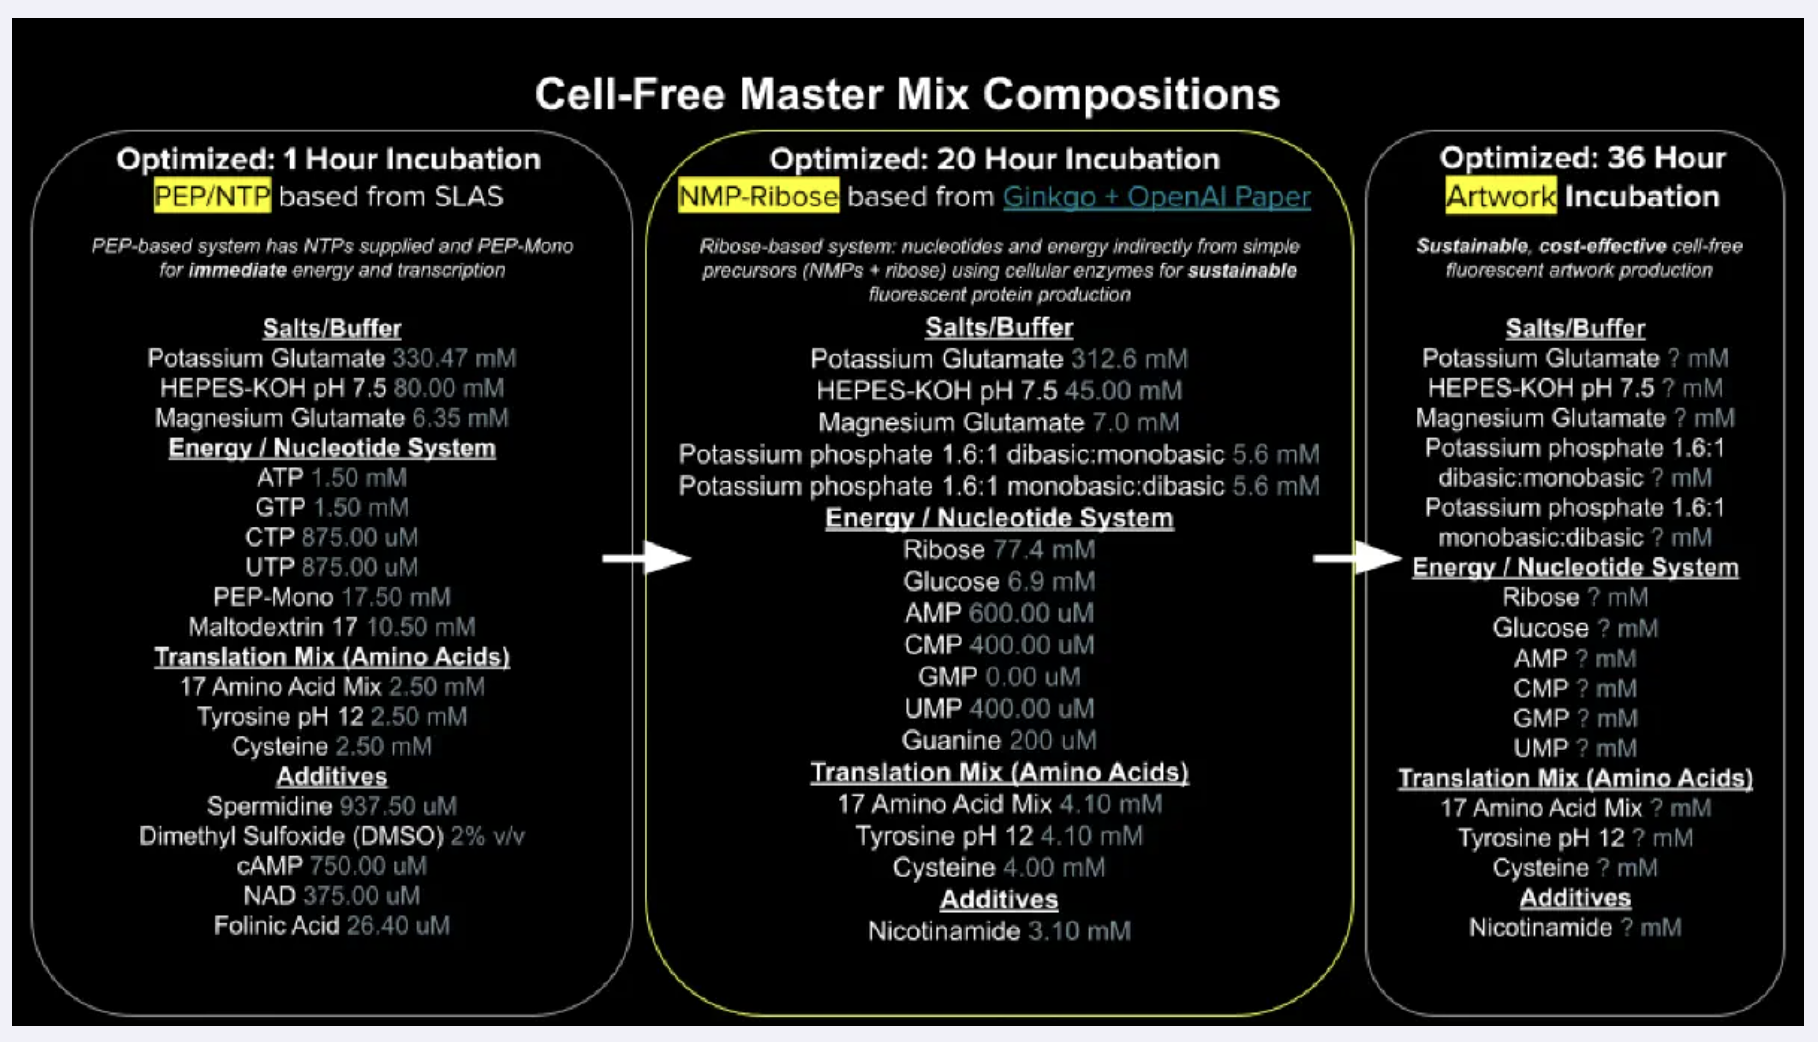
Homework Part A: General and Lecturer-Specific Questions General homework questions Explain the main advantages of cell-free protein synthesis over traditional in vivo methods, specifically in terms of flexibility and control over experimental variables. Name at least two cases where cell-free expression is more beneficial than cell production.
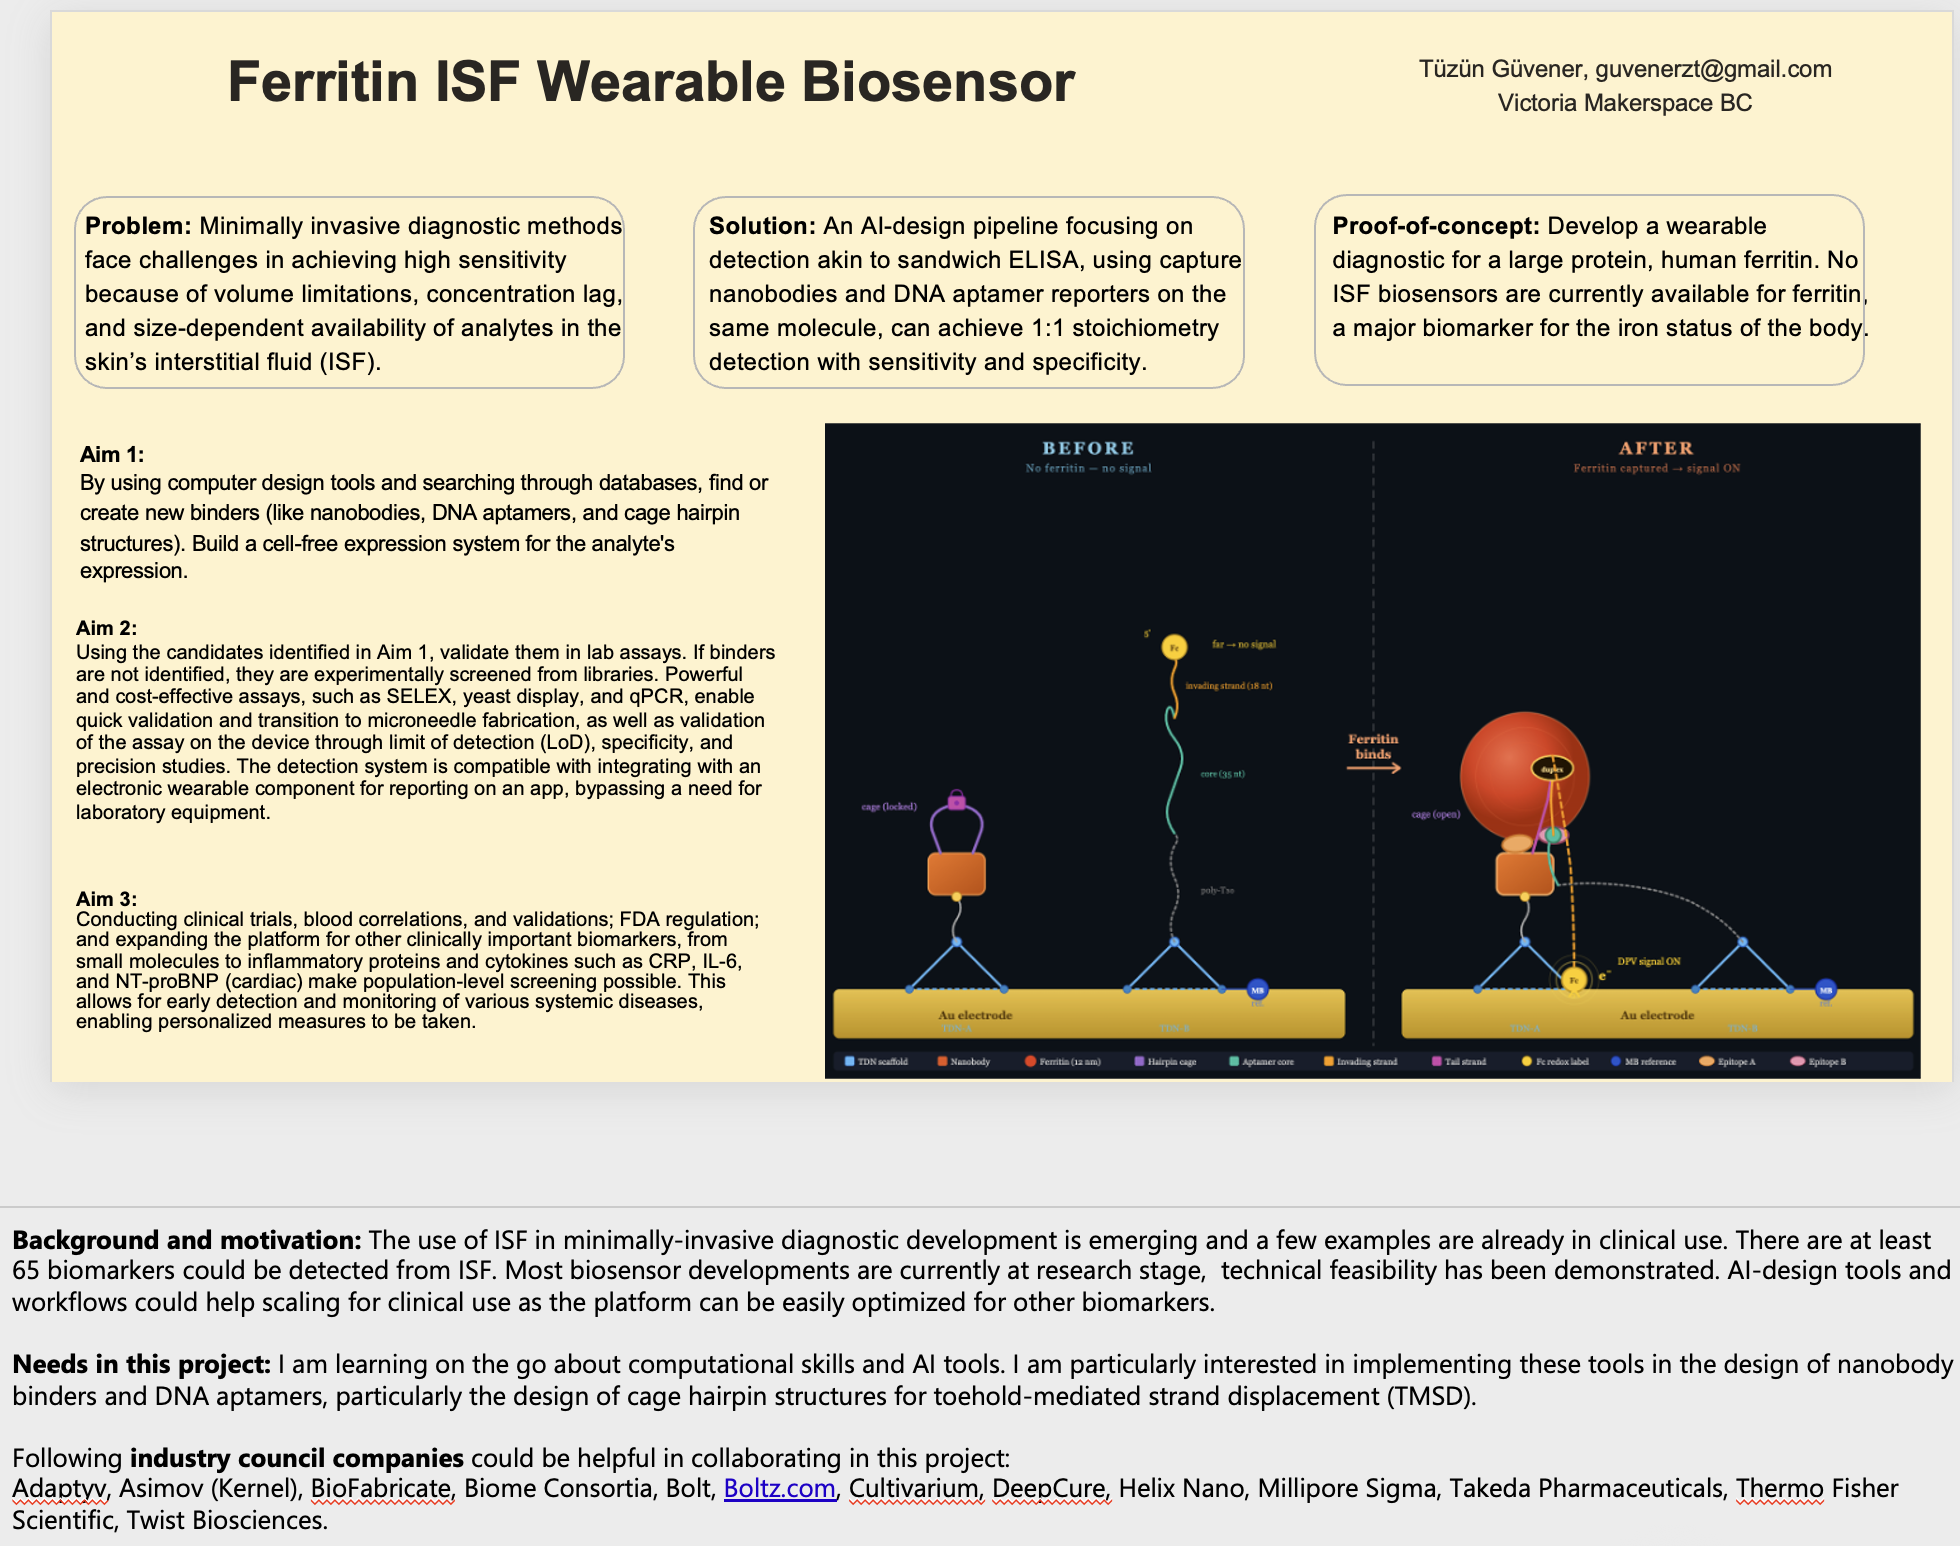
Homework: Final Project Please identify at least one (ideally many) aspect(s) of your project that you will measure. It could be the mass or sequence of a protein, the presence, absence, or quantity of a biomarker, etc. My final project focuses on the development of a biosensor based on a capture nanobody and reporter DNA aptamer, enabling the detection of a protein biomarker for the body’s iron status.
Part A: The 1,536 Pixel Artwork Canvas | Collective Artwork Contribute at least one pixel to this global artwork experiment before the editing ends on Sunday 4/19 at 11:59 PM EST. A personalized URL was sent to the email address associated with your Discourse account, and you can discuss the artwork on the Discourse.
If you did not have a chance to contribute, it’s okay, just make sure you become a TA this fall! 😉
Subsections of Homework
Week 1 HW: Principles and Practices
Application Idea:
The development of an engineered bacterial biosensor for real-time hydration detection as a preventive health measure in aging populations.
An engineered skin bacterium, applied as a lotion on the wrist or forearm, could detect body hydration levels and generate an electric current detectable by an electronic wearable component.
Why develop this application?
Water is vital for health, and yet, neglecting hydration is common. The elderly are particularly vulnerable. Dehydration perturbs the gastrointestinal (GI) tract, leading to difficulty passing stool and overall adverse effects on GI health.
The idea for this project was inspired by a non-invasive detection method that works via contact with skin that can be sampled for several parameters, not exclusively for hydration. Others, such as amino acids for nutritional status and glucose for insulin levels, can be measured and are directly read out from the body’s blood.
The skin readout for the body’s hydration status, as well as mental activity, has recently been developed by the University of California, Berkeley researchers (Kim et al. 2025). The method is based on a microfluidic sensor device that uses the skin’s electrical property, the electrodermal activity.
The proposed project uses the synthetic biology approach, a biosensor that can report the body’s hydration status in real-time. Technologies for building such a biosensor are out there, such as the utility of the osmolarity-responsive operon (Rashid et al. 2023) and the electric current generator, which is a synthetic electron transport chain (Atkinson et al. 2022), but engineered skin bacteria as biosensors have not been made specifically for health preventive measures. This project is aimed at testing the bacterial commensal organisms as biosensors working via the skin.
References, Click to Expand
Kim, S-R., Y. Zhan, N. Davis, S. Bellamkonda, L. Gillan, E. Hakola, J. Hiltunen, and A. Javey. 2025. Nature Electronics.
Rashid, F-Z. M., F. G. E. Cremazy, A. Hofmann, D. Forrest, D. C. Grainger, D. W. Heermann, and R. T. Dame. 2023. Nature Communications.
Atkinson, J. T., L. Su, X. Zhang, G. N. Bennett, J. J. Silberg, and C. M. Ajo-Franklin. 2022. Real-time bioelectronic sensing of environmental contaminants. Nature.
Major governance policies
Establishing genome repositories for synthetic microbiome species
Ensuring do not release through biocontainment strategies
Adopting validation studies as an alternative to animal testing
Comply with regulatory on human subjects’ clinical trials
Documenting product safety through environmental toxicology studies
Implementing incentives and educational workshops
Establishing genome sequence repositories for synthetic microbiome species
Bacterial species used in this project, isolated and sequenced from the skin microbiome, should be recorded according to the general rules that apply to biological agents. Any variations made into the organism through recombinant DNA techniques, including the introduction of DNA from other sources, should be recorded to comply with biosecurity rules.
Ensuring that we do not release through biocontainment strategies
Genetically modified organisms should not be released to the environment. Biocontainment strategies should be in place to ensure that the genetically engineered organism, for therapeutic interventions, cannot survive in the environment. One way to do this is through codon engineering, specifically for a non-canonical amino acid, which would create a dependency for the unnatural amino acid, which is lacking in the environment.
Subgoal: Non-canonical amino acids are expensive. Biomanufacturing cost will increase due to the need for that substrate. One way to reduce the cost is to have on-site manufacturing of non-canonical amino acids from precursors. Because precursors can be toxic, the manufacturing of chemicals needs to comply with local regulatory rules, such as building and equipment and engineering requirements.
Adopting validation studies as an alternative to animal testing
As an alternative to animal testing, validation studies should be based on artificial organoid-based systems. This ensures cruelty-free ethical conduct. Artificial skin models are already being developed and are available for monitoring the interstitial fluid compartment. Artificial 3D-printed skin models with built-in complexities, such as immune cells, could provide a setup for an initial understanding of the performance of the biosensor.
Comply with regulatory on volunteering human subjects’ clinical trials
Live organisms cannot be tested on humans without following laws, regulations, and guidelines applicable at the national and international levels. To demonstrate the clinical efficacy of the live organism, proper documentation and requesting permission should be established for the approval process.
Implementing incentives and educational workshops
General public acceptance of genetically modified organisms (GMOs) applied to the skin may be received with resistance. Educational workshops and materials should be available to the general public, as they introduce commensal microorganisms on skin and their genetic manipulation for biocontainment. A way to encourage participation is to implement an incentive system, such as a subscription with health insurance that includes paid benefits.
Does the option:
Genome seq repositories
Biocontainmnet & Manufacturing
Comply with regulatory
Product safety documentation
Incentives & Education
Enhance Biosecurity
• By preventing incidents
1
1
n/a
n/a
n/a
• By helping respond
1
1
n/a
n/a
n/a
Foster Lab Safety
• By preventing incident
1
2
n/a
n/a
n/a
• By helping respond
1
1
n/a
n/a
n/a
Protect the environment
• By preventing incidents
1
1
n/a
1
n/a
• By helping respond
2
1
n/a
1
n/a
Other considerations
• Minimizing costs and burdens to stakeholders
3
1
1
1
2
• Feasibility?
1
2
1
1
2
• Not impede research
1
2
2
2
2
• Promote constructive applications
3
1
1
1
1
Based on the above, I’d prioritize establishing regulatory policies regarding:
Generating genome sequence repositories,
Ensuring that they do not release through biocontainment applications,
Documenting product safety through environmental toxicology studies
Although it is not a priority, general public education on the use of engineered organisms is important because it would create buy-in for health preventive products.
Assignment Week 2 Lecture Prep
Homework questions from Professor Jacobson:
Nature’s machinery for copying DNA is called polymerase. What is the error rate of polymerase? How does this compare to the length of the human genome? How does biology deal with that discrepancy?
Depending on the polymerase, the error rate ranges from 10⁻⁶ to 10⁻⁴.
The human genome length is 3.2 x 10^9 bp.
We could expect at least 3.2 × 10^3 errors occurring per replication.
There are multiple mechanisms employed to deal with this discrepancy:
base selection
proofreading
mismatch repair
Mutation rates are lowest when these 3 mechanisms are working together. It is reported that the mutation rate per base pair in prokaryotes is 2.6 x 10⁻¹⁰ and in eukaryotes is 3.3 x 10⁻¹⁰. (Schaaper, 1993 and Lynch 2010)
The initial base selection ensures incorporation of the correct nucleotide 200,000 to 2000,000 times more likely.
Having a proofreading activity, the polymerase can detect errors and uses exonuclease activity to remove incorrect nucleotides, improving fidelity by 40 to 200-fold.
The mismatch repair system detects mismatches that escaped proofreading and catalyzes excision and synthesis, improving fidelity by 20 to 400-fold. (Manhart and Alani 2017)
How many different ways are there to code DNA (DNA nucleotide code) for an average human protein? In practice, what are some of the reasons that all of these different codons don’t work to code for the protein of interest?
There are 64 codon combinations to code for all 20 amino acids. Most amino acids have more than 1 code, except methionine and tryptophan. Leucine, serine, and arginine have 6 different codons each.
An average human protein of about 469 amino acids can be coded by many combinations of DNA sequences that are too many to count.
But not all coding would work. Some of the reasons are the following:
Synonymous codons are not interchangeable. They won’t work because of codon bias, which is organism-specific. Synonymous codons’ corresponding tRNAs might be less abundant in a given organism. In this situation, with limited tRNA pol, rare codons cause slow translation speed and efficiency, and protein folding efficiency would also be slow. mRNA instability can occur and can be caused by secondary structures, which also contributes to why not all codons work. Finally, the splicing process could be affected by the synonymous codons, either silencing it or enhancing it.
References, Click to Expand
Schaaper, R. M. 1993. Base selection, proofreading, and mismatch repair during DNA replication in Escherichia coli. The Journal of Biological Chemistry.
Manhart, C. M, and E. Alani. 2017. DNA replication and mismatch repair safeguard against metabolic imbalances. Genetics
I’ve used lecture slides and Claude’s research.
1. Can you research the error rate of DNA polymerase? What are the biological mechanisms that overcome the high rate of errors?
2. Can you research how many different ways there are to code (DNA nucleotide code) for an average human protein? What are the reasons that all of these different codes don’t work to code for the protein of interest?
Homework questions from Dr. LeProust:
What is the most commonly used method for oligo synthesis currently?
The most commonly used method for oligo synthesis currently is the phosphoramidite method developed in the 1980s.
Why is it difficult to make oligos longer than 200 nt via direct synthesis?
It is difficult to make oligos longer than 200 nt via direct synthesis because of the accumulation of errors, leading to a greater percentage of the product being truncated.
Why can’t you make a 2000 bp gene via direct oligo synthesis?
A 2000 bp gene cannot be made via direct oligo synthesis due to the accumulation of errors. A direct synthesis is limited to 200 nt. A 2000 bp gene can be made through the enzymatic assembly of shorter pieces by PCR.
I’ve used lecture slides and Claude’s research.
What is the most commonly used method for oligo synthesis? Why is it difficult to make oligos longer than 200 nt via direct synthesis?
Homework questions from Professor George Church:
Choose ONE of the following three questions to answer; and please cite AI prompts or paper citations used, if any.
[Using Google & Prof. Church’s slide #4], What are the 1 essential amino acids in all animals and how does this affect your view of the “Lysine Contingency”?
[Given slides #2 & 4 (AA:NA and NA:NA)] What code would you suggest for AA:AA interactions?
[(Advanced students)] Given the one paragraph abstracts for these real 2026 grant programs sketch a response to one of them or devise one of your own:
What are the 10 essential amino acids in all animals, and how does this affect your view of the “Lysine Contingency”?
Ten essential amino acids in all animals are His, Ile, Leu, Lys, Met, Phe, Thr, Trp, Val, and Arg.
Protein synthesis by the animal is more sensitive to lysine deficiency because animal proteins are rich in lysine and require continuous supplementation. A slight decrease in lysine intake can influence the rate of protein synthesis (Ball et al 2007). Studies have shown that not all sources of proteins are rich in lysine; proteins, particularly those in plants and grains, are low in lysine (Mathews 2020).
Additionally, findings from a study by Hussain et al. in 2004 in rural Pakistan support this view: the importance of lysine supplementation in the human diet. The authors collected data on developmental attributes in children in a village whose primary diet is heavily based on wheat flour. They found that children in the treatment group who received wheat flour fortified with lysine attained much higher weight and height, while the children in the control group remained modest (Hussain et al. 2004).
References, Click to Expand
Ball, R. O., K. L. Urschel, and P. B. Pencharz. 2007. Nutritional consequences of interspecies differences in arginine and lysine metabolism. The Journal of Nutrition.
Hussain, T., S. A. Mushtaq, A. Khan, and N. S. Scrimshaw. 2004. Lysine fortification of wheat flour improves selected indices of the nutritional status of predominantly cereal-eating families in Pakistan. *Food and Nutrition Bulletin, The United Nations University.
I’ve used lecture slides and researched ChatGPT, Claude, and Google Scholar.
Prompts:
1. “What are the essential amino acids in all animals?”
2. “Can you research the paper titled “Review of Lysine Metabolism with a Focus on Humans” by Matthews Dwight? What are the other related studies on the subject of lysine as an essential amino acid that is special in comparison to other essential amino acids in the animal diet? What is the final verdict about lysine? Why is it different than other essential amino acids?”
3. “Can you research the following paper and similar ones? Nutritional Consequences of Interspecies Differences in Arginine and Lysine Metabolism by Ball et al. 2007.
Week 2 HW: DNA, Read, Write and Edit
PART 1
Benchling & In-silico Gel Art
Make a free account at benchlig.com
Import the Lambda DNA
Genome sequence of the lambda phage at the NCBI database.
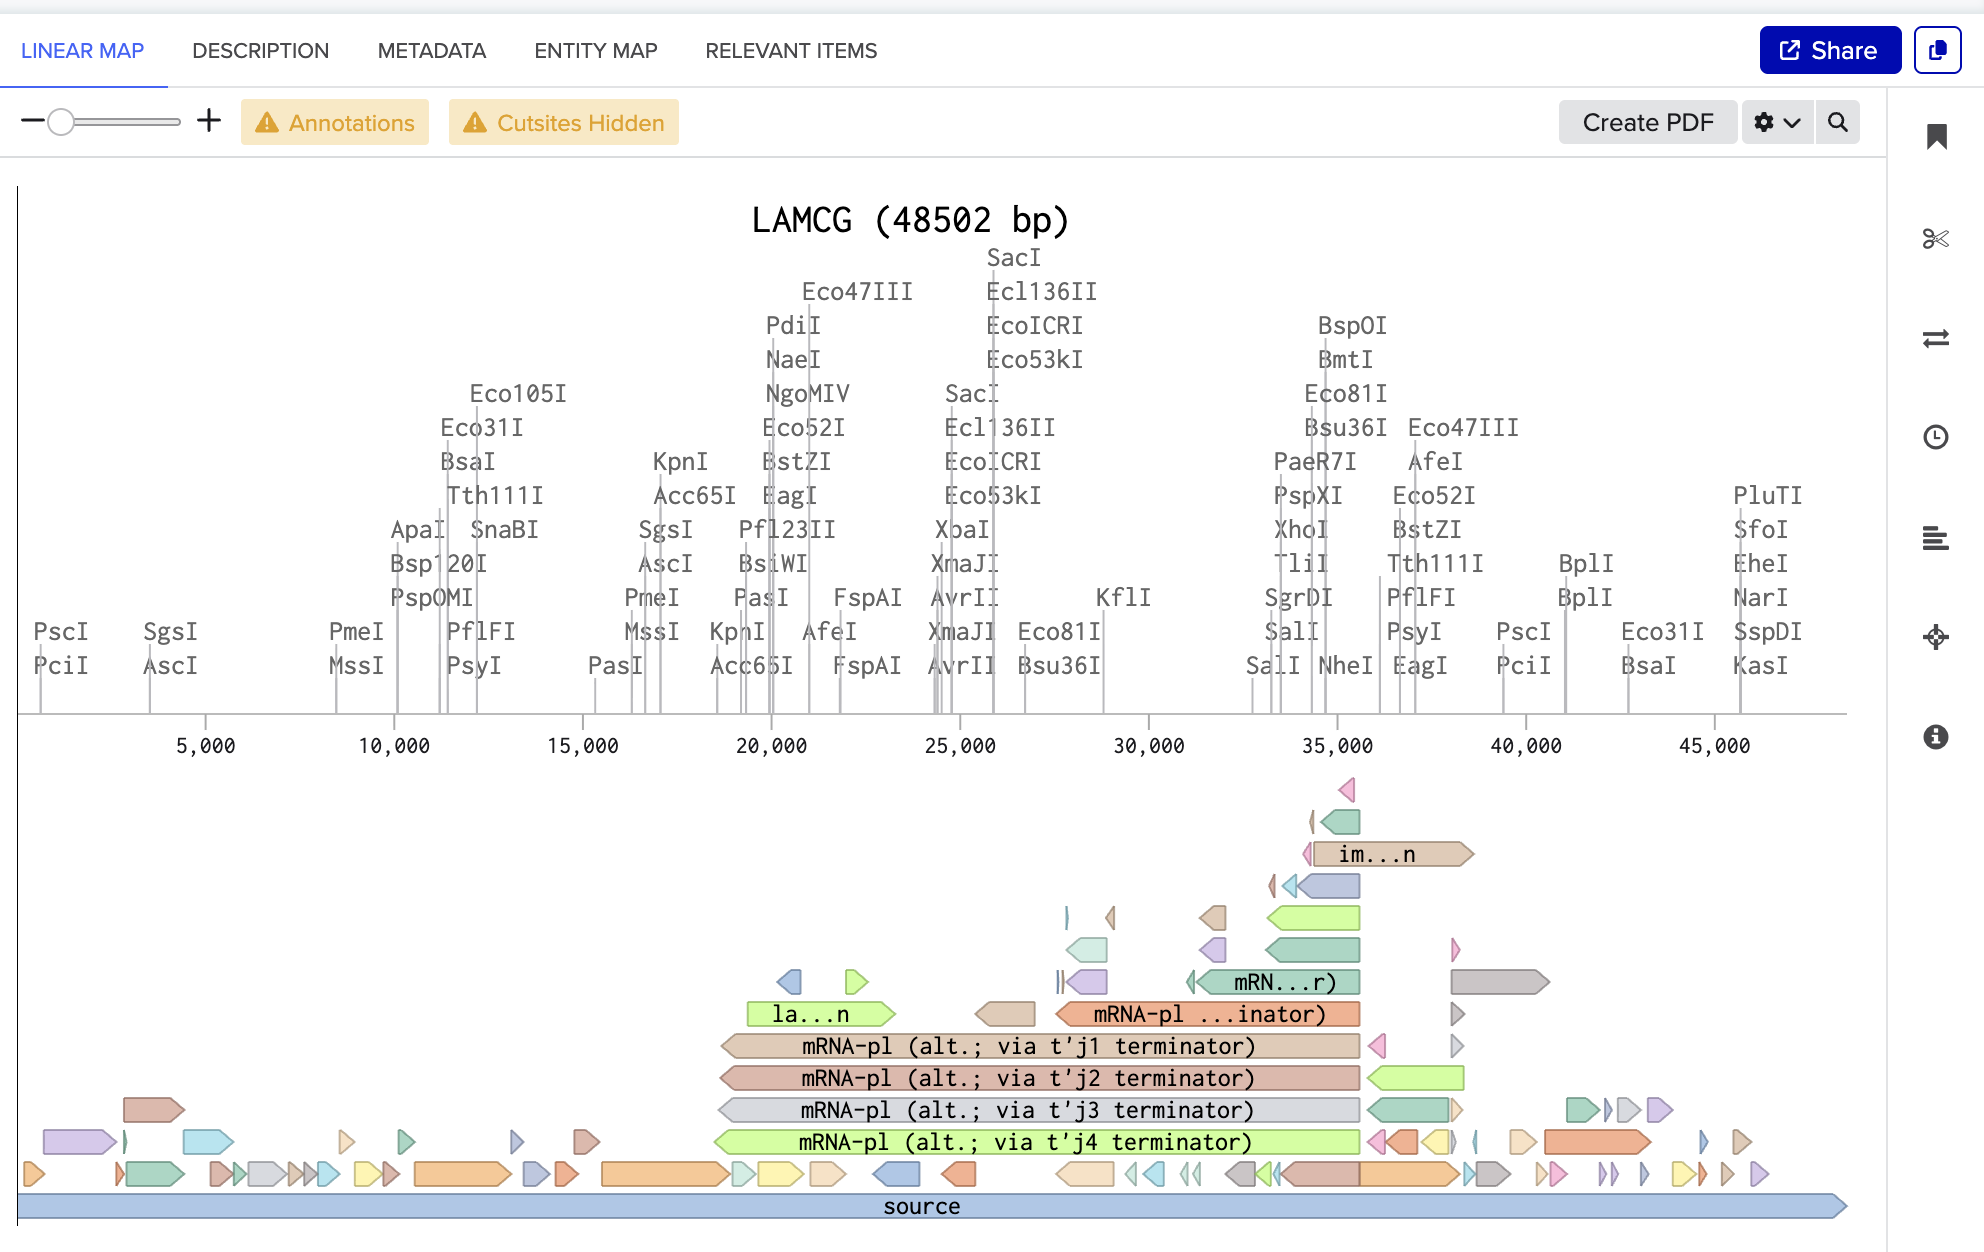
The screenshot below is the linear map of lambda DNA (LAMCG) from Benchling, displaying all enzymes with their cut sites on the DNA.
I have used the accession number to import the DNA.
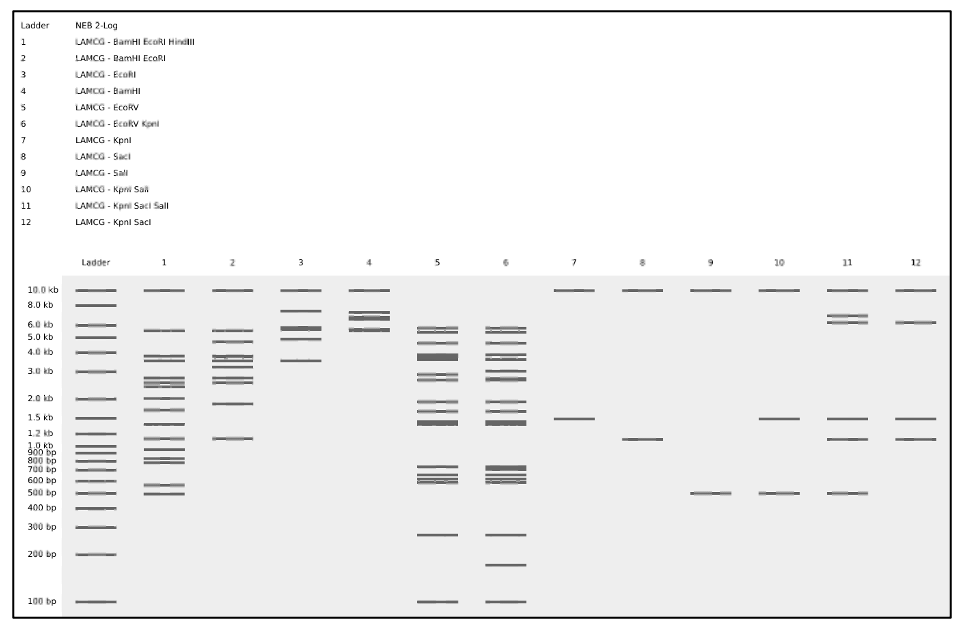
Simulate Restriction Enzyme Digestion with the following enzymes:
EcoRI, HindIII, BamHI, KpnI, EcoRV, SacI, SalI
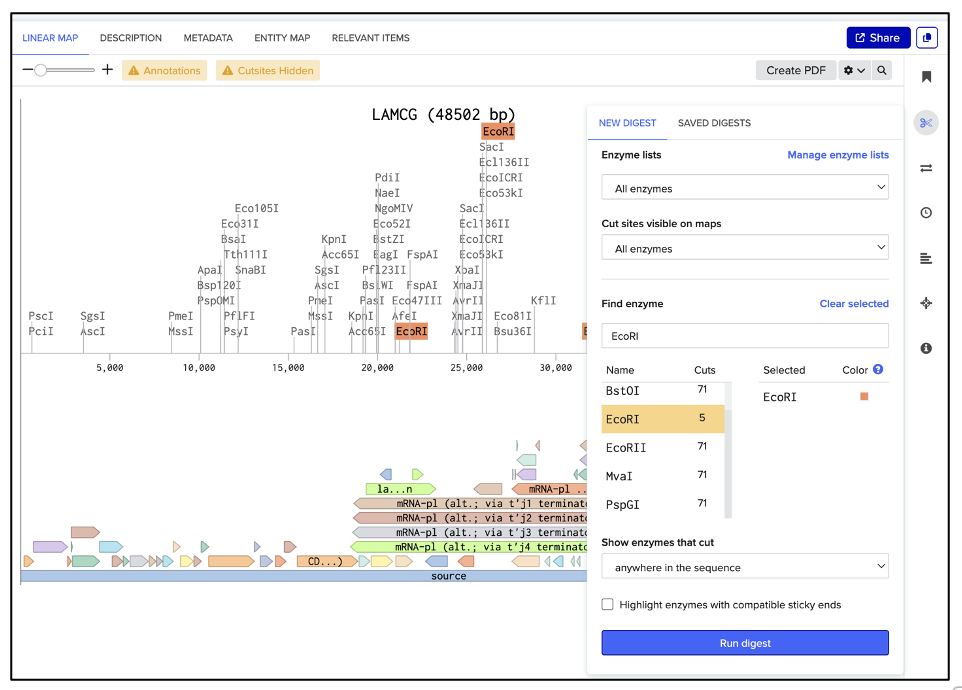
I followed the steps below to simulate restriction enzyme digestion in Benchling:
On the LINEAR MAP tab, as shown in figure (A): Click the “scissor” icon shown on the left. This opens up the NEW DIGEST and the SAVED DIGEST tabs. Go to the NEW DIGEST tab, type the enzyme name in the “Find enzyme” search bar, highlight the desired enzyme, and hit “Run digest”.
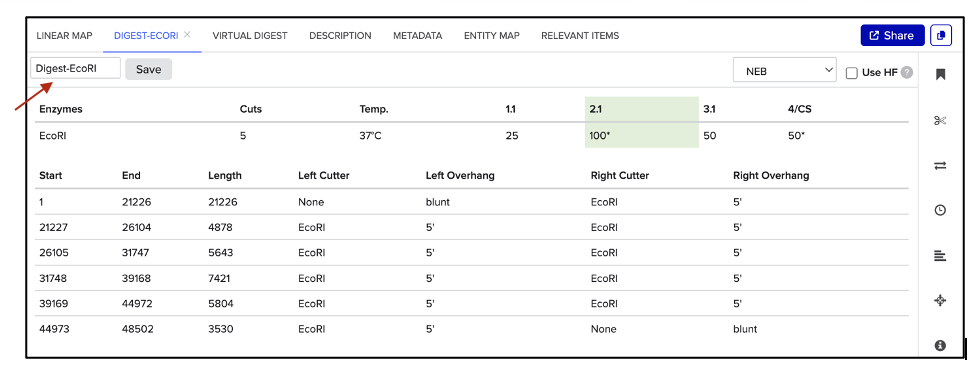
To save the simulated enzyme digestions:
As shown in figure (B), a new window appears, which allows naming the digest in the text box pointed to by the red arrow. Hit “Save”, and repeat the process for each enzyme digestion.
(A) Select enzyme
(B) Save digest
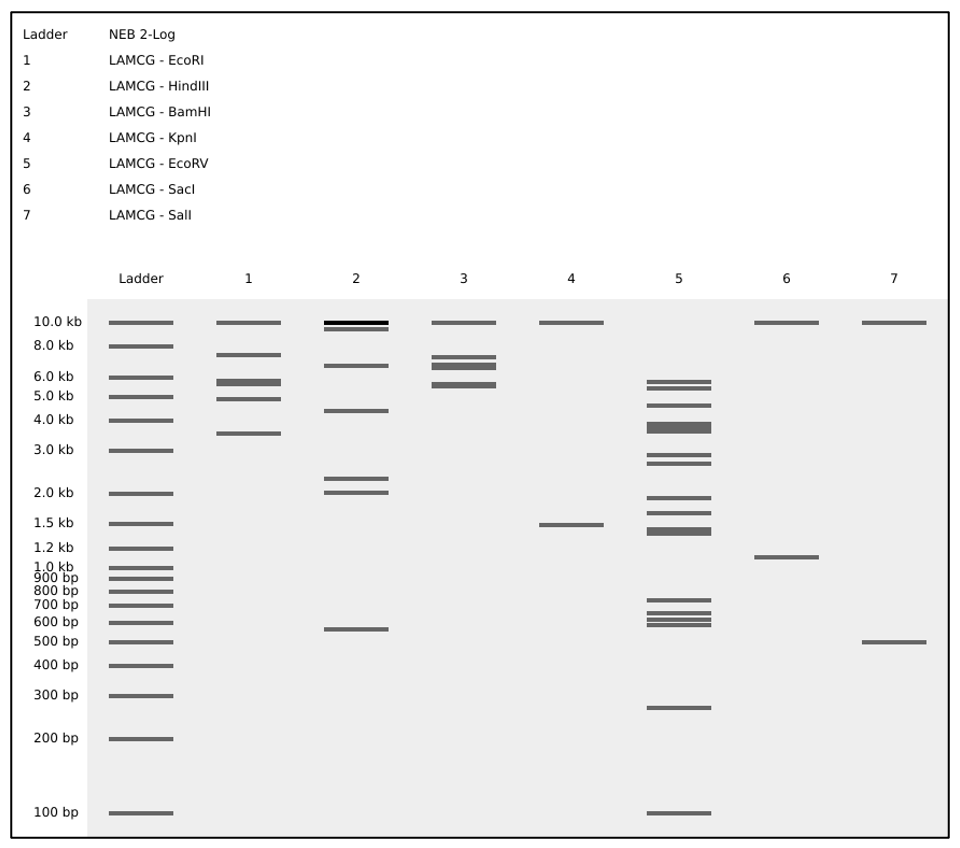
To view the simulated enzyme digestions:
Go to VIRTUAL DIGEST, then select a DNA ladder and previously saved enzyme digestions to display as shown in figure (C).
(C) Simulated enzyme digestion of lambda DNA
Create a design/pattern artwork.
To create a pattern:
Perform a virtual digest in combinations of single, double, and triple enzyme digestions of lambda DNA as shown in figure (D).
(D) Simulated enzyme digestion of lambda DNA in a pattern
PART 2
GelArt - Restriction Digests and Gel Electrophoresis
This was run virtually; see figures, (C) and (D) above.
PART 3
DNA Design Challenge
3.1. Choose your protein
Which protein have you chosen?
I’ve chosen Histidine Ammonia-Lyase (HAL) enzyme. HAL converts L-histidine to trans-urocanic acid (trans-UCA) and ammonia.
Why?
Found in human skin, the enzyme, HAL, catalyzes trans-urocanic acid (trans-UCA) formation, which has skin moisturizing properties and is implicated in skin disease management. Topical application of a cis-urocanic acid (UV-induced isomeric form) in combination with orally administered histidine has been shown to be effective in the management of atopic dermatitis (AD), the most common form of eczema (Peltonen et al 2014).
Trans-UCA is naturally liberated from histidine-rich filaggrin monomers of a major epidermis protein in skin. As part of the skin’s natural moisturizing factor, trans-UCA provides important functions in maintaining the skin’s hydration, pH balance, epidermal barrier integrity, and skin’s microbial community balance (Debinska 2021, Kim and Lim 2021).
AD is caused by dysfunction in the epithelial barrier and the overactivation of the immune system. Pathology of the disease is viewed as beginning with a dysfunction in the epithelial barrier. There is no cure, but management includes the application of daily moisturizers and corticosteroids to improve the skin barrier function. In severe cases, biologics-based therapies such as monoclonal antibodies targeting cytokine signaling pathways are available (Debinska 2021).
As a synthetic biology application, I have designed a microbial expression system to produce trans-UCA from yeast for clinical use as an active ingredient in a lotion. HAL homologs are found in microbes, such as bacteria and certain groups of fungi. But common yeast, Saccharomyces cerevisiae, does not have a HAL homolog. I chose the yeast as the host organism to produce trans-UCA because yeast has several advantages as an expression system: the GRAS status and lack of endotoxin production. The Pseudomonas putida hutH gene, which encodes for HAL, is the microbial source for trans-UCA production (Hernandez and Phillips 1993).
References, Click to Expand
Peltonen, J. M., L. Pylkkanen, C. T. Jansen, I. Volanen, T. Lehtinen, J. K. Laihia, and L. Leino. 2014. Three randomized phase 1/IIa trials if 5 % cis-urocanic acid emulsion cream in healthy adult subjects and in patients with atopic dermatitis. Acta Derm Venereol.
Debinska, A. 2021. New treatments for atopic dermatitis targeting skin barrier repair via the regulation of FLG expression. J. of Clinical Medicine.
Kim, Y. and KM Lim. 2021. Skin barrier dysfunction and filaggrin. Arch. Pharm. Res.
Peltonen, J. M., L. Pylkkanen, C. T. Jansen, I. Volanen, T. Lehtinen, J. K. Laihia, and L. Leino. 2014. Three randomized phase 1/IIa trials if 5 % cis-urocanic acid emulsion cream in healthy adult subjects and in patients with atopic dermatitis. Acta Derm Venereol.
Hernandez D. and A. T. Phillips. 1993. Purification and characterization of Pseudomonas putida histidine ammonia-lyase expressed in Escherichia coli. Protein Expression and Purification.
I’ve used Google, ChatGPT, and Claude searches.
Prompts:
1. Can you research proteins that can be developed as therapies for skin diseases such as eczema?
2. Can you research the development of the production of cis-urocanic acid in a biotechnologically relevant host system? What genes are needed to produce cis-urocanic acid?
3. Can you compare the stability of trans-UCA and cis-UCA? Can you research what the best ammonia removal strategies are in a cell-free production system that primarily forms trans-UCA?
4. Can you research what the possible formulation components should be for trans-UCA as the active pharmaceutical ingredient applied topically for atopic dermatitis therapy? What buffer system, cryoprotectant, surfactant, and excipients should be used for achieving maximum effectiveness in treatment and shelf-life stability?
Obtain the protein sequence from UniProt:
I’ve retrieved the amino acid sequence of the histidine ammonia lyase from Pseudomonas putida from the UniProt database.
Here, I’ve translated the input DNA sequence into an amino acid sequence by Expasy Translate, validating the DNA sequence by in-silico reverse translation.
Translation of the P. putida histidine ammonia lyase gene, hutH, to its amino acid sequence.
3.3. Codon optimization
Codon optimize your sequence.
Describe why you need to optimize codon usage.
Which organism have you chosen to optimize the codon sequence for, and why?
The efficiency of protein production is strongly influenced by the host organism’s codon usage. Preferences for a codon recognition sequence and the rate of synthesis for amino acid carriers, transfer RNA, are expected to differ in each lineage of living systems. To take care of the codon usage barrier, one could take this into account in the design, synthesizing the DNA code and avoiding codon usage limitations.
I am using a yeast species as the host organism for expressing the hutH gene for histidine ammonia lyase production. I decided on the yeast expression system due to its well-developed protein expression systems, which are robust and have a “generally safe” status. The yeast-derived protein products would be easily accepted for clinical use since they have the GRAS status. The histidine ammonia lyase is the catalyst for making trans-uroconic acid for skin therapeutic use.
The hutH gene will be sourced from the bacterial species Pseudomonas putida, where the gene is well-characterized. Since the hutH coding sequence is bacteria-sourced, it should be optimized for codon usage in the yeast, the production strain, not bacteria.
Codon-optimized gene expression will allow a robust production of the protein in the host. It will be expressed from a well-characterized promoter in the yeast expression plasmid. Depending on the copy size of the expression plasmid, we expect more proteins to be produced from a self-replicating plasmid in cells, increasing the production yield. The expression system targets the enzyme to be exported outside of cells, creating more efficient downstream processing.
3.5. [Optional] How does it work in nature/biological systems?
Describe how a single gene codes for multiple proteins at the transcriptional level.
Try aligning the DNA sequence, the transcribed RNA, and also the resulting translated Protein!!! See example below.
[Example shows the biomolecular flow in central dogma from DNA to RNA to Protein] Special note that all “T” were transcribed into “U” and that the 3-nt codon represents 1-AA.
PART 4
Prepare a Twist DNA Synthesis Order
4.1. Create a Twist account and a Benchling account
4.2. Build Your DNA Insert Sequence
I will use the yeast expression vector from Twist Bio.
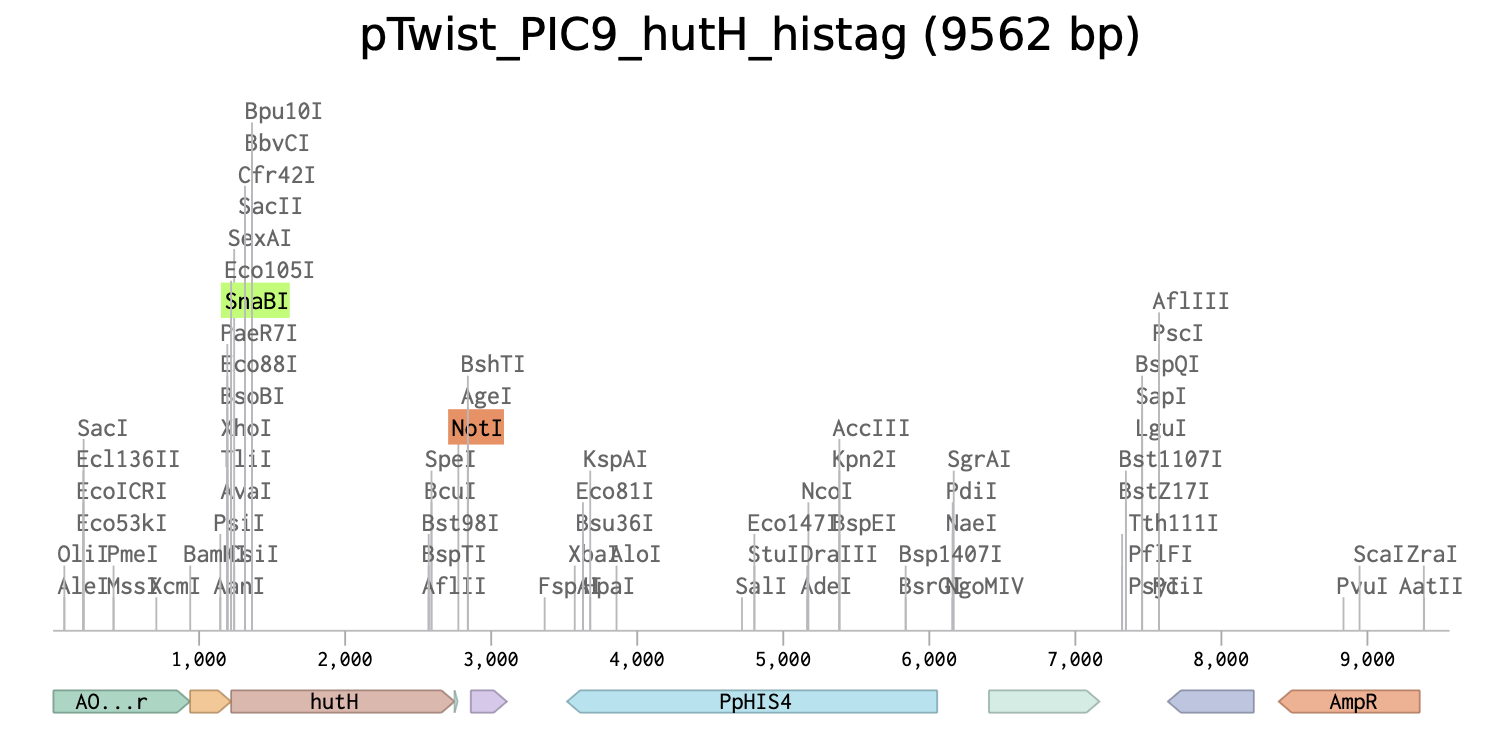
The expression system, pTwist_PIC9, and features:
AOX1 promoter, methanol-inducible
Alpha-factor secretion signal sequence, which contains its translation initiation signal, Kozak-like sequence, and the initiation codon (ATG)
AOX1 terminator
The codon-optimized hutH gene insert:
The initiation codon (ATG) is removed due to the existing initiation codon in the alpha factor secretion sequence in pTwist_PIC9.

Unique restriction enzyme sites added: SnaBI (TACGTA) at the N-terminus for in-frame cloning with the alpha-factor secretion signal sequence and NotI (GCGGCCGC) at the C-terminus.

7x his-tag is added at the C-terminus site: CATCACCATCACCATCATCAC

Stop codon is added: TAA
Linear Map of the final expression plasmid: pTwist_PIC9_hutH_histag
(i) What DNA would you want to sequence (e.g., read) and why? This could be DNA related to human health (e.g., genes related to disease research), environmental monitoring (e.g., sewage wastewater, biodiversity analysis), and beyond (e.g., DNA data storage, biobanks).
I’d like to read the DNA from the human skin microbiome and compare it with healthy and diseased conditions. Findings from comparative studies would reveal insight into dysbiosis and could potentially lead to rationally designed probiotics as therapeutics, which may help reverse disease conditions.
(ii) What technology or technologies would you use to perform sequencing on your DNA, and why?
Also, answer the following questions:
Is your method first-, second-, or third-generation or other? How so?
What is your input? How do you prepare your input (e.g., fragmentation, adapter ligation, PCR)? List the essential steps.
What are the essential steps of your chosen sequencing technology? How does it decode the bases of your DNA sample (base calling)?
What is the output of your chosen sequencing technology?
• Method: I would use the second-generation sequencing method (Illumina shotgun metagenomic sequencing) because it is a more economical and applicable method in metagenomic sequencing, constructing metagenome-assembled genomes, and whole metagenome analysis, capturing the entire sequence of the skin microbiome and analysis. (Yang et al. 2021, Chen et al. 2023)
• Input DNA and preparation. The input is genomic DNA of the microbiome from skin. The skin microbiome has low microbial biomass. Working with low-abundance samples can be challenging, leading to poor-quality downstream genomic DNA and data analysis. Additionally, human DNA is often a contaminant that needs to be removed before sequencing. (Bjerre et al. 2019.)
After isolating genomic DNA from the skin samples and removing the human DNA, I would fragment the genomic DNA for the sequencing library construction. For this, I would use an enzymatic method such as Tn5 transposase to randomly cleave DNA. Because the Illumina sequencing can read between 75 and 300 bp, fragmented DNA should be selected appropriately by selectively capturing the DNA fragments on beads.
Next, DNA ends should be repaired to have blunt ends, and a single adenine is added to the 3’ ends, creating A-tailing, which helps to establish directionality.
In the following steps, I would add Illumina adapters, where the adapters are ligated to the DNA at both ends. Illumina adaptors will serve as an anchor for the DNA to be immobilized on the flow cell surface. Next is the PCR amplification step to increase the copies of the adaptor-ligated DNA to ensure that the library has sufficient copies of the DNA fragments.
Finally, PCR-amplified DNA is size-selected, and quality is assessed by a fragment analyzer.
• Sequencing technology. It is a synthesis-based technology, sequencing by synthesis (SBS). The flow cell is pre-loaded with oligos that have complementarity to the Illumina adapters. Once the library is loaded on the flow cell, DNA hybridizes with both ends to the complementary oligos, forming a curved arch.
The next step is bridge PCR to make about 1000 clones of each molecule, as necessary for signal amplification.
The following step is the SBS, where DNA polymerase incorporates 3’-blocked fluorescently labeled nucleotides. Blocker is reversible, allowing incorporation of nucleotides in each cycle, with only a single base per cycle.
Simultaneously, in each cycle of incorporation, the camera captures images as generated by the excitation and emission of fluorescent dye. Image analysis software processes and calls the base.
Once the DNA polymerase completes the incorporation of nucleotides, the synthesized DNA strand is washed away, and the entire process is repeated from the other end, so it is paired-end, superior to single-read sequencing because both ends of sequencing are performed in separate rounds, providing better data accuracy on the same fragment.
• Output. On a MiSeq, the output is 250-300 bp, with paired-end reads, 600 reads per DNA fragment.
References, Click to Expand
Chen, Y., R. Knight, and R. Gallo. 2023. Evolving approaches to profiling the microbiome in skin disease. Frontiers in Immunology.
Yang, C., D. Chowdhury, Z. Zhang, W. K. Cheung, A. Lu, Z. Bian, and L. Zhang. 2021. A review of computational tools for generating metagenome-assembled genomes from metagenomic sequencing data. Computational and Structural Biotechnology Journal.
Bjerre, R. D., L. Warchavchick Hugerth, F. Boulund, M. Seifert, J. D. Johansen, and L. Engstrand. 2019. Effects of sampling strategy and DNA extraction on human skin microbiome investigations. Nature.
I’ve used Claude research.
Prompts:
Can you research sequencing methods used in the skin microbiome research? I want to know about the functionality of the microbiome in disease states. Did they perform de novo genome assemblies to learn about functional pathways (loss of activity or hyperactivity) in disease conditions?
Can you research the second-generation sequencing method? Explain the preparation steps and how the method does base calling.
5.2 DNA Write
(i) What DNA would you want to synthesize (e.g., write) and why? These could be individual genes, clusters of genes or genetic circuits, whole genomes, and beyond. As described in class thus far, applications could range from therapeutics and drug discovery (e.g., mRNA vaccines and therapies) to novel biomaterials (e.g., structural proteins) to sensors (e.g., genetic circuits for sensing and responding to inflammation, environmental stimuli, etc.) to art (DNA origami).
I want to synthesize an enzyme for therapeutic development purposes. One example is histidine ammonia lyase (HAL), which converts histidine into trans-urocanic acid (trans-Uro) and ammonia. Trans-Uro has an important function in maintaining skin barrier function. The product can be used as a topical application to manage skin disease such as atopic dermatitis. (Debinska 2021, Peltonen et al. 2014)
Trans-Uro can be produced from a cell-free expression system.
To express and purify the catalyst HAL, I’d like to create a yeast expression system expressing the gene hutH encoding HAL. A gene block synthesis can provide the hutH gene to be cloned into an existing yeast expression vector.
(ii) What technology or technologies would you use to perform this DNA synthesis, and why?
Also, answer the following questions:
What are the essential steps of your chosen sequencing methods?
What are the limitations of your sequencing method (if any) in terms of speed, accuracy, scalability?
• Technologies: The hutH gene for the HAL coding sequence alone is 1530 bp (Hernandez and Phillips 1993). The DNA of this size, as a gene block, cannot be synthesized. It needs to be synthesized as short, overlapping oligos and later assembled.
Synthesis technologies: the most widely used are the 1st-generation or the 2nd-generation technologies based on phosphoramidite chemistry, and they achieve 200 nt. The emerging new technology, the 3rd generation, is based on the terminal deoxynucleotidyl transferase (TdT) enzyme, which achieves 300 nt.
Assembly technologies: OE-PCR (overlap extension PCR) or PCA (polymerase cycling assembly) are applied to most fragments under 1000 bp. Gibson assembly is applied to fragments larger than 1500 bp.
• Essential steps in enzymatic synthesis. Although the phosphoramidite chemistry is widely used and available, the 3rd-generation enzyme synthesis technology is more environmentally friendly, as it has no toxic organic solvent use. I would consider the enzymatic method.
The TdT enzyme adds 3’-blocked nucleotides to the 3’-OH of the growing chain. A wash step removes unincorporated nucleotides. Then, a free 3’-OH is generated by cleaving the 3’-blocking group. The cycle is considerably shorter, 10-40 seconds, in comparison to the phosphoramidite method, which is 4-10 minutes.
• Limitations. TdT enzyme adds nucleotides randomly. So, the synthesis must be controlled by temporarily blocking the 3’-OH. Modifications are not as easy as the phosphoramidite method. As it emerges, its availability is currently limited.
• Essential steps in OE-PCR and Gibson assembly. First, a set of overlapping oligos is designed for both strands. Primers are synthesized by the phosphoramidite method, pooled, and assembled in a thermocycling extension reaction. The full-length fragment is then amplified by PCR with two flanking outer primers.
• Limitations. The error rate is 1 in 500 - 1000 bp assembled products, which require sequencing for verification.
For a gene block larger than 1500 bp, the Gibson assembly is used by creating multiple sub-fragments of 300-800 bp size by OE-PCR. The sub-fragments would have 20-40 bp overlapping ends. Final assembly is performed in a single isothermal reaction.
I’ve used Claude research.
Prompts:
Can you research what technologies are used for synthesizing SNA (DNA write)? To make a gene block, explain what technologies can be used. To make a construct, including the vector, explain what technologies can be used.
References, Click to Expand
Debinska, A. 2021. New treatments for atopic dermatitis targeting skin barrier repair via the regulation of FLG expression. Journal of Clinical Medicine.
Peltonen, J. M., L. Pylkkanen, C. T. Jansen, I. Volanen, T. Lehtinen, J. K. Laihia, and L. Leino. 2014. Three randomised phase I/IIa trials of 5% cis-urocanic acid emulsion cream in healthy adult subjects and in patients with atopic dermatitis. Clinical Report Acta Derm Venereol.
Hernandez D. and A. T. Phillips. 1993. Purification and characterization of Pseudomonas putida histidine ammonia-lyase expressed in Escherichia coli. Protein Expression and Purification.
5.3 DNA Edit
(i) What DNA would you want to edit and why?
(ii) What technology or technologies would you use to perform these DNA edits, and why?
Week 3 HW: Lab Automation
1. Create a Python file
Generate an artistic design using the GUI at opentrons-art.rcdonovan.com
Using the coordinates from the GUI, follow the instructions in the HTGAA26 Opentrons CoLab to write your own Python script that draws your design.
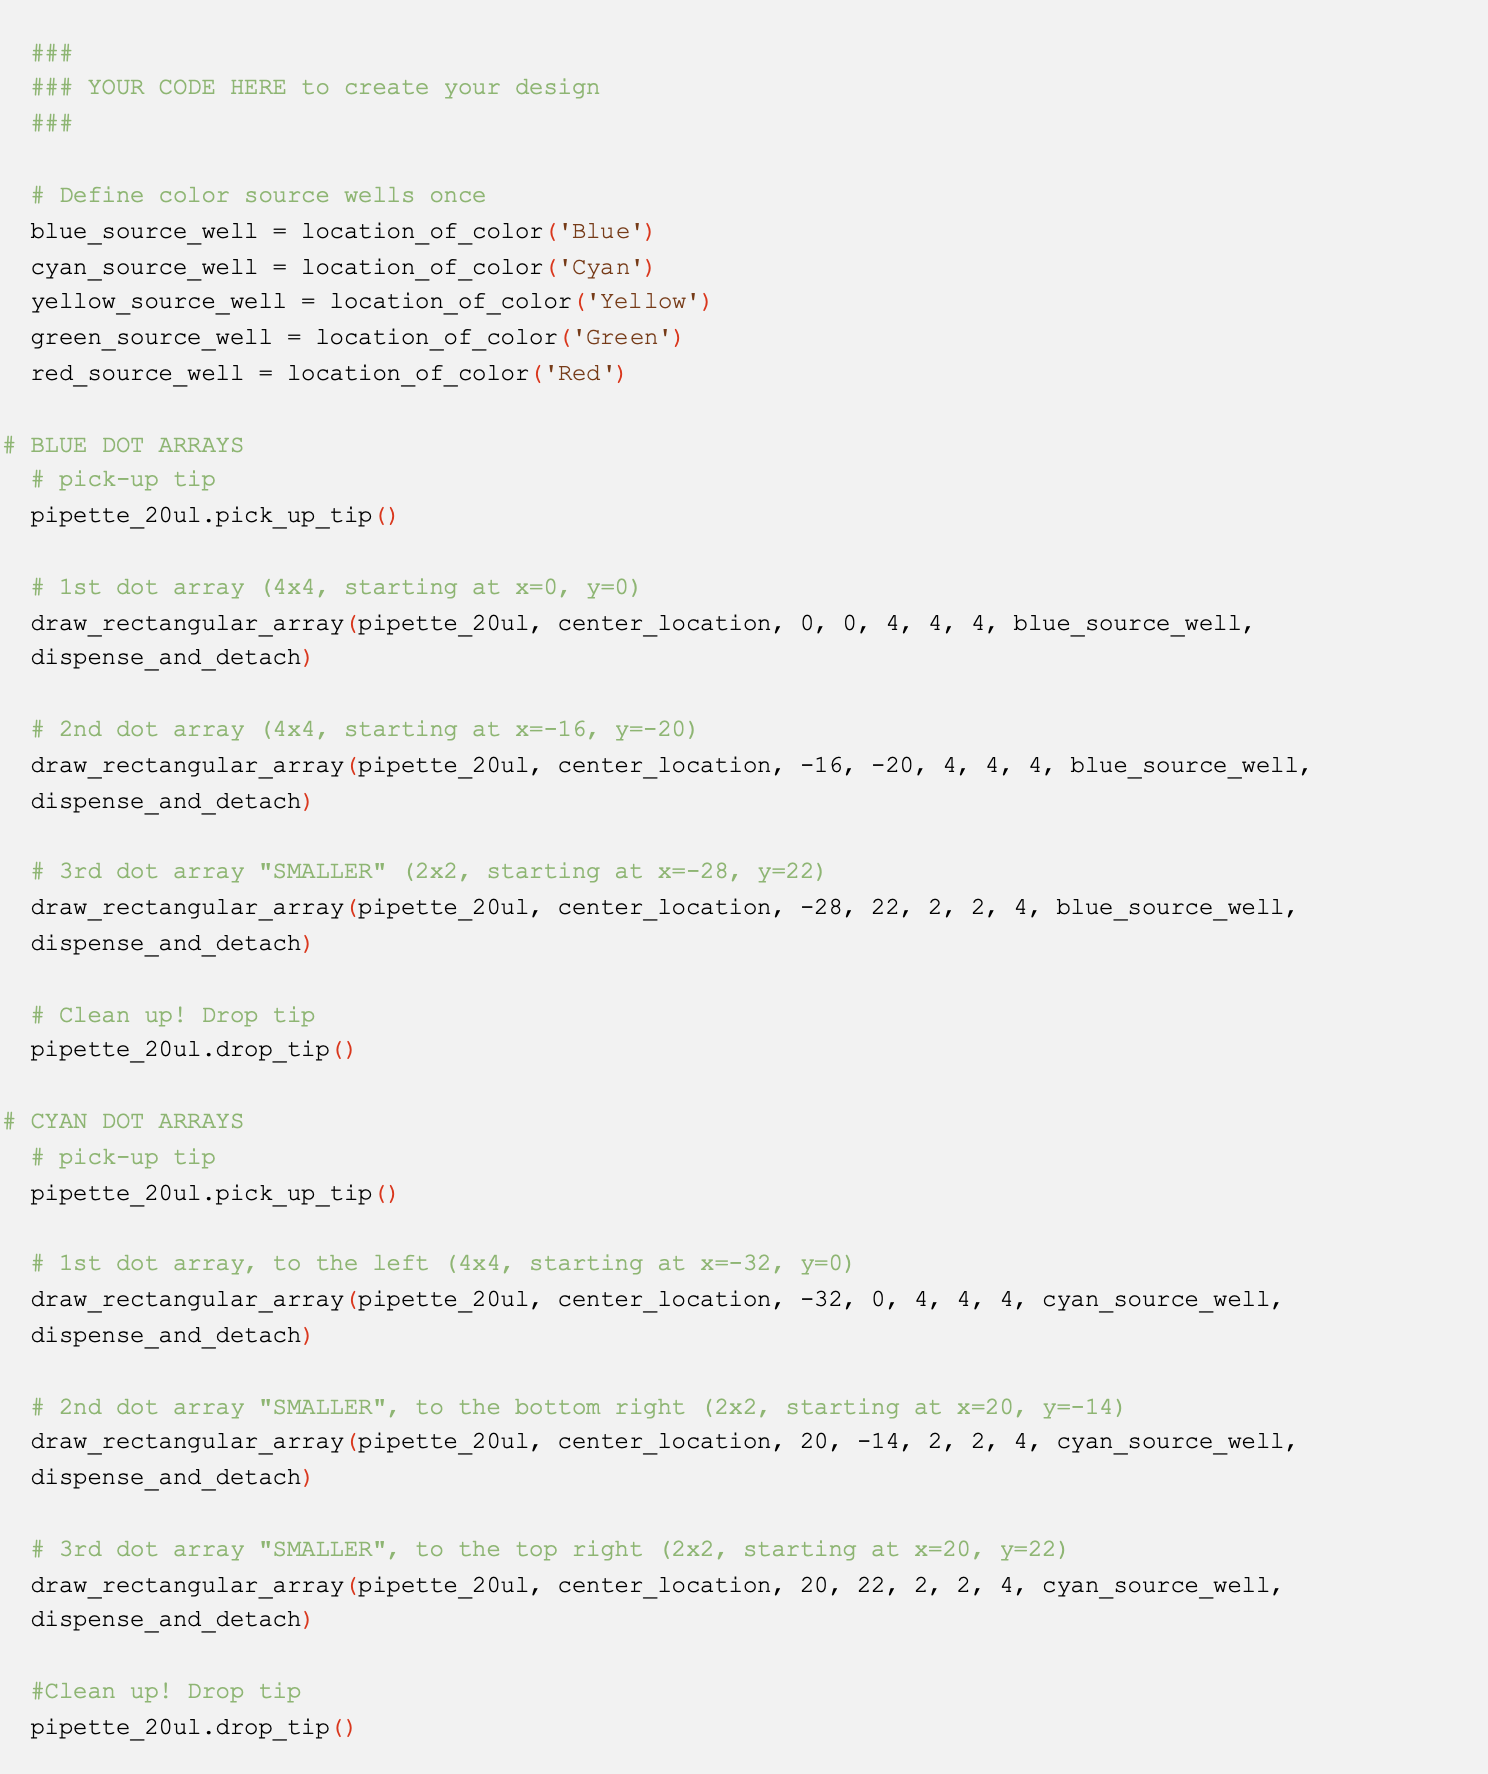
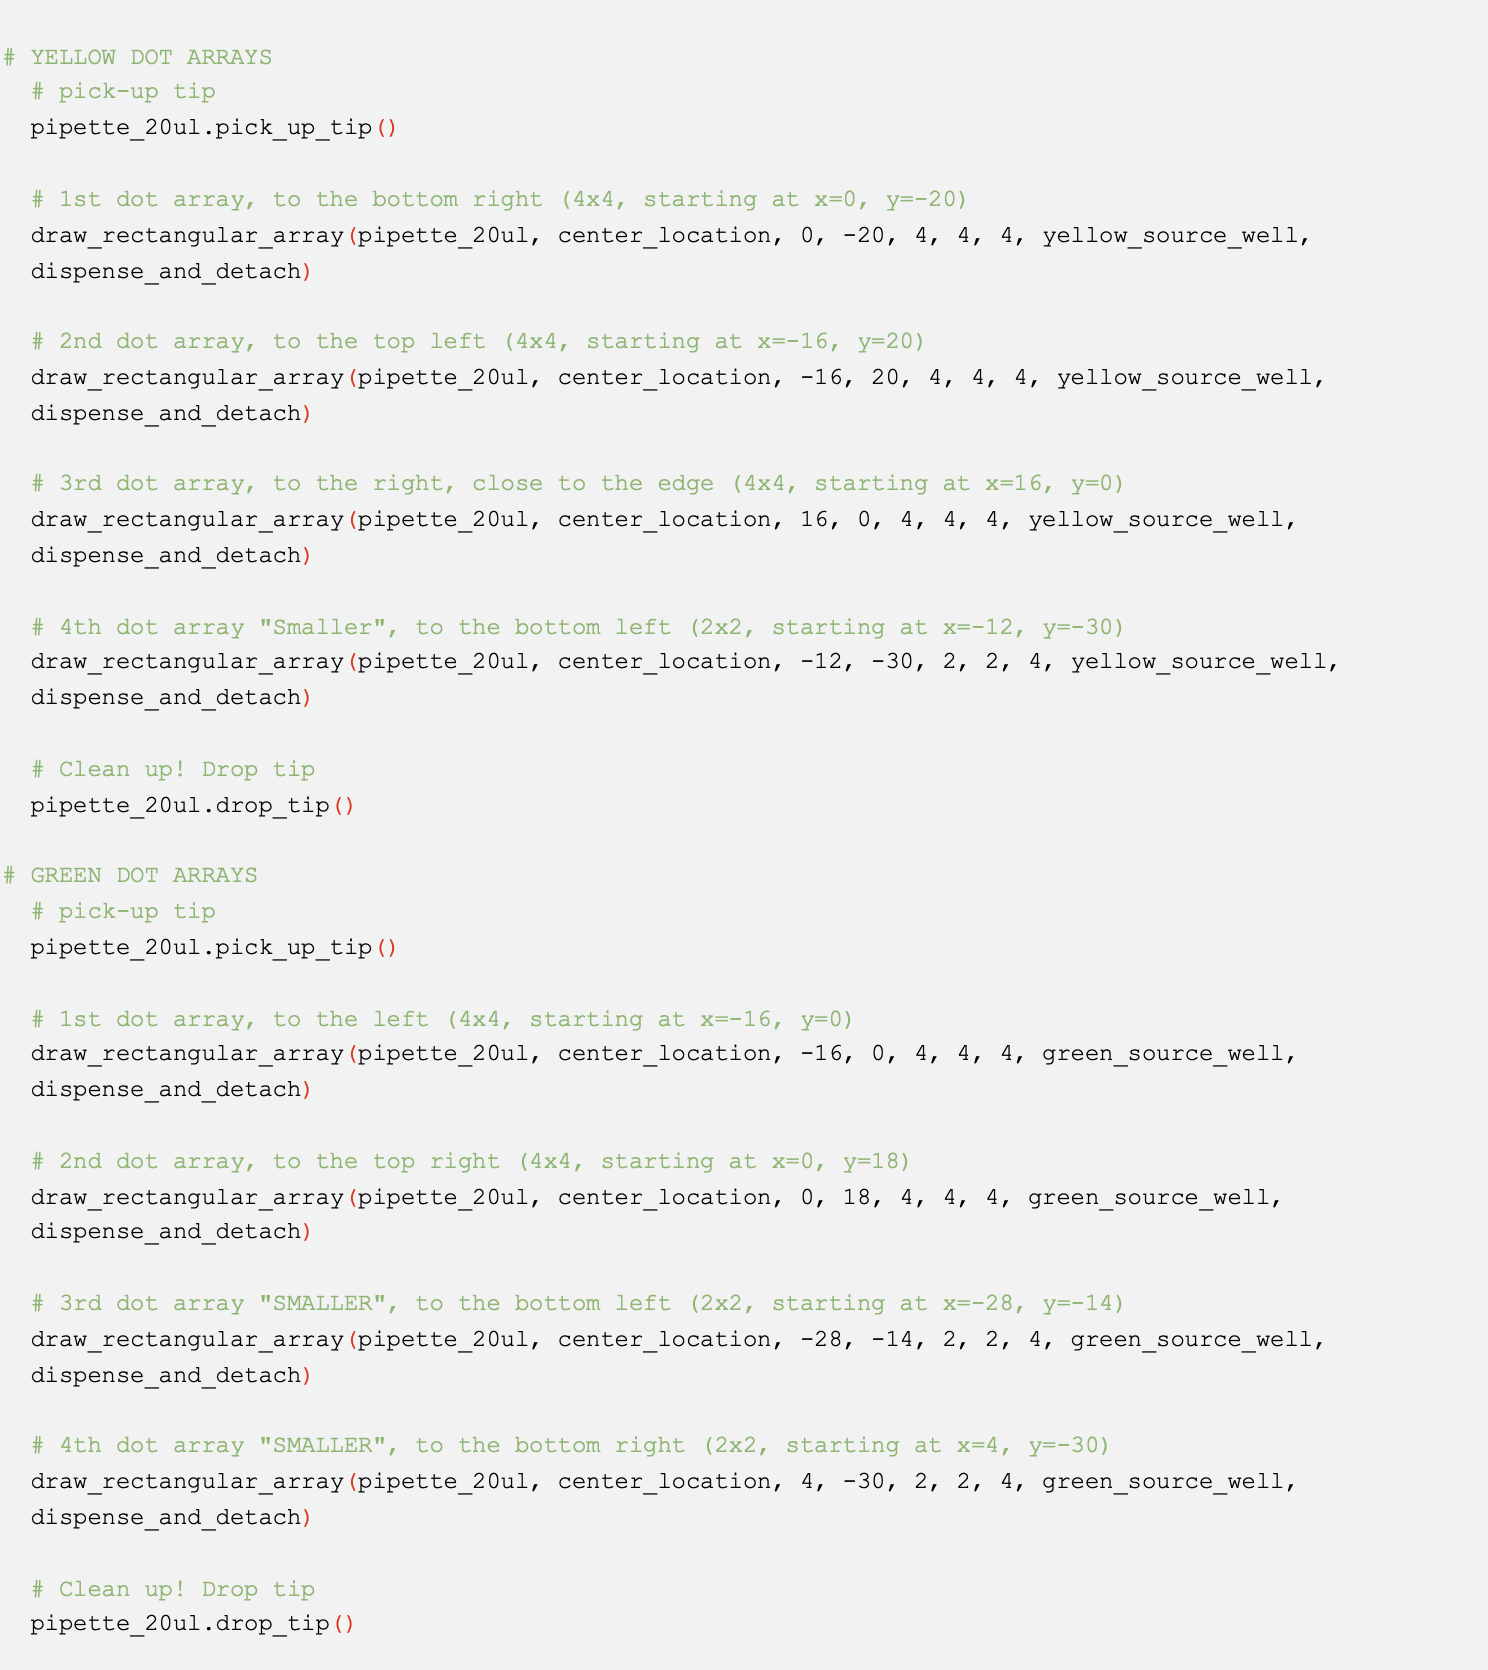
To become familiar with the Python Opentrons API, I adopted a dot array script from the example scripts and reproduced it with changes to create different patterns of assorted dot arrays.
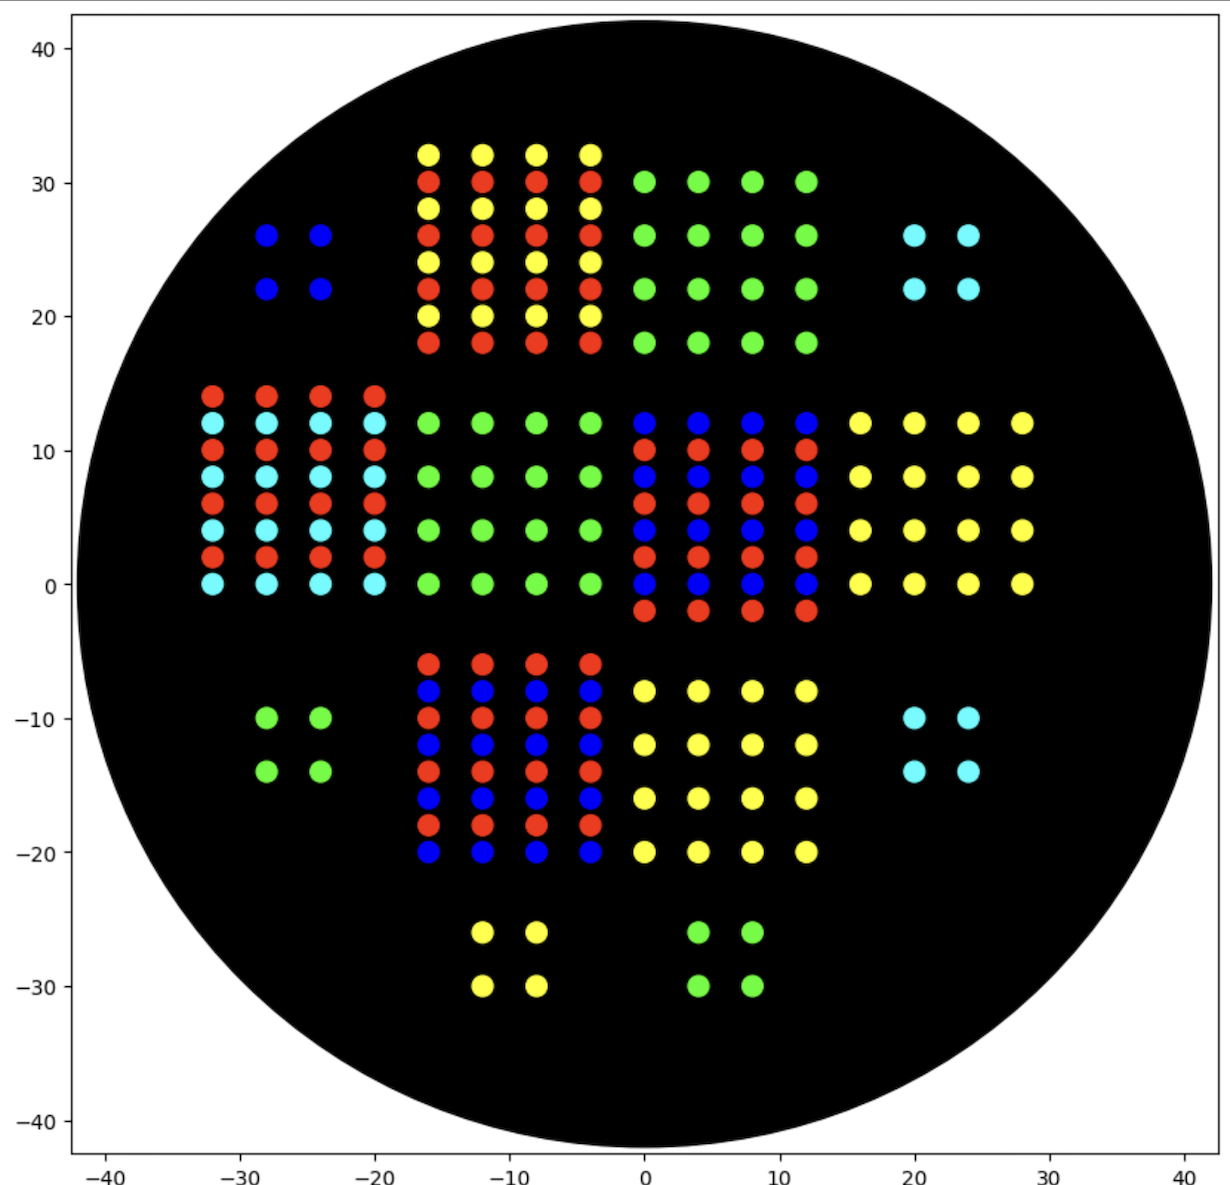
Python script: Assorted Dot Arrays final, Click to Expand
Simulation of the Python script: “Assorted Dot Arrays final” by Opentrons OT-2.
I’ve used Gemini AI to produce the code.
Prompts:
1. Can you write a shorter or combined code for the 2 blue dot arrays? Both arrays use the same code, but for different coordinates.
Is there a way to simplify the code?
Result: Gemini AI created a helper function, draw_rectangular_array. This helper function was placed under “Patterning”.
2. Modify the function, draw_rectangular_array, to handle the second aspiration once it runs out of liquid. Can you write a function to make aspirations specific to each array in the color dot array? As an example, in blue dot arrays, the pipette could aspirate 16 uL for the first array and then go back and aspirate another 16 uL for the second array. Then, finally, go back and aspirate 4 uL for the smaller array.
Result: Gemini AI created a function for the pipette to aspirate the full volume, 20 uL instead of 16 uL, calculate the volume of color dot arrays upfront, and perform new aspirations as needed. Any size of array can be handled with a single pipette tip with multiple aspirations. This helper function was placed under “Patterning”.
3. Explain the code: blue_source_well = location_of_color. What does this code do? It is present in all color dot arrays at the beginning, after the pick-up tip code. Is it possible to create this function under def to simplify and make it easier to follow?
Result: Gemini AI explained that the pipette needs to know the source location for the color when it performs the aspirate function for that specific color. To simplify this, Gemini made an update by creating a single block that contains all source assignments at the beginning of the run function.
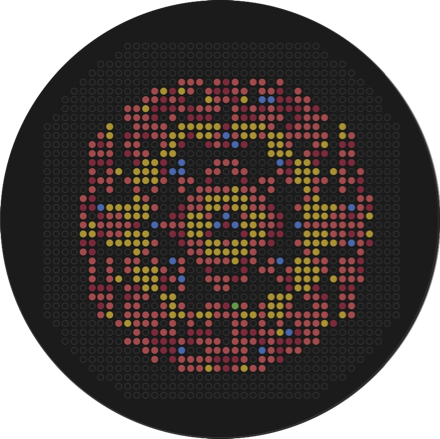
Generating an art design using the GUI at opentons-art.rcdonovan.com.
I’ve generated an art design by uploading an image to the GUI at opentrons-art.rcdonovan.com.
The uploaded image in (A) is converted to an OpenTrons art design as shown in the simulated image in (B).
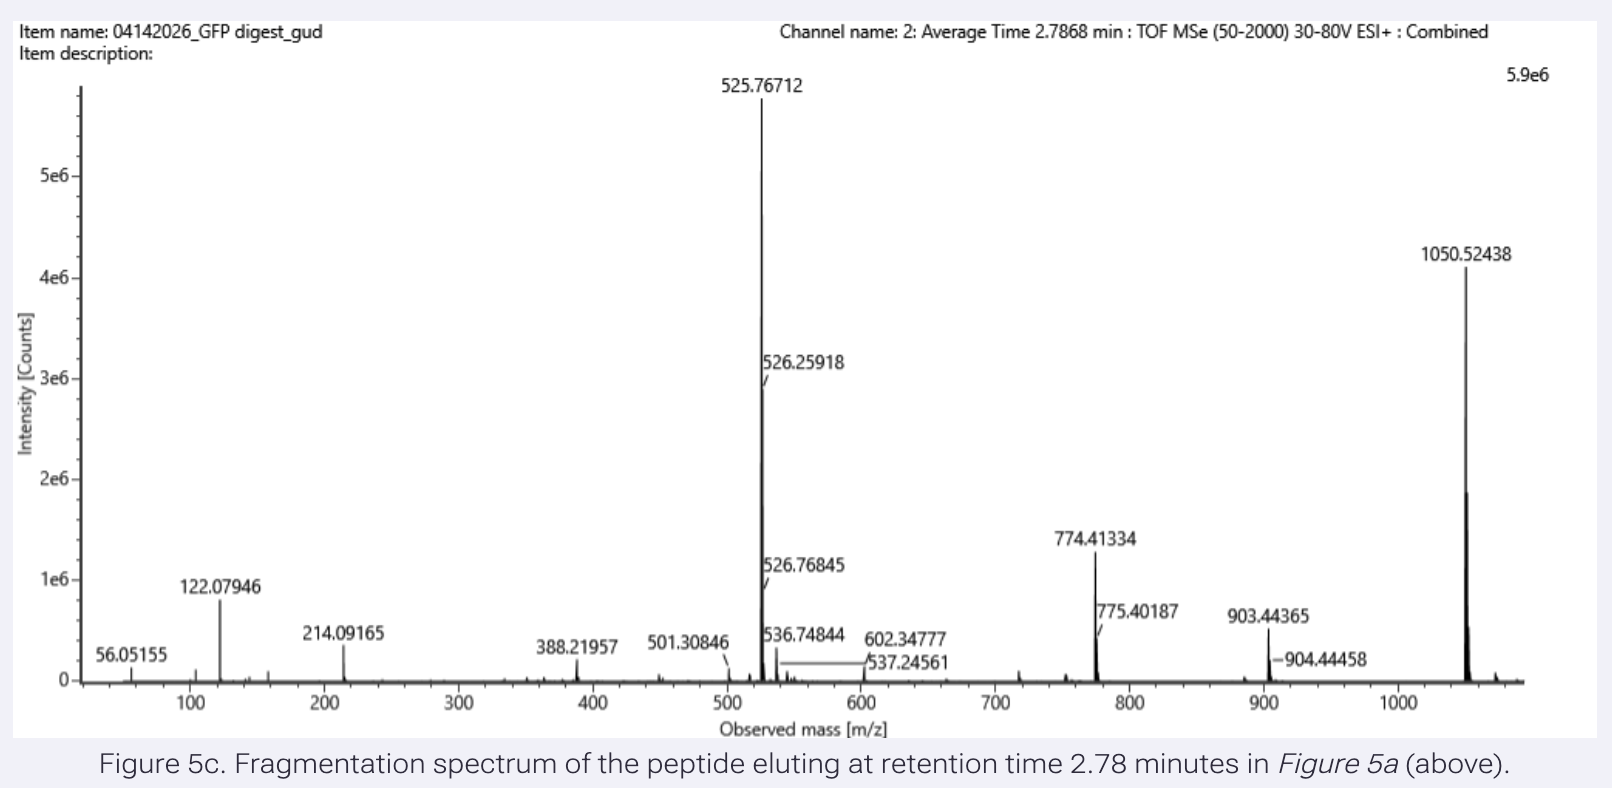
2. Find and briefly summarize a published paper that utilizes laboratory automation to achieve novel biological applications.
Paper
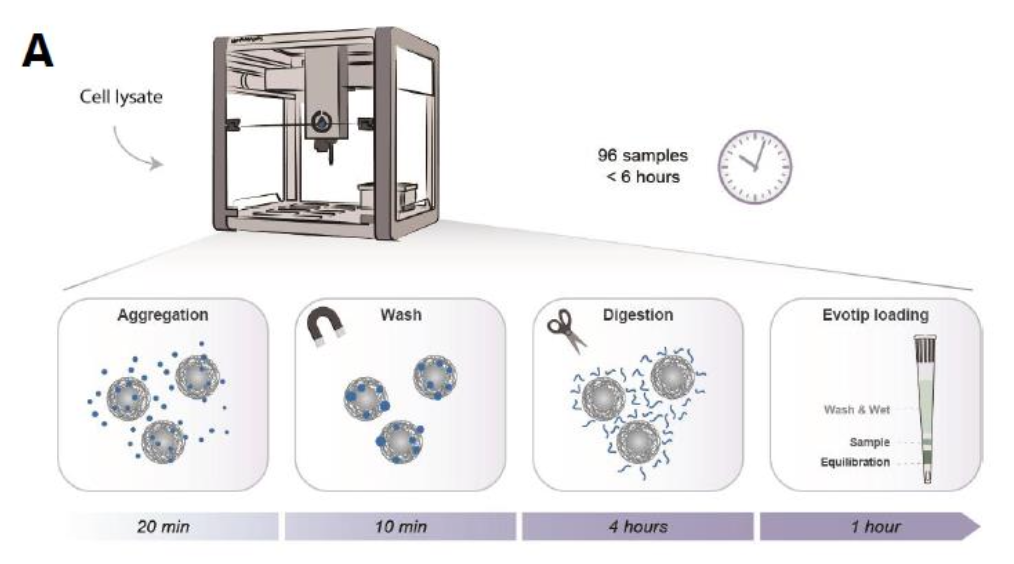
Kverneland, A., F. Harking, J. M. Vej-Nielsen, M. Huusfeldt, D. B. Bekker-Jensen, I. M. Svane, N. Bache, and J. V. Olsen. 2023. Fully automated workflow for integrated sample digestion and Evotip loading enabling high-throughput clinical proteomics. bioRxiv.
General Overview
Identification and quantification of proteins are important in biomarker discovery in clinical applications. Speed and sensitivity are bottlenecks for large cohort studies. Reliable sample preparation is highly critical for accurate and reproducible measurements in the LC-MS/MS platforms. Manual sample preparations are labor-intensive and prone to errors. For success in proteomics applications, a workflow with scalable and high-throughput sample preparation is essential.
The paper describes an automated, hands-free, end-to-end proteomics sample preparation workflow on the Opentrons OT-2 platform. They demonstrated magnetic bead-based protein aggregate capture and digestion and automated loading of the digested peptides, followed by desalting and sample storage, with reproducible results. The process applies to 96 samples in parallel and takes less than 6 hours.
Findings
The authors evaluated the performance of the automated workflow by using HeLa cell lysate, a well-established standard in LC-MS/MS-based proteomics, as a quality control. Using only 1 ug total protein, they were able to quantify about 50,000 peptides and 5600 proteins. Sample loss was negligible compared to the workflow run on 15-fold higher sample input.
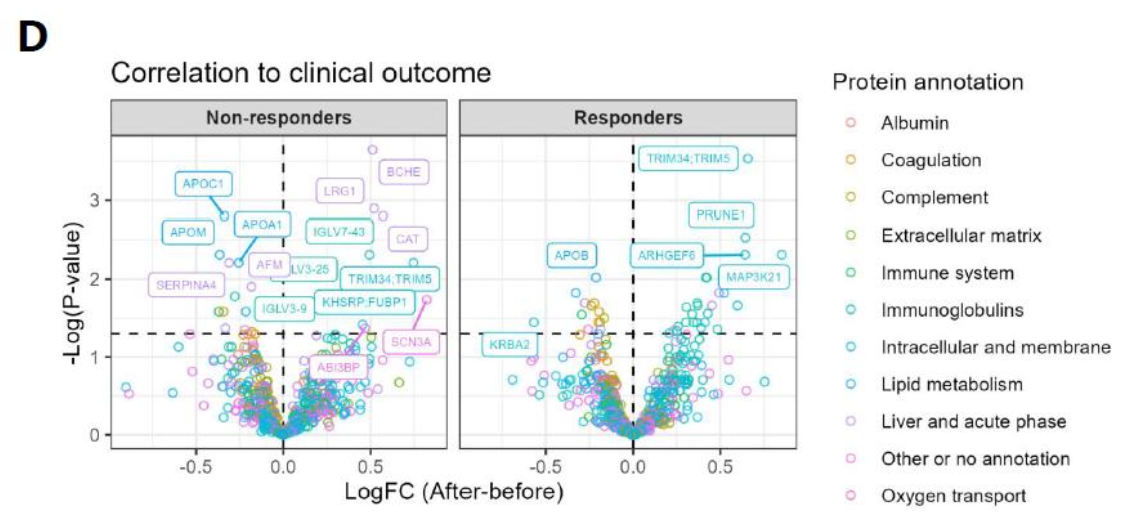
Replicates of workflows were comparable among quantified peptides and proteins, demonstrating reproducible protein quantification. Additionally, they tested the workflow with a larger sample set requiring sample storage between runs. Sample storage did not impact the number of quantified peptides. Plasma proteome was also evaluated, including samples from a clinical setting, a set of patients responding to therapy, and non-responding patients. Findings indicated the utility of the automated workflow in biomarker discovery.
Relevant Figures
Fig 1A. Schematic overview of the integrated workflow on Opentrons OT-2 robot.
Fig 5D. Application in clinical cohort of metastatic melanoma patients; Volcano plot comparing the time points (after CPI – before CPI) within responding and non-responding patients. CPI: Checkpoint Inhibitor Therapy.
3. Write a description of what you intend to do with automation tools for your final project.
Of the three possible final projects, Project 2 and Project 3, both use automation tools and are described in more detail under “Final Project Ideas”.
Automation tools can be used in the following ways in these projects:
Project 2 has a formulation step where a complex group of chemicals can be determined at their optimal concentrations with automated high-throughput testing in the downstream immunoassays.
Project 3 has an enrichment step to find high-affinity aptamers. High-throughput automation tools can be applied during performing microfluidic-based, microtiter-based, or magnetic bead-based screening and high-throughput sequencing.
Final Project Ideas
Project 1
The development of an engineered bacterial biosensor for real-time hydration detection as a preventive health measure in aging populations.
An engineered skin bacterium, applied as a lotion on the wrist or forearm, could detect body hydration levels and generate an electric current detectable by an electronic wearable component.
Overview:
Select a reference strain from the human skin microbiome (i.e., Acinetobacter sp) as a chassis for the bacterial biosensor. Ideally, a Gram-negative species that functions to generate electric currency through a synthetic electron transport chain.
Engineer the commensal strain to be dependent on non-canonical amino acids for growth for biocontainment purposes.
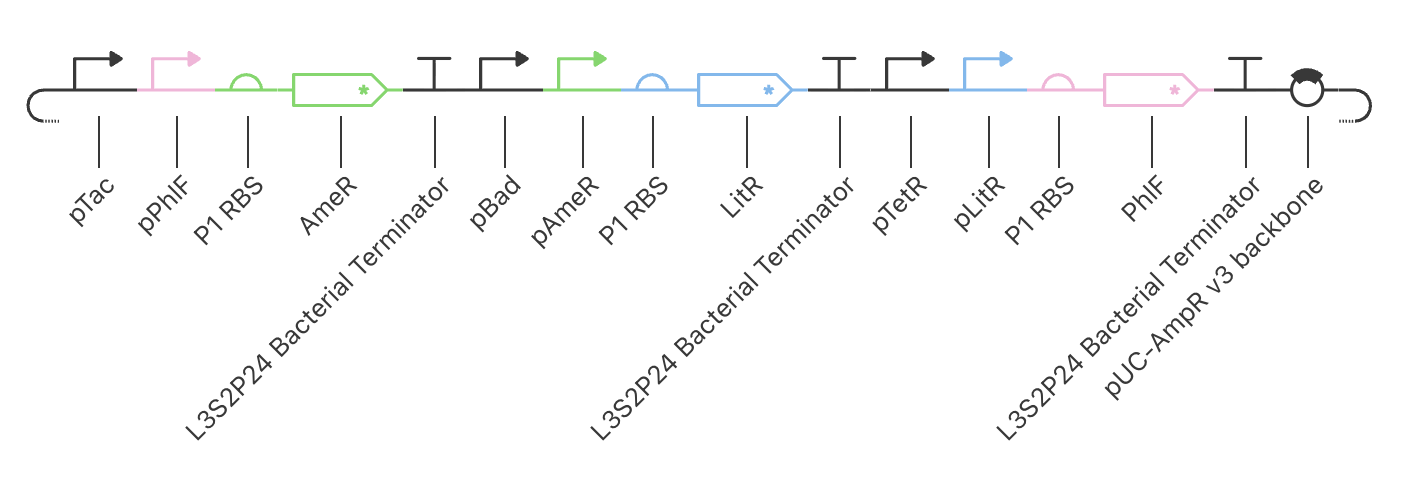
Build a genetic circuit with an osmolarity-responsive promoter, ProU, from Escherichia coli that drives the expression of synthetic electron chain transport from Shewanella oneidensis, the CymA-Mtr pathway, which generates electron flow in response to an increase in sodium levels in the skin’s interstitial fluid.
Detection of electron flow by a wearable component.
References, Click to Expand
Kim, S-R., Y. Zhan, N. Davis, S. Bellamkonda, L. Gillan, E. Hakola, J. Hiltunen, and A. Javey. 2025. Electrodermal activity as a proxy for sweat rate monitoring during physical and mental activities. Nature Electronics.
Rashid, F-Z. M., F. G. E. Cremazy, A. Hofmann, D. Forrest, D. C. Grainger, D. W. Heermann, and R. T. Dame. 2023. The environmentally-regulated interplay between three-dimensional chromatin organization and transcription of proVWX in E. coli. Nature Communications.
Atkinson, J. T., L. Su, X. Zhang, G. N. Bennett, J. J. Silberg, and C. M. Ajo-Franklin. 2022. Real-time bioelectronic sensing of environmental contaminants. Nature.
Project 2
Topical application of trans-urocanic acid (trans-UCA) for the management of atopic dermatitis (AD), a common skin disease in eczema patients.
Skin barrier dysfunction is the major contributor to eczema pathologies. To repair skin barrier dysfunction, trans-UCA, which is naturally found in healthy skin, is applied topically as a therapeutic.
Overview:
Create a yeast expression system to produce the catalyst, histidine ammonia-lyase, a single enzyme required for trans-UCA synthesis.
Purify and recover the catalyst from yeast fermentation.
Establish a cell-free system for the production of trans-UCA.
Apply an automation system to formulate, optimize, and perform efficacy measurements in a 3D reconstructed human epidermis (RHE) in the AD-induced model. The output is the multiplexed immunoassays to look for upregulation of filaggrin and reduction in cytokine markers, such as IL-1alpha.
Below is the list of formulation components, which is extensive, and an automation platform is highly advantageous to optimally formulate the skin therapeutic.
Active pharmaceutical ingredient (API): trans-UCA
Buffer
Carrier system decision: oil-in-water, hydrogel, ointment
Surfactant/Emulsifier system
Penetration enhancers
Preservatives for shelf life
Antioxidants & light stabilizers
Other barrier repair components
References, Click to Expand
Peltonen, J. M., L. Pylkkanen, C. T. Jansen, I. Volanen, T. Lehtinen, J. K. Laihia, and L. Leino. 2014. Three randomized phase 1/IIa trials if 5 % cis-urocanic acid emulsion cream in healthy adult subjects and in patients with atopic dermatitis. Acta Derm Venereol.
Debinska, A. 2021. New treatments for atopic dermatitis targeting skin barrier repair via the regulation of FLG expression. J. of Clinical Medicine.
Kim, Y. and KM Lim. 2021. Skin barrier dysfunction and filaggrin. Arch. Pharm. Res.
Hernandez D. and A. T. Phillips. 1993. Purification and characterization of Pseudomonas putida histidine ammonia-lyase expressed in Escherichia coli. Protein Expression and Purification.
Le Pham, D., K-M. Lim, K-M. J., H-S. Park, D. Y. M. Leung, and Y-M. Ye. 2017. Increased cis-to-trans urocanic acid ratio in the skin of chronic spontaneous urticaria patients. Sci. Rep.
Project 3
A minimally invasive microneedle array with aptasensor technology to detect ferritin from the skin’s interstitial fluid for the body’s iron status and health monitoring.
A vegetarian and vegan diet can be iron-limited. A simple and less invasive device capable of continuous monitoring of the body’s iron storage would be helpful for individualized optimal diet adjustments.
Overview:
Establish a random ssDNA library.
Purify human ferritin protein in iron-loaded form as found in the skin’s interstitial fluid.
Perform selection of functional oligonucleotides for high-affinity binding to the purified ferritin protein through Systemic Evolution of Ligands by Exponential enrichment (SELEX) technique.
Use a microneedle with a gold-coated surface that will serve as the electrode.
Engineer the candidate aptamer for electrochemical signal integration: 5’ end of the aptamer is made to contain an electrode attachment tag, such as Thiol, and the 3’ end to contain a redox tag such as Methylene Blue. Optimize to include a hairpin structure for ferritin binding stability.
Detection of electron flow in a wearable device.
References, Click to Expand
Li, X., S. Liu, X. Huang, C. Yao, J. Chen, L. Gao, C. Zhou, Y. Wu, J. Liu, M. Li, N. Zhao, H-J. Chen, S. Huang, and X. Xie. 2025. Aptamers-based wearable electrochemical sensors for continuous monitoring of biomarkers in vivo. Microsystems & Nanoengineering.
Samant, P., M. M. Niedzwiecki, N. Raviele, V. Tran, J. Mena-Lapaix, D. I. Walker, E. I. Felner, D. P. Jones, G. W. Miller, and M. R. Prausnitz. 2020. Sampling interstitial fluid from human skin using a microneedle patch. Sci Transl. Med.
Kim, S-E., K-Y. Ahn, J-S. Park, K. R. Kim, K. E. Lee, S-S. Han, and J. Lee. 2011. Fluorescent ferritin nanoparticles and application to the aptamer sensor. Anal. Chem.
Week 4 HW: Protein Design Part I
Part A. Conceptual Questions
Answer any NINE of the following questions:
1. How many molecules of amino acids do you take with a piece of 500 grams of meat? (on average, an amino acid is ~100 Daltons)
Based on Gemini AI:
100 Dalton = 1.66054e-22 gram
Gemini AI performed the following division:
500/1.66054e-22 = 3.0110687e+24
3,011,068,700,000,000,000,000,000 amino acids in 500 grams of meat
2. Why do humans eat beef but do not become cows, eat fish but do not become fish?
Our cells are rebuilt from building block molecules such as amino acids.
When we eat beef or fish, these proteins are broken down by our digestive system into amino acids, fatty acids, and sugars, as the beef and fish tissues are made out of them. Our body can only absorb such small molecules, and our cells make new cells based on the instructions from our DNA. Beef and fish become new human cells and tissues.
3. Why are there only 20 natural amino acids?
The 20 natural amino acids are not included by accident. Doig argues that specific chemical reasons are why evolution favored them, so they are included. These amino acids were selected because they enabled the formation of stable and soluble proteins (Doig 2017). The 20 natural amino acids do not have redundancy. Due to the cost of making them, redundant simple amino acids are not included evolutionarily. Occupancy of a chemical space regarding size, charge, and hydrophobicity is also not random (Philip and Freeland 2011, Ilardo et al. 2015). Kirschning’s analysis highlights amino acid biosynthesis, central metabolic networks, and separate evolutionary tracks for amino acids and cofactors (Kirschning 2022). Amino acids do not need to be optimized for redox reactions, for example. So, evolutionarily, selection is structural rather than catalytic. As reported by experimental work by Shibue et al. and Newton et al., and additionally, a theoretical work by Bywater, to achieve better folding and structurally stable proteins, 20 amino acids are needed, not fewer. Fewer amino acids would not be ideal for stability and structural diversity in protein folds (Shibue et al 2018, Newton et al. 2018, Bywater 2018). Finally, codon saturation is another factor for having the 20 natural amino acids. Although two additional amino acids, 21st (selenocysteine), and 22nd (pyrrolysine) are known to exist and be incorporated in proteins in certain living systems.
References, Click to Expand
Doig, A. 2017. Frozen, but no accident—why the 20 standard amino acids were selected. FEBS J.
Ilardo, M., Meringer, M., Freeland, S., Rasulev, B. & Cleaves, H.J. 2015. Extraordinarily adaptive properties of the genetically encoded amino acids. Scientific Reports
Kirschning, A. 2022. On the evolutionary history of the twenty encoded amino acids. Chemistry
Shibue, R., Sasamoto, T., Shimada, M., Zhang, B., Yamagishi, A. & Akanuma, S. 2018. Comprehensive reduction of amino acid set in a protein suggests the importance of prebiotic amino acids for protein function. Scientific Reports
Newton, M. S., D. J. Morrone, K-H Lee, and B. Seeling. 2018. Genetic code evolution investigated through the synthesis and characterisation of proteins from reduced-alphabet libraries. ChemBioChem*
Bywater, R.P. 2018. Why twenty amino acid residue types suffice(d) to support all living systems. PLoS One
I’ve searched Google Scholar and researched Claude.
Prompts:
Why are there only 20 natural amino acids?
Can you review reference papers? Include additional insights from other papers as well. Papers were uploaded: Doig 2017 and Kirschning 2022.
4. Can you make other non-natural amino acids? Design some new amino acids.
For this, I’ve started by building an interactive amino acid design tool in Claude. I then ask Claude AI to design the non-natural amino acid. I focused on applying the new non-natural amino acid as a probe in a biomedical imaging application.
The designer tool enables non-natural amino acids to have multiple chemistries, including photoactivation by light that makes the amino acid bioavailable on demand and a reporter attachment for detectability.
Amino Acid Designer Tool
The designer tool requires an Anthropic API key to run interactively.
What the designer tool does:
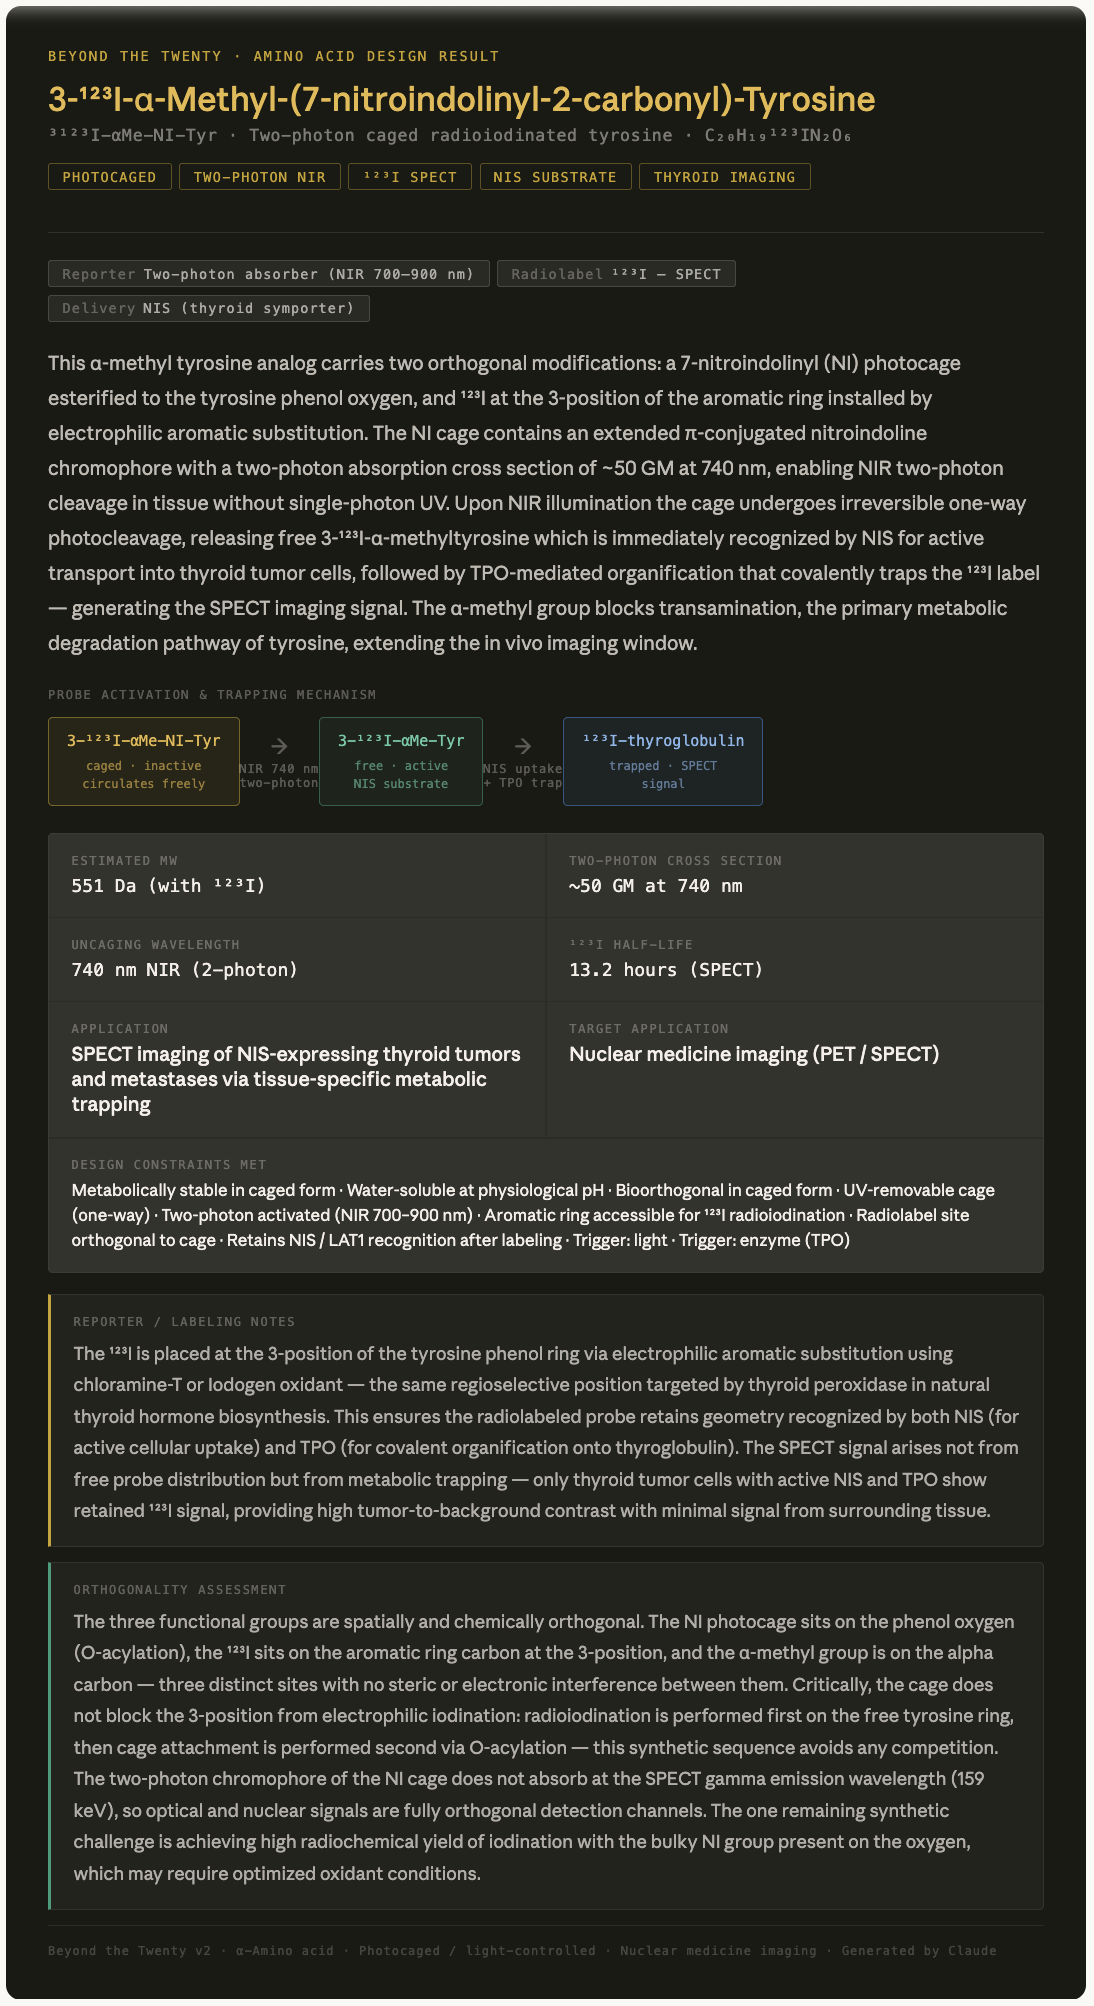
Reporter / labelling notes: AI explains specifically where on the molecule the label attaches, what signal it produces, and key in vivo considerations.
Orthogonality assessment: AI evaluates whether the combined chemistries (cage, reporter, radiolabel, handle) are mutually compatible and identifies any potential interference or synthetic challenge.
I’ve chosen to design an imaging probe for the purpose of detecting thyroid tumors specifically.
AI will help to generate a tyrosine analog with the given considerations:
The probe should be based on a tyrosine, as tyrosine is used along with iodine to make thyroid hormones in the thyroid. The standard amino acid backbone is suitable for uptake by the LAT1 transporter, and thyroid peroxidase (TPO) activity, which covalently attaches iodine to tyrosine, trapping it in the thyroid.
The probe should have a one-way photo-caged/light-controlled chemistry. It is activated by light, which causes the cage to be cleaved, and tyrosine becomes available as a substrate for TPO. The circulating probe accumulates in the thyroid. Signal becomes greater than background noise, better precision detection.
The probe should have the two-photon chromophore, as activated by NIR light, more effective in deeper tissues than a one-photon activation mechanism.
The probe should have a radiolabelled isotope, such as ¹²³I, for traceability through isotope decay after metabolic trapping in the thyroid tissue. ¹²³I is ideal because the thyroid has a sodium-iodide symporter (NIS) that actively pumps iodide into the cells.
Example: two-photon photocaging tyrosine analog (3-¹²³I-α-Methyl-(7-nitroindolinyl-2-carbonyl)-Tyrosine)
Fully designed result card.
I used Claude AI research to generate the interactive tool.
Prompts:
Can you build an interactive design tool to make non-natural amino acids?
Can you research why tyrosine was specifically picked for imaging the thyroid? Why not other amino acids?
Can you research the two-photon uncaging of tyrosine analogs for the detection of small tumors based on metabolic activation of tyrosine in the thyroid?
Could 123I-labelled tyrosine analogs provide new advantages over existing probes for imaging the thyroid?
5. Where did amino acids come from before enzymes that make them, and before life started?
6. If you make an alpha-helix using D-amino acids, what handedness (right or left) would you expect?
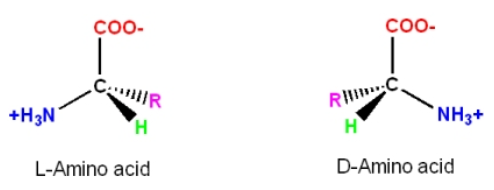
D-amino acids would assume left-handed alpha-helical structures.
In D-amino acids, because of the side chain ‘R’ positioning in relation to the alpha C atom, as shown in the image below, the turn in a helical structure occurs counterclockwise, placing the side chain toward the center backbone of the helix and resulting in steric hindrance.
Although forming helices with D-amino acids is not favorable, there are still ways to achieve left-handed helices’ stability. As reported in the methods for incorporating the D-amino acids into peptides, superior performance and better therapeutic outcomes were achieved with the peptides incorporating the D-analogs (Annavarapu and Nanda 2009, Garton et al. 2018).
References, Click to Expand
Annavarapu, S. and V. Nanda. 2009. Mirrors in the PDB: left-handed alpha-turns guide design with D-amino acids. BMC Structural Biology.
Garton, M. S. Nim, T. A. Stone, K. E. Wang, C. M. Deber, and P. M. Kim. 2018. Method to generate highly stable D-amino acid analogs of bioactive helical peptides using a mirror image of the entire PDB. PNAS.
I’ve researched Claude.
Prompts:
Can you research D-amino acids making alpha-helices?
Explain the handedness in L and D amino acids
7. Can you discover additional helices in proteins?
It is possible to discover additional helices in proteins. Other helical structures have been reported in proteins, in addition to the most common alpha helices.
As a short segment in global proteins, the 310 helix exists in nature, as demonstrated in the structure of a fungal peptide (Karle et al. 2003).
Another helix is the Pi helix, which typically forms by bulging from a long alpha helix and is associated with functional sites in proteins (Cooley et al. 2003).
A few others are polyproline II helix (PPII), polyproline I helix (PPI), and collagen triple helix, in which helical strands bundle and twist together to form a triple helix. (Hollingsworth and Karplus 2010).
A beta helix is another one that can form either left- or right-handed helices. It is a tandem protein with a repeat structure (Eisenberg 2003).
Although never observed in nature, but possible, the gamma helix was proposed as a model by Pauling et al. in 1951, and is reviewed in the historical timelines by Eisenberg (Eisenberg 2003).
References, Click to Expand
Eisenberg, D. 2003. The discovery of the alpha-helix and beta-sheet, the principal structural features of proteins. PNAS.
Karle, I. L., J. Flippen-Anderson, M. Sukumar, and P. Balaram. 1987. Confirmation of a 16-residue zervamicin IIA analog peptide containing three different structural features: a 310-helix, alpha-helix, and beta-bend ribbon. PNAS.
Cooley, R. B., D. J. Arp, and P. A. Karplus. 2010. Evolutionary origin of a secondary structure: pi-helices as cryptic but widespread insertional variations of alpha-helices that enhance protein functionality. J of Mol Bio.
Hollingsworth, S. A. and P. A. Karplus. 2010. A fresh look at the Ramachandran plot and the occurrence of standard structures in proteins. BioMol Concepts.
I’ve researched Claude.
Prompts:
Can you research the discovery of additional helices in proteins?
What are the known helices discovered so far?
8. Why are most molecular helices right-handed?
Most commonly found right-handed helices consist of left-handed amino acids and the right-handed sugars (Blackmond 2010). Biology favored this form of helix due to the structural stability provided by strong cooperativity effects of electrostatic interactions (Liu 2020).
Amino acids exist in chiral forms, L- and D-forms, where the alpha C atom has an ‘R’ side chain positioned asymmetrically. L-amino acid makes a clockwise turn in a helix, positioning the side chain ‘R’ away from the center backbone of the helix. By doing so, it avoids structural hindrance and is energetically favored. On the other hand, the positioning of the side chain in a left-handed helix would be much closer to the backbone, causing steric hindrance and not being energetically favorable.
L-amino acid became more abundant than the other chiral form, D-amino acid. There have been various hypotheses that explain this, such as in the kinetic theory, a faster production rate and slower depletion in a reaction could lead to a dominance of one form, which may have happened in the early history of the Earth.
Another is the parity violation hypothesis. In this view, although the effect imposed by the weak energy difference is very small, weak energy differences may have favored the reactions of one chirality over the other.
The most recent view considers the chirality hierarchy, which states that the chirality of helices dictates the abundance of the stereochemistry of the lower ones, amino acids, and sugars (Liu 2020).
Liu, S. 2020. Homochirality originates from the handedness of helices. (J Phys Chem Lett).
I’ve researched Claude.
Prompts:
Can you research the reasons why most molecular helices are right-handed?
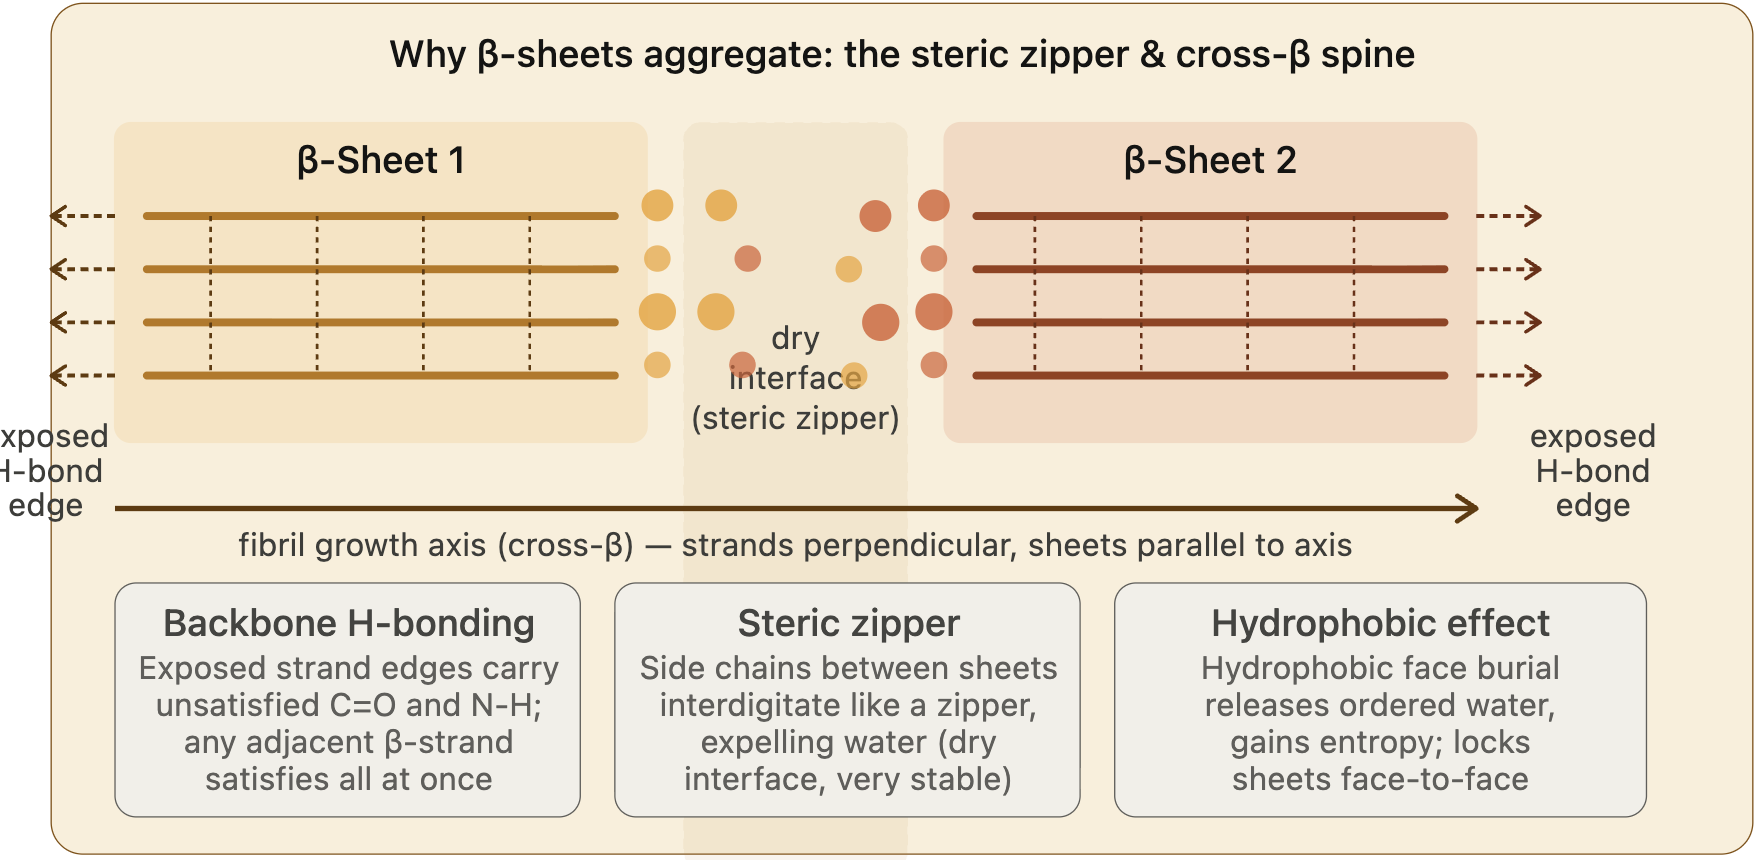
9. Why do B-sheets tend to aggregate?
What is the driving force for B-sheet aggregation?
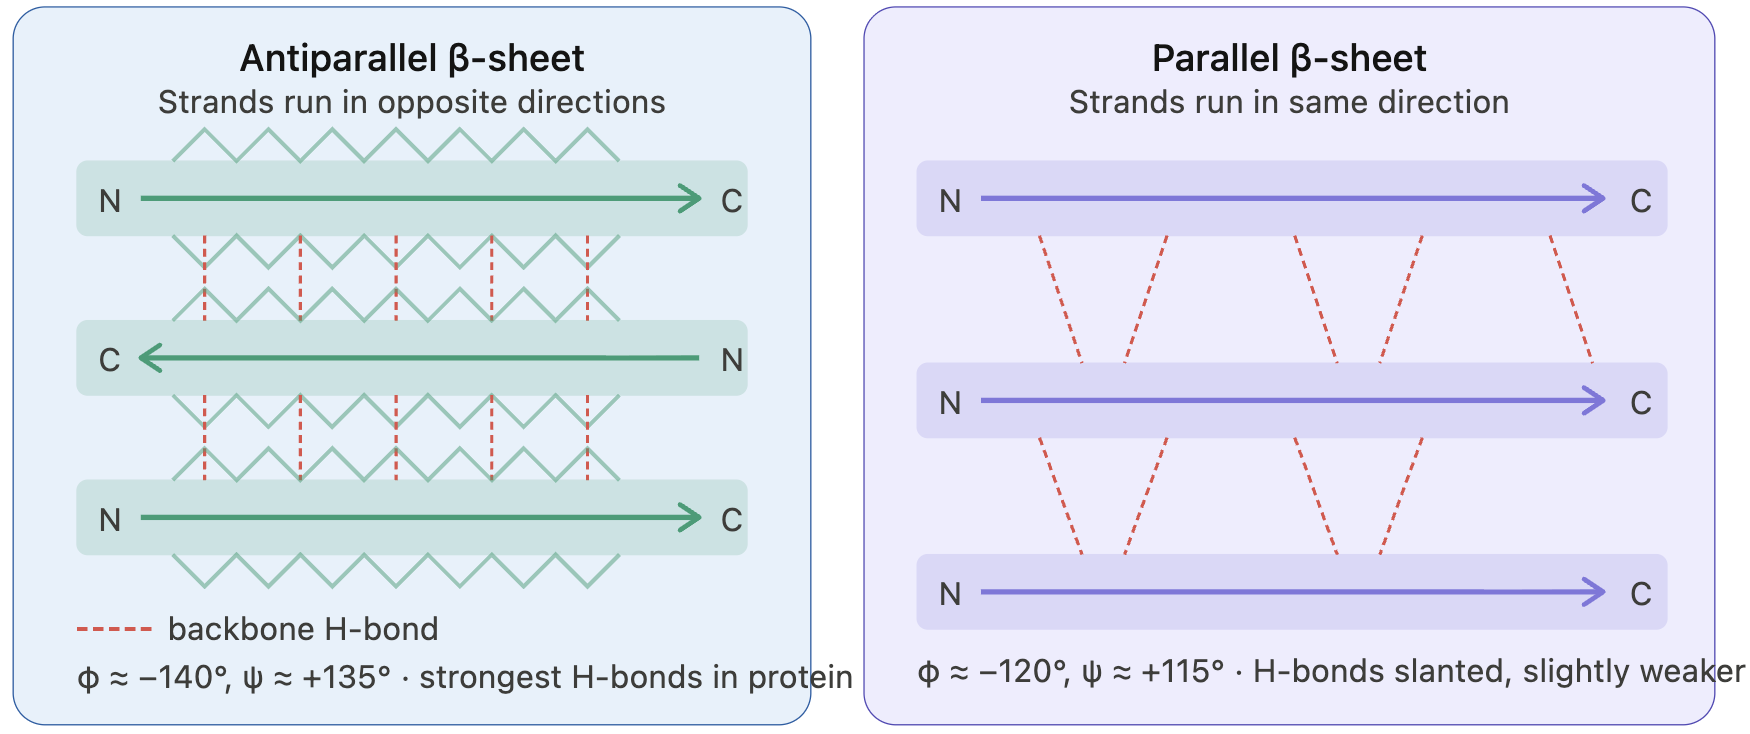
Beta-sheets formed by beta-strands are amphipathic; that is, they have two distinct behavioral characteristics: a hydrophobic core and a hydrophilic surface.
Beta-strands connect via backbone hydrogen bonds. As beta-strands lie alongside, the alpha C atoms of each strand sit across each other. Positioning of the side chains occurs in an alternating pattern, creating an amphipathic character with one side more hydrophobic and the other side more hydrophilic.
Because beta-strands lie side by side and connect, the edge strand is “exposed”. The edge strand has unsatisfied hydrogen donors and wants to connect to form hydrogen bonds. This is known as the open edge, or the “edge strand problem”. Even though a new docking strand satisfies hydrogen donors, it becomes the edge strand with unsatisfied hydrogen donors. So, due to this geometry, beta-sheets tend to form aggregates, and their open edge primarily drives protein aggregation.
Other types of interactions are also known to drive aggregation: hydrophobicity and steric zipper, which is the effect of side chains between beta-sheet proteins that create a dry interface, allowing beta-sheets to grow in parallel to the axis.
I’ve researched Claude.
Claude provided the figure.
Prompts:
Can you research the reasons beta-sheets tend to aggregate?
What is a beta-sheet protein?
10. Why do many amyloid diseases form B-sheets?
Amyloid diseases, such as Alzheimer’s, are associated with the formation of fibrils and protein aggregates.
Once misfolded, the protein’s hydrophobic regions are exposed, and this triggers a self-assembly process, resulting in aggregates (amyloid fibrils) that are highly organized, rich in beta-sheet structures, and stable, achieved through an intramolecular hydrogen bonding network. In contrast, in the native state, proteins achieve stability by hydrophobic interactions via side chains.
There is no sequence dependency, as any protein can participate in hydrogen bonding. The native fold goes through misfolding and some destabilization, in which backbone hydrogen bonding can occur at this stage.
Dimerization of the monomers is the key step for locking the misfolding. As shown by Lv et al., monomers lead to cooperative formation of beta-sheet conformation and dimerization, which is thought to stabilize the misfolded state (Lv et. al. 2013).
The aggregate grows slowly until it becomes thermodynamically more stable, which occurs at a critical nucleus size (Tsemekhman et al. 2009).
Once a nucleus forms, monomers join the fibril ends rapidly, growing in parallel to the fibril axis. As in the state of an amyloid fibril, each new beta strand satisfies all hydrogen bonds. The amyloid state is thermodynamically more stable than the native state of the protein.
Can you use amyloid B-sheets as materials?
There are many applications reported for the use of amyloid beta-sheets. The field is expanding to include environmental remediation, biomedical, sustainable materials, and food proteins.
Amyloid fibrils provide a rigid surface and resistance to chemicals, provided by highly dense hydrogen bonds, and coded by a specific peptide sequence.
A few examples as materials:
Bioplastic, amyloid-based material development from plant protein sources (Li et al. 2024).
Conductive aerogels with sensing properties development. Han et al. demonstrated that in situ polymerization of amyloid fibrils as scaffolds coats the conductive polymer, polypyrrole, creating a porous, conductive network, enabling pressure sensing, strain sensing, and potential wearable electronics applications. (Han et al. 2020).
References, Click to Expand
Lv, Z., R. Roychaudhuri, M. M. Condron, D. B. Teplow, and Y. L. Lyubchenko. 2013. Mechanism of amyloid β-protein dimerization determined using single-molecule AFM force spectroscopy. Scientific Reports.
Tsemekhman, K., L. Goldschmidt, D. Eisenberg, and D. Baker. 2009. Cooperative hydrogen bonding in amyloid formation. Protein Science.
Li, T., J. Kambanis, T. L. Sorenson, M. Sunde, and Y. Shen. 2024. From Fundamental Amyloid Protein Self-Assembly to Development of Bioplastics. Biomacromolecules.
Han, Y., Y. Cao, S. Bolisetty, T. Tian, S. Handschin, C. Lu, and R. Mezzenga. 2020. Amyloid Fibril‐Templated High‐Performance Conductive Aerogels with Sensing Properties. Small.
I’ve researched Claude.
Claude provided the figure.
Prompts:
Can you research why many amyloid diseases form beta-sheets?
Show me research findings about protein misfolding triggering highly organized beta-sheet formation.
What determines a misfolded protein to adopt a beta-sheet structure? What is the force behind this event?
Can you research to find examples and use cases for amyloid beta-sheets as materials?
11. Design a B-sheet motif that forms a well-ordered structure.
Part B. Protein Analysis and Visualization
1. Briefly describe the protein you selected and why you selected it.
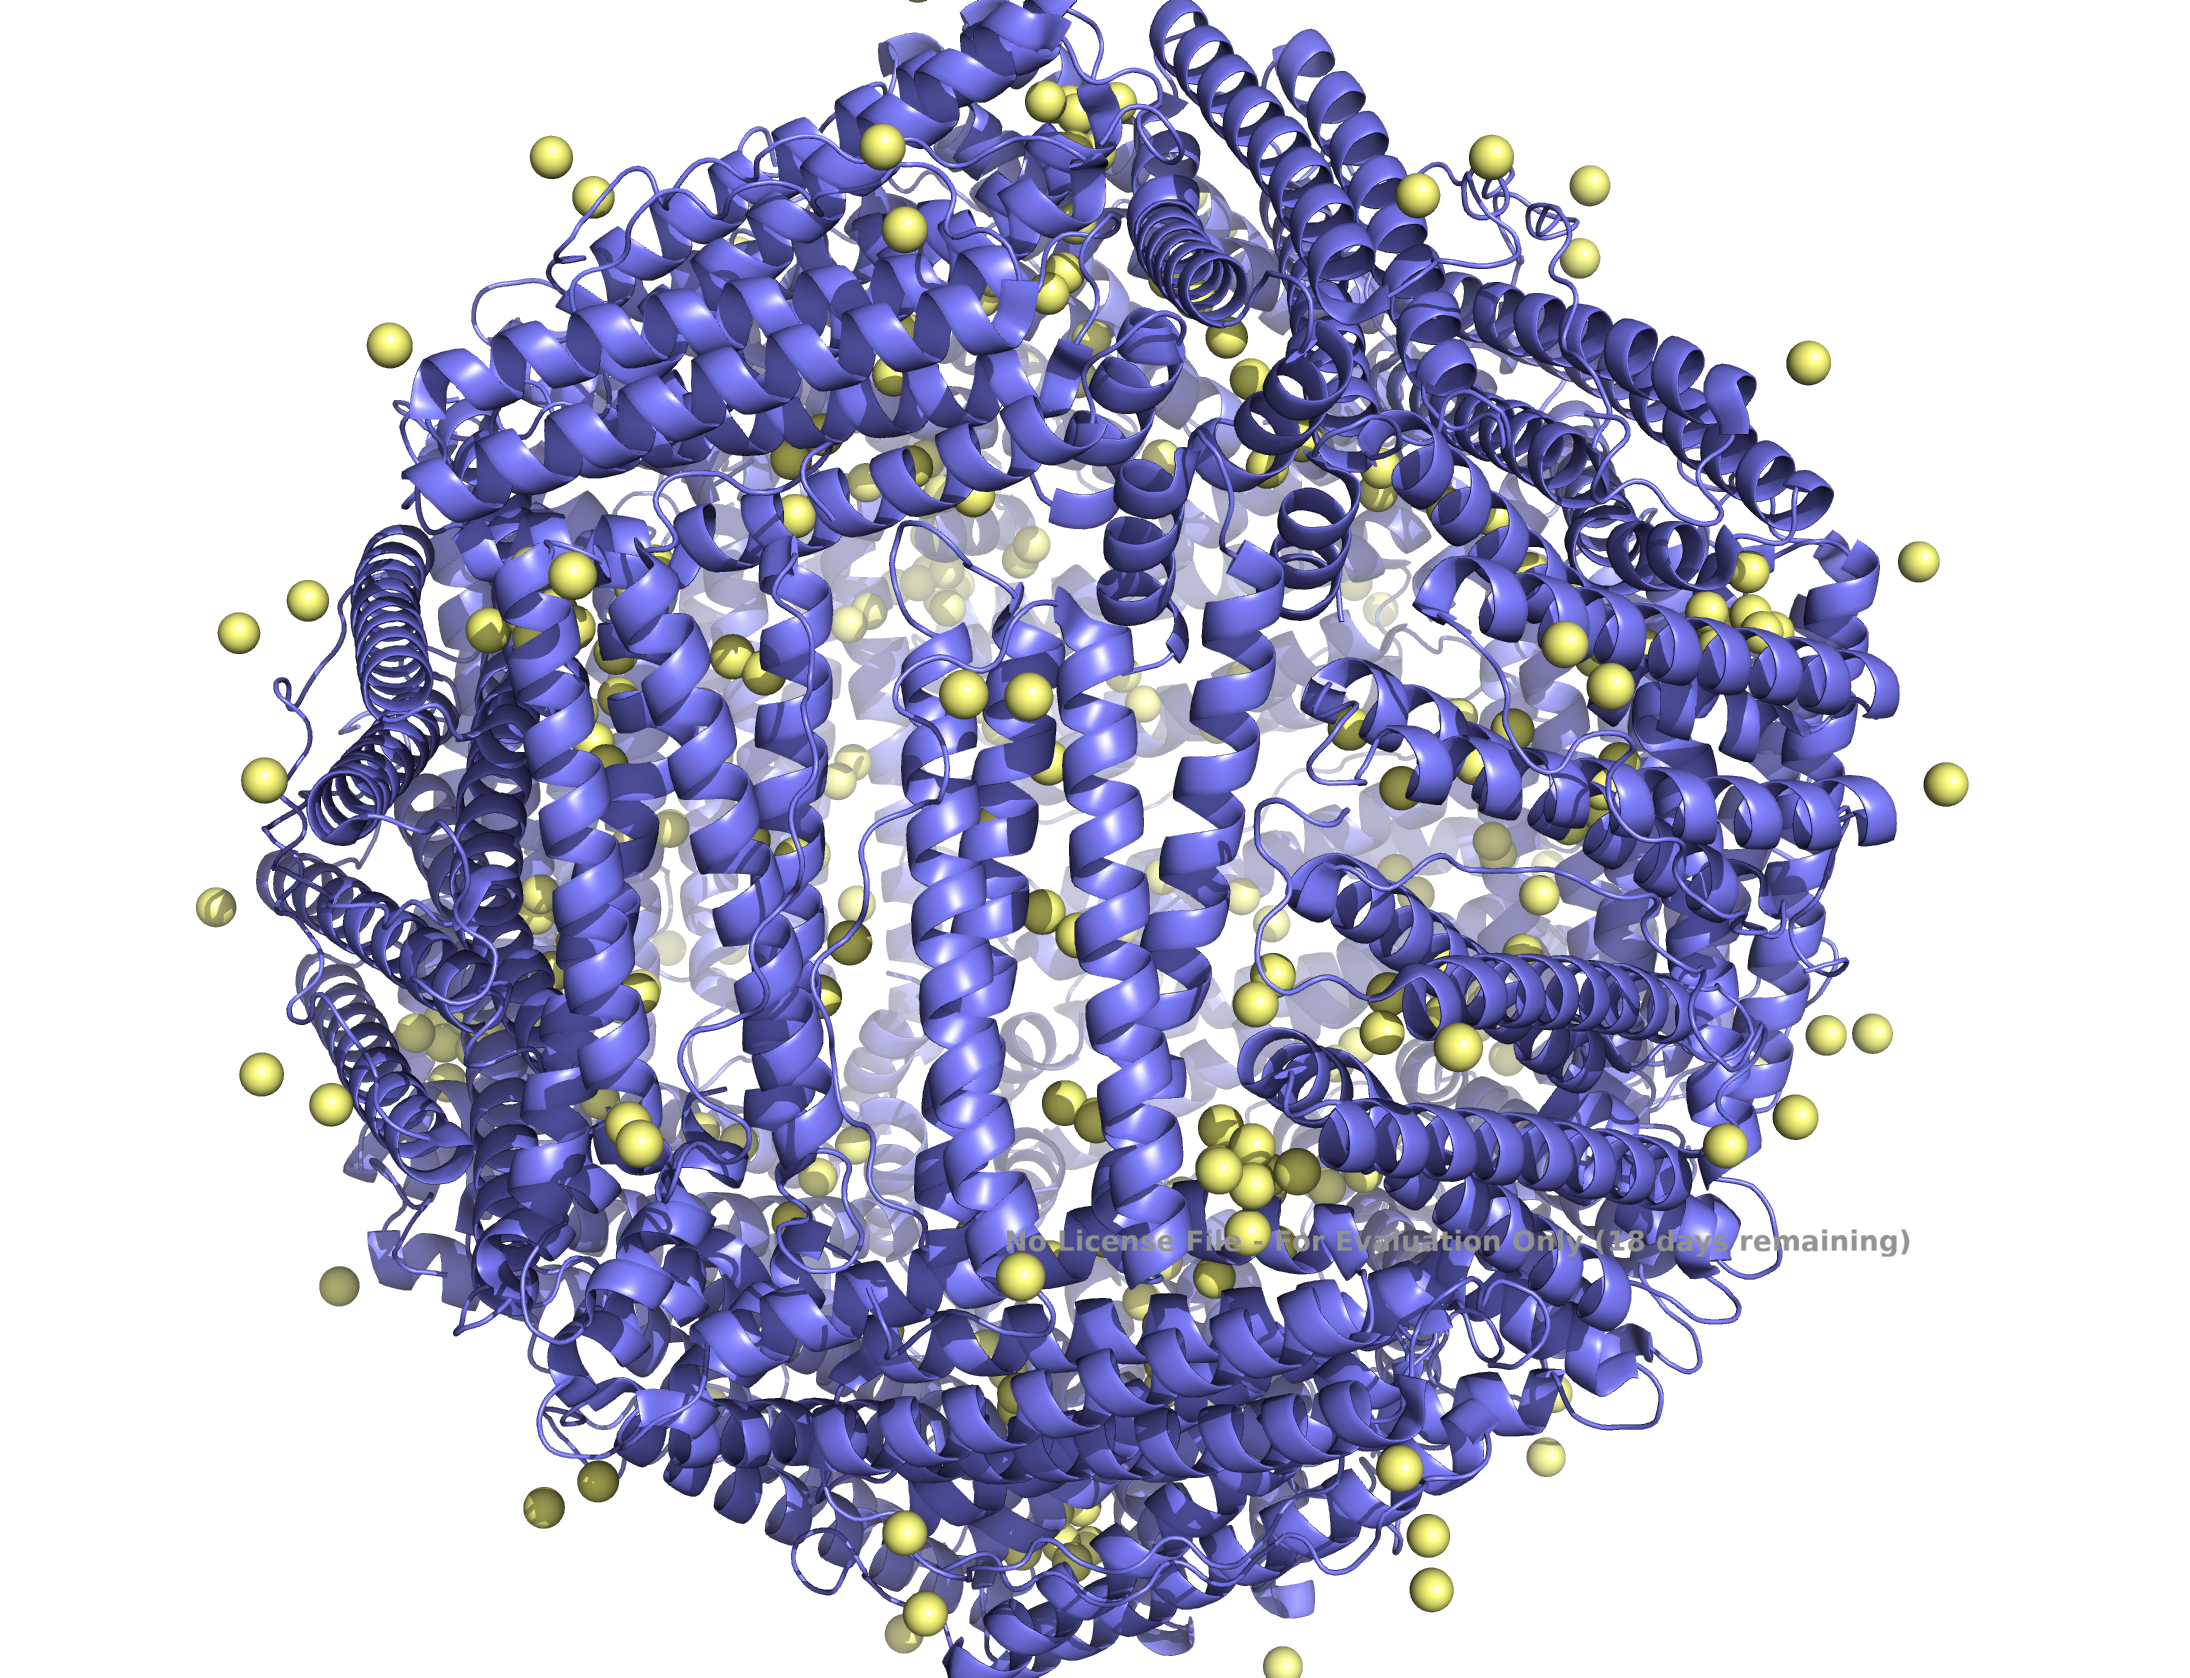
I selected the human ferritin protein, the major iron-storage protein, which is present in all cells, and its structure has been solved (Wang et al. 2006). It consists of 24 self-assembled subunits, light (L-ferritin) and heavy (H-ferritin) chains. Mutations in the L-ferritin gene (FTL gene) are reported to be associated with five different diseases (Cadenas et al 2019).
L-ferritin is the target analyte for the body’s iron status. I’ve proposed an aptasensor-based detection of ferritin as one of the possible final projects, and I want to deepen my understanding of this protein, which will help develop the design of the aptasensor project.
References, Click to Expand
Wang, Z., C. Li, M. Ellenburg, E. Soistman, J. Ruble, B. Wright, J. X. Ho, and D. C. Carter. Structure of human ferritin L chain. 2006. Structural Biology
Cadenas, B. J. Fita-Torro, M. Bermudez-Cortes, I. Hernandez-Rodriguez, J. Luis Fuster, M. E. Llinares, A. M. Glaera, J. L. Romero, S. Perez-Montero, C. Tornador and M. Sanchez. L-Ferritin: one gene, five diseases; from hereditary hyperferritinemia to hypoferritinemia-report of new cases. 2019. Pharmaceuticals
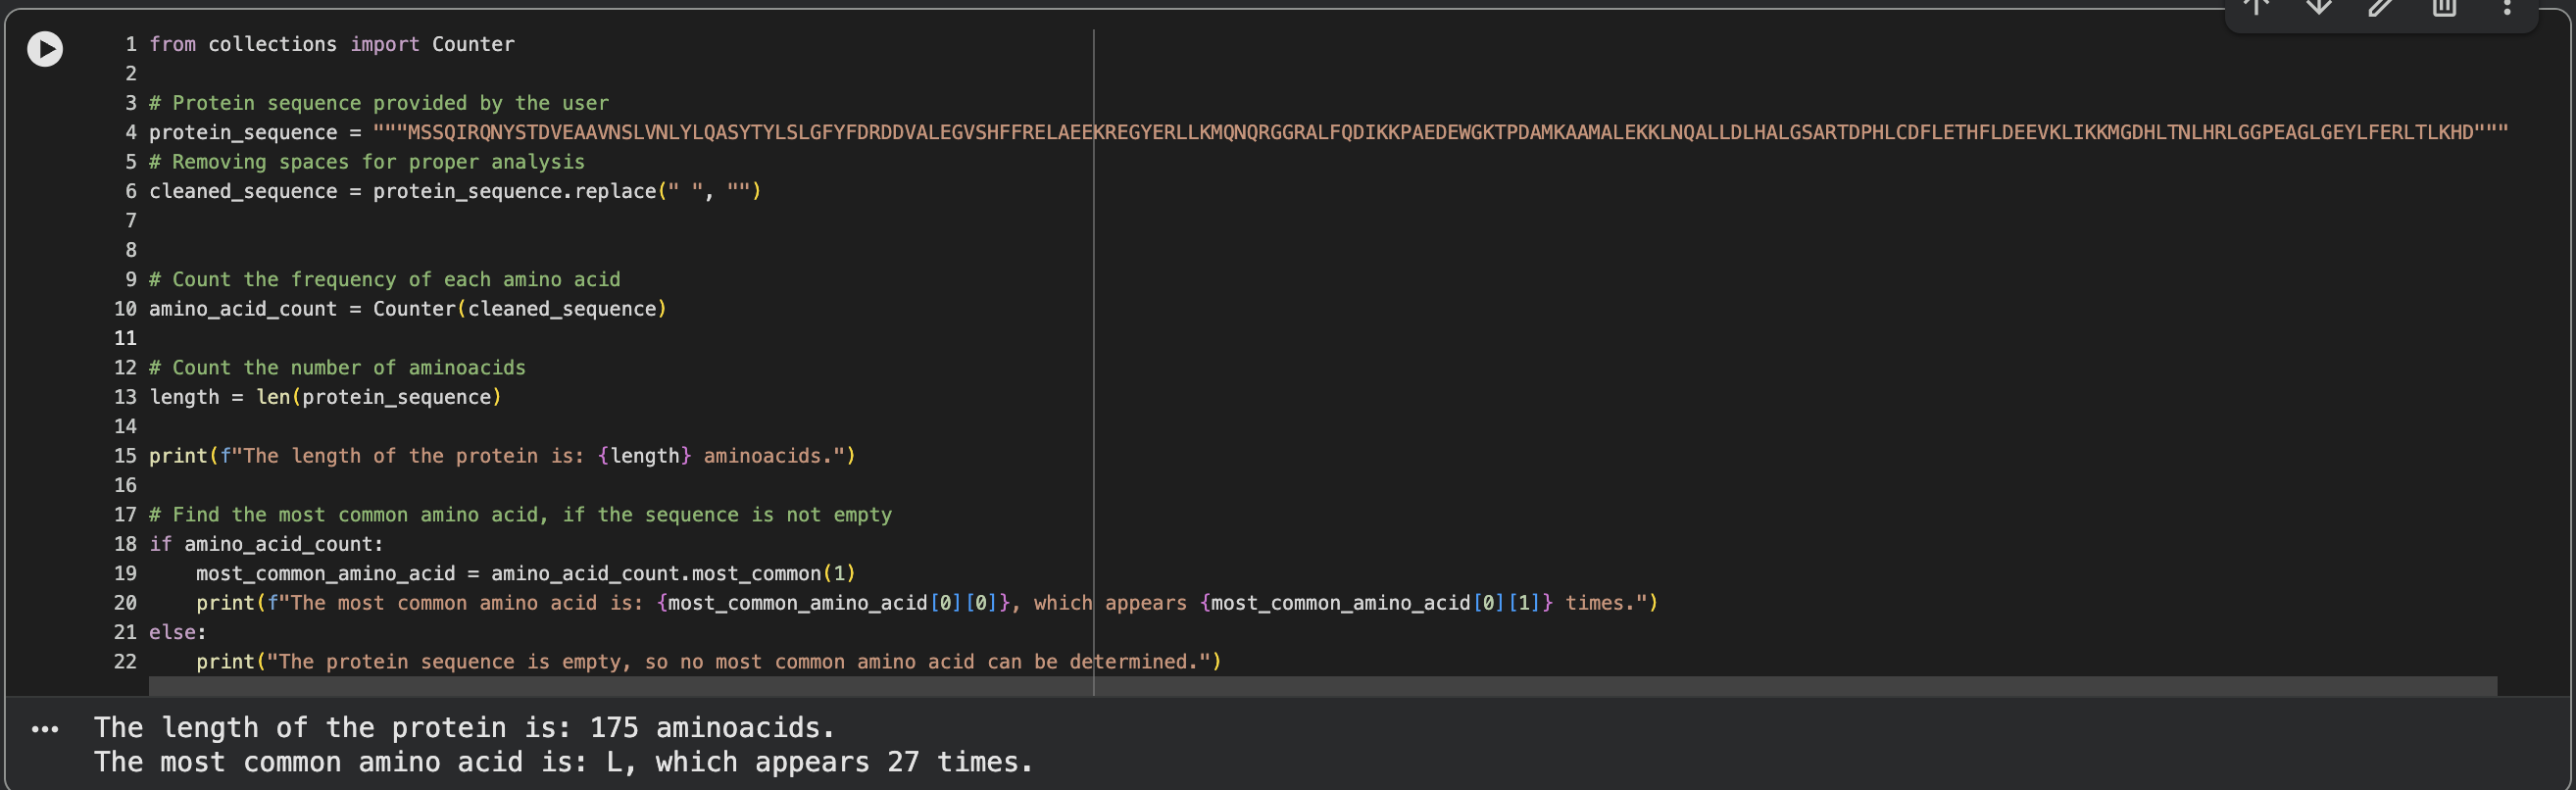
2. Identify the amino acid sequence of your protein.
Search term: human light chain ferritin, metal-binding protein
Protein ID: 2FG4 (pdb_00002fg4)
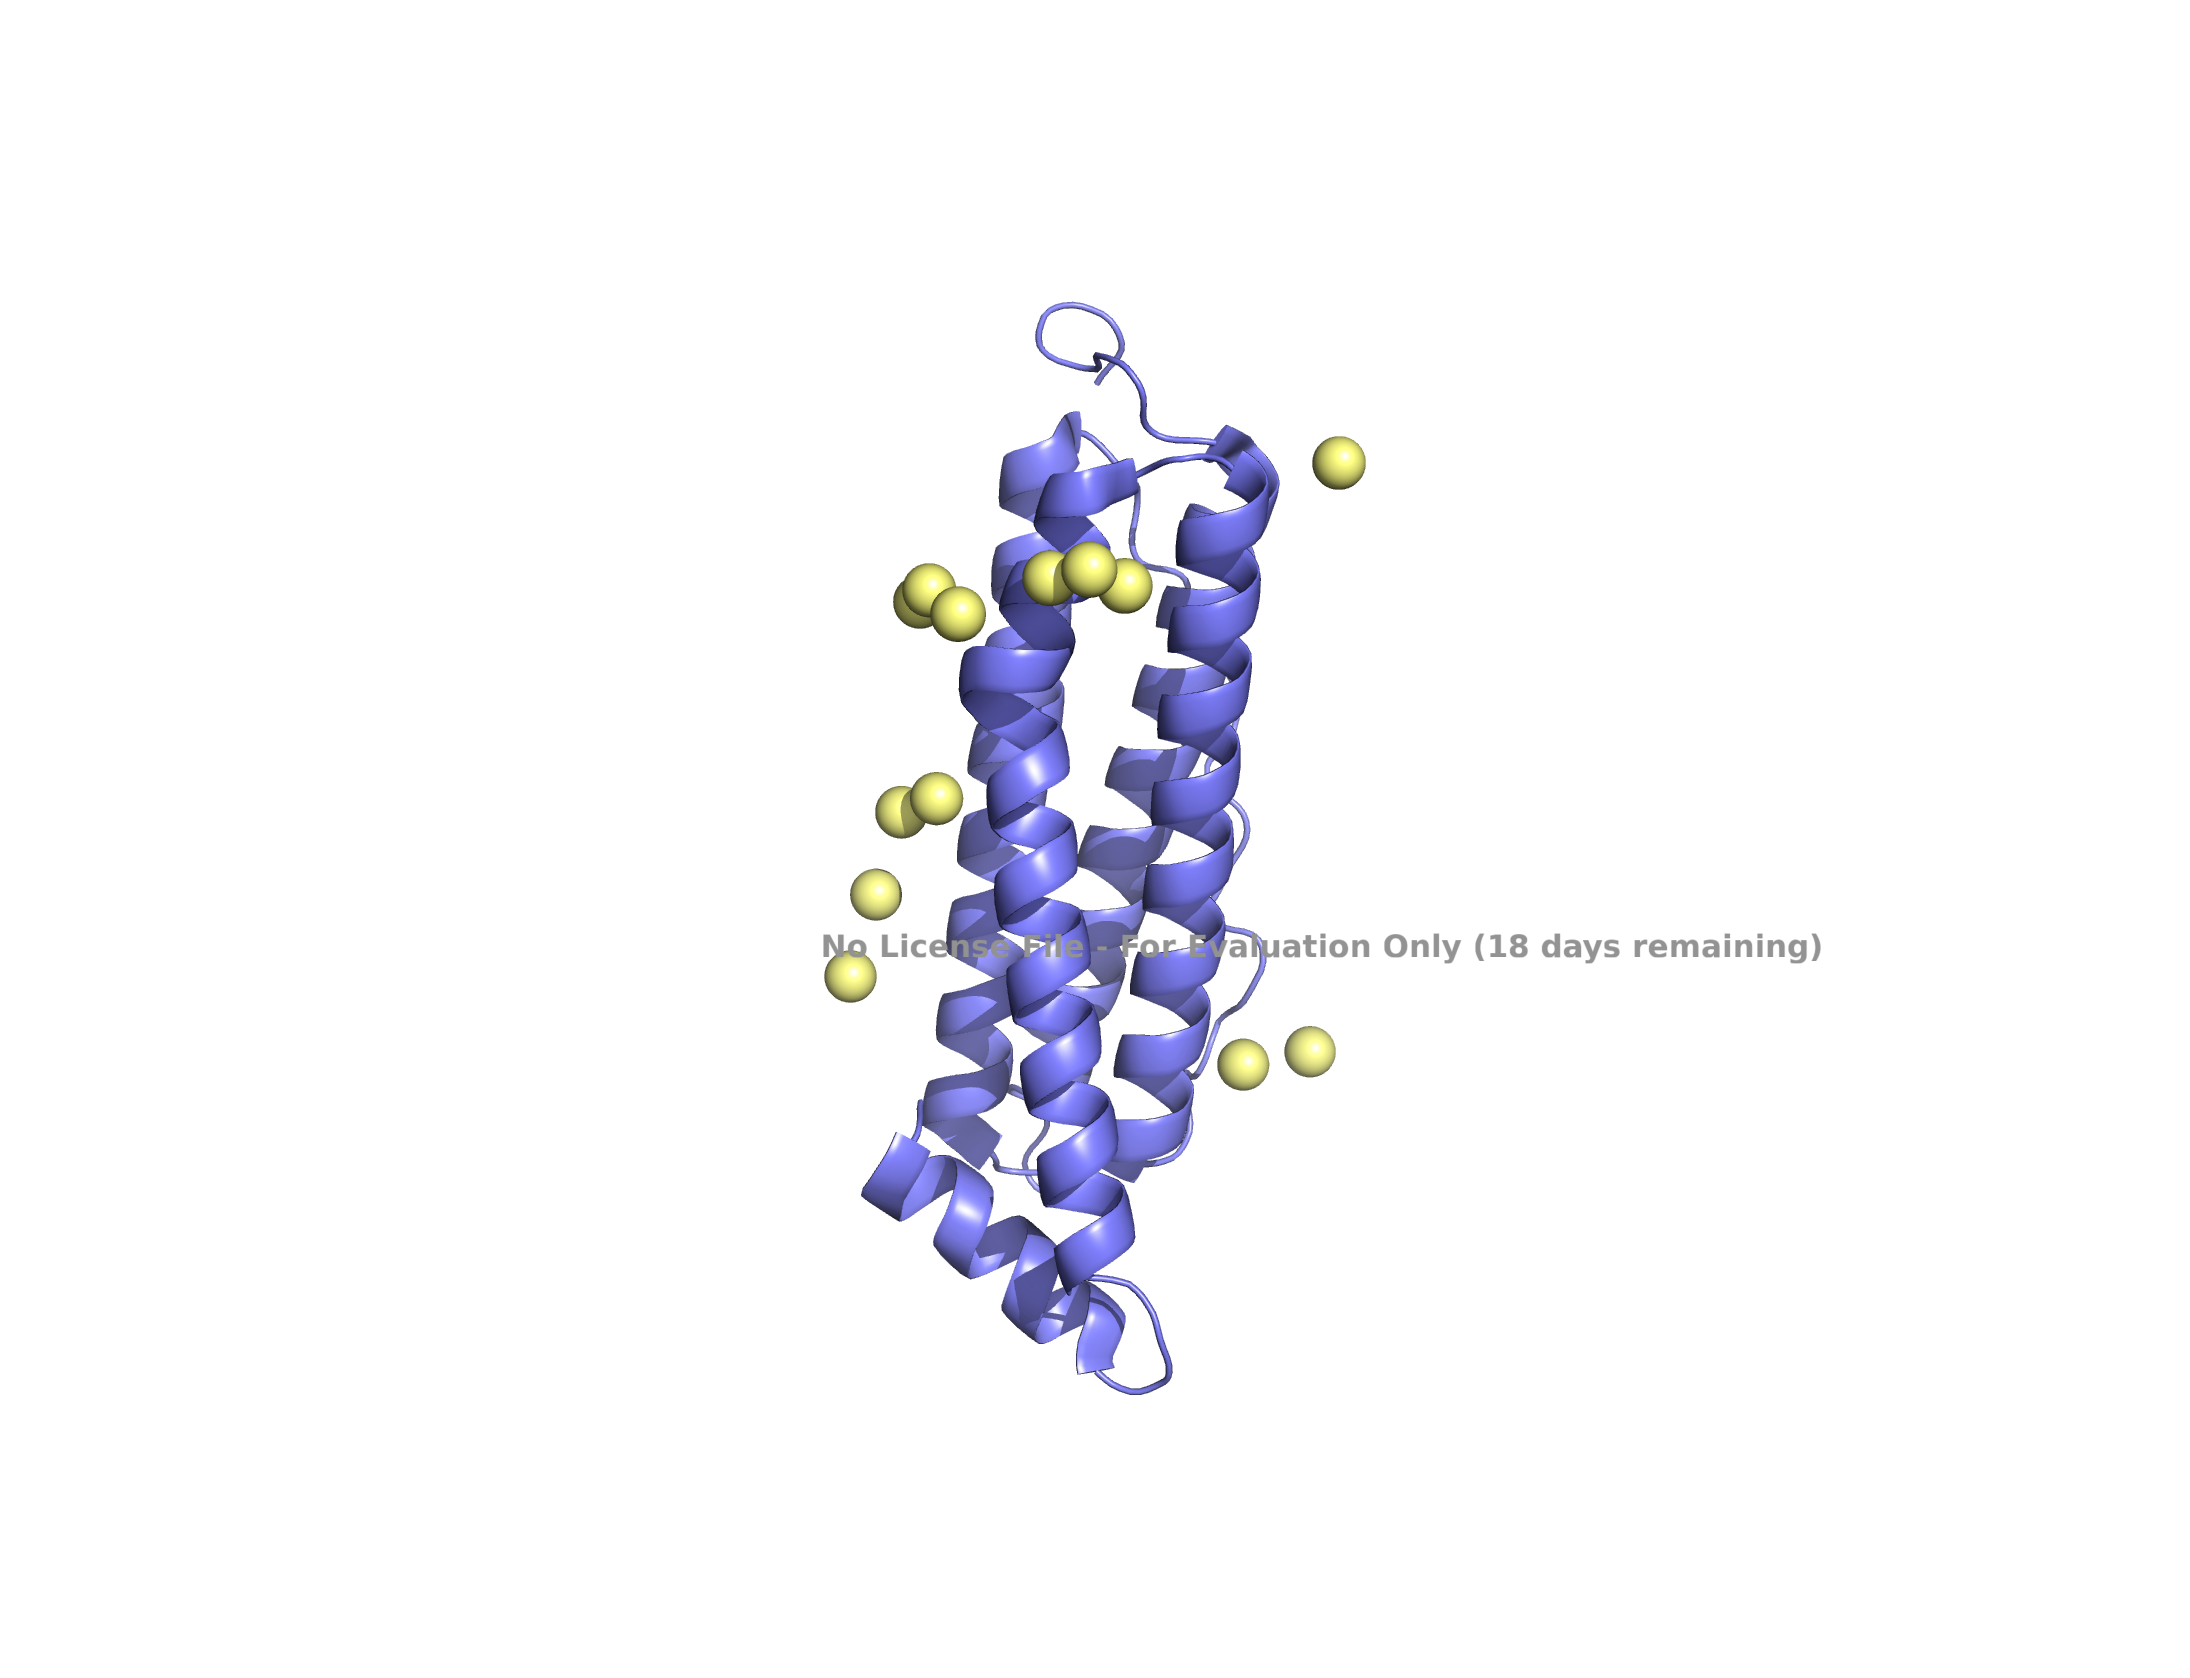
(A) ferritin light chain subunit
(B) self-assembled 24 subunits
Structure of the human ferritin L chain visualized by PyMol, shown as a single subunit in (A) and 24 self-assembled subunits in (B). Transient metal cadmium ions are shown in ball & stick model mimicking the iron binding sites entering into the ferritin channel.
When was the structure solved?
Is it a good-quality structure?
The structure of the human ferritin L chain was solved in 2006 with a resolution of 2.10 Å, indicating that the structure is of good quality.
Are there any other molecules in the solved structure apart from protein?
Transient metal, cadmium ions, are found in the solved structure. Cadmium ions with a similar charge to iron indicate the route to the iron-binding cavity.
Does your protein belong to any “structure classification family”?
The human ferritin L chain belongs to the ferritin-like superfamily proteins.
4. Open the structure of your protein belong in any 3D molecule visualization software.
PyMol protein visualization
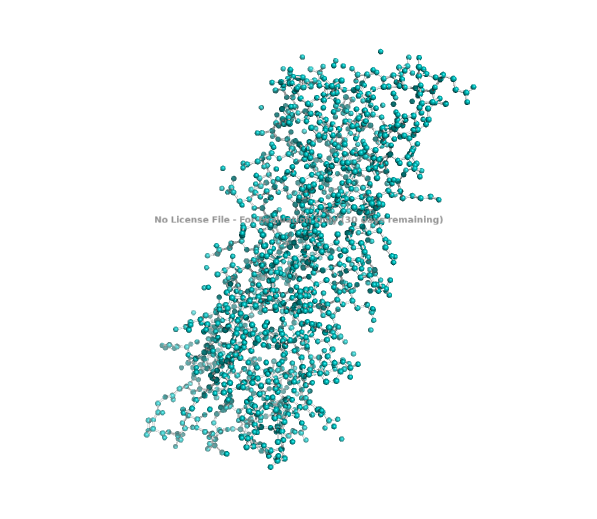
Visualize the protein as “cartoon,” “ribbon,” and “ball and stick.”
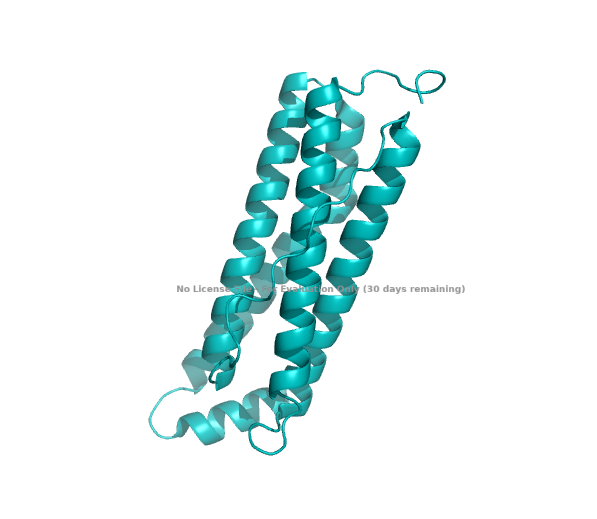
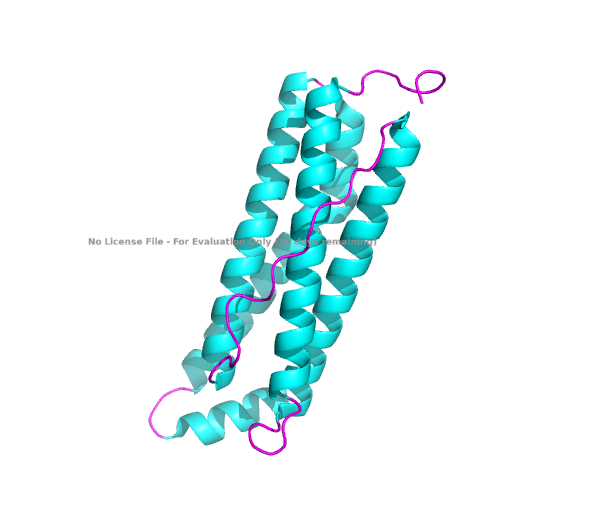
Color the protein by secondary structure. Does it have more helices or sheets?
Color the protein by residue type. What can you tell about the distribution of hydrophobic vs hydrophilic residues?
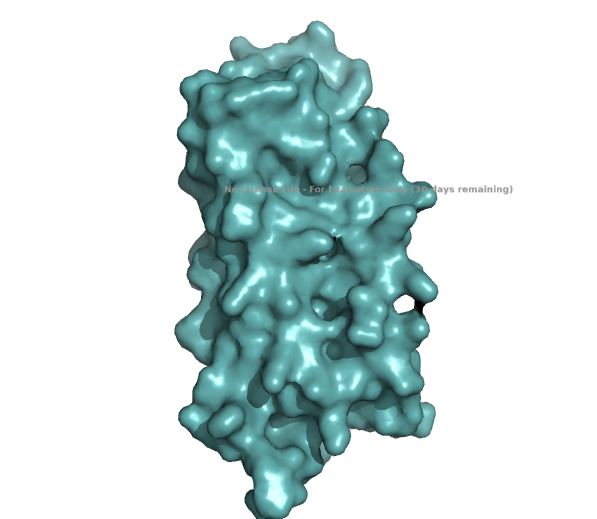
Visualize the surface of the protein. Does it have any “holes” (aka binding pockets)?
(A) cartoon
(B) ribbon
(C) stick & ball
(D) secondary structures
(E) hydrophobic / hydrophilic
(F) surface
The structure of the human ferritin light chain is visualized in PyMol. Images on the top are the protein structure in a cartoon diagram (A), in a ribbon diagram (B), and in a ball and stick diagram (C). Images on the bottom are highlighting the secondary structures, helices (teal) and loops (magenta) (D), highlights in hydrophobic (yellow) and hydrophilic (blue) residues (E), and highlighting the surface (F).
The human ferritin light chain. PDB Protein ID: 2FG4
Visualization of the structure of the human ferritin light chain revealed the presence of secondary structures, like helices and loops, and the absence of beta sheet structures.
The surface visualization shows small holes and pockets for metal ion binding.
Part C. Using ML-Based Protein Design Tools
C1. Protein Language Modeling
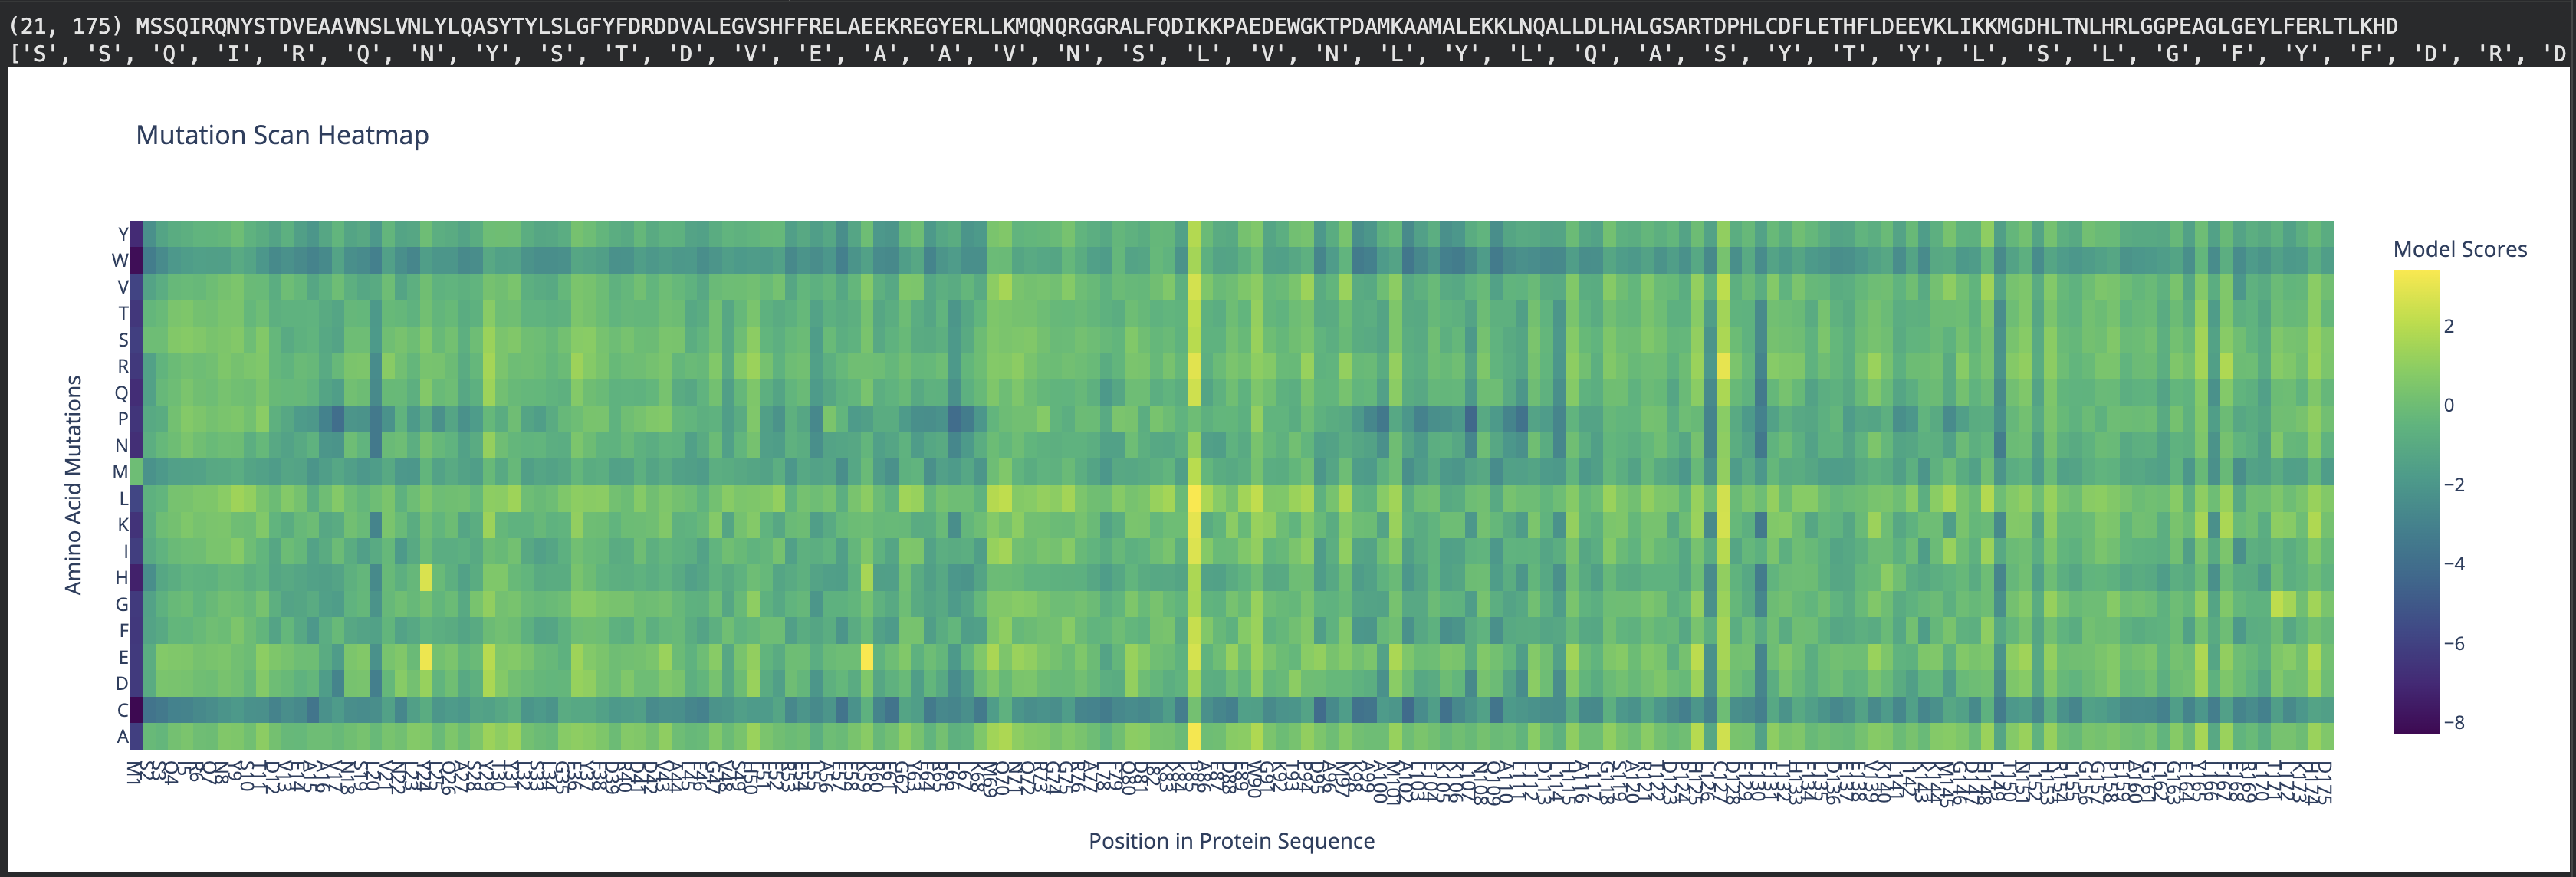
1. Deep Mutational Scans
Use ESM2 to generate an unsupervised deep mutational scan of your protein based on language model likelihoods.
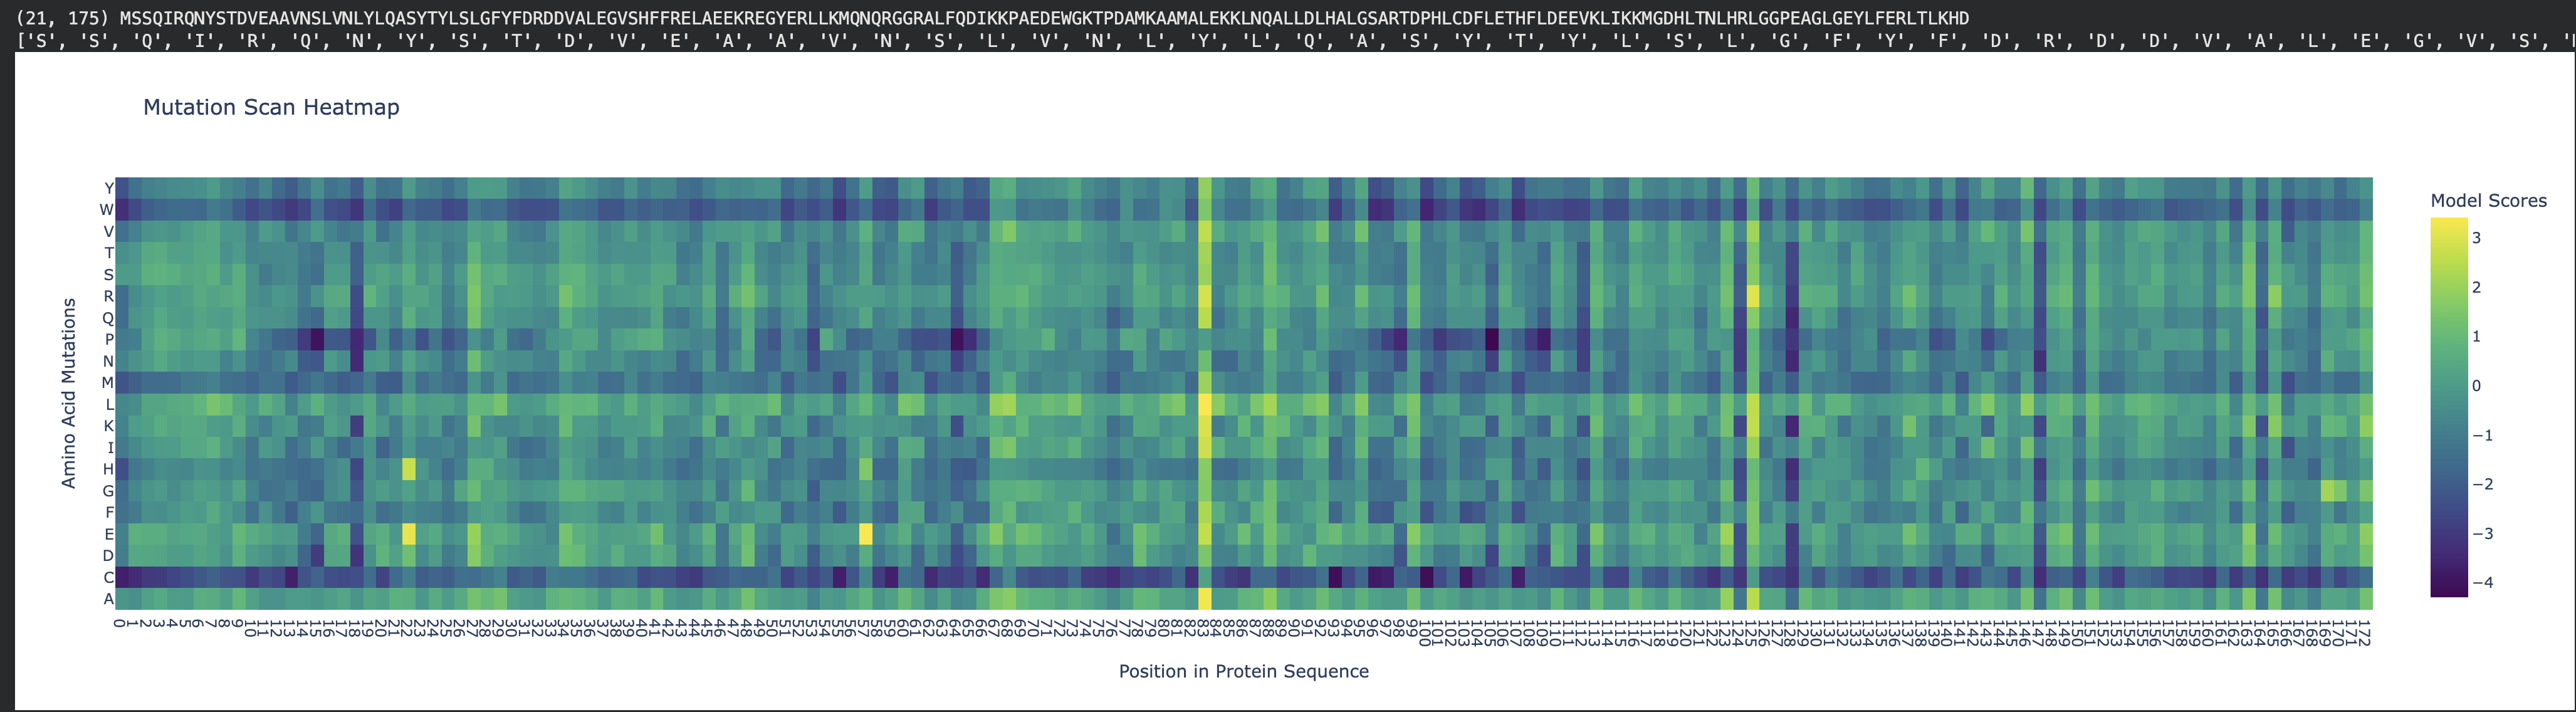
Fig 1. Mutation heat map. Human ferritin light chain.
Can you explain any particular pattern? (choose a residue and a mutation that stands out)
To address this question, first, with the AI’s help, I’ve re-created the x-axis to display the naming of residues, starting with methionine, from 1 to 175. This allowed easy identification of the residue of interest (see Fig 2).
Fig 2. Mutation scan heatmap displaying x-axis with residue naming. Human ferritin light chain.
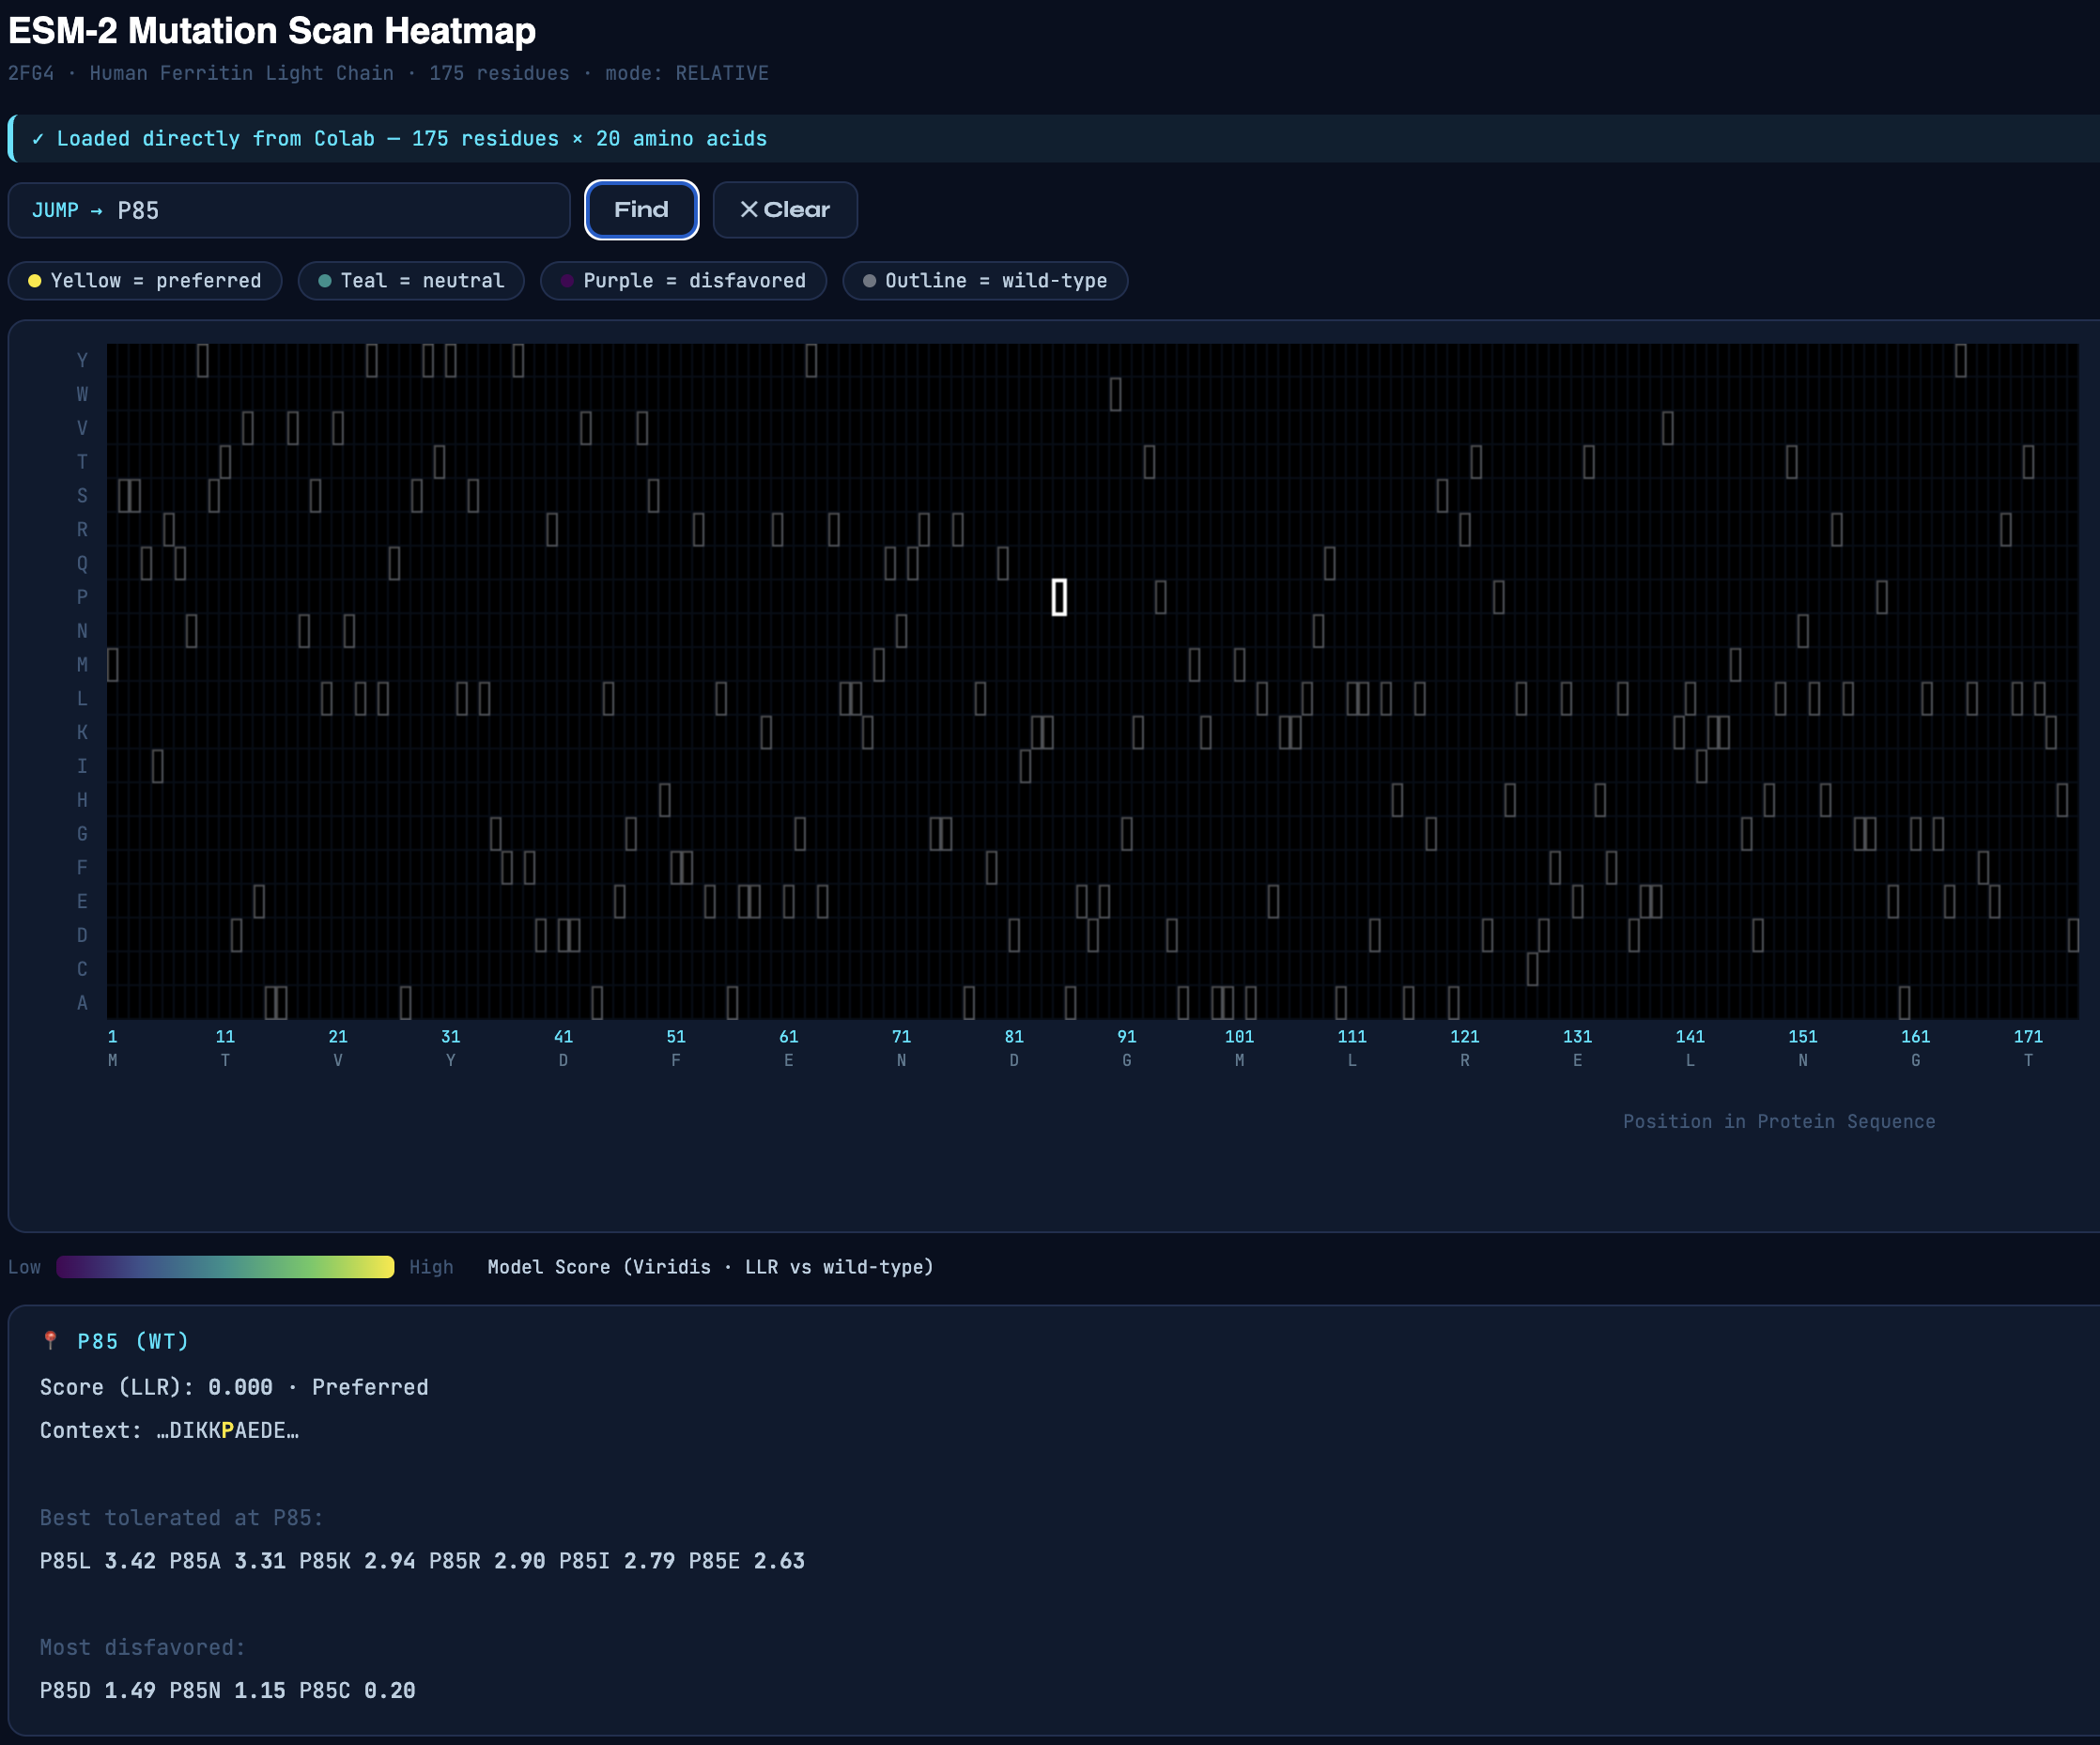
Secondly, I used the AI to build an interactive tool to work with the mutation scan heatmap. The interactive tool allows users to enter a residue of interest, which displays a list of mutations that are tolerable and disfavored based on their score.
Inspecting the mutation scan heatmap, I noticed that any replacements with Cys, Trp, and Met that are replacing the wild-type residues are mostly predicted to be disfavored. As an example, see Thr11 replaced with Cys, Trp, or Met.
Pro85 is predicted to be highly tolerant to many substitutions. Proline is known to allow bending, flexibility, and functioning as a “helix breaker," which can tolerate substitutions.
Many Leu residues, such as L20, L66, L107, L114, L126, L130, L149, L152 and L166 are disfavoring many replacements. As leucine is hydrophobic, it most likely contributes to the structural stability of the helices.
(Bonus) Find sequences for which we have experimental scans, compare the prediction of the language model to experiment.
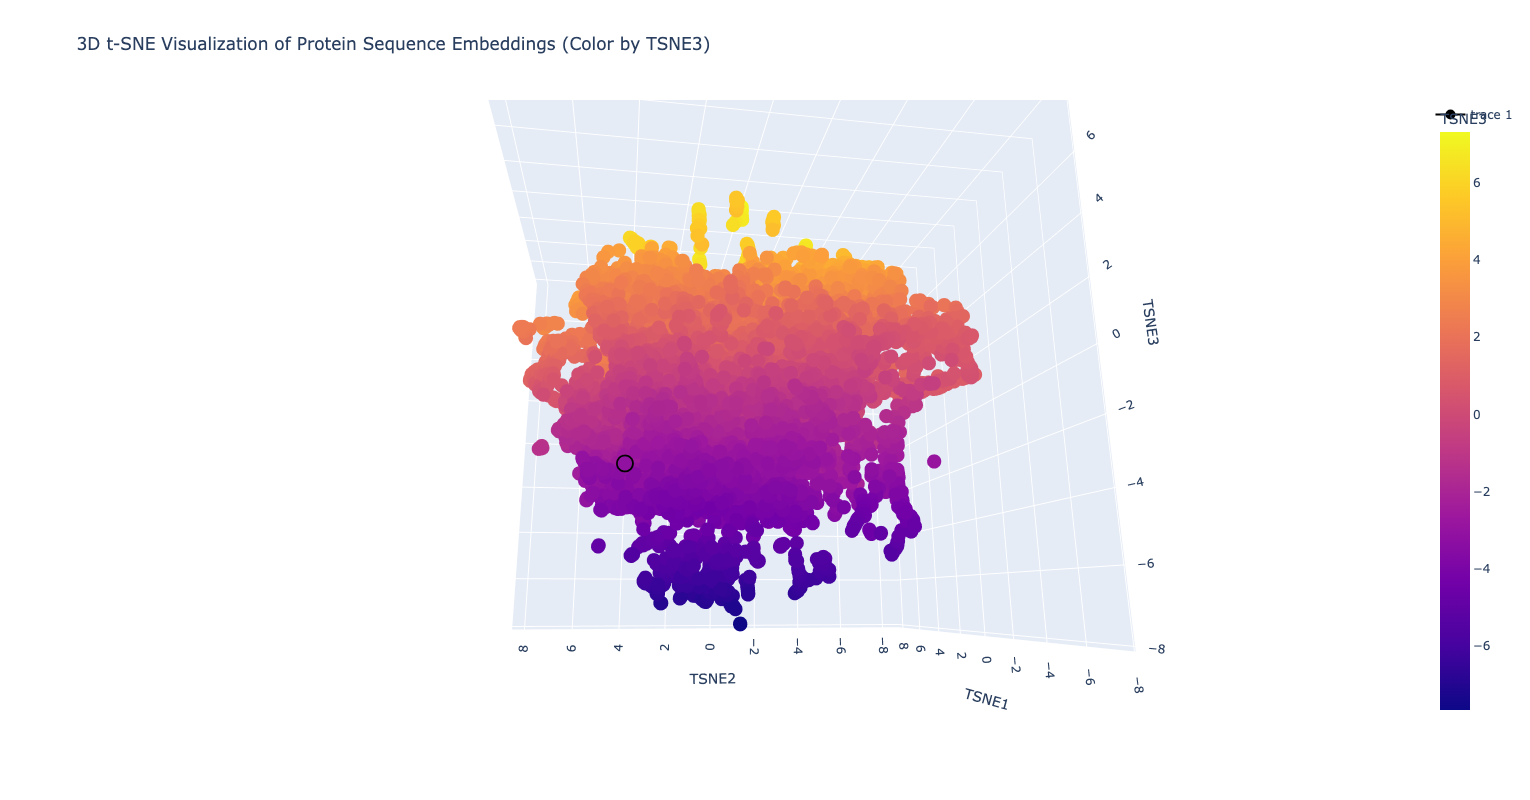
2. Latent Space Analysis
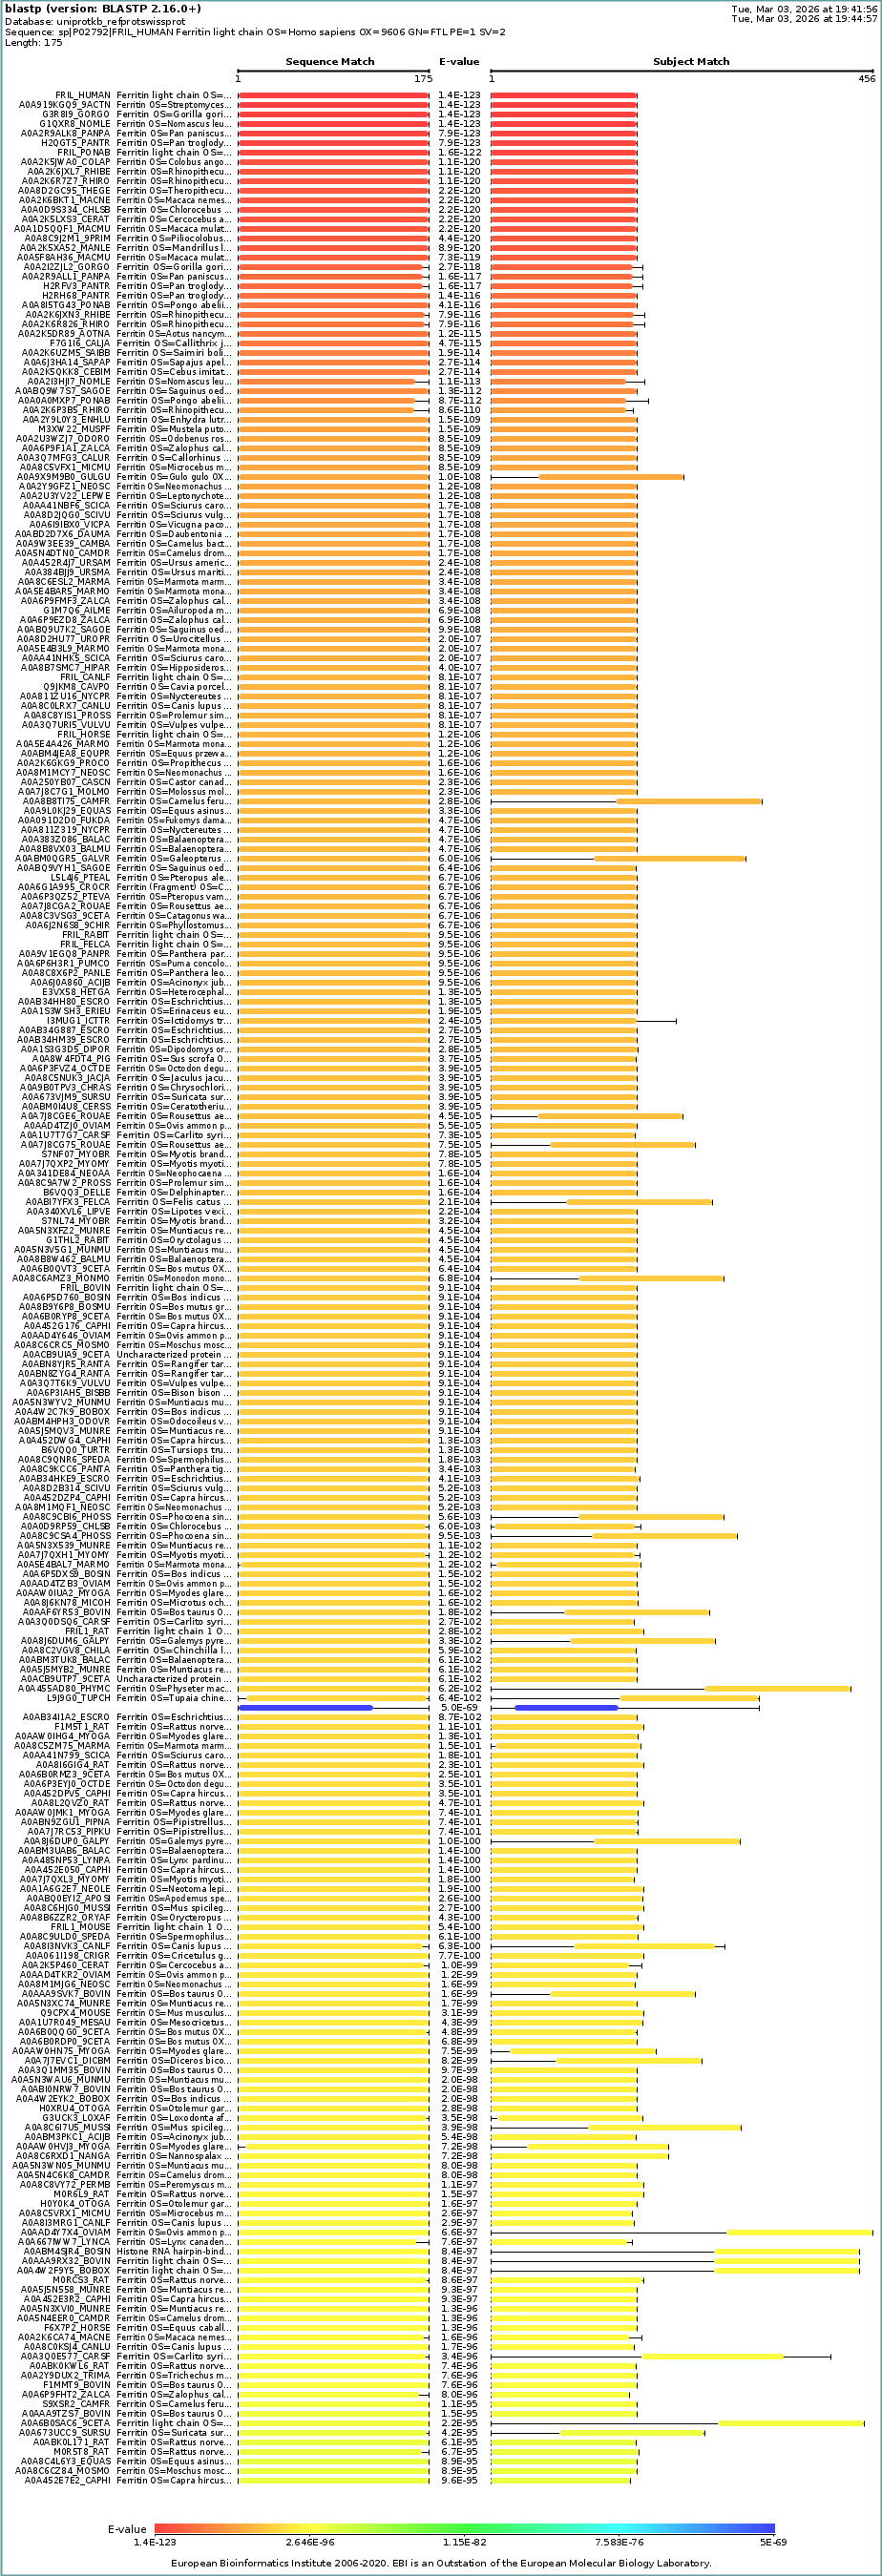
Use the provided sequence dataset to embed proteins in reduced dimensionality.
Analyze the different formed neighborhoods: do they approximate similar proteins?
Place your protein in the resulting map and explain its position and similarity to its neighbors.
3D t-SNE Visualization of Protein Sequence Embeddings. The human ferritin light chain is displayed as a black circle.
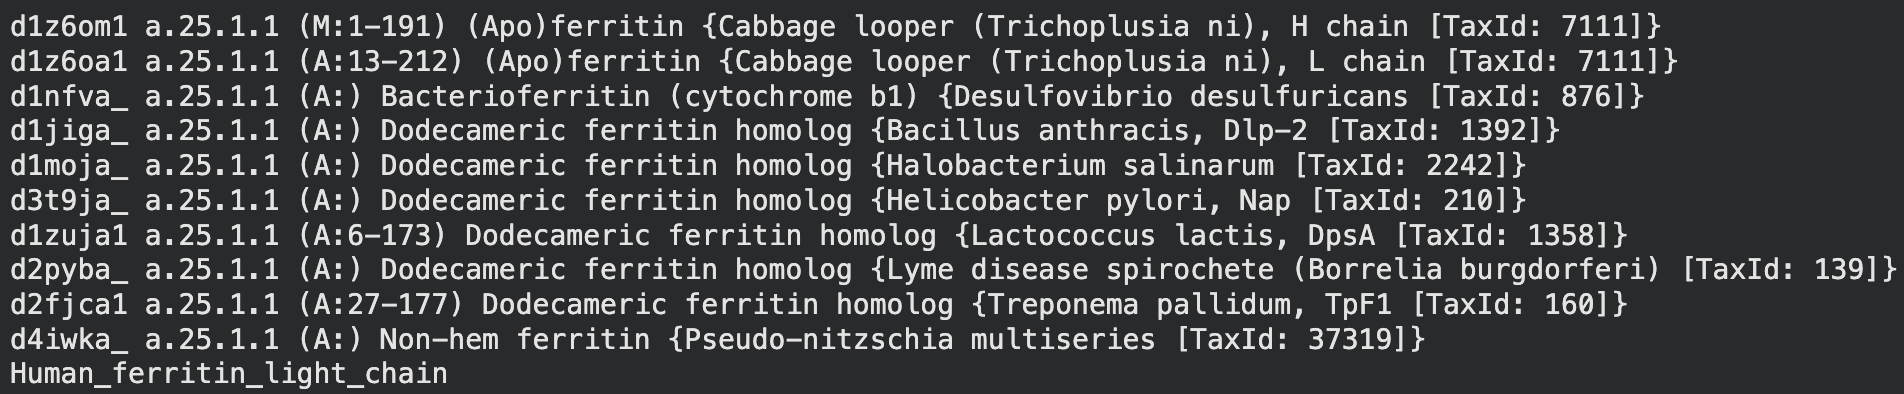
Inspecting the image above and the result from the annotation output, the human ferritin light chain is neighboring with the proteins, which belong to the ferritin family of proteins (see below)
Neighboring proteins to the human ferritin light chain, as annotated from the latent space analysis.
C2. Protein Folding
Folding a protein
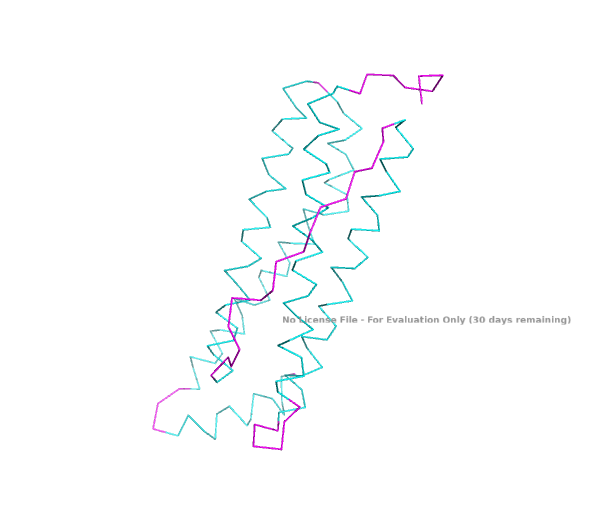
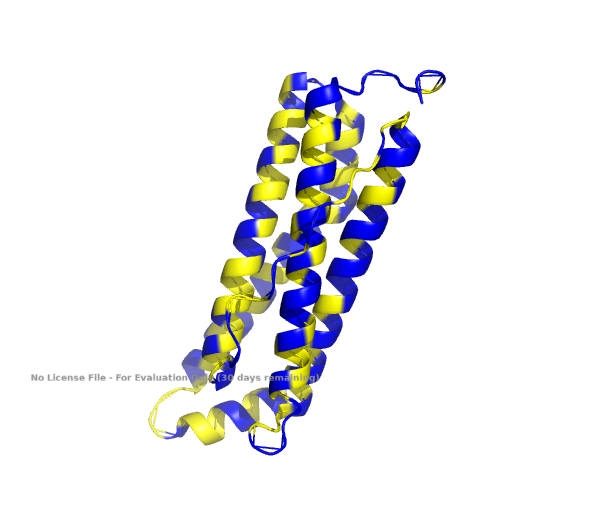
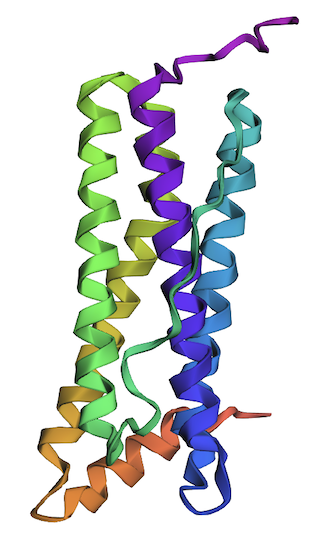
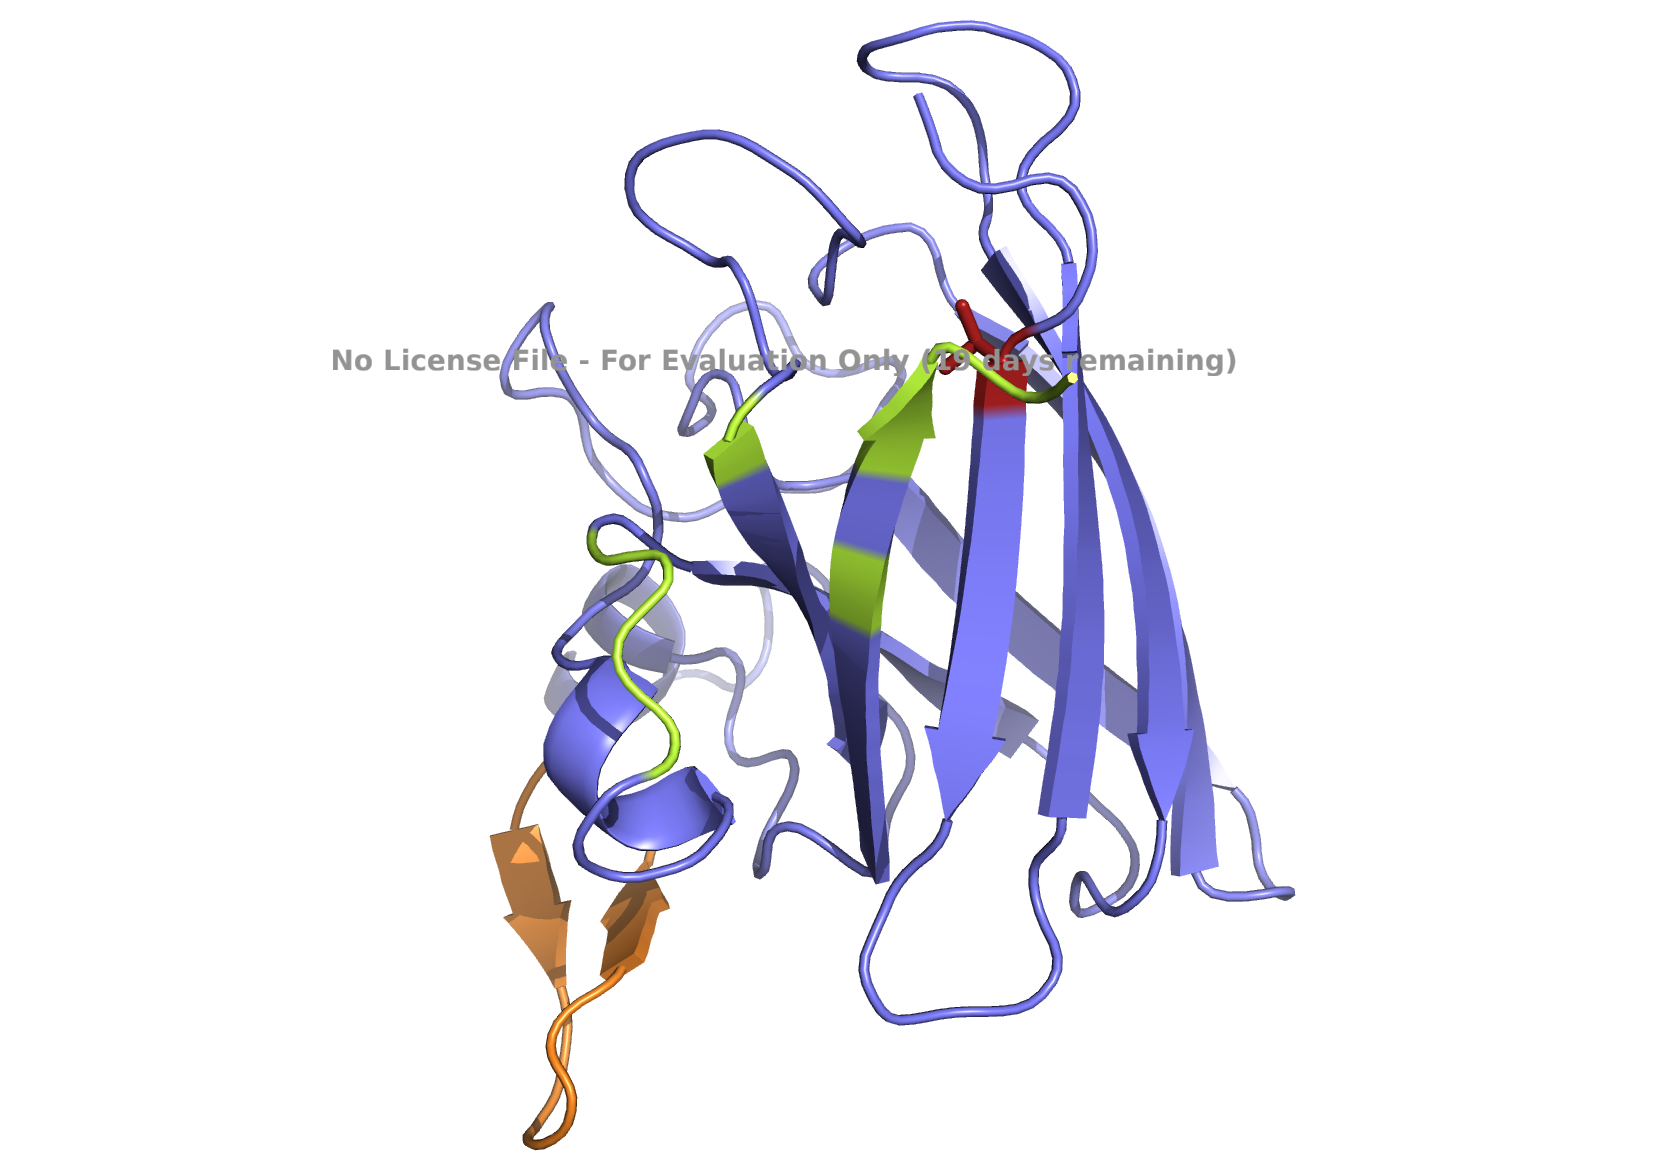
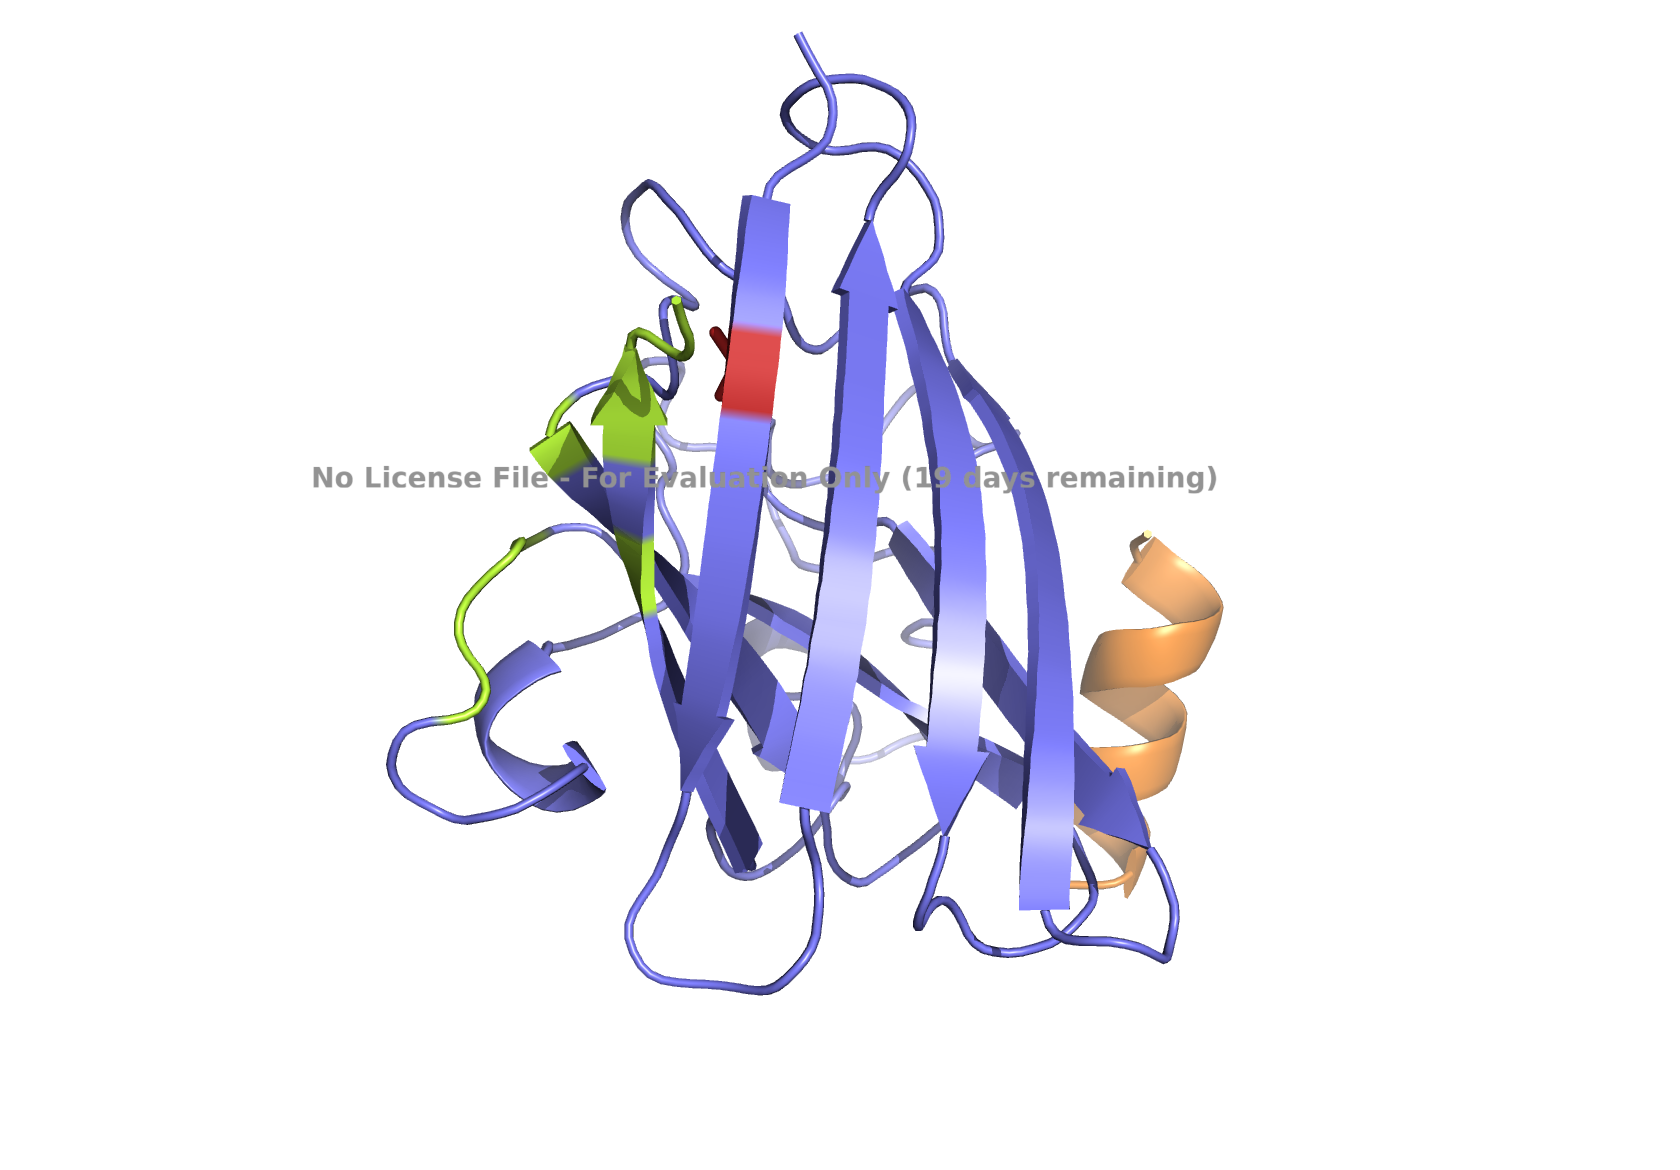
1. Fold your protein with ESMFold. Do the predicted coordinates match your original structure?
The ESMFold-built structure is highly similar to the original structure, as seen in Part B. 4. Fig A, cartoon.
Structure of the human ferritin light chain by ESMFold.
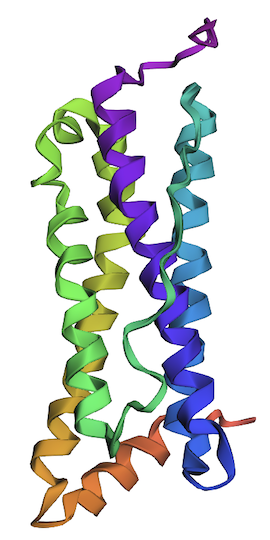
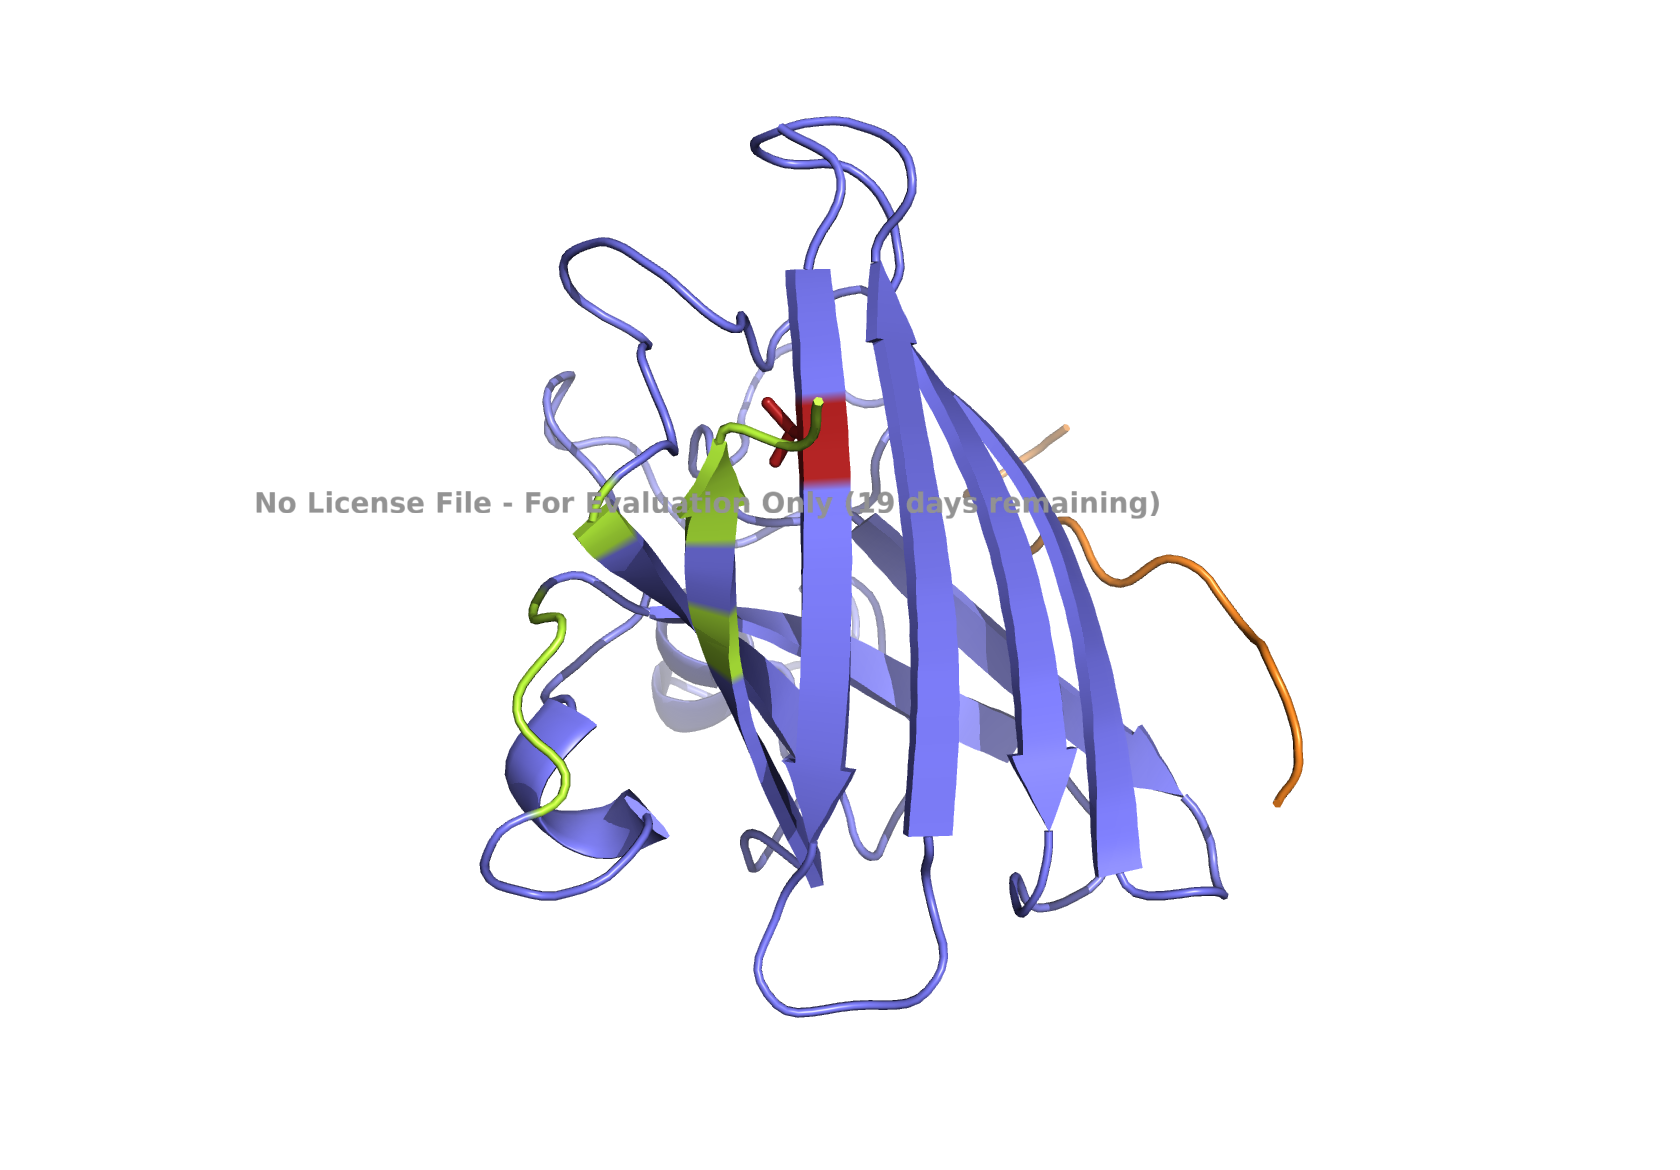
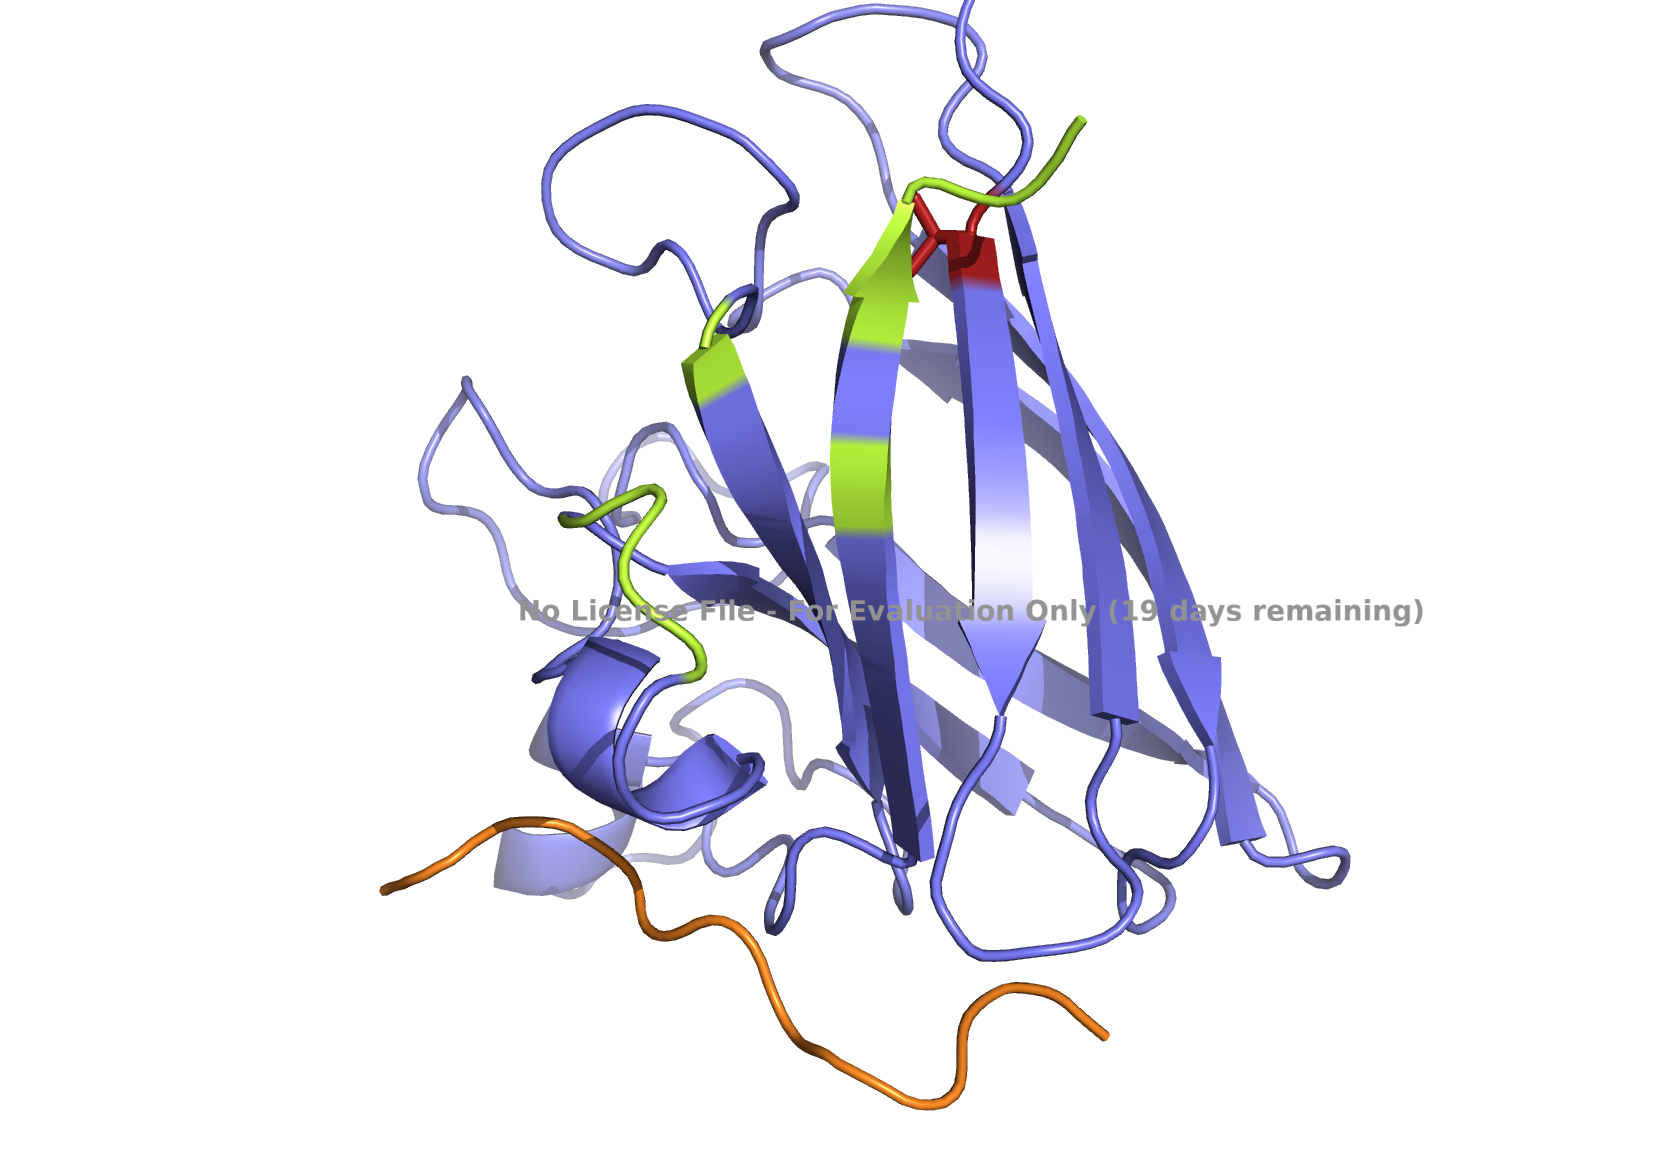
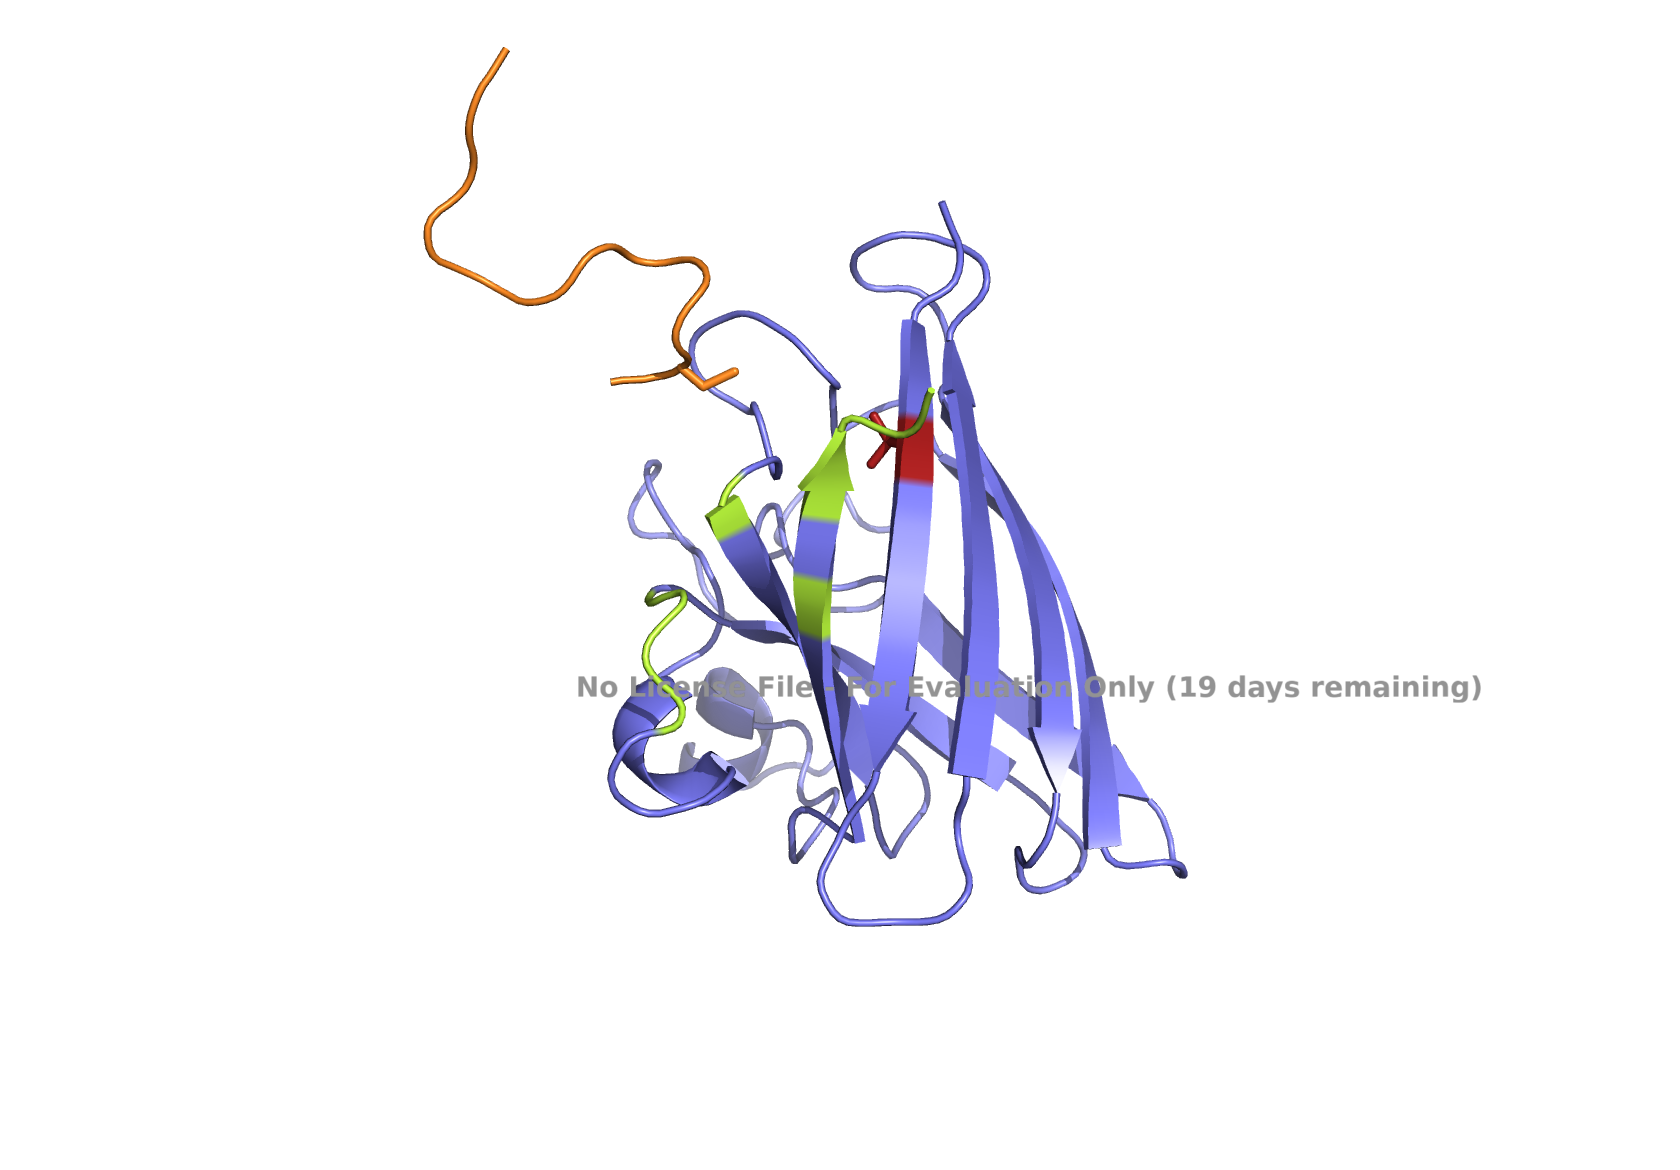
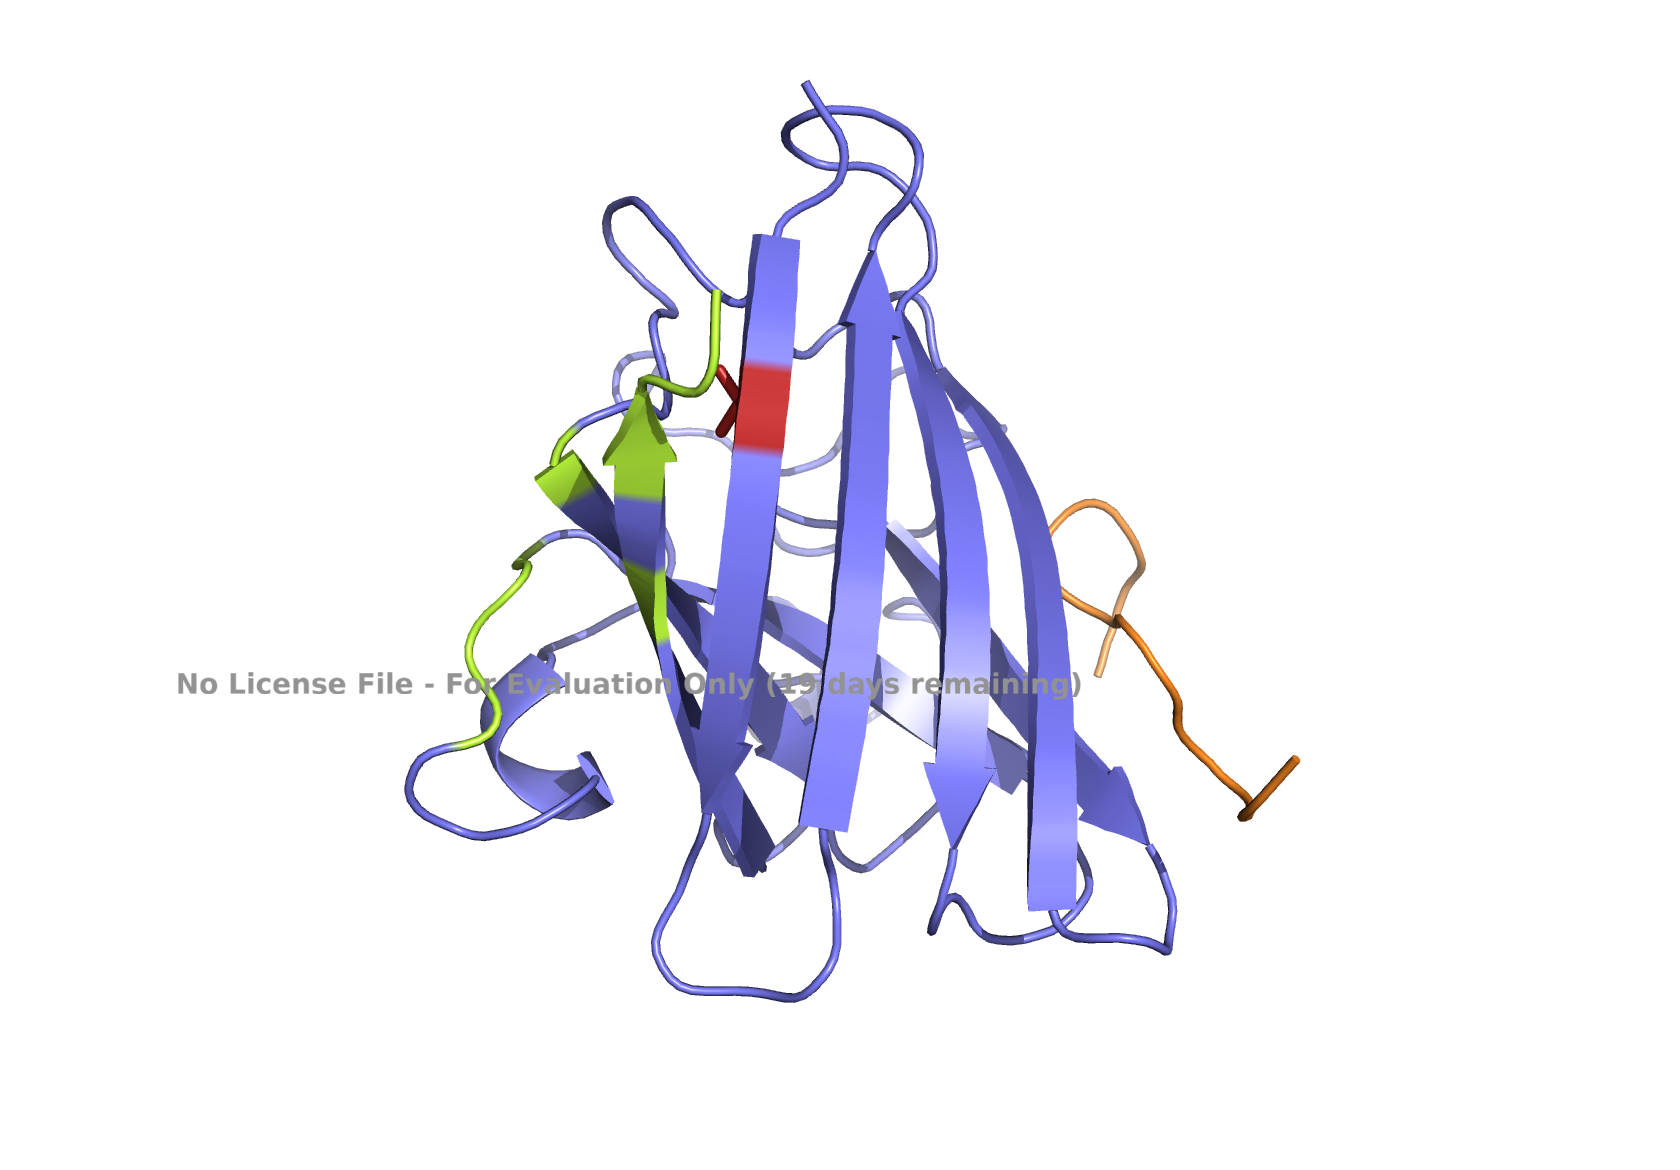
2. Try changing the sequence; first try some mutations, then large segments. Is your protein structure resilient to mutations?
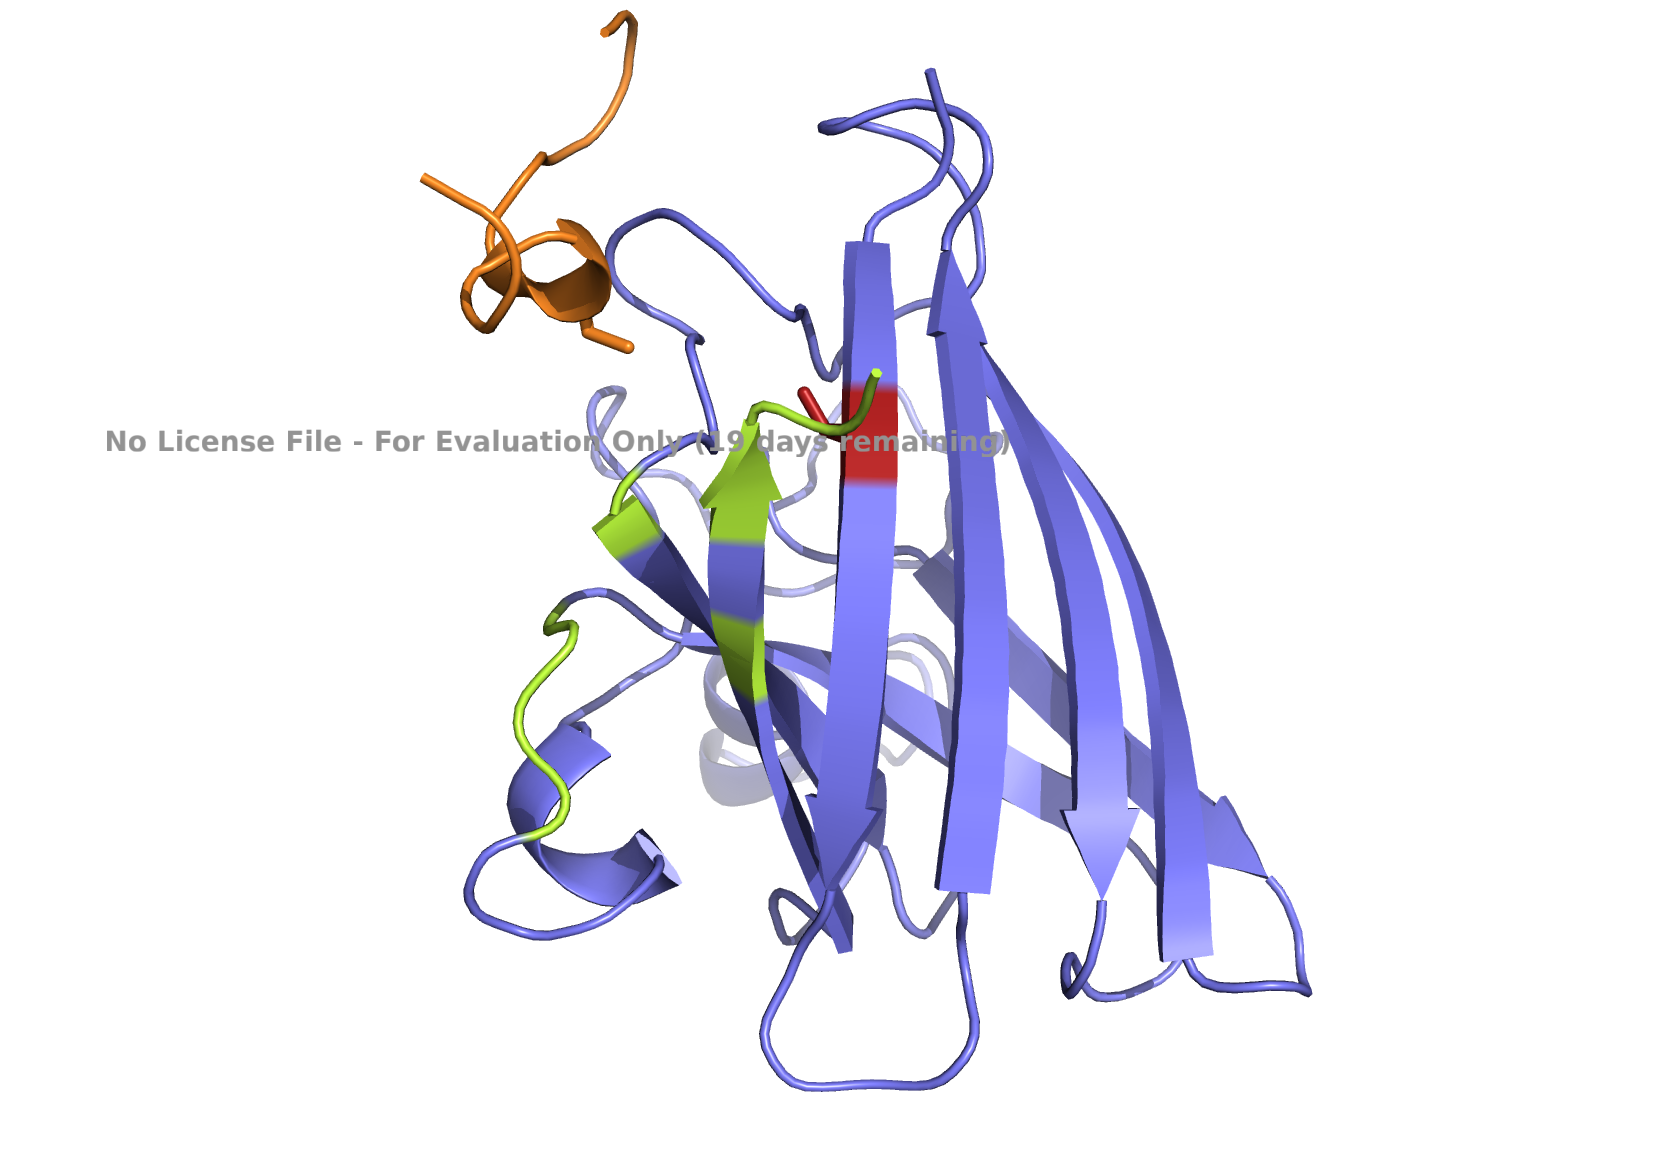
I’ve changed the following residues to create variant 1: L20P, L66P, L107P, L114P, L126C, L130N, L149C, L152C, and L166C. All replacements are predicted to be unfavorable.
One of the helices (shown in green) has a partial disorder as a result of the changes in variant 1.
Considering that variant 1 has nine unfavorable residues and results in a partial defect in only one of four helices, this protein is resilient to mutations.
Shown below is the variant 1 structure modeled by ESMFold.
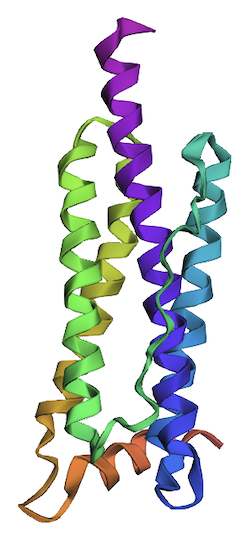
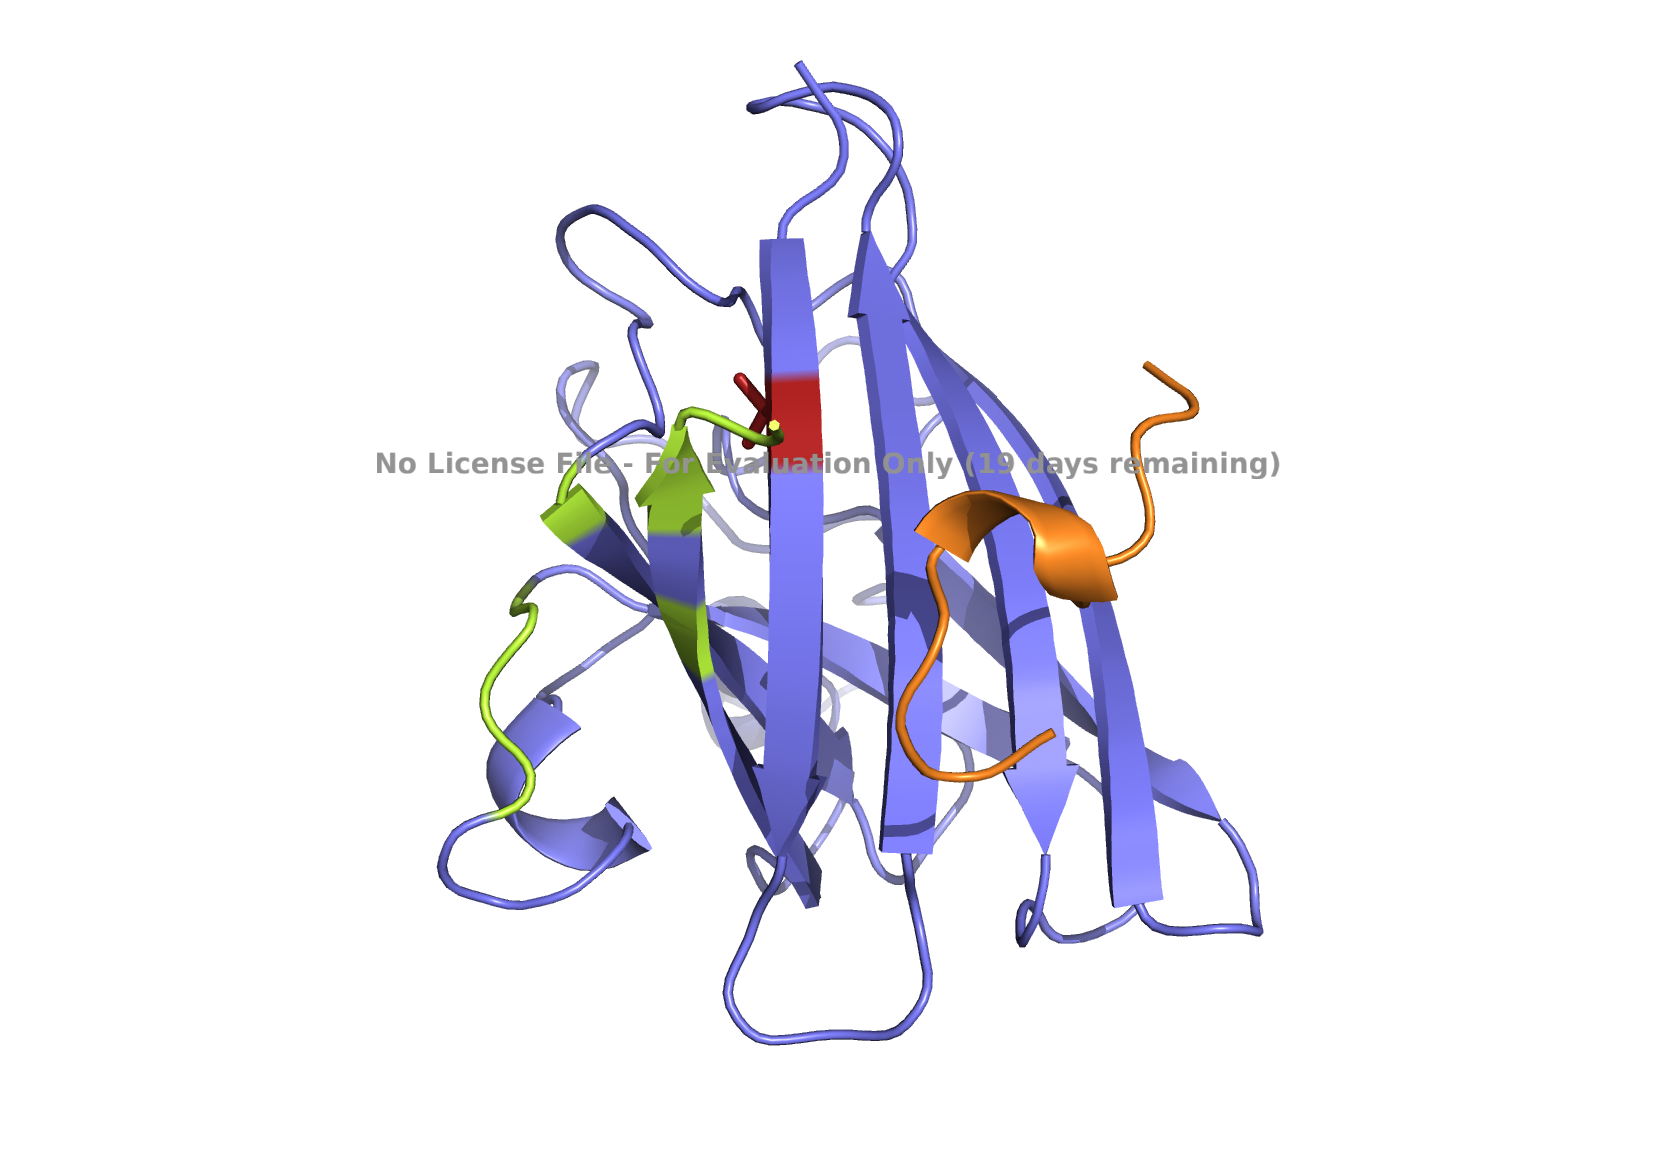
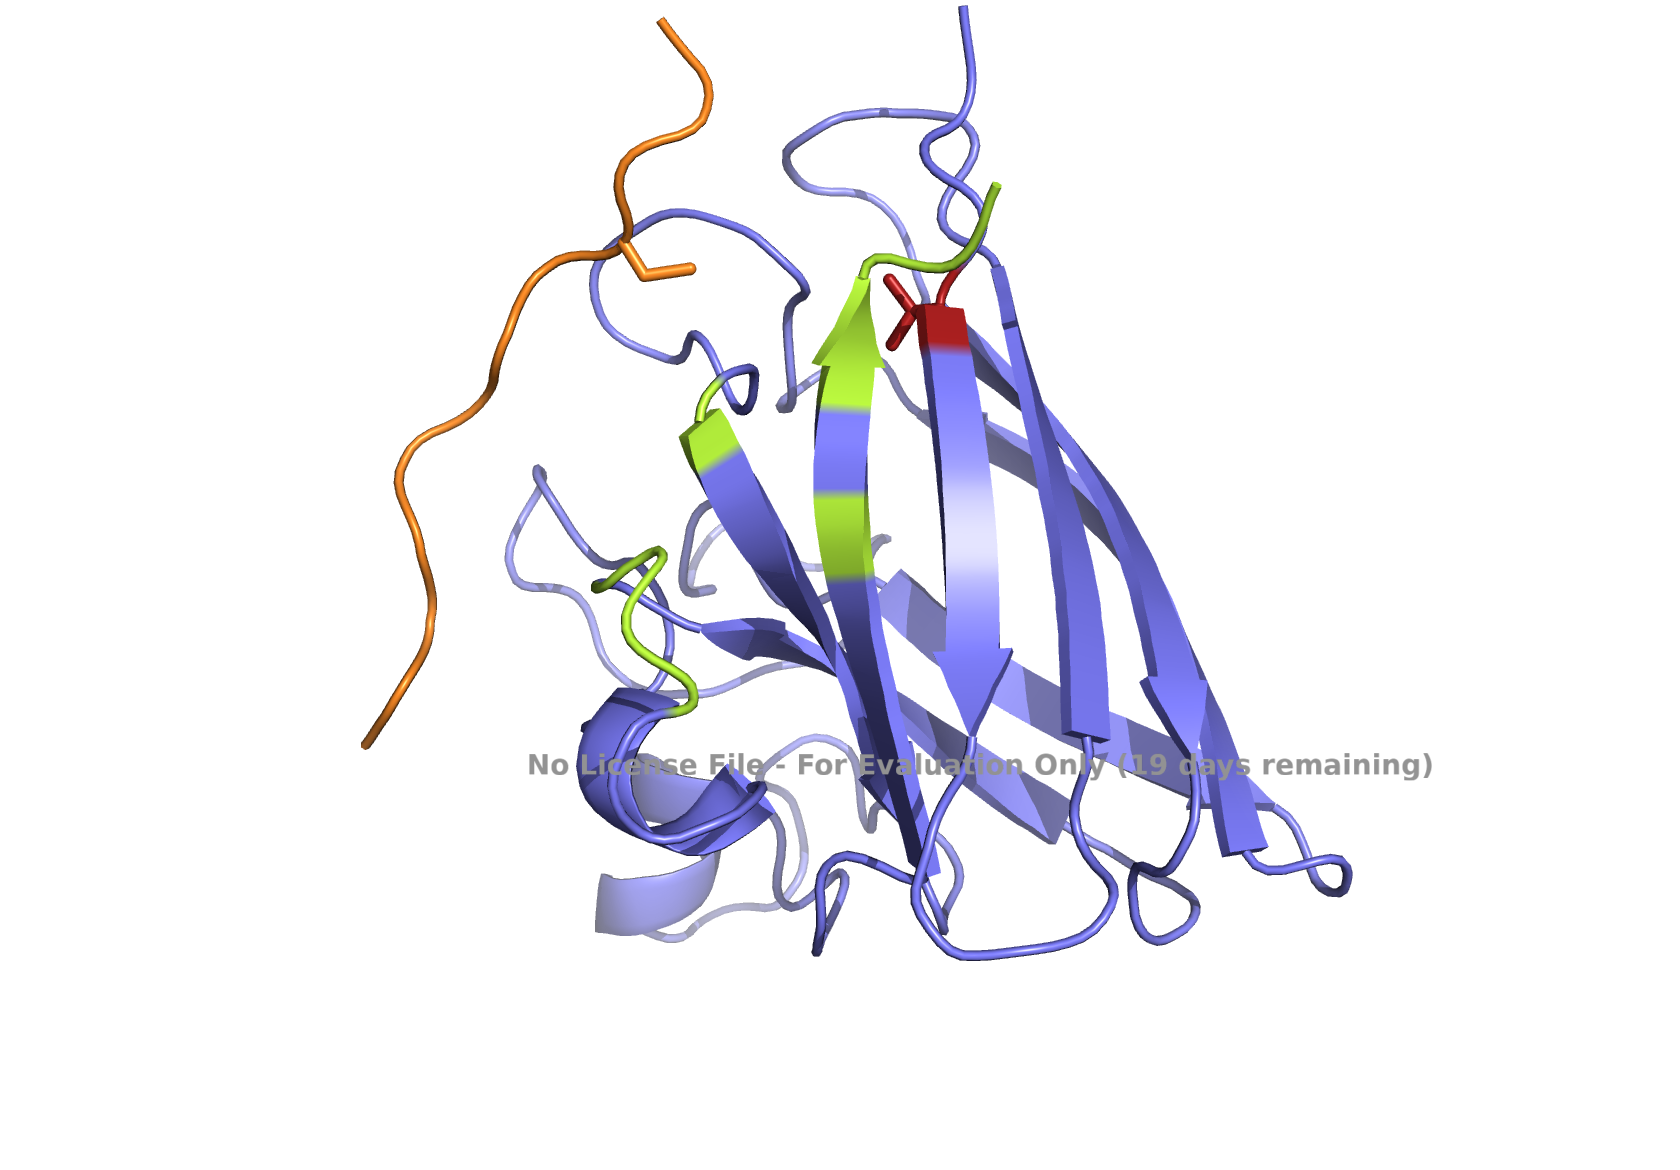
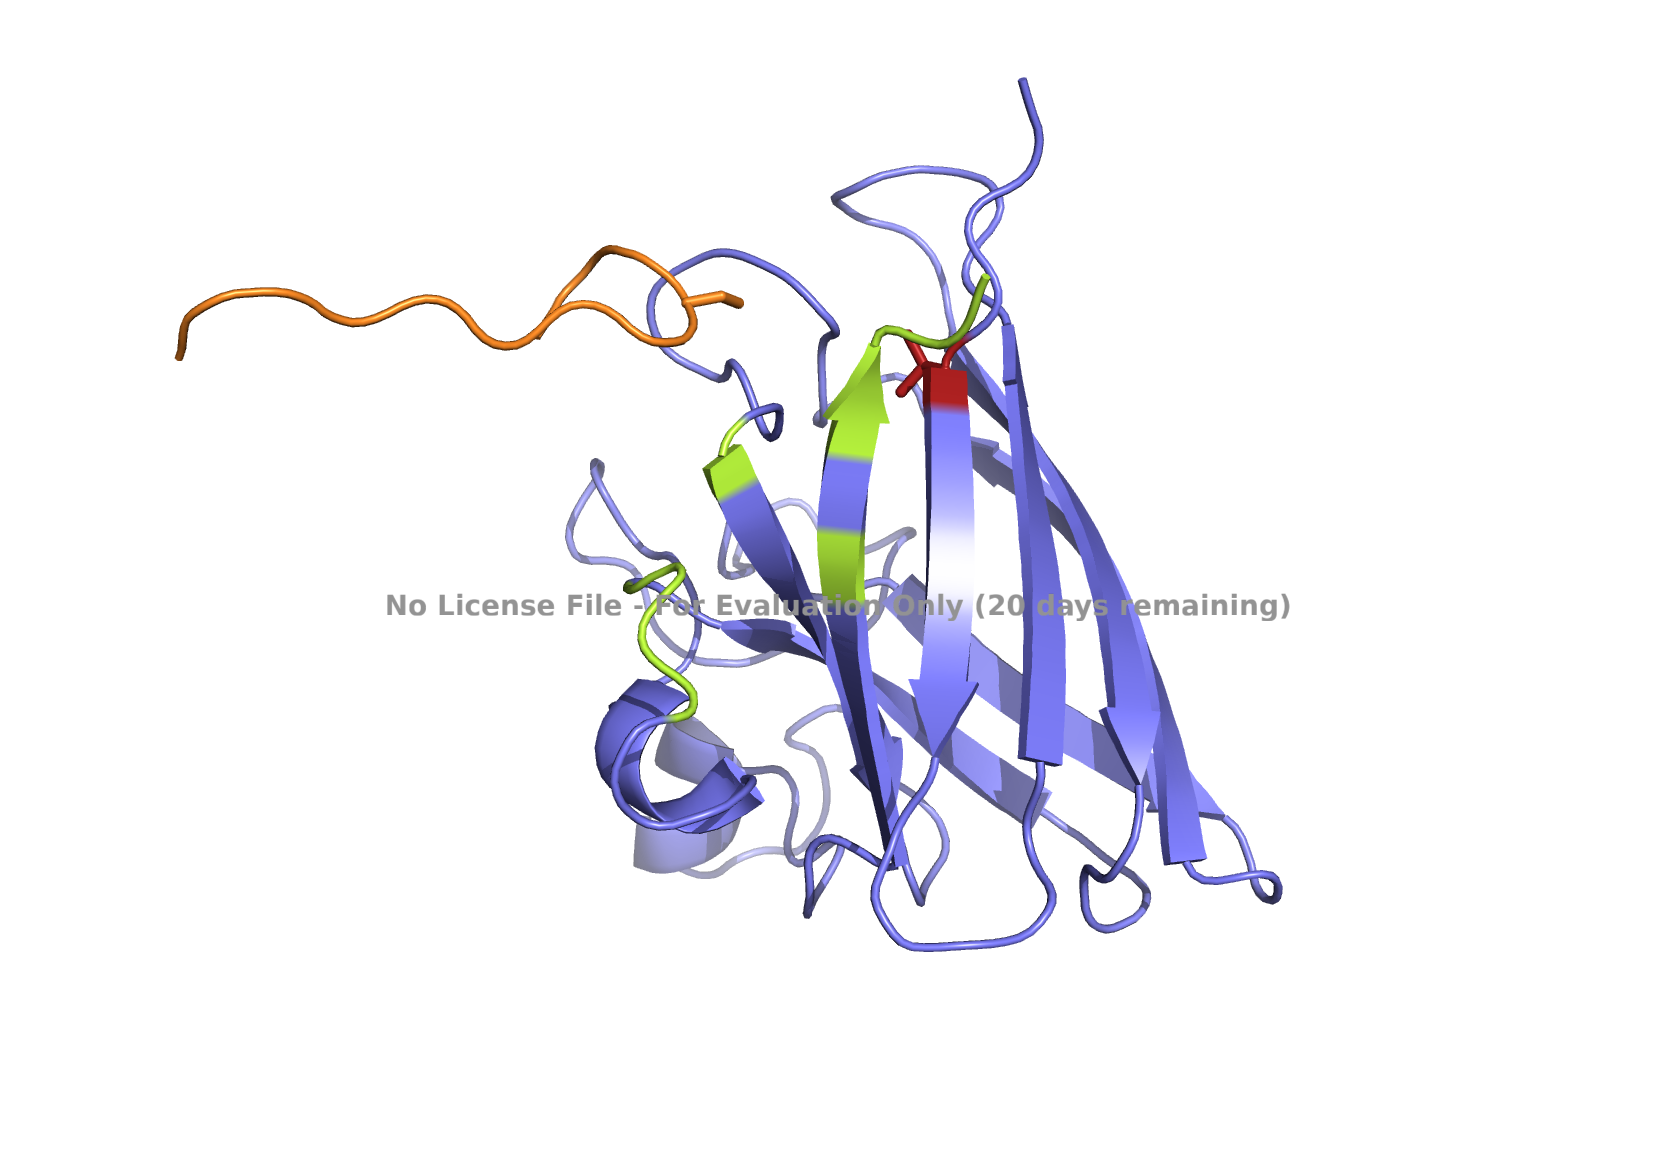
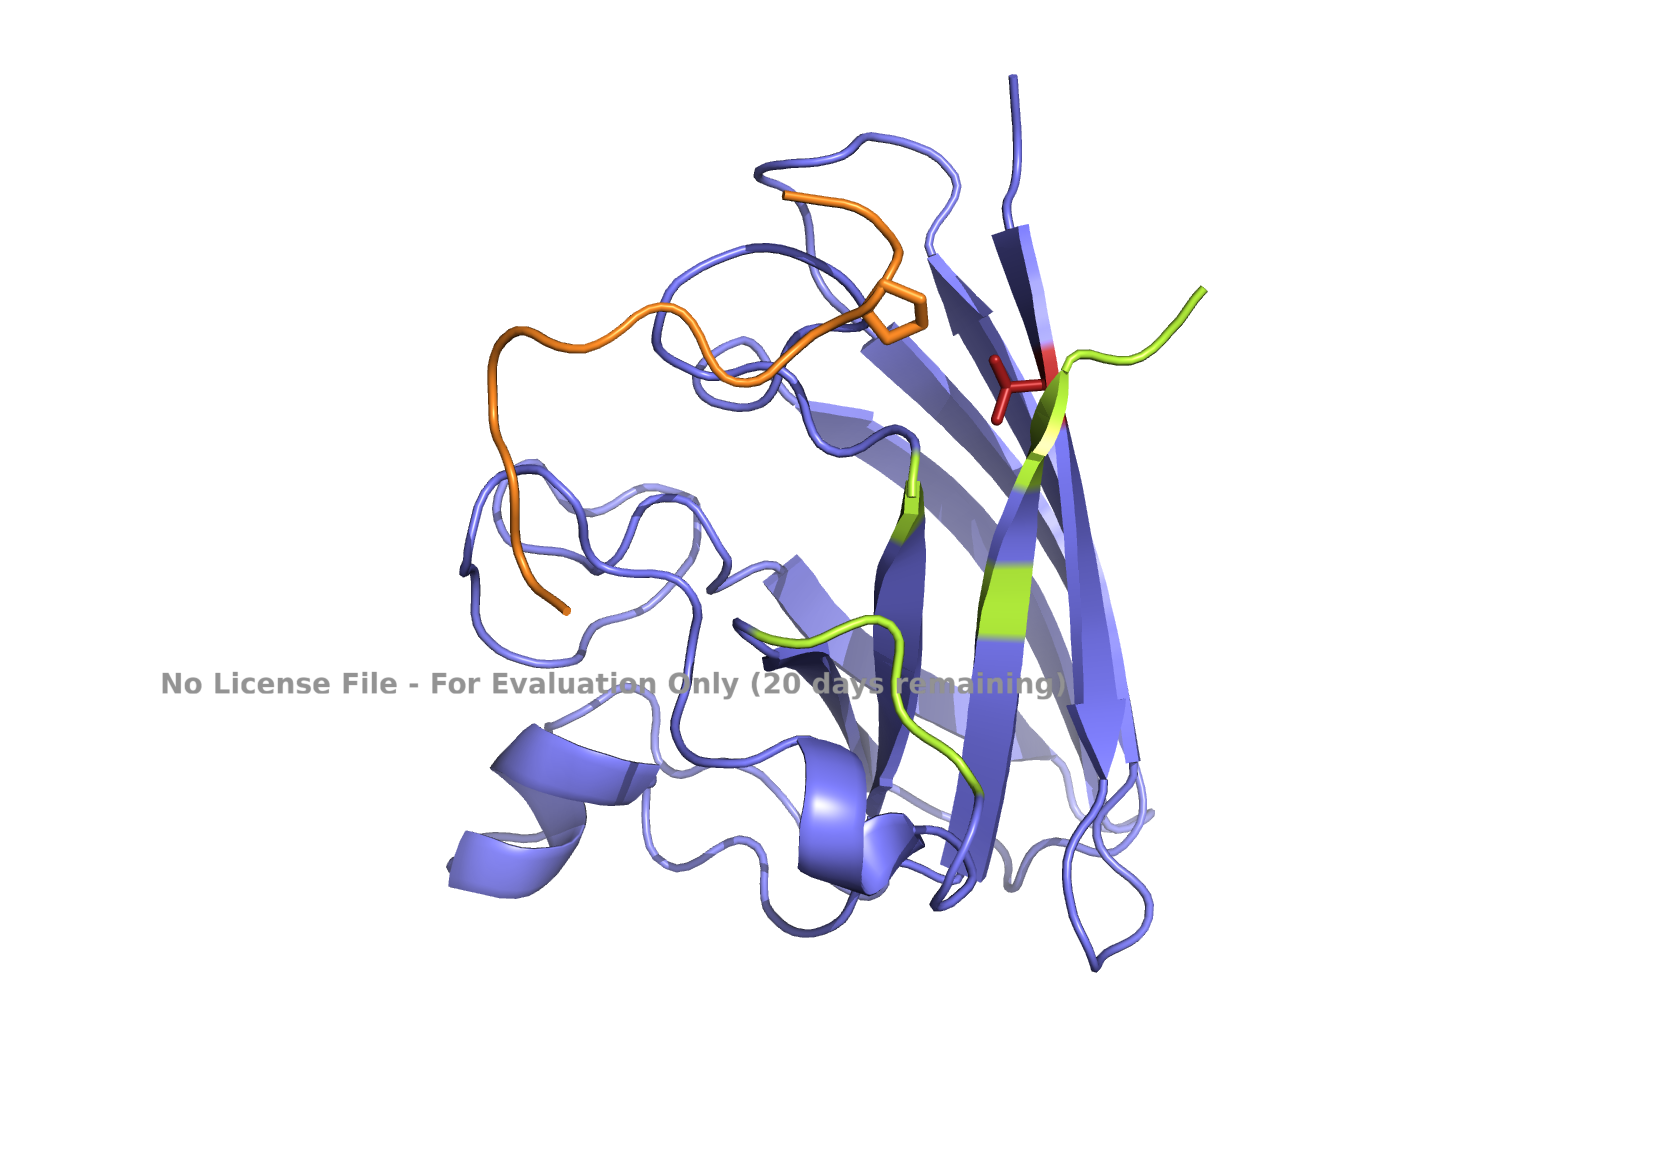
I’ve created single deletion mutations across the leucine residues mentioned in variant 1, creating variant 2. Deletion mutations: DeltaL20, DeltaL66, DeltaL107, DeltaL114, DeltaL126, DeltaL130, DeltaL149, DeltaL152, and DeltaL166.
The ending of one of the helices (magenta) was removed as a result of deletions in the mentioned leucine residues.
Shown below is the variant 2 structure modeled by ESMFold.
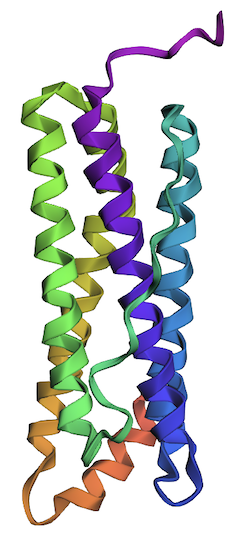
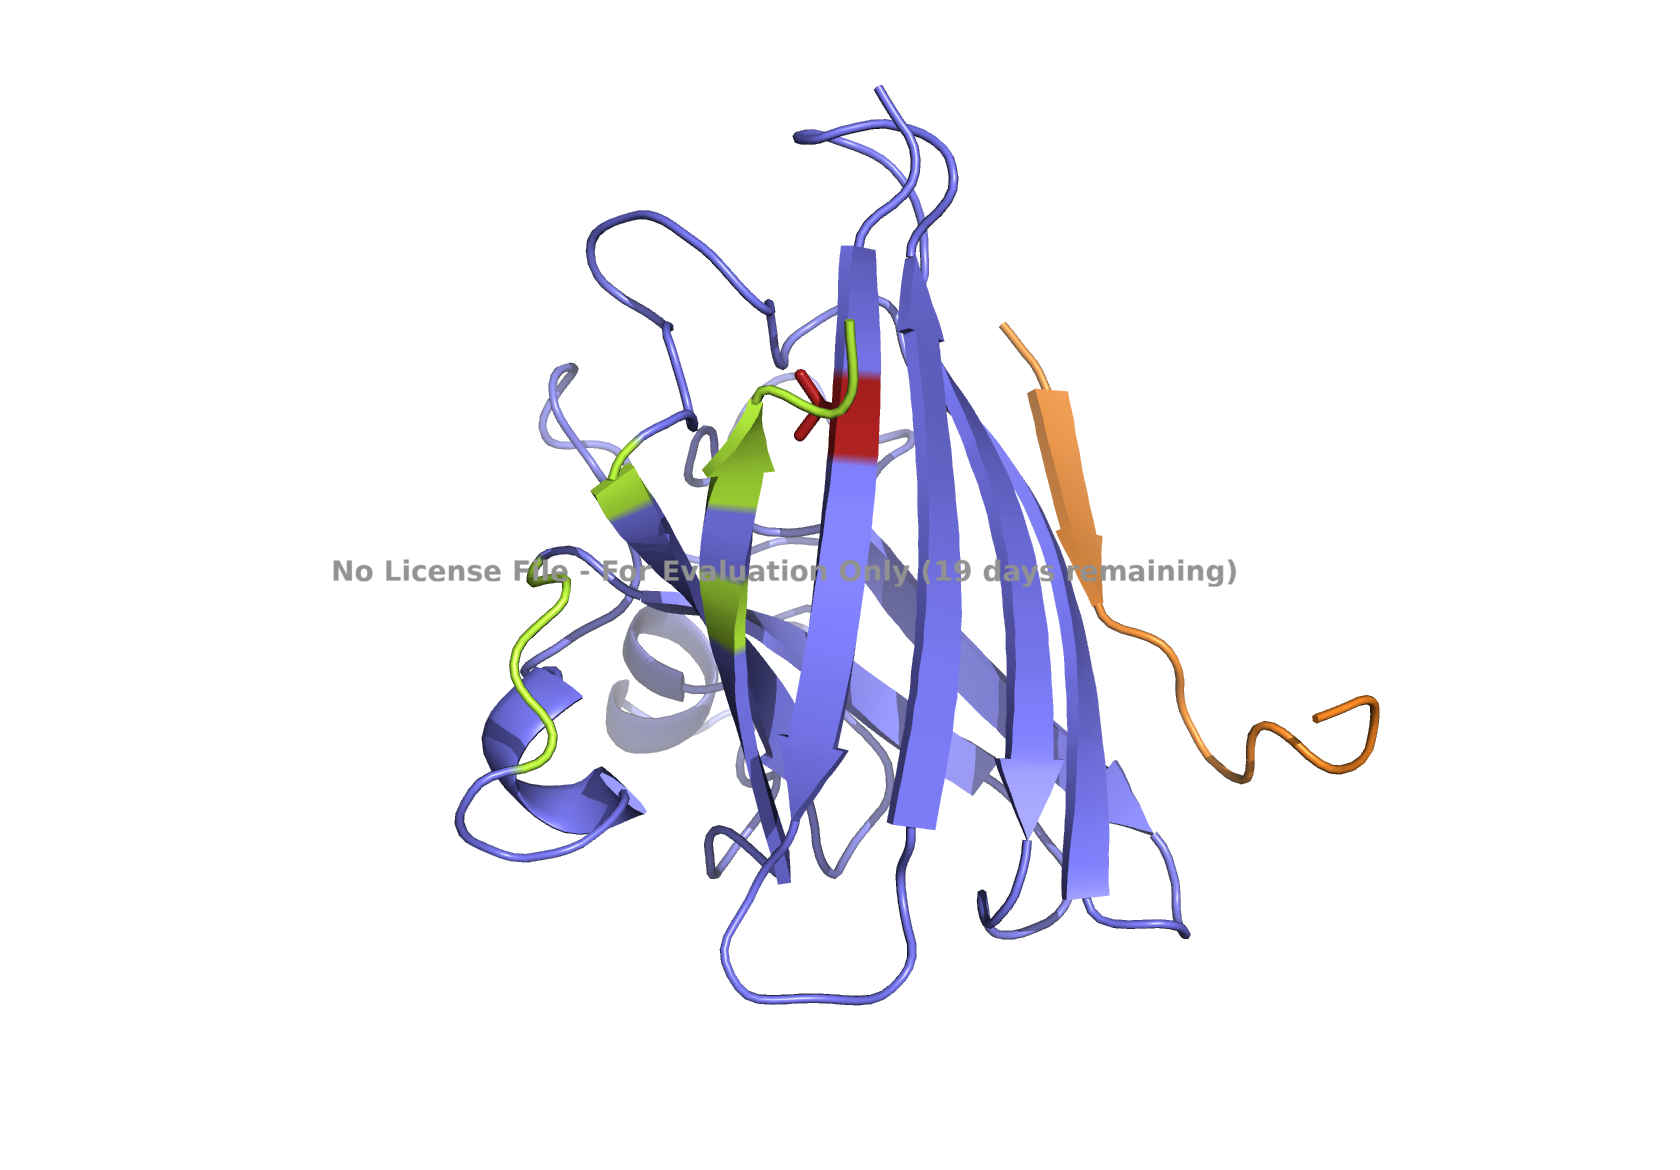
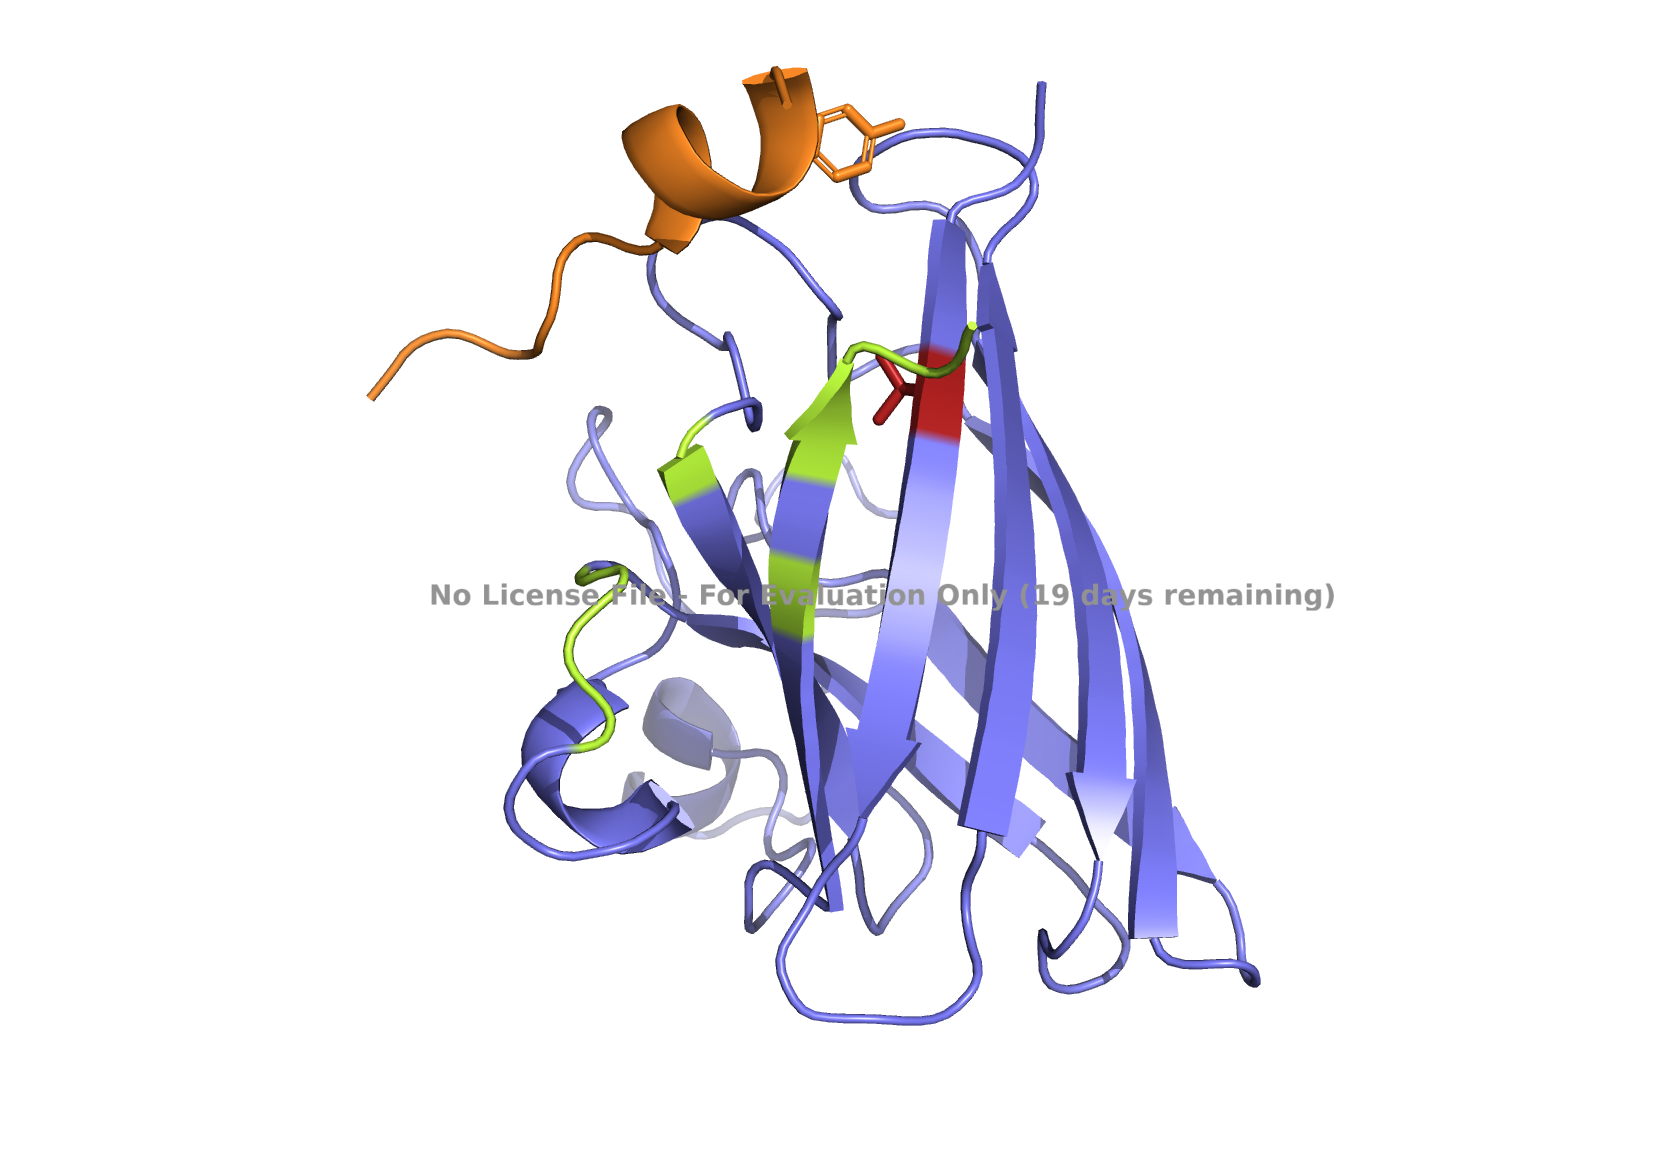
2. Input this sequence into ESMFold and compare the predicted structure to your original.
The predicted structure of the human ferritin light chain generated by the inverse folding with ProteinMPNN is remarkably similar to the original structure.
Predicted Structure by Inverse Folding
Original Structure
Part D. Group Brainstorm on Bacteriophage Engineering
1. Review the Bacteriophage Final Project Goals for engineering the L Protein:
Increased stability (easiest)
Higher titers (medium)
Higher toxicity of lysis protein (hard)
2. Brainstorm session
Choose one or two main goals from the list that you think you can address computationally (e.g., “stabilize the lysis protein”, “disrupt its interaction with DnaJ”.
Write a 1-page proposal (bullet points or short paragraphs) describing:
3. Which tools/approaches from recitation you propose using (e.g., “Use Protein Language Models to do in silico mutagenesis, then AlphaFold-Multimer to check complexes.”)
Why do you think those tools might help solve your chosen sub-problem?
Name one or two potential pitfalls (e.g., “We lack enough training data on phage-bacteria interactions.”)
Include a schematic of your pipeline.
Week 5 HW: Protein Design Part II
Part A: SOD1 Binder Peptide Design
Superoxide dismutase 1 (SOD1) is a cytosolic enzyme that converts superoxide radicals into hydrogen peroxide and oxygen. In its native state, it forms a stable homodimer and binds copper and zinc.
Mutations in SOD1 cause familial Amyotrophic Lateral Sclerosis (ALS). Among them, the A4V mutation (Ala to Val at residue 4) leads to one of the most aggressive forms of the disease. The mutation subtly destabilizes the N-terminus, perturbs folding energetics, and promotes toxic aggregation.
Your challenge:
Design short peptides that bind mutant SOD1.
Then decide which ones are worth advancing toward therapy.
Part 1: Generate Binders with PepMLM
Begin by retrieving the human SOD1 sequence from UniProt (P00441) and introducing the A4V mutation.
Fig 2. The human SOD1 variant carrying an A4V mutation.
Using the PepMLM CoLab linked from the HuggingFace PepMLM-650M model card:
Generate four peptides of length 12 amino acids conditioned on the mutant SOD1 sequence.
To your generated list, add the known SOD1-binding peptide FLYRWLPSRRGG for comparison.
Record the perplexity scores that indicate PepMLM’s confidence in the binders.
Peptide Name
Sequence
Perplexity
peptide_1
WRYYVVVAEWGE
30.94
peptide_2
WLYYATVARWGK
20.55
peptide_3
WHYYVVGLRWWE
28.21
peptide_4
WRYYVTGAAWWK
17.13
known binder peptide
FLYRWLPSRRGG
20.6
Table 1. Results of generating 4 new peptides and the perplexity values against the SOD1_A4V by PepMLM. The known binder is shown in the bottom row for comparison.
Newly generated peptides with varied pseudo perplexity values indicate that some could achieve even better binding than the known binding peptide, FLYRWLPSRRGG, as judged by the lower value in perplexity.
Part 2: Evaluate Binders with AlphaFold3
Navigate to the AlphaFold Server: alphafoldserver.com
For each peptide, submit the mutant SOD1 sequence followed by the peptide sequence as separate chains to model the protein-peptide complex.
Record the ipTM score and briefly describe where the peptide appears to bind.
Does it localize near the N-terminus where A4V sits?
Does it engage the B-barrel region or approach the dimer interface?
Does it appear surface-bound or partially buried?
Peptides
ipTM Values
Localization Characteristics
peptide_1
0.32
Surface-bound, may have partial interaction with beta-sheets
peptide_2
0.33
Interacts with beta-sheets, proximity to dimer interface residues
peptide_3
0.49
Surface-bound, does not interact with beta-sheets
peptide_4
0.42
Surface-bound, may have partial interaction with beta-sheets
known binder peptide
0.38
Surface-bound, does not interact with beta-sheets
Table 2. Modeling a peptide-protein complex. Interface predicted template modeling (ipTM) scores were obtained from AlphaFold analysis.
None of the peptides engages at the N-terminus where the A4V mutation is found, except peptide_2, which may interact with residue 153, the last residue at the C-terminus participating in the dimer interface.
(A) peptide_1
(B) peptide_2
(C) peptide_3
(D) peptide_4
(E) known binder peptide
Fig 3. AlphaFold modeling of pepMLM peptides with SOD1_A4V visualized by PyMol. SOD1_A4V monomer (blue) and binder peptides (orange). Highlights: A4V residue with sidechain in stick (red) and dimer interface residues (green) 50–53, 114, 148, and 150–153, as referenced in Hough et al. 2004.
In a short paragraph, describe the ipTM values you observe and whether any PepMLM-generated matches or exceed the known binder.
All peptides, including the benchmark, have ipTM values that fall between 0.3 and 0.5. Interpretation of the 0.3 – 0.5 range indicates weak interactions, but they may still occur. As ChatGPT research indicated, AlphaFold struggles with short peptides, as short as 12 amino acids. Having a benchmark, a known binder peptide, helps interpret the values, even if categorized as weak.
A low perplexity score of a peptide indicates that it is more likely to occur based on a protein language model. Among the new peptides, the perplexity score of peptide_4, 17.13, which is the lowest, is even lower than the perplexity score of the known binder peptide, 20.6. Two of the peptides have higher perplexity scores, peptide_1 and peptide_3, 30.94 and 28.21, respectively, placing these in the disfavored category.
ipTM score
Interpretation
> 0.7
confident interaction
0.5 - 0.7
possible interaction
0.3 - 0.5
weak interaction
< 0.3
likely no interaction
Table 3. Reference for interpreting ipTM scores.
I’ve used ChatGPT research to interpret the results.
Prompt:
Can you explain the results from AlphaFold structural analysis for binder peptides to the SOD1_A4V variant? Results in Tables 1 and 2.
Part 3: Evaluate Properties of Generated Peptides in the PeptiVerse
Structural confidence alone is insufficient for therapeutic development. Using PeptiVerse, let’s evaluate the therapeutic properties of your peptide! For each PepMLM-generated peptide:
Paste the peptide sequence
Paste the A4V mutant SOD1 sequence in the target field.
Check the boxes
Predicted binding affinity
Solubility
Hemolysis probability
Net charge (pH 7)
Molecular weight
Compare these predictions to what you observed structurally with AlphaFold3. In a short paragraph, describe what you see. Do peptides with higher ipTM also show stronger predicted affinity? Are any strong binders predicted to be hemolytic or poorly soluble? Which peptide best balances predicted binding and therapeutic properties?
Choose one peptide you would advance and justify your decision briefly.
Peptide
Property
Prediction
Value
Unit
peptide_1, WRYYVVVAEWGE
Binding Affinity
Weak binding
6.750
pKd/pKi
Solubility
Soluble
1.000
Probability
Hemolysis
Non-hemolytic
0.258
Probability
Net Charge (pH 7)
-1.23
Molecular Weight
1556.7
Da
peptide_2, WLYYATVARWGK
Binding Affinity
Weak binding
6.729
pKd/pKi
Solubility
Soluble
1.000
Probability
Hemolysis
Non-hemolytic
0.054
Probability
Net Charge (pH 7)
1.76
Molecular Weight
1513.7
Da
peptide_3, WHYYVVGLRWWE
Binding Affinity
Weak binding
6.733
pKd/pKi
Solubility
Soluble
1.000
Probability
Hemolysis
Non-hemolytic
0.135
Probability
Net Charge (pH 7)
-0.15
Molecular Weight
1693.9
Da
peptide_4, WRYYVTGAAWWK
Binding Affinity
Medium binding
7.059
pKd/pKi
Solubility
Soluble
1.000
Probability
Hemolysis
Non-hemolytic
0.041
Probability
Net Charge (pH 7)
1.76
Molecular Weight
1586.8
Da
known binder peptide, FLYRWLPSRRGG
Binding Affinity
Weak binding
5.968
pKd/pKi
Solubility
Soluble
1.000
Probability
Hemolysis
Non-hemolytic
0.047
Probability
Net Charge (pH 7)
2.76
Molecular Weight
1507.7
Da
Table 4. Summary of the PeptiVerse analysis.
I’ve chosen peptide_2 for the therapeutic advancement with the following reasons:
Based on the PeptiVerse evaluation of the new peptides, the binding affinities of 3 out of 4 were predicted to be weak (Table 4). The known binder peptide is also scored with weak binding affinity in PeptiVerse. Only one peptide, peptide_4, had medium affinity, with a higher affinity score than the other peptides. However, peptide_4 is localized elsewhere, as determined by AlphaFold structure analysis, not near the A4V or dimer interface (Fig 1D).
On the other hand, the second-best-ranked model for the peptide_2 showed that this peptide could be localized near AV4 and closer to the dimer interface (Fig 1B), which may potentially interact with one of the dimer interface residues, 153, and prevent aggregation. Notably, other model predictions for this peptide, including the best-ranking one, showed that the peptide might also be located elsewhere.
Given the location of the second-best predicted model, I favored peptide_2 because it could potentially have a more relevant binding location. All peptides are scored as weak binding but possible interactions (ipTM between 0.3 and 0.5). The visualization of peptide_2 is shown in Fig 1B, reflecting its predicted binding location based on that second-best model. The ranking scores for the best and second-best were 0.43 and 0.42, respectively, as reported in the AlphaFold analysis. ipTM is 0.33 for the best and 0.31 for the second-best. Figs. 1A, 1C, 1D, and 1E , show the best-ranked models of peptide_1, peptide_3, peptide_4, and the known binder peptide, respectively.
Part 4: Generate Optimized Peptides with moPPIt
Now, move from sampling to controlled design. moPPIt uses Multi-Objective Guided Discrete Flow Matching (MOG-DFM) to steer peptide generation toward specific residues and optimize binding and therapeutic properties simultaneously. Unlike PepMLM, which samples plausible binders conditioned on just the target sequence, moPPIt lets you choose where you want to bind and optimize multiple objectives at once.
Open the moPPIt CoLab linked from the HuggingFace moPPIt model card.
Make a copy and switch to a GPU runtime.
In the notebook,
Paste your A4V mutant SOD1 sequence.
Choose specific residue indices on SOD1 that you want your peptide to bind (for example, residues near position 4, the dimer interface, or another surface patch).
Set peptide length to 12 amino acids.
Enable motif and affinity guidance (and solubility/hemolysis guidance if available). Generate peptides.
After generation, briefly describe how these moPPIt peptides differ from your PepLMM peptides. How would you evaluate these peptides before advancing them to clinical studies?
moPPIt Peptide
Binder Sequence
Hemolysis
Solubility
Affinity
Motif
m_peptide_1
TEQKKFTCRTQD
0.98065103
0.91666669
5.93099356
0.92896324
m_peptide_2
YQKCLVRETTGV
0.96973951
0.75
6.67283011
0.86192995
m_peptide_3
KEKKQRVQCTDG
0.97739551
0.91666669
5.56807947
0.85476714
m_peptide_4
SVKTTHCEQGKP
0.97208287
0.83333331
5.50222826
0.84767622
Table 5. moPPIt-generated binder peptides and their in-silico attributes. The following weight adjustments were made for targeting position 4, specifically: Hemolysis=1, Solubility=1, Affinity=1, Motif=1.
Unlike the PepMLM peptides, none of the moPPIt peptides achieved desirable low scores on hemolytic activity prediction. Instead, all peptides had high hemolysis scores. This is due to the region surrounding position 4 and the binder peptide that has a high proportion of hydrophobicity, resulting in high scoring of hemolytic activity. A further optimization is needed to reduce net hydrophobicity and charge residues in the peptide binder. As peptides were designed for a specific region, it can be harder to achieve every desired trait, requiring the consideration of trade-offs as well.
As a next step, I applied more stringent weight adjustment to optimize peptide binders in moPPIt (see results in Table 6 and Fig 4).
moPPIt Peptide
Binder Sequence
Hemolysis
Solubility
Affinity
Motif
m2_peptide_1
DTECTQTRLKKS
0.9731365
0.916666687
5.666040897
0.787758291
m2_peptide_2
YDVTTRLYFGRW
0.94705141
0.666666627
6.606595039
0.334373683
m2_peptide_3
KDEFDCKPCYNL
0.93650597
0.75
7.194892883
0.706446946
m2_peptide_4
TEKTIEKKQWCA
0.98217107
0.75
6.305016994
0.889526725
m2_peptide_5
SKECGTLRFKQR
0.96697627
0.833333313
6.679063797
0.910008729
m2_peptide_6
YKKETVKTNQFH
0.97450537
0.833333313
5.35283041
0.899615645
m2_peptide_7
TTSTHICTCPLC
0.87881172
0.75
5.995385647
0.758235991
m2_peptide_8
TGDTTCLKKQHF
0.97177865
0.833333313
5.857715607
0.851789355
Table 6. MoPPIt-generated binder peptides and their in-silico attributes, testing more stringent weight adjustment for optimal binder generation. The following weight adjustments were made, targeting position 4, specifically: Hemolysis=10, Solubility=5, Affinity=5, Motif=10.
(A) m2_peptide_1
(B) m2_peptide_2
(C) m2_peptide_3
(D) m2_peptide_4
(E) m2_peptide_5
(F) m2_peptide_6
(G) m2_peptide_7
(H) m2_peptide_8
Fig 4. AlphaFold modeling of moPPIt peptides with SOD1_A4V visualized by PyMol. SOD1_A4V monomer (blue) and binder peptides (orange). Highlights: A4V residue with sidechain in stick (red), dimer interface residues (green) 50-53, 114, 148, and 150-153, and sidechains of residues highlighted in peptide binders possibly interacting with A4V in stick (orange): m2_peptide_1, residue 4C; m2_peptide_3, residue 10V; m2_peptide_4, residue 11C; m2_peptide_5, residue 4C; m2_peptide_7, residue 10P, and m2_peptide_8, residue 7C. Based on the best-scoring models of m2_peptide_2 and m2_peptide_6, these binders did not interact with residue A4V.
A new set of moPPIt-generated binder peptides targeting position 4 has still fallen short in achieving low hemolysis scores under the conditions under which the moPPIt generator was run. This indicates further optimization is still needed.
Affinity scores ranged between 5.35 and 7.19, not significantly different from the previous set where the weights were less stringent. Notably, the motif score for the m2_peptide_2 was significantly low, 0.33, and this peptide is localized elsewhere. m2_peptide_6 also localized elsewhere, even though the motif score was higher, 0.89, and the reason for this is unclear. The rest of the moPPIt peptides had expected localization relative to position 4, and by visual inspection, they may interact with position 4 and the surrounding hydrophobic dimer interface, indicating promise for advancement. The only issue is the high hemolytic activity. To achieve less hemolytic activity, hydrophobic amino acids can be replaced by less hydrophobic ones, and charged residues can be balanced. As Gemini AI research also suggests, there are other approaches to reduce hemolytic activity, such as peptide cyclization and conjugating peptides to polymers.
I’ve used Gemini AI for research.
Prompts:
Can you explain why hemolytic activity is seen in some peptides designed for therapeutic purposes? How to avoid hemolytic activity in peptides for better therapeutics?
Part B: BRD4 Drug Discovery Platform Tutorial (Optional)
Part C: Final Project: L-Protein Mutants
High-level summary:
The objective of this assignment is to improve the stability and auto-folding of the lysis protein of a MS2-phage. This mechanism is to key to the understanding of how phages can potentially solve antibiotic resistance.
The objective is to improve the stability and autofolding of the lysis protein.
More specifically, we want to engineer the lysis protein to increase the ability of MS2 to overcome a common E. coli resistance mechanism: a single point mutation in DnaJ prevents the binding of the lysis protein. We can attempt this by mutating the lysis protein to change its properties. Together, we aim for finding mutations that change the lysis protein one of the following ways: (1) an independence of lysis protein processing from DnaJ or other bacterial chaperones or (2) a faster or more efficient killing of E. coli to reduce the window in which the host can acquire resistance (3) higher lysis protein expression. In the course of this class, we will proceed through the following stages to create and test new MS2 phage mutants:
In this subset:
Stage 1: Engineer novel L-protein mutants using protein design tools
Stage 2: Synthesize the L-protein mutant gene via Twist
Stage 3: Clone the L-protein mutant gene into a plasmid using Gibson Assembly
Stage 4: Test the L-protein mutant’s structural integrity using the Nuclera system
Stage 5: Test the L-protein in E. coli with plaque assays
Week 6 HW: Genetic Circuits Part I
Assignment: DNA Assembly
Answer the following questions about the protocol in:
1. What are some components in the Phusion High-Fidelity PCR Master Mix, and what is their purpose?
Below are the components found in the New England Biolab’s Phusion HF PCR Master Mix:
•Phusion DNA Polymerase: It performs 5’ → 3’ polymerase activity and 5’ → 3’exonuclease (proofreading) activity with greater fidelity, >50x better in comparison to regular Taq polymerase.
Because it is a fusion polymerase with an Sso7d domain, it adds nucleotides more quickly, reducing the required extension time. Due to the exonuclease activity. Phusion polymerase produces blunt ends.
•dNTPs (deoxyribonucleoside triphosphates; dATP, dCTP, dGTP, dTTP): DNA building blocks are incorporated into DNA during polymerization.
•Tris-HCl Buffer: Stabilizes pH for optimal activity.
•MgCl2: It is the cofactor for the polymerase, which is required for the reaction.
•KCl: a monovalent salt, stabilizes the negatively charged DNA duplexes, including primer annealing.
•Tween 20 (Non-Ionic Detergent):• Prevents polymerase from sticking to the tube’s walls and eliminates the adverse effects of SDS contamination during the DNA extraction process.
•DMSO; (optional; not in the Master Mix): a destabilizer, disrupts base stacking, and relaxes secondary structures. It is particularly helpful to work with high GC content DNA templates.
I’ve researched Claude.
Prompts:
Can you research the components in the Phusion High-Fidelity PCR Master Mix? What do they do?
2. What are some factors that determine primer annealing temperature during PCR?
Annealing temperature (Ta) is the temperature at which primer and template hybridize. During PCR, the primer-DNA duplex needs to form in order for the polymerase to start the reaction.
The Ta of the reaction is calculated based on the calculated melting temperature (Tm) of the primers.
Optimal Ta is needed to achieve specificity and efficiency in the formation of the primer-DNA duplex.
The general rule is that Ta is set to 5°C below the lowest Tm of the primer pair in most polymerase reactions, except for Phusion polymerase, which sets Ta to 3°C above the lowest Tm of the primer pair.
Because Ta is calculated based on Tm, the parameters listed below affecting Tm would also affect Ta:
GC content. Guanine and cytosine base pairs are stronger due to having three hydrogen bonds. Templates rich with GC content would have a higher Tm because more energy is needed to separate the strands.
Primer length. The longer the primer, the higher the Tm.
Nearest-neighbor base stacking interactions. The calculation takes into account stability differences in neighboring dinucleotides, not just base composition.
Primer secondary structure. Hairpins and self-dimer formation would reduce the actual availability, and Tm needs to be adjusted.
Salt and primer concentrations. More concentrations increase Tm.
Additives. DMSO addition would reduce Tm.
I’ve researched Claude.
Prompts:
Can you research factors determining primer annealing temperature during PCR?
3. There are two methods from this class that create linear fragments of DNA: PCR and restriction enzyme digests. Compare and contrast these two methods, both in terms of protocol as well as when one may be preferable to use over the other.
Restriction enzyme digests. A DNA fragment can be lifted off a plasmid by simply cutting with restriction enzymes, given that the existing cut sites of the enzymes are outside of the DNA region of interest. The liberated DNA fragment preserves the original sequence since there has been no manipulation other than restriction digest.
PCR amplification. In contrast, the same DNA fragment can be lifted off a plasmid by PCR amplification. Since there is DNA synthesis involved, even with a high-fidelity polymerase, there is a chance of error, and the original sequence may have changed. So, PCR-amplified DNA fragments need to be verified by sequencing.
PCR amplification has the advantage that any additional sequences can be built during PCR, including a restriction enzyme cut site, providing greater flexibility and convenience in downstream use cases. This wouldn’t be the case for the restriction enzyme method, which relies on the existing restriction enzyme cut sites in the DNA sequence.
If the DNA of interest could be easily recovered by a simple restriction enzyme digestion and is ready to use in the downstream cloning applications, a restriction enzyme method would be a good choice.

If there is inflexibility in enzyme sites in downstream cloning, it is necessary to use the PCR amplification method to produce the fragment with a built-in cut site.

If the DNA source is genomic DNA, it is best to use PCR amplification instead of restriction digest for the reason that the genomic DNA is large and would produce many DNA fragments after a restriction enzyme digest, not easy to separate the desired fragment. Depending on the restriction enzymes, many are likely to cut more than one location.
4. How can you ensure that the DNA sequences that you have digested and PCR-ed will be appropriate for Gibson cloning?
For Gibson cloning, the major requirement is to have homologous sequences between the fragments at both ends to be joined. The overlap sequences are usually between 20 and 30 bp for 2+ fragments or greater if more fragments are to be joined.
Gibson cloning uses T5 exonuclease, which chews back the 5’ ends of each fragment and generates long overhangs. Joining the fragments requires overlaps between overhangs. The other two enzymes in the Gibson reaction are the Phusion polymerase and the Taq DNA ligase. Phusion fills the gaps created by the exonuclease activity, and the ligase seals the double-stranded DNA.
PCR-amplified fragments should be amplified by primers that incorporate the overhang, the "tail" part. So, primers by design should include the "tail" part that does not anneal when amplifying from a template to begin with. This way, the PCR-amplified product would be generated with an overlapping region to the joining fragment.

For the restriction enzyme-generated fragments, make sure that homologous regions are sufficiently present at the joining ends of the fragments. No need to make the double-stranded end blunt, as T5 exonuclease will chew back the 5'ends.
5. How does the plasmid DNA enter the E. coli cells during transformation?
E. coli cells are not naturally competent; they cannot take up DNA. LPS, the outer membrane, and the inner membrane of the E. coli cells are negatively charged, as is DNA, so they repel. To overcome repulsion, the transformation procedures transiently modify the cell surface by creating pores that DNA can pass through.
Electroporation: an electric field is applied to the cells that causes the phospholipids in the cell membrane to go through a phase transition, creating water-filled pores. DNA molecules are pulled inside cells. The phospholipid layer spontaneously reseals. If pores seal quickly, cells survive.

CaCl2 treatment: As a divalent cation, Ca2+ acts on both the DNA and the cell membrane, neutralizing the repulsion between DNA and LPS of the outer membrane. DNA is then absorbed on the cell surface, and stability is achieved at cold temperatures by incubating the mixture on ice. A rapid temperature shift at 42°C (heat shock for 45 seconds) causes a phase transition in the lipid membrane, creating transient gaps. DNA moves inside the cytoplasm. Subsequent cold shock by returning the mixture to ice causes membrane fluidity to change, restoring the membrane integrity. DNA is trapped inside cells.
6. Describe another assembly method in detail (such as Golden Gate Assembly)
• Explain the other method in 5 - 7 sentences plus diagrams (either handmade or online).
• Model this assembly method with Benchling or Asimov Kernel!
Golden Gate Assembly is a one-pot reaction, alternating in a cycle of digestion and ligation to drive the assembly of multiple fragments. It uses Type IIS restriction enzymes and T4 DNA ligase in iterative cycles, continuing towards the completion of a product. If the fragments are correctly assembled, they would lose their Type IIS cut sites, and in the next digestion cycle, they won’t be re-cut.
The enzyme recognition site and the actual cleavage site typically differ for Type IIS restriction enzymes. These enzymes cut outside of their recognition sequence, unlike other restriction enzymes.
Fragment preparation: The type IIS recognition sequences are designed by PCR. A spacer sequence is included to improve the cleavage efficiency of the enzyme, as well as an overhang sequence at the fragment junction. Directionality of the fragment assembly is achieved by the overlapping overhang sequences.
Vector preparation: The Type IIS cut sites should be designed outward, resulting in the removal of the recognition sequence.
The diagram below shows a typical design of an overlapping overhang sequence on several assembly fragments:
block-beta
columns 1
block:ID
A["(seq-a)_fragment1_(seq-b)"]
B["(seq-b)_fragment2_(seq-c)"]
C["(seq-c)_fragment3_(seq-d)"]
end
Modeling the assembly design with Benchling
I’ve used 4 parts to construct the sfGFP expression plasmid with the Benchling Golden Gate assembly tool.
Part 1: The backbone; ColE1 ori and TetR cassette
Part 2: T7 promoter and RBS
Part 3: sfGFP coding sequence
Part 4: T7 terminator

All parts include a type IIS enzyme recognition sequence (BsmB1) and an overhang sequence (4 bases) designed at both ends. To assemble in a sequential order, from Part 1 to Part 4, one of the two overhangs must overlap with the joining part that follows.
Below are the sequences of Parts, highlighting the enzyme sites and overhangs.
2. Create a blank Notebook entry to document the homework and save it to that Repository.
3. Explore the devices in the Bacterial Demos Repo to understand how the parts work together by running the Simulator on various examples, following the instructions for the simulator found in the “Info” panel (click the “i” icon on the right to open the Info panel).
4. Create a blank Construct and save it to your Repository.
Recreate the Repressilator in that empty Construct by using parts from the Characterized Bacterial Parts repository.
Search the parts using the Search function in the right menu.
Drag and drop the parts into the Construct.
Confirm it works as expected by running the Simulator (“play” button) and compare your results with the Repressilator Construct found in the Bacterial Demos repository.
Document all of this work in your Notebook entry - you can copy the glyph image and the simulator graphs, and paste them into your Notebook.
Example Construct Schematic
Example Construct Circle
Example Construct Simulation Plots
The Example Construct
PhlF represses pPhlF
AmeR represses pAmeR
LitR represses pLitR

This construct achieved low levels of protein production in the order of LitR > AmeR > PhlF.

The example construct did not behave as a represillator; there was no oscillation. Instead, all expression systems similarly achieved a very low level of expression.

I've learned through research that asymmetric expression is needed to kick in oscillatory behavior. Different methods can be applied here: the ribosome binding site can be altered to give different strengths of translation. Levels of repressors can be controlled by inducible promoters. Degradation systems can be built to lower the availability of repressors.

Below, I've modified the same construct with the addition of inducible promoters and monitored the change in the protein production outcome in simulation plots.
5. Build three of your own Constructs using the parts in the Characterized Bacterials Parts Repo
Explain in the Notebook Entry how you think each of the constructs should function.
Run the simulator and share your results in the Notebook Entry.
If the results don’t match your expectations, speculate on why and see if you can adjust the simulator settings to get the expected outcome.
Construct_1 Schematic
Construct_1: no ligand
Construct_1: plus L-arabinose
Construct_1
PhlF represses pPhlF
AmeR represses pAmeR
LitR represses pLitR
Inducible expression of LitR (pBad)

This construct achieved the highest levels of LitR. AmeR and PhlF remained low.
Construct_2 Schematic
Construct_2: no ligand
Construct_2: plus L-arabinose, IPTG
Construct_2
PhlF represses pPhlF
AmeR represses pAmeR
LitR represses pLitR
Inducible expression of LitR (pBad)
Inducible expression of AmeR (pTac)

This construct achieved the highest levels of both LitR and AmeR. PhlF remained low.
Construct_3 Schematic
Construct_3: no ligand
Construct_3: plus L-arabinose, IPTG, aTc
Construct_3
PhlF represses pPhlF
AmeR represses pAmeR
LitR represses pLitR
Inducible expression of LitR (pBad)
Inducible expression of AmeR (pTac)
Inducible expression of PhlF (paTc)

This construct achieved the highest levels of all repressors, PhlF, AmeR, and LitR. Although higher levels of expression have been achieved, there is still no oscillation. Further modifications are needed to gain a repressillator function.
I’ve used Claude AI research.
Prompts: Can you help me analyze this construct expressed in E. coli? Simulation data tell me that the expression is very low. Is that due to the continuous repression of each system?
Week 7 HW: Genetic Circuits Part II
Assignment Part 1: Intracellular Artificial Neural Networks (IANNs)
1. What advantages do IANNs have over traditional genetic circuits, whose input/output behaviors are Boolean functions?
A Boolean function is based on a binary system where it can only assign two values, such as "true" or "false", or as in numeric values: "0" or "1". This is akin to digital systems. Complexities in the biological systems cannot be adequately represented by binary input/output. Because signals in biological systems, such as concentrations of regulatory proteins, vary in gradation. So, a Boolean genetic circuit would have limitations in interpreting the complexities of a biological system.

IANNs are based on analog systems where weights are implemented. Examples of weights include variable concentrations of regulatory proteins, promoter strengths, and RBS efficiencies. These make positive or negative regulatory output. IANNs also integrate dose-response analysis, from inhibitory to non-inhibitory concentrations of a typical sigmoidal curve. IANNs consider biases such as taking into account whether promoters could be leaky. Advantageous parts are the ability to handle a great level of complexity due to the gradation that living systems have.
2. Describe a useful application for an IANN; include a detailed description of input/output behavior, as well as any limitations an IANN might face to achieve your goal.
IANNs for Forest Restoration

Several areas in the world face a threat of losing forests due to increased fungal pathogens and insect activity in a warming climate. Intracellular IANNs could have a useful application here by sensing the threats and producing defensins (antifungal peptides) and terpenes (insect deterrents).

Threats:

Amazon basin: Brazil, Peru, Colombia (Ceratocystis wilt, Phytophthora root rot, Leaf blight fungi, root rot complexes)

Europe: Scandinavia, Poland, Baltic states (Ash dieback, Bark-beetle-fungus complex, root rot)

Southeast Asia: Borneo, Sumatra, Mekong (Damping-off disease, vascular wilt, seedling fungal mortality)

Congo Basin: DRC, Cameroon, Gabon (Armillaria root disease, Cacao swollen shoot virus, termite crown damage)

North America: Eastern US, Pacific Northwest, Canada (Emerald ash borer, white nose syndrome, sudden oak death, chestnut blight)

The rescue plan:

A biosensor can be delivered via an endophyte microorganism (a commensal bacterial species such as Bacillus subtilis or Pseudomonas fluorescens or mycorrhizal fungi) inside trees, and an RNA-based biosensor can be additionally applied topically.

IANN Input/Output:

As an example, the IANN circuit can be designed to detect several markers indicative of pest activity, such as chitin, jasmonic acid (JA), and reactive oxygen species (ROS). Chitin would be found due to fungal activity. JA would be released due to insect feeding/damage to the plant. ROS would be detected at the infection site as the plant's response to stressors.

Overall, the IANN design in the example is responsive to 3 inputs (chitin, JA, and ROS), with an output to produce a synthetic regulator that turns the gene expression on simultaneously for 2 outputs, defensins and terpene production. The synthetic regulator is the middle layer. The synthetic regulator is designed to be expressed by a series of promoters, specific to the output of each sensor system. The amount of the synthetic regulator made would reflect being transformed from the input as a weighted function.

Chitin sensor. Plants sense chitin through the CERK1 receptor, which is bound to a membrane and has an extracellular sensing domain and a cytoplasmic kinase domain. Once chitin binds to the receptor, a signaling cascade leads to phosphorylation of a transcription factor, WRKY, which turns on gene expression. I would integrate the chitin sensor into the engineered microbe by building the synthetic hybrid CERK1 receptor and synthetic WRKY transcription factor. Synthetic WRKY would produce an output in response to chitin, that is, it will drive the expression of the synthetic regulator in the middle layer.

Jasmonate sensor. Jasmonates are phytohormones produced by the plant, and they trigger the degradation of proteins called JAZ repressors, which have a jas motif, a signature for degradation. The COI1 domain of the 26S proteasome mediates the degradation of JAZ repressors. The degradation of JAZ repressors enables JA-responsive gene expression as part of plant defense. Critically, a form of JA, JA-Ile, is required for the COI1 activity. A free form of JA is not the active ligand for COI1. A plant enzyme called JAR1 (JA amino acid synthetase) modifies JA by adding Ile. I would integrate the jasmonate sensor in the engineered microbe by creating a synthetic repressor with a jas-motif. COI1 and JAR1 are both also needed to be expressed in the engineered microbe. A synthetic repressor with a jas-motif would produce output in response to JA, driving the expression of the synthetic regulator in the middle layer.

ROS sensor. The bacterial H2O2 sensor, OxyR, is a transcriptional regulator. I would integrate this as part of the IANN circuit with the output that will drive the expression of the synthetic regulator in the middle layer.

Output, defensin.
These are small peptides, rich in cysteine. Several defensins are described, such as the MtDef4 class for ash dieback. Some defensins could also have antibacterial activity. Given that a choice of defensin does not kill the host, integration into the IANN would require that the expression depend on the synthetic regulator from the middle layer.

Output, terpenes.
Volatile compounds produced by the terpene synthase gene have an insect-repelling effect. These can be toxic to bacterial cells as well. Given that the choice of terpene is not bactericidal, integration into the IANN circuit is the same as defensin. The terpene expression is driven by the synthetic regulator from the middle layer.

Limitations:
Colonization of the endophyte in trees is a complex process. The stability of the IANN circuit in the endophyte and the succession in colonization are both unknown.

A massive delivery operation would be needed since forests are fairly large areas. Spray treatments could work for crops, but it is not certain that the spray delivery method would work for trees in forests.

Interaction with the soil microbiome, which is unknown, can be a concern since a genetically engineered organism is being released to the environment.

Public perception and regulatory barriers can be a limitation to using genetically engineered organisms in the environment.

Birds live in trees and feed on insects. An environmental safety assessment needs to be made to ensure the engineered endophyte does not pose a threat to birds and other animals.
3. Below is a diagram depicting an intracellular single-layer perceptron where the X1 input is DNA encoding for the Csy4 endoribonuclease and the X2 input is DNA encoding for a fluorescent protein output whose mRNA is regulated by Csy4. Tx: transcription; Tl: translation.
Draw a diagram for an intracellular multilayer perceptron where layer 1 outputs an endoribonuclease that regulates a fluorescent protein output in layer 2.
Assignment Part 2: Fungal Materials
1. What are some examples of existing fungal materials, and what are they used for? What are their advantages and disadvantages over traditional counterparts?
2. What might you want to genetically engineer fungi to do and why? What are the advantages of doing synthetic biology in fungi as opposed to bacteria?
Assignment Part 3: First DNA Twist Order
0. Review the Individual Final Project documentation guidelines.
1. Submit this Google Form with your draft Aim 1, final project summary, HTGAA industry council selections, and shared folder for DNA designs. DUE MARCH 20 FOR MIT/HARVARD/WELLESLEY STUDENTS
2. Review Part 3: DNA Design Challenge of the week 2 homework. Design at least 1 insert sequence and place it into the Benchling/Kernel/Other folder you shared in the Google Form above. Document the backbone vector it will be synthesized in on your website.
Week 9 HW: Cell-Free-Systems
Homework Part A: General and Lecturer-Specific Questions
General homework questions
Explain the main advantages of cell-free protein synthesis over traditional in vivo methods, specifically in terms of flexibility and control over experimental variables. Name at least two cases where cell-free expression is more beneficial than cell production.
Describe the main components of a cell-free expression system and explain the role of each component.
Why is energy provision regeneration critical in cell-free systems? Describe a method you could use to ensure continuous ATP supply in your cell-free experiment.
Compare prokaryotic versus eukaryotic cell-free expression systems. Choose a protein to produce in each system and explain why.
How would you design a cell-free experiment to optimize the expression of a membrane protein? Discuss the challenges and how you would address them in your setup.
Imagine you observe a low yield of your target protein in a cell-free system. Describe three possible reasons for this and suggest a troubleshooting strategy for each.
Homework questions from Kate Adamala
Pick a function and describe it.
What would your synthetic cell do? What is the input and what is the output?
Could this function be realized by cell-free Tx/Tl alone, without encapsulation?
Could this function be realized by genetically modified natural cell?
Describe the desired outcome of your synthetic cell operation.
Design all components that would need to be part of your synthetic cell.
What would the membrane be made of?
What would you encapsulate inside? Enzymes, small molecules.
Which organism your Tx/Tl system will come from? Is bacterial OK, or do you need a mammalian system for some reason? (hint: for example, if you want to use small molecule modulated promotors, like Tet-ON, you need mammalian)
How will your synthetic cell communicate with the environment? (hint: are substrates permeable? or do you need to express the membrane channel?)
Experimental details
List all lipids and genes. (bonus: find the specific genes; for example, instead of just saying “small molecule membrane channel” pick the actual gene.)
How will you measure the function of your system?
Example solution
Based on Lentini, R. et al., 2014. Nat comm, 5, p.4012.
What would your synthetic cell do? What is the input and what is the output?
Expand the sensing capacity of bacteria. Input: theophylline (inert to bacteria). Output of the SMC: IPTG. Output of the whole system: GFP produced in bacteria. (Theophyline aptamer reference: Martini, L. & Mansy, S.S., 2011. Cell-like systems with riboswitch controlled gene expression. Chemical Communications, 47(38), p.10734.)
Could this function be realized by cell-free Tx/Tl alone, without encapsulation?
No. If the IPTG were not encapsulated, it would go into the bacteria without the need of theophylline-induced membrane channel synthesis, thus the synthetic cell actuator would not exist.
Could this function be realized by a genetically modified natural cell?
Yes, in this particular case: the theophylline aptamer could be incorporated into a transformed gene. This lacks generality though – it is easier to make SMC than modify bacteria, so in this system a single bacteria reporter can be used to detect various small molecules.
Describe the desired outcome of your synthetic cell operation.
In the presence of SMC, bacteria sense theophylline.
Design all components that would need to be part of your synthetic cell.
What would be the membrane made of?
Phospholipids + cholesterol.
What would you encapsulate inside? Enzymes, small molecules.
cell-free Tx/Tl system, IPTG, gene for membrane transporter under the control of theophylline aptamer.
Which organism your Tx/Tl system will come from? Is bacterial OK, or do you need a mammalian system for some reason? (hint: for example, if you want to use small molecule modulated promotors, like Tet-ON, you need mammalian)
Bacterial, because of the theophylline riboswitch used as SMC input.
How will your synthetic cell communicate with the environment? (hint: are substrates permeable? or do you need to express the membrane channel?)
The membrane is permeable to the input molecule (theophylline), the output is IPTG that will cross the membrane via the membrane pore created after theophyline-initiated gene expression.
Experimental details
List all lipids and genes. (bonus: find the specific genes; for example, instead of just saying “small molecule membrane channel” pick the actual gene.)
Lipids: POPC, cholesterol
Enzymes: bacterial cell-free Tx/Tl
Genes: a-hemolysin (aHL) to encapsulate in SMC
Biological cells: E.coli transformed with GFP under T7 promoter and a lac operator
How will you measure the function of your system?
Measure GFP output of the cells via flow cytometry. Alternatively, use enzymatic reporter, like luciferase, and measure bulk output of the enzyme.
Homework questions from Peter Nguyen
Freeze-dried cell-free systems can be incorporated into all kinds of materials as biological sensors or as inducible enzymes to modify the material itself or the surrounding environment. Choose one application field — Architecture, Textiles/Fashion, or Robotics — and propose an application using cell-free systems that are functionally integrated into the material. Answer each of these key questions for your proposal pitch:
Write a one-sentence summary pitch sentence describing your concept.
Water-producing rescue robots: earthquake rescue robots designed with a chemotactic sensing ability to detect live human presence, to inform, and to deliver water harvested from the atmosphere to survivors.
How will the idea work, in more detail? Write 3-4 sentences or more.
There would be two main cell-free systems in the robot:
Breath detection for the living and separation of the deceased by the absence and presence of certain volatile compounds, which would allow making decisions by using logic gates with specific sensing circuits (Example: AND-gate; CO₂ + acetone; OR-gate; isoprene or CO₂ live human detected).
As the cell-free system is freeze-dried, it needs to be hydrated and activated. This can be achieved through a hydrogel as described below. Additionally, the robot’s movement needs to be directional and responsive to a gradient of the signals in order to locate survivors. Similar to a bacterial chemotaxis system, which resets and generates a new response in the gradient of chemicals, a robot’s sensing circuits can be designed to reset, aiding the movement in a gradient.
Water harvesting hydrogel: The robot has a hydrogel that harvests moisture from the atmosphere continuously. An enzyme that can cleave the hydrogel matrix, such as a protease or cellulase, could be activated by CO₂ at a threshold (or other breath volatiles). Water is released from the hydrogel. Then, water is collected in a tube.
What societal challenge or market need will this address?
An earthquake is not known in advance. Building collapses, trapping people in rubble, are unavoidable. The water-producing rescue robot could extend the time for survivors as help is on the way.
How do you envision addressing the limitations of cell-free reactions (e.g., activation with water, stability, one-time use)?
Because hydrogel traps water, it is available for hydration. A microfluidic delivery device can connect the two, hydrating cell-free freeze-dried components on demand. The robot’s directional movement would be dependent on the shelf life of the activated enzymes. A built-in camera, GPS, etc., should be helpful for informing the location of the robot.
Homework question from Ally Huang
Freeze-dried cell-free reactions have great potential in space, where resources are constrained. As described in my talk, the Genes in Space competition challenges students to consider how biotechnology, including cell-free reactions, can be used to solve biological problems encountered in space. While the competition is limited to only high school students, your assignment will be to develop your own mock Genes in Space proposal to practice thinking about biotech applications in space!
For this particular assignment, your proposal is required to incorporate the BioBits® cell-free protein expression system, but you may also use the other tools in the Genes in Space toolkit (the miniPCR® thermal cycler and the P51 Molecular Fluorescence Viewer). For more inspiration, check out link.
Provide background information that describes the space biology question or challenge you propose to address. Explain why this topic is significant for humanity, relevant for space exploration, and scientifically interesting. (Maximum 100 words)
Name the molecular or genetic target that you propose to study. Examples of molecular targets include individual genes and proteins, DNA and RNA sequences, or broader -omics approaches. (Maximum 30 words)
Describe how your molecular or genetic target relates to the space biology question or challenge your proposal addresses. (Maximum 100 words)
Clearly state your hypothesis or research goal and explain the reasoning behind it. (Maximum 150 words)
Outline your experimental plan - identify the sample(s) you will test in your experiment, including any necessary controls, the type of data or measurements that will be collected, etc. (Maximum 100 words)
Homework Part B: Individual Final Project
Put your chosen final project slide in the appropriate slide deck.
Submit Final Project selection form.
Begin planning how you will write your final project documentation based on these guidelines.
Prepare your first DNA order.
Below is the final project slide screenshot.
This project computationally addresses aim 1.
Week 10 HW: Imaging and Measurement
Homework: Final Project
Please identify at least one (ideally many) aspect(s) of your project that you will measure. It could be the mass or sequence of a protein, the presence, absence, or quantity of a biomarker, etc.
My final project focuses on the development of a biosensor based on a capture nanobody and reporter DNA aptamer, enabling the detection of a protein biomarker for the body’s iron status.
Key areas for measurement:
Characterization of the purified biomarker protein.
Screening and validation of DNA aptamers to biomarker proteins and determining binding affinity.
Electrochemical response measurements to characterize the liberation effect of the toehold region on the nanobody and the proximity effect of the toehold region with a branch-migration region on the DNA aptamer.
Please describe all of the elements you would like to measure, and furthermore, describe how you will perform these measurements.
What are the technologies you will use (e.g., gel electrophoresis, DNA sequencing, mass spectrometry, etc.)? Describe in detail.
1. Characterization of the purified biomarker protein: the human ferritin heavy chain
Total protein quantification by a colorimetric assay, such as a commercially available BCA (Bicinchoninic Assay). The assay is based on the reduction of copper by protein, a.k.a. the biuret reaction, with the output of color development. Color can then be detected by absorbance at 562 nm in a spectrophotometer. A calibration or standard curve must be generated with a known purified protein, such as BSA, at the same assay scale. The standard protein must be serially diluted at the assay’s linear range and run alongside the experimental samples. This way, measurement would be obtained under the same conditions, such as fluctuations from the instrument’s operational system. Using the standard curve, the concentration of the unknown sample can be calculated based on its absorbance values, which would be compared to the reference protein.
Visualization of the purified protein by SDS-PAGE (SDS Polyacrylamide Gel Electrophoresis) to understand whether the co-purified protein is present in the sample. The SDS-PAGE technique is a low-cost way to understand the purification process. This technique separates the proteins in denaturing conditions in an electrical field based on mass (molecular weight). A protein with a smaller mass would run quicker in the gel, and larger proteins would run slower. The protein gel is stained, and the protein band is visualized. Known protein markers are loaded as a ladder that can help guide the estimation of the mass of proteins on the gel. Furthermore, a protein mass can be quantified on the gel by quantifying the intensities of protein bands. An image of the gel would store data as pixels, and pixel intensities can be calculated. So, the protein gel after staining must be imaged. For quantification, similarly, a standard curve must be generated with a known protein as a reference.
Oligomeric state of the purified protein can be determined by CDMS (Charge Detection Mass Spectrometry) analysis. The human ferritin heavy chain is a 24-subunit protein with ~500 kDa mass that forms a 12 nm diameter spherical shell. The inside of the shell is hollow. Each subunit of ferritin is ~21 kDa. CDMS is particularly useful for analyzing large molecules such as ferritin. Technology has been developed to measure the masses of individual ions as they travel through a detection cylinder in the instrument. Signals coming from the induced charge are then used for calculating the mass-to-charge ratio and charge for each ion. This enables measurement of molecules with mass ranges extending to much higher masses. Since the ferritin is self-assembled into a 24-subunit sphere, CDMS analysis can be useful to identify the oligomeric status of the synthesized protein from the cell-free reaction.
2. Screening and validation of DNA aptamers to biomarker proteins and determining binding affinity.
DNA aptamers for ferritin can be identified by SELEX and YSD:
SELEX (Systemic Evolution of Ligands by Exponential Enrichment) is a widely used in vitro technique that identifies candidate DNA aptamers with high binding affinity to the target protein from a library of oligos. The purified target protein immobilized on a bead and a library of DNA oligos go through several cycles of binding and elution. High-affinity binders obtained from this technique must be analyzed, and binding affinity must be measured.
Yeast surface display (YSD) is a cell-based in vivo method coupled with flow cytometry, which can be coupled with SELEX for the validation and characterization of aptamers. The target protein is expressed and displayed on the yeast surface, and immobilized targets are incubated with DNA aptamer-dye conjugates and are passed through flow cytometry. Protein/binder complexes are detected based on the excitation/emission spectra of the dye.
DNA aptamer binding affinity measurements:
CDMS (Charge Detection Mass Spectrometry) can be used for characterizing the equilibrium binding affinity (Kd) of binders to the target protein in the native state.
NOTES on Ferritin DNA aptamers:
DNA aptamers known to interact with ferritin are not reported up-to-date. However, a nucleic acid aptamer against anti-ferritin antibodies has been reported with a Kd of 1600 nM after multi-round SELEX (Hamm 1996.)
Nanobody binder for ferritin:
Strong nanobody binders to ferritin heavy chain have been identified after immunization of alpaca and immune library screening (Hu et al. 2022.) Hu et al. reported the CDR3 amino acid sequences of strong binders, Nb72 and Nb151, AAACDDGL——IIRTTVSY and AAACDDIL——NPRTTVVV, respectively.
3. Electrochemical response measurements to characterize the liberation effect of the toehold region on the nanobody and the proximity effect of the toehold region with a branch-migration region on the DNA aptamer.
As it would be the final version of this biosensor platform, electrochemical response measurements require the manufacturing of electrodes and the immobilization of the capture nanobody and reporter DNA aptamer on the electrode’s surface. For the sake of screens and selecting the working pairs, capturing and detecting DNA aptamers, I will approach multi-level assays that reveal different aspects of interactions in the biosensor development.
The main technical basis of the biosensor design does not rely on enzymatic activity for detection. It uses a mechanism called “the toehold-mediated strand displacement.” It is widely applied in biosensor designs (Wang et al. 2015.) In this strategy, the toehold is in a cage. It must be triggered to be released, which could happen by the target protein binding (steric hindrance) and proximity-induced strand invasion by the DNA aptamer binding to an adjacent epitope.
Proximity Ligation Assay (PLA): An assay to reveal the proximity of the DNA aptamers. It measures direct interaction between two distinct DNA aptamers due to having complementary regions that lead to hybridization and ligation by the provided DNA ligase. If aptamers interact, it will produce a ligated hybrid molecule that can be detected by PCR amplification with a provided connector oligo. If the aptamers do not interact, no PCR product is produced (Fredriksson et al. 2002.) Aptamer interactions can also be detected by fluorescent dyes (Baldinotti et al. 2024.) Although the proposed project for ferritin detection does not use an enzymatic process or fluorescent dyes, PLA can be used as a screen in identifying the best proximity of the nanobody and the DNA aptamer pairs. So, nanobodies that are conjugated with a complementary oligo and the DNA aptamer carrying the complementary region to the cage will be incubated with the purified ferritin protein in solution and a PCR reaction will follow.
Homework: Waters Part I - Molecular Weight
We will analyze an eGFP standard on a Waters Xevo G3 QTof MS system to determine the molecular weight of intact eGFP and observe its charge state distribution in the native and denatured (unfolded) states. The conditions for LC-MS analysis of intact protein cause it to unfold and be detected in its denatured form (due to the solvents and pH used for analysis).
Based on the predicted amino acid sequence of eGFP (see below) and any known modifications, what is the calculated molecular weight? You can use an online calculator like the one at link
eGFP Sequence:
Note: This contains a His-purification tag (HHHHHH) and a linker (the LE before it).
GFP+LE+6xH = 247 amino acids
Below is the result from the online calculator:
Calculate the molecular weight of the eGFP using the adjacent charge state approach described in the recitation. Select two charge states from the intact LC-MS data (Figure 1) and:
Determine z for each adjacent pair of peaks (n, n + 1) using the formula below, left.
Determine the MW of the protein using the relationship between m/zn, MW, and z.
Calculate the accuracy of the measurement using the deconvoluted MW from 2.2 and the predicted weight of the protein from 2.1 using the formula below, right.
Results:
I used the following peaks in this exercise:
peak: 903.7148
peak: 933.7349
Solving for z, the charge state:
The m/z values (peak values in Figure 1) are smaller when the charge state increases. It is because mass is constant, and it is divided by charge.
n is the charge; n+1 indicates the next level, the added charge, so it would be the next peak.
m/zn has lesser charge than m/zn+1
We need to enter the m/z values in the formula in the following way:
Because charge state (z) is the addition of protons, the formula uses the value of the hydrogen atom mass minus electron mass.
(Hydrogen atom = 1.00794 Da; electron mass = 0.000549 Da; proton mass = 1.00728 Da)
Since m/z is measured:
  m/z = (M + z x 1.00728) / z

  m/z x z = M + (z x 1.00728)

  M = m/z x z - (z x 1.00728)

    = 903.7148 x 30 - (30 x 1.00728)

    = 27,111.444 - (30.2184)

    = 27,081.2256 Da
Calculating for the other peak:
Since each peak has a charge value of +1 addition, we need to use “correct z” for the next peak.
The z value for the peak 903.7148 is 30
The z value for the peak 933.7349 is 29
  M = m/z x z - (z x 1.00728)

    = 933.7349 x 29 - (29 x 1.00728)

    = 27,078.3121 - (29.21112)

    = 27,049.10098 Da
Differences of M calculated from peaks: 903.7148 and 933.7349
 Difference =

 (Mass calculated from peak 903.7148) - (Mass calculated from peak 933.7349)

            = (27,081.2256 Da) - (27,049.10098 Da)

            = 0.032 Da
Accuracy:
Theoretical MW for GFP: 26941.48  (239 amino acids)

Experimental MW for GFP (calculated from the average of peaks 903.7148 and 933.7349) = 27,065.1632

Accuracy = (MW exp - MW theory) / MW theory

         = (27,065.1632 - 26,941.48) / 26,941.48

         = (123.6832) / 26,941.48

         = 0.004591

         = 0.004591 x 1,000,000 = 4,591 ppm
I’ve used Claude’s research for troubleshooting.
-I’ve learned that I’ve used the same z-value when calculating mass for 2 adjacent peaks, which is wrong. I went back and corrected that.
-Claude AI listed typical mass accuracy based on instruments. The Waters Xevo G3 has a typical mass accuracy of ~100-5,000 ppm. The calculated accuracy value of 4,591 ppm falls within that range.
-Used a standard formula for molecular weight calculations as provided with an explanation.
Homework: Waters Part II - Secondary/Tertiary Structure(Optional)
We will analyze eGFP in its native, folded state and compare it to its denatured, unfolded state on a quadrupole time-of-flight MS. We will be doing MS-only analysis (no liquid chromatography, also known as “direct infusion” experiments) on the Waters Xevo G3-QToF MS.
Based on learnings in the lab, please explain the difference between native and denatured protein conformations. For example, what happens when a protein unfolds? How is that determined with a mass spectrometer? What changes do you see in the mass spectrum between the native and denatured protein analyses (Figure 2)?
Results:
Native proteins would be folded and have preserved their primary, secondary, tertiary, and quaternary structures.
Denatured proteins would be unfolded and be in their primary structure.

When a protein unfolds, non-covalent interactions such as the hydrogen bonds, which keep alpha helices and beta sheets in their folded structures, are disrupted. Other non-covalent interactions, such as hydrophobic, ionic, and Van der Waals bonds, are also disrupted. Detergents such as SDS and heat treatment can disrupt all non-covalent interactions. Covalent bonds such as peptide-bound (N-C) and disulfide bonds (S-S) cannot be altered by these treatments. Proteins having S-S bonds require reducing agents such as DTT to disrupt this bond. The peptide bond remains undisrupted. So, unfolded proteins would be linearized and have peptide bonds in their primary structure.

Because unfolded proteins would have hydrophobic surfaces exposed and available, bonds are disrupted, so more charge states can be generated, resulting in more m/z peaks with high charge values (z). Thus, m/z values are lower due to high z, and the peak distribution follows a bell shape. In the folded state, fewer charge states can be generated due to buried sites. The peaks' m/z values are higher due to low z values, and the peak distribution is unstructured.

The electrospray ionization process adds protons to the protein. Protonation of basic residues, Lys, Arg, and His, should occur. In the native folded state, buried basic residues are not available for protonation; thus, charge state generation is reduced. This gives away a pattern, the peak distribution, that can be used as an assessment tool for the state of the protein during mass spec measurements.
Zooming into the native mass spectrum of eGFP from the Waters Xevo G3 QTof MS (see Figure 3), can you discern the charge state of the peak at ~2800 m/z? What is the charge state? How can you tell?
Homework: Waters Part III - Peptide Mapping - primary structure
We will digest the eGFP protein standard into peptides using trypsin (an enzyme that selectively cleaves the peptide bond after Lysine (K) and Arginine (R) residues. The resulting peptides will be analyzed on the Waters BioAccord LC-MS to measure their molecular weights and fragmented to confirm the amino acid sequence within each peptide – generating a “peptide map”. This process is used to confirm the primary structure of the protein.
There are a variety of tools available online to calculate protein molecular weight and predict a list of peptides generated from a tryptic digest. We will be using tools within the online resource Expasy (the bioinformatics resource portal of the Swiss Institute of Bioinformatics (SIB)) to predict a list of tryptic peptides from eGFP.
How many Lysines (K) and Arginines (R) are in eGFP? Please circle or highlight them in the eGFP sequence given in Waters Part I question 1 above. (Note: adding the sequence to Benchling as an amino acid file and clicking biochemical properties tab will show you a count for each amino acid).
Results:
In the eGFP amino acid sequence (Part I, question 1), the frequencies of:
Copy/paste the sequence above into the input box in the PeptideMass tool to generate expected list of peptides.
Apply relevant parameters to predict peptides from eGFP.
Click “Perform the Cleavage” button in the PeptideMass tool and report the number of peptides generated when using trypsin to perform the digest.
Results:
19 peptides would be generated after a trypsin digestion.
Below are the parameters applied in the peptide generation tool:
Cysteine and methionine modifications: none
Mass calculation: monoisotropic
Enzyme: Trypsin
allow ‘0’ missed cleavages
Based on the LC-MS data for the Peptide Map data generated in lab (please use Figure 5a as a reference) how many chromatographic peaks do you see in the eGFP peptide map between 0.5 and 6 minutes? You may count all peaks that are >10% relative abundance.
Results:
In Figure 5a, the TIC value of the highest peak (4.87 retention time) is 1.2e7 (12,000,000 ion counts).
This sets the upper limit, 100%.
The corresponding TIC value for a 10% threshold would be 1.2e6 (1,200,000 counts).
I have counted peaks above 1.2e6 TIC: 19
Assuming all the peaks are peptides, does the number of peaks match the number of peptides predicted from question 2 above? Are there more peaks in the chromatogram or fewer?
Results:
19 peaks match the predicted peptide fragments generated by the trypsin digestion.
There are more peaks in the chromatogram, but they are below the 10% threshold value.
Identify the mass-to-charge (m/z) of the peptide shown in Figure 5b. What is the charge (z) of the most abundant charge state of the peptide (use the separation of the isotopes to determine the charge state)? Calculate the mass of the singly charged form of the peptide ([M+H]+) based on its m/z and z.
Results:
The most abundant isotope peak: 525.76712

To calculate charge state, I used the following peaks:

peak 1 m/z: 525.76712
peak 2 m/z: 526.25918

We need to apply the formula, z = 1 / Δ(m/z)

There is always a mixture of 12C and 13C isotopes in any given peptide, with 12C being the most abundant.

Isotopes differ in mass by 1 Da. But the peptides with different isotopes will have the same charge.

So, charge state is the difference in (m/z) over a 1 Da difference in mass.

z = 1 / (526.25918 - 525.76712)
  = 1 / (0.49206)
  = 2.0322  (The most abundant peptide takes 2 protons.)

To find the mass for the most abundant peptide:

M = m/z x z - (z x 1.00728)
  = 525.76712 x 2 - (2 x 1.00728)
  = 1051.53424 - (2.01456)
  = 1049.51968 Da   (This is the neutral mass, which will not appear on the chromatogram.)

To calculate the singly charged form of the peptide:

[M+H]⁺ = M + H⁺
       = 1049.51968 + 1.00728
       = 1050.527 Da  (1-proton-charge version of the peptide, as seen in the graph, very far right.)
Identify the peptide based on comparison to expected masses in the PeptideMass tool. What is the mass accuracy of measurement? Please calculate the error in ppm.
Results:
The PeptideMass tool reports masses from monoisotopic peptides. So, we need to compare masses from monoisotropic. As industry standards, we will need to use the mass from the singly charged version of the peptides (one proton added to the neutral mass), [M+H]⁺.

The monoisotropic peak of short peptides shows up on the far left with the lowest m/z value on the chromatogram. The peak with m/z 525.76712, [M+H]⁺, has a mass of 1050.527 Da and shows up very far right on the chromatogram.

The closest match in the PeptideMass-generated peptides is 1050.5214. The sequence: FEGDTLVNR

Accuracy = (MW exp - MW theory) / MW theory

         = (1050.527 - 1050.5214) / 1050.5214
         = (0.0056) / 1050.5214
         = 0.00000533
         = 0.00000533 x 1,000,000
         = 5.33 ppm
What is the percentage of the sequence that is confirmed by peptide mapping? (see Figure 6)
Results:
Based on Figure 6, as highlighted in blue, 88% of the amino acid sequence is identified. The remaining 12% was not.

Total amino acids: 246
88% identified: 216
12% not identified: 30
Bonus Peptide Map Questions
Can you determine the peptide sequence for the peptide fragmentation spectrum shown in Figure 5c? (HINT: Use your results from Question 2 above to match the peptide molecular weight that is closest to that shown in Figure 5b. Copy and paste its sequence into this tool online to predict the fragmentation pattern based on its amino acid sequence: link. What is the sequence of the eGFP peptide that best matches the fragmentation spectrum in Figure 5c?
Results:
The peptide sequence is FEGDTLVNR, the closest match to the peptide molecular weight 1050.5214 as calculated for the isotope peak: 525.76712 in Figure 5b.

The best matches are found in the Y ions (C-terminal fragments):
Y9 1050.52149 (contains all 9 residues, FEGDTLVNR)
Y8 903.45308 (contains 8 residues, EGDTLVNR)
Y7 774.41049 (contains 7 residues, GDTLVNR)
Y5 602.36208 (contains 5 residues, TLVNR)
Y4 501.30846 (contains 4 residues, LVNR)
Y3 388.23034 (contains 3 residues, VNR)
Does the peptide map data make sense, i.e. do the results indicate the protein is the eGFP standard? Why or why not? Consult with Figure 6, which depicts the % amino acid coverage of peptides positively identified using their calculated mass and fragmentation pattern.
Results:
Although the sequence has additions at the C-terminus (LE linker and 6x His), it cannot really be called the eGFP standard, but 88% identification suggests that this protein is eGFP.
Homework: Waters Part IV - Oligomers
We will determine Keyhole Limpet Hemocyanin (KLH)’s oligomeric states using charge detection mass spectrometry (CDMS). CDMS single-particle measurements of KLH allow us to make direct mass measurements to determine what oligomeric states (that is, how many protein subunits combine) are present in solution. Using the known masses of the polypeptide subunits (Table 1) for KLH, identify where the following oligomeric species are on the spectrum shown below from the CDMS (Figure 7):
7FU;  Decamer 340 x 10 = 3400 kDa = 3.4 MDa

8FU;  Decamer 400 x 10 = 4000 kDa = 4 MDa
    Didecamer 400 x 20 = 8000 kDa = 8 MDa
    3-Decamer 400 x 30 = 12000 kDa = 12 MDa
    4-Decamer 400 x 40 = 16000 kDa = 16 MDa

Peaks found in Figure 7:

  3.4 MDa, possibly, corresponding to 7FU decamer
  8.33 MDa, possibly, corresponding to 8FU didecamer
  12.67 MDa, possibly, corresponding to 8FU 3-Decamer
no peak was found corresponding to 8FU 4-Decamer
Homework: Waters Part V - Did I make GFP?
Please fill out this table with the data you acquired from the lab work done at the Waters Immerse Lab in Cambridge, or else the data screenshots in this document if you were unable to have lab work done at Waters.
Theoretical
Observed/measured on the Intact LC-MS
PPM Mass Error
Molecular Weight )kDa)
Week 11 HW: Bioproduction & Cloud Lab
Part A: The 1,536 Pixel Artwork Canvas | Collective Artwork
Contribute at least one pixel to this global artwork experiment before the editing ends on Sunday 4/19 at 11:59 PM EST.
A personalized URL was sent to the email address associated with your Discourse account, and you can discuss the artwork on the Discourse.
If you did not have a chance to contribute, it’s okay, just make sure you become a TA this fall! 😉
Make a note on your HTGAA webpages, including:
what you contributed to the community bioart project (e.g., “I made part of the DNA on the bottom right plate”)
what you liked about the project, and
what about this collaborative art experiment could be made better for next year.
I've contributed 9 pixels in a design to support the surroundings of the heart shape in the bottom center area. However, as of now, the heart-shaped design has been changed and is no longer on the canvas. See image below, #68 tuzun-guvener.
Part B: Cell-Free Protein Synthesis | Cell-Free Reagents
Referencing the cell-free protein synthesis reaction composition (the middle box outlined in yellow on the image above, also listed below), provide a 1-2 sentence description of what each component’s role is in the cell-free reaction.
E. coli Lysate
BL21 (DE3) Star Lysate (includes T7 RNA Polymerase)
The E. coli BL21 (DE3) Star Lysate provides all necessary components for transcription and translation in a cell-free protein synthesis reaction, given the design of a DNA template driving expression from a T7 promoter. The strain is engineered to have T7 RNA polymerase expressed under an IPTG-controlled promoter. Also, the strain has a "Star" mutation; one of the nucleases has a mutation (the RNase E coding region has an rne131 mutation), resulting in slowing down the degradation of mRNA, which in turn results in a better protein yield.

The rne131 mutation resides in the C-terminal and prevents degradosome formation. The enzyme still has an N-terminal catalytic domain and can destroy nucleic acids, but much more slowly. The degradosome formation is the most destructive for degrading RNA, resulting in faster degradation. Also, other nucleases are expected to be present in the BL21 (DE3) Star extract, such as RNase II, RNase III, RNase R, and RNase H. So, without the rne131 mutation, mRNA stability has a half-life of 2 - 4 min. The half-life of mRNA is extended with the rne131 mutation, but not for a long time, since other nucleases are active.
Salts/Buffer
Potassium Glutamate
Provides molecular crowding, mimicking the inside of the cytoplasm, improving efficiency and fidelity. K⁺ ions are needed for ribosome stability and the fidelity of translation.
HEPES-KOH pH 7.5
Maintains pH at 7.5, critical for enzyme functioning, such as T7 RNA polymerase. HEPES does not interact with metal ions, thus does not chelate Mg²⁺, and most of the time, it is a preferred buffering agent in cell-free protein synthesis reactions. The K⁺ salt version matches the other reaction components (potassium glutamate).
Magnesium Glutamate
Provides Mg²⁺ ions, and Mg²⁺ acts as a cofactor and stabilizer for many enzymes, such as RNA polymerase, ribosomes, and in ATP hydrolysis.
Potassium phosphate monobasic
Potassium phosphate dibasic
The monobasic and dibasic forms of potassium phosphate both work together to maintain pH and act as buffering agents in the reaction. Also, they are the phosphate source; phosphate is needed for nucleic acid synthesis, transcription, and the synthesis of ATP, which traps energy in phosphate bonds.
Energy / Nucleotide System
Ribose
Used in the energy-generating reactions, including the formation of ribose-5-phosphate, energy is stored in a phosphate bond. It is also used in nucleotide-triphosphate (NTP) generation. Energy is stored in triphosphate bonds. Ribose is also used for incorporation into nucleic acids as the sugar component. Ribose plays a critical role in energy generation in the extended cell-free protein synthesis reactions.
Glucose
Used in the energy-generating reactions from glycolysis to make ATP. Like ribose, glucose has a role in replenishing energy sources in the extended cell-free protein synthesis reactions.
AMP
CMP
GMP
UMP
Nucleotide monophosphates (NMPs), AMP, CMP, GMP, and UMP, are building blocks for RNA synthesis. These are also used in energy-generating reactions, resulting in the formation of NDPs and NTPs. Energy is stored in phosphate bonds, di-phosphate, and tri-phosphate, respectively. When a cell-free protein synthesis reaction is extended, energy generation becomes critical, thus the role of NMPs.
Guanine
Primarily provided as the purine precursor, as it cannot be synthesized. It is used for the regeneration of GTP, which is critical for GTP-requiring translation elongation factors during translation.
Translation Mix (Amino Acids)
17 Amino Acid Mix
Tyrosine
Cysteine
They are the building blocks of proteins. All 20 amino acids are needed to make a protein, to complete the cell-free protein synthesis. 17 of them can be mixed, as they are soluble in neutral pH. However, tyrosine is soluble at highly alkaline pH, so it is added separately to avoid precipitation. Cysteine can be oxidized upon air exposure, and it can also form disulfide bonds if added earlier. So, cysteine must be freshly added to the reaction. Cysteine can maintain redox balance in the reaction as well.
Additives
Nicotinamide
Provided as a precursor for the generation of NAD⁺, maintaining redox balance, and a cofactor of enzymes. NAD⁺/NADH is used in energy metabolism, ribose metabolism, and glycolysis, which converts glucose to an energy-storage compound such as ATP. These can be important in extended cell-free protein synthesis reactions, as NAD⁺ can be replenished. Has a role in inhibiting NAD⁺-consuming enzymes (sirtuins), which can help preserve the NAD⁺ for energy metabolism, much needed for extended reactions.
Backfill
Nuclease Free Water
Nuclease-free water is needed to make adjustments in the reaction volume, in which the reaction components can be kept at appropriate concentrations. A nuclease-free version of the water must be used to avoid external nuclease contamination, as nucleases can be present in regular water.
Describe the main differences between the 1-hour optimized PEP-NTP master mix and the 20-hour NMP-Ribose-Glucose master mix shown in the Google Slide above. (2-3 sentences)
In the PEP-NTP master mix, energy is generated through phosphoenolpyruvate (PEP), and NTPs are provided, which are more stable but more expensive. In an hour, reaction, as fast as can be, these components directly go into the production of proteins.

In the NMP-Ribose-Glucose master mix, precursors are more stable and economical, and they continuously generate NTPs and energy. So, the system is more sustainable. Ribose, as a substrate for the pentose phosphate pathway, generates NTPs from the precursors, NMPs. Glucose, which enters glycolysis, generates ATP. Nicotinamide is used for replenishing NAD⁺/NADH. This system takes 20 h to complete synthesis, but it is more sustainable and economical.
Bonus question: How can transcription occur if GMP is not included but Guanine is?
Guanine is converted into GMP through the purine salvage pathway, which is cost- and energy-effective due to recycling of bases, unlike de novo synthesis. In the E. coli lysate, enzymes are present to do this conversion.

Ribose enters the pentose phosphate pathway, and PRPP (phosphoribosyl pyrophosphate) is generated. Guanine and PRPP are converted into GMP by the enzyme HGPRT (hypoxanthine-guanine phosphoribosyl transferase).

Once GMP is made, the following reactions by the guanylate kinase and nucleoside diphosphate kinase produce GDP and GTP, respectively. Transcription can proceed with GTP.
Part C: Planning the Global Experiment | Cell-Free Master Mix Design
Given the 6 fluorescent proteins we used for our collaborative painting, identify and explain at least one biophysical or functional property of each protein that affects expression or readout in cell-free systems. (Hint: options include maturation time, acid sensitivity, folding, oxygen dependence, etc) (1-2 sentences each)
sfGFP

This is a superfolder GFP. It was engineered to mature fast and has a robust folding, enabling the generation of signals quickly after translation.

mRFP1

This is a monomeric Red Fluorescent protein whose chromophore formation requires more time and oxygen. This fluorescent protein will poorly perform in low oxygen conditions.


mKO2

This is monomeric Kusabira Orange2. This protein matures slowly, requiring more than one hour (100 min). It is acid sensitive. If a cell-free system does not maintain pH or become low in pH, mKO2 will have a poor performance.

mTurquoise2

This monomeric fluorescent protein quickly matures and is highly stable at acidic conditions. With the production of strong signals, it is highly reliable.

mScarlet_I

This monomeric red fluorescent protein matures fast and bright. But it is sensitive to acidic conditions. If a cell-free system fails to maintain pH, it will not perform well.

Electra2

It is engineered to be very bright but it is dependent on oxygen for chromophore maturation. So, in low-oxygen environments, this fluorescent protein would have poor performance.
Create a hypothesis for how adjusting one or more reagents in the cell-free mastermix could improve a specific biophysical or functional property you identified above, in order to maximize fluorescence over a 36-hour incubation. Clearly state the protein, the reagent(s), and the expected effect.
Since some of the fluorescent proteins, namely, mRFP1, mKO2, and mScarlet_I, are known to be acid sensitive, we could design the master mix with strong buffering capacity to offset low pH. We could anticipate that the energy/nucleotide system (ribose and glucose entering into metabolic pathways) will lower the pH due to acidic products being generated.

Buffering agents, mono and dibasic potassium phosphates, must be present at a concentration to hold a target pH. It would be helpful to know the titration curves of phosphate buffers over time so that they could guide us to pick the right concentration that holds the targeted pH over extended times. It is also important to keep concentrations below inhibitory levels, as excess ions can inhibit translation.

The master mix described above, a combination of monobasic and dibasic stocks, was used, 5.6 mM each, totaling 11.2 mM. Another study reported by Olsen et al. 2025 (https://doi.org/10.1101/2025.08.01.668204) used 15 mM total concentration at pH 7 for an optimal outcome. It was reported that the higher amounts are inhibitory. For 36 h incubation, I would use a 15 mM total concentration of monobasic and dibasic potassium phosphates, presumably holding the pH at 7.2 (Henderson-Hasselbalch equation).

HEPES at 45 mM concentration at pH 7.5 was used for maintaining pH and the T7 polymerase reaction for the 20 h reaction. I would use 80 mM HEPES to increase the buffering capacity for the 36 h reaction. HEPES concentrations are usually applied between 20 mM and 100 mM.

A long maturation time requirement for mRFP1 and mKO2 may not be critical in the 36 h reaction as long as pH is maintained. I anticipate that an extended reaction, such as 36 h, should be sufficient to reach maturation.

However, reactions delivering low oxygen may be an issue, so the reaction needs to be aerated for those that have high dependency on oxygen for chromophore formation, such as mRFP1 and Electra2.
The second phase of this lab will be to define the precise reagent concentrations for your cell-free experiment. You will be assigned artwork wells with specific fluorescent proteins and receive an email with instructions this week (by April 24). You can begin composing master mix compositions here.
The final phase of this lab will be analyzing the fluorescence data we collect to determine whether we can draw any conclusions about favorable reagent compositions for our fluorescent proteins. This will be due a week after the data is returned (date TBD!). The reaction composition for each well will be as follows:
6 μL of Lysate
10 μL of 2X Optimized Master Mix from above
2 μL of assigned fluorescent protein DNA template
2 μL of your custom reagent supplements
Total: 20 μL reaction
Part D: Build-A-Cloud-Lab | (optional) Bonus Assignment
Use this simulation tool to create an interesting-looking cloud lab out of the Ginkgo Reconfigurable Automation Carts. This is just a minimal implementation so far, but I would love to see some fun designs!