Week 6 HW: Genetic Circuits Part I
Assignment: DNA Assembly
Answer the following questions about the protocol in:
1. What are some components in the Phusion High-Fidelity PCR Master Mix, and what is their purpose?
Below are the components found in the New England Biolab’s Phusion HF PCR Master Mix:
•Phusion DNA Polymerase: It performs 5’ → 3’ polymerase activity and 5’ → 3’exonuclease (proofreading) activity with greater fidelity, >50x better in comparison to regular Taq polymerase. Because it is a fusion polymerase with an Sso7d domain, it adds nucleotides more quickly, reducing the required extension time. Due to the exonuclease activity. Phusion polymerase produces blunt ends.
•dNTPs (deoxyribonucleoside triphosphates; dATP, dCTP, dGTP, dTTP): DNA building blocks are incorporated into DNA during polymerization.
•Tris-HCl Buffer: Stabilizes pH for optimal activity.
•MgCl2: It is the cofactor for the polymerase, which is required for the reaction.
•KCl: a monovalent salt, stabilizes the negatively charged DNA duplexes, including primer annealing.
•BSA (Bovine Serum Albumin): Maintains polymerase stability during repeated freeze-thaw cycles.
•Tween 20 (Non-Ionic Detergent):• Prevents polymerase from sticking to the tube’s walls and eliminates the adverse effects of SDS contamination during the DNA extraction process.
•DMSO; (optional; not in the Master Mix): a destabilizer, disrupts base stacking, and relaxes secondary structures. It is particularly helpful to work with high GC content DNA templates.
I’ve researched Claude.
Prompts:
Can you research the components in the Phusion High-Fidelity PCR Master Mix? What do they do?
2. What are some factors that determine primer annealing temperature during PCR?
Annealing temperature (Ta) is the temperature at which primer and template hybridize. During PCR, the primer-DNA duplex needs to form in order for the polymerase to start the reaction.
The Ta of the reaction is calculated based on the calculated melting temperature (Tm) of the primers.
Optimal Ta is needed to achieve specificity and efficiency in the formation of the primer-DNA duplex.
The general rule is that Ta is set to 5°C below the lowest Tm of the primer pair in most polymerase reactions, except for Phusion polymerase, which sets Ta to 3°C above the lowest Tm of the primer pair.
Because Ta is calculated based on Tm, the parameters listed below affecting Tm would also affect Ta:
GC content. Guanine and cytosine base pairs are stronger due to having three hydrogen bonds. Templates rich with GC content would have a higher Tm because more energy is needed to separate the strands.
Primer length. The longer the primer, the higher the Tm.
Nearest-neighbor base stacking interactions. The calculation takes into account stability differences in neighboring dinucleotides, not just base composition.
Primer secondary structure. Hairpins and self-dimer formation would reduce the actual availability, and Tm needs to be adjusted.
Salt and primer concentrations. More concentrations increase Tm.
Additives. DMSO addition would reduce Tm.
I’ve researched Claude.
Prompts:
Can you research factors determining primer annealing temperature during PCR?
3. There are two methods from this class that create linear fragments of DNA: PCR and restriction enzyme digests. Compare and contrast these two methods, both in terms of protocol as well as when one may be preferable to use over the other.
Restriction enzyme digests. A DNA fragment can be lifted off a plasmid by simply cutting with restriction enzymes, given that the existing cut sites of the enzymes are outside of the DNA region of interest. The liberated DNA fragment preserves the original sequence since there has been no manipulation other than restriction digest.
PCR amplification. In contrast, the same DNA fragment can be lifted off a plasmid by PCR amplification. Since there is DNA synthesis involved, even with a high-fidelity polymerase, there is a chance of error, and the original sequence may have changed. So, PCR-amplified DNA fragments need to be verified by sequencing.
PCR amplification has the advantage that any additional sequences can be built during PCR, including a restriction enzyme cut site, providing greater flexibility and convenience in downstream use cases. This wouldn’t be the case for the restriction enzyme method, which relies on the existing restriction enzyme cut sites in the DNA sequence.
If the DNA of interest could be easily recovered by a simple restriction enzyme digestion and is ready to use in the downstream cloning applications, a restriction enzyme method would be a good choice.

If there is inflexibility in enzyme sites in downstream cloning, it is necessary to use the PCR amplification method to produce the fragment with a built-in cut site.

If the DNA source is genomic DNA, it is best to use PCR amplification instead of restriction digest for the reason that the genomic DNA is large and would produce many DNA fragments after a restriction enzyme digest, not easy to separate the desired fragment. Depending on the restriction enzymes, many are likely to cut more than one location.
4. How can you ensure that the DNA sequences that you have digested and PCR-ed will be appropriate for Gibson cloning?
For Gibson cloning, the major requirement is to have homologous sequences between the fragments at both ends to be joined. The overlap sequences are usually between 20 and 30 bp for 2+ fragments or greater if more fragments are to be joined.
Gibson cloning uses T5 exonuclease, which chews back the 5’ ends of each fragment and generates long overhangs. Joining the fragments requires overlaps between overhangs. The other two enzymes in the Gibson reaction are the Phusion polymerase and the Taq DNA ligase. Phusion fills the gaps created by the exonuclease activity, and the ligase seals the double-stranded DNA.
PCR-amplified fragments should be amplified by primers that incorporate the overhang, the "tail" part. So, primers by design should include the "tail" part that does not anneal when amplifying from a template to begin with. This way, the PCR-amplified product would be generated with an overlapping region to the joining fragment.

For the restriction enzyme-generated fragments, make sure that homologous regions are sufficiently present at the joining ends of the fragments. No need to make the double-stranded end blunt, as T5 exonuclease will chew back the 5'ends.
5. How does the plasmid DNA enter the E. coli cells during transformation?
E. coli cells are not naturally competent; they cannot take up DNA. LPS, the outer membrane, and the inner membrane of the E. coli cells are negatively charged, as is DNA, so they repel. To overcome repulsion, the transformation procedures transiently modify the cell surface by creating pores that DNA can pass through.
Electroporation: an electric field is applied to the cells that causes the phospholipids in the cell membrane to go through a phase transition, creating water-filled pores. DNA molecules are pulled inside cells. The phospholipid layer spontaneously reseals. If pores seal quickly, cells survive.

CaCl2 treatment: As a divalent cation, Ca2+ acts on both the DNA and the cell membrane, neutralizing the repulsion between DNA and LPS of the outer membrane. DNA is then absorbed on the cell surface, and stability is achieved at cold temperatures by incubating the mixture on ice. A rapid temperature shift at 42°C (heat shock for 45 seconds) causes a phase transition in the lipid membrane, creating transient gaps. DNA moves inside the cytoplasm. Subsequent cold shock by returning the mixture to ice causes membrane fluidity to change, restoring the membrane integrity. DNA is trapped inside cells.
6. Describe another assembly method in detail (such as Golden Gate Assembly)
• Explain the other method in 5 - 7 sentences plus diagrams (either handmade or online).
• Model this assembly method with Benchling or Asimov Kernel!
Golden Gate Assembly is a one-pot reaction, alternating in a cycle of digestion and ligation to drive the assembly of multiple fragments. It uses Type IIS restriction enzymes and T4 DNA ligase in iterative cycles, continuing towards the completion of a product. If the fragments are correctly assembled, they would lose their Type IIS cut sites, and in the next digestion cycle, they won’t be re-cut.
The enzyme recognition site and the actual cleavage site typically differ for Type IIS restriction enzymes. These enzymes cut outside of their recognition sequence, unlike other restriction enzymes.
Fragment preparation: The type IIS recognition sequences are designed by PCR. A spacer sequence is included to improve the cleavage efficiency of the enzyme, as well as an overhang sequence at the fragment junction. Directionality of the fragment assembly is achieved by the overlapping overhang sequences.
Vector preparation: The Type IIS cut sites should be designed outward, resulting in the removal of the recognition sequence.
The diagram below shows a typical design of an overlapping overhang sequence on several assembly fragments:
block-beta
columns 1
block:ID
A["(seq-a)_fragment1_(seq-b)"]
B["(seq-b)_fragment2_(seq-c)"]
C["(seq-c)_fragment3_(seq-d)"]
end
Modeling the assembly design with Benchling
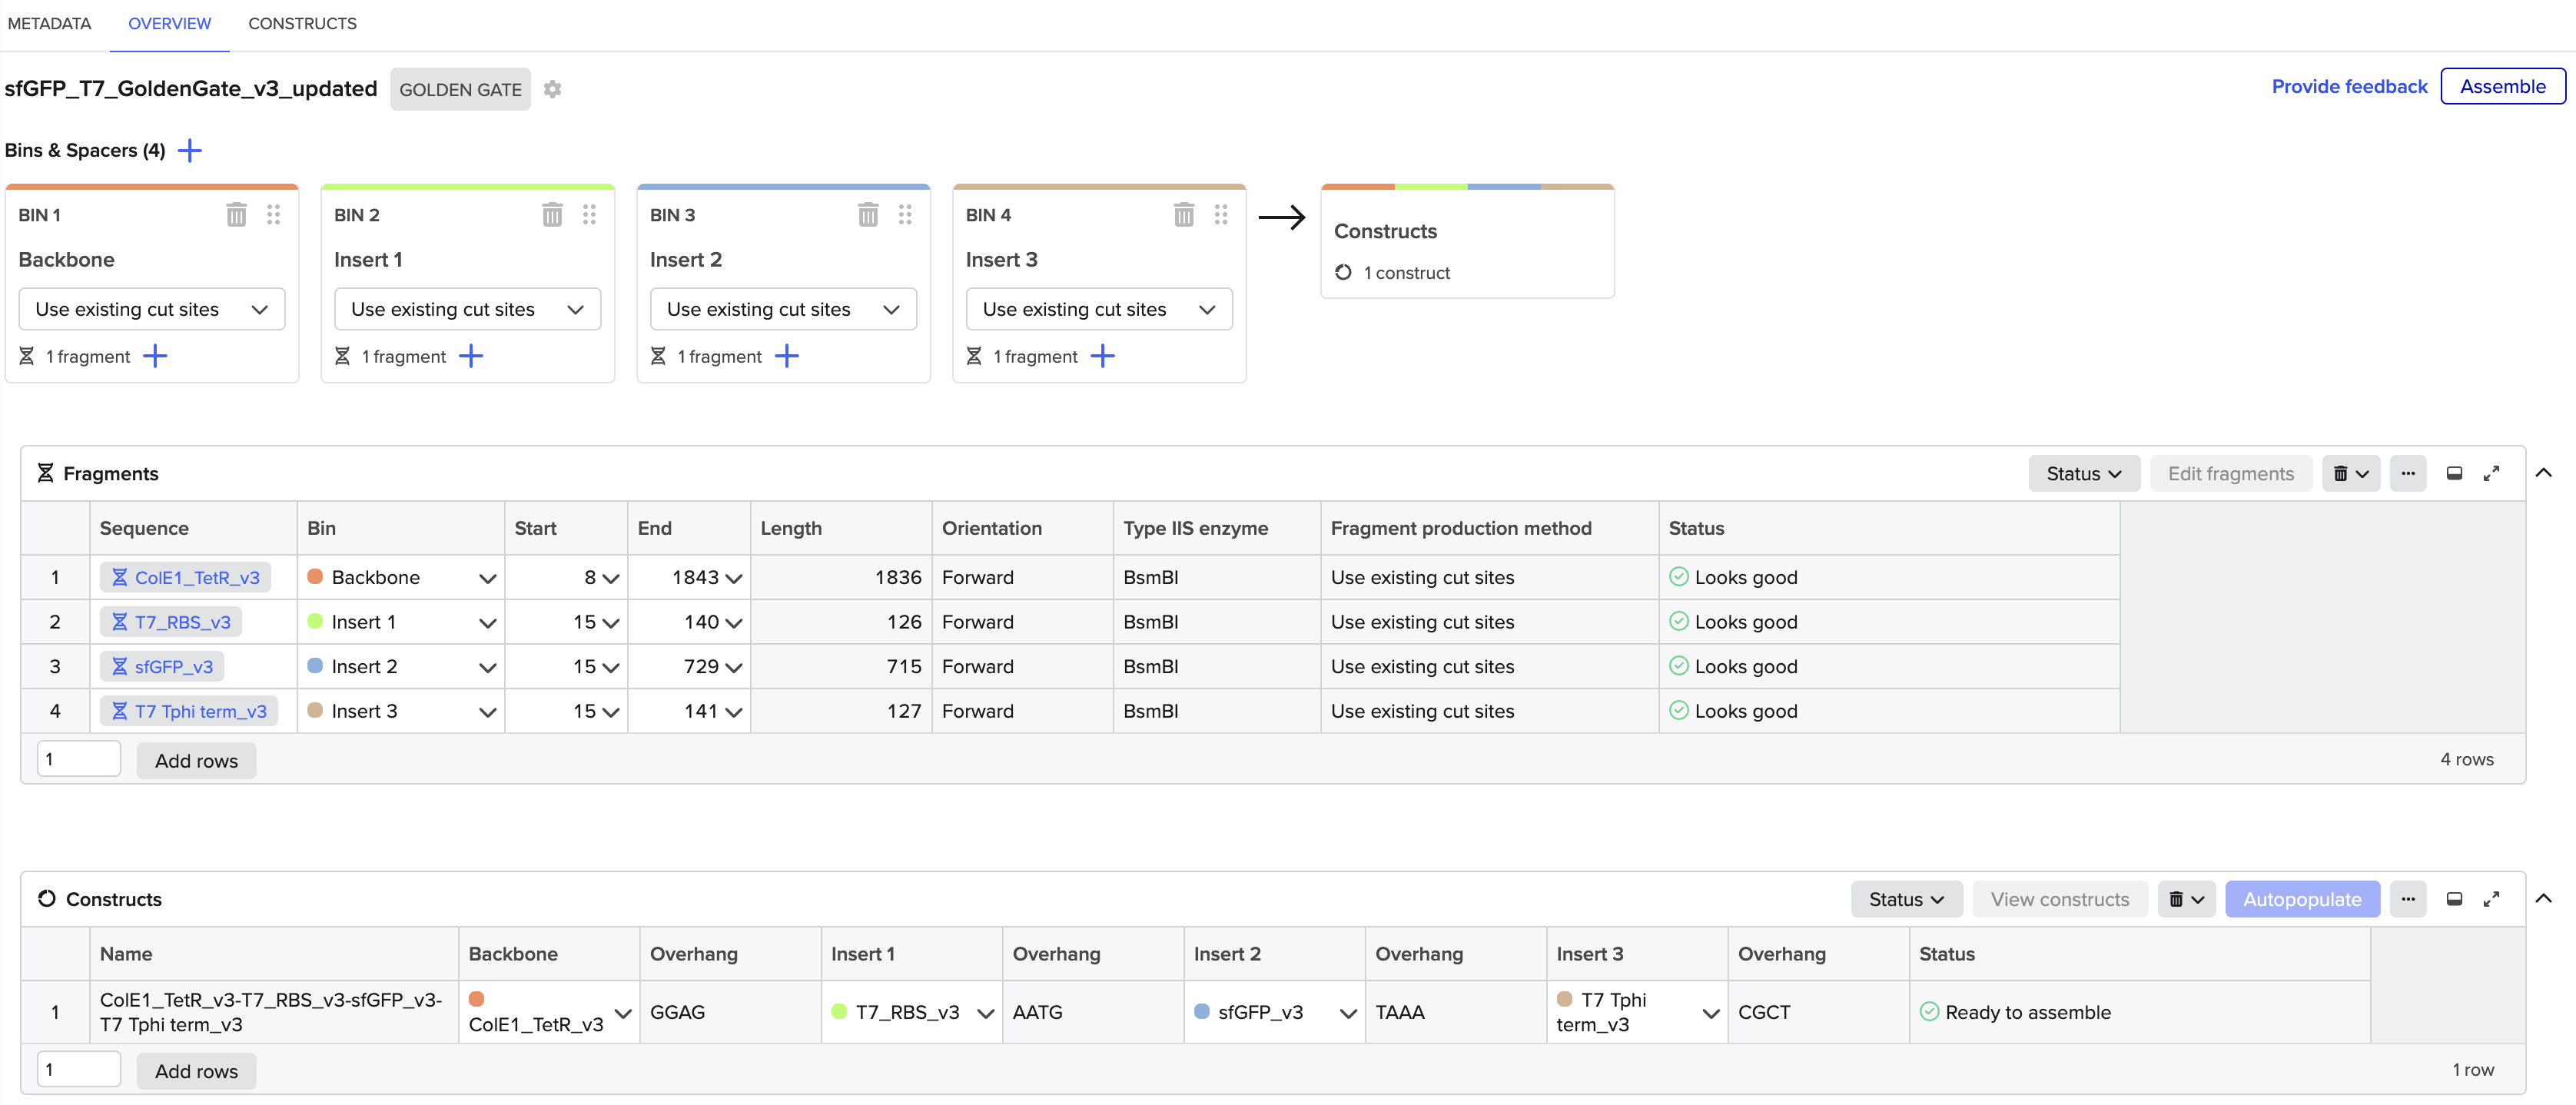
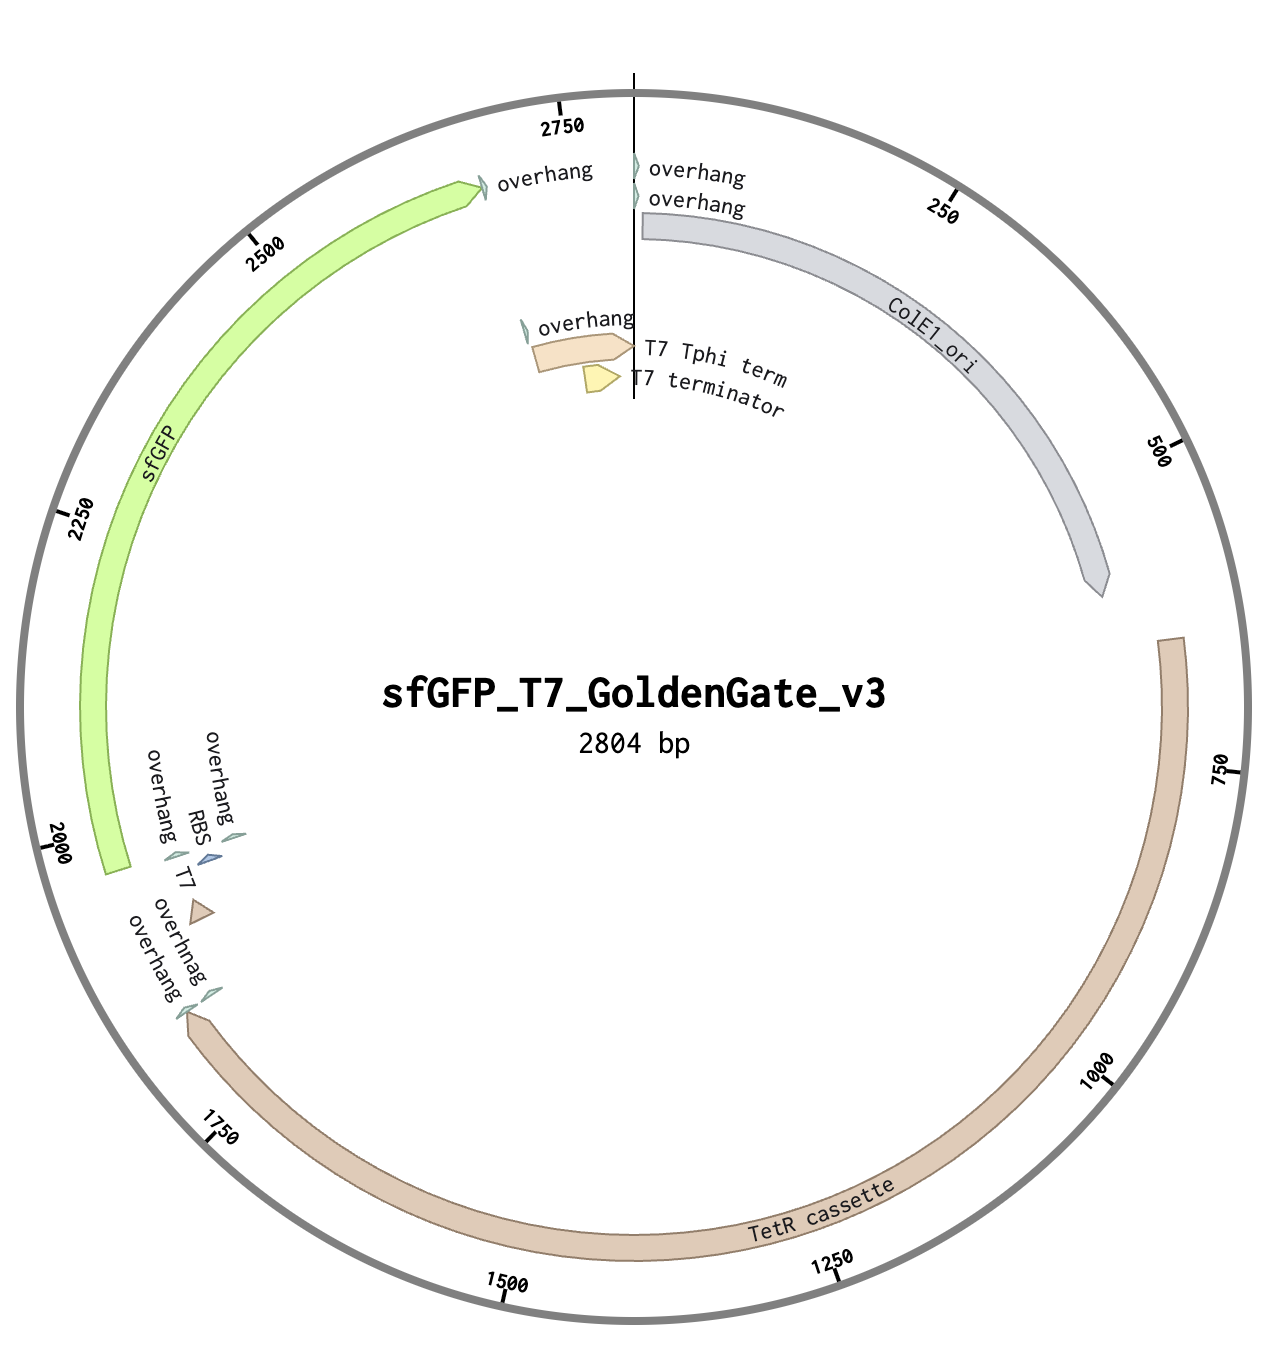
I’ve used 4 parts to construct the sfGFP expression plasmid with the Benchling Golden Gate assembly tool.
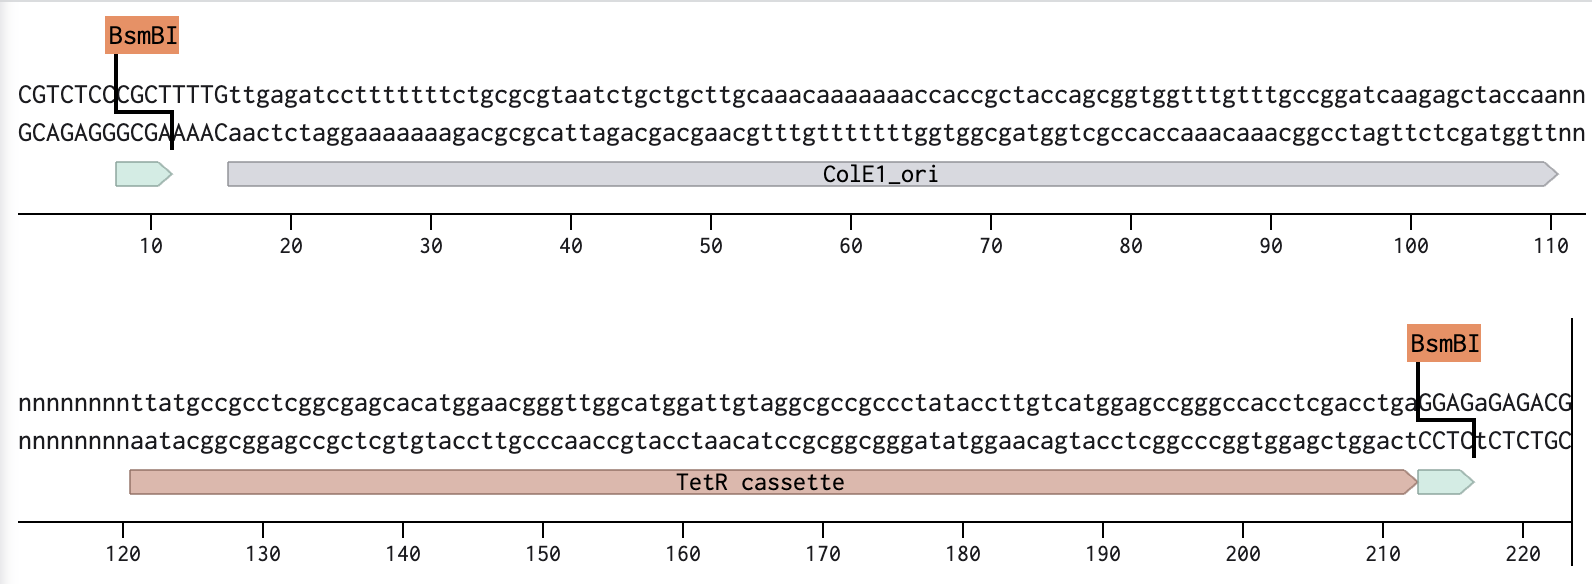
Part 1: The backbone; ColE1 ori and TetR cassette
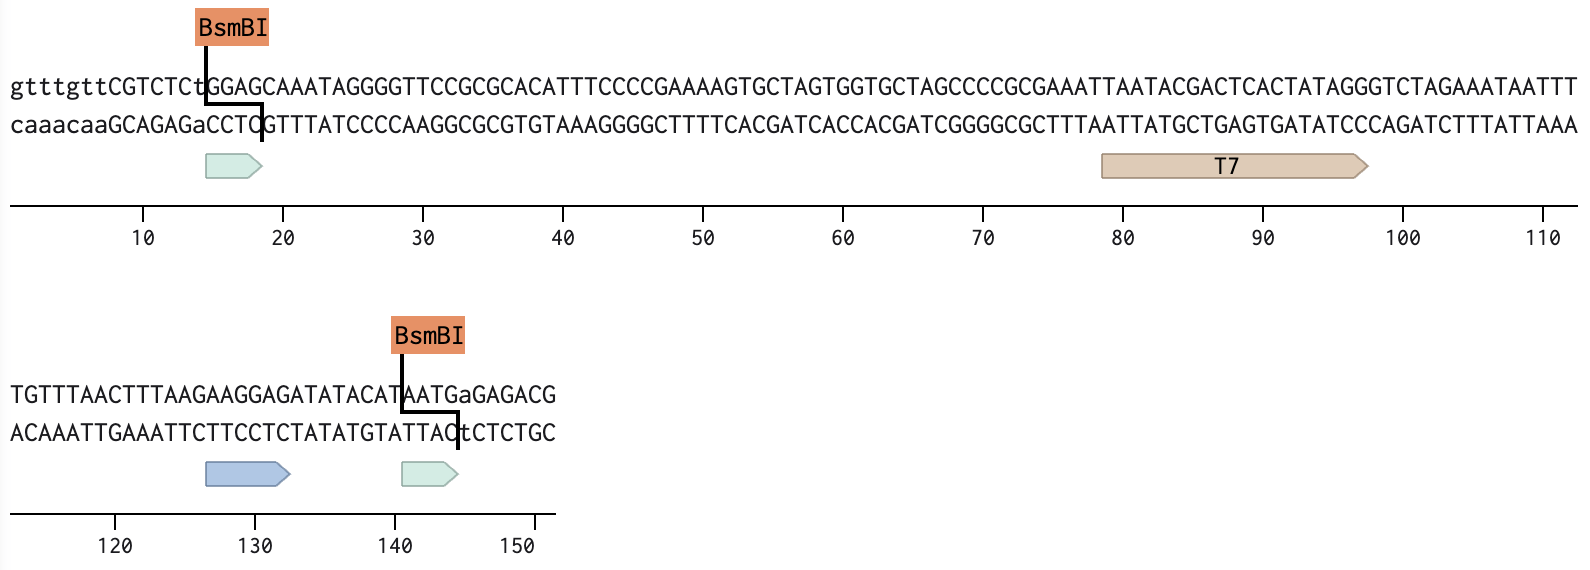
Part 2: T7 promoter and RBS
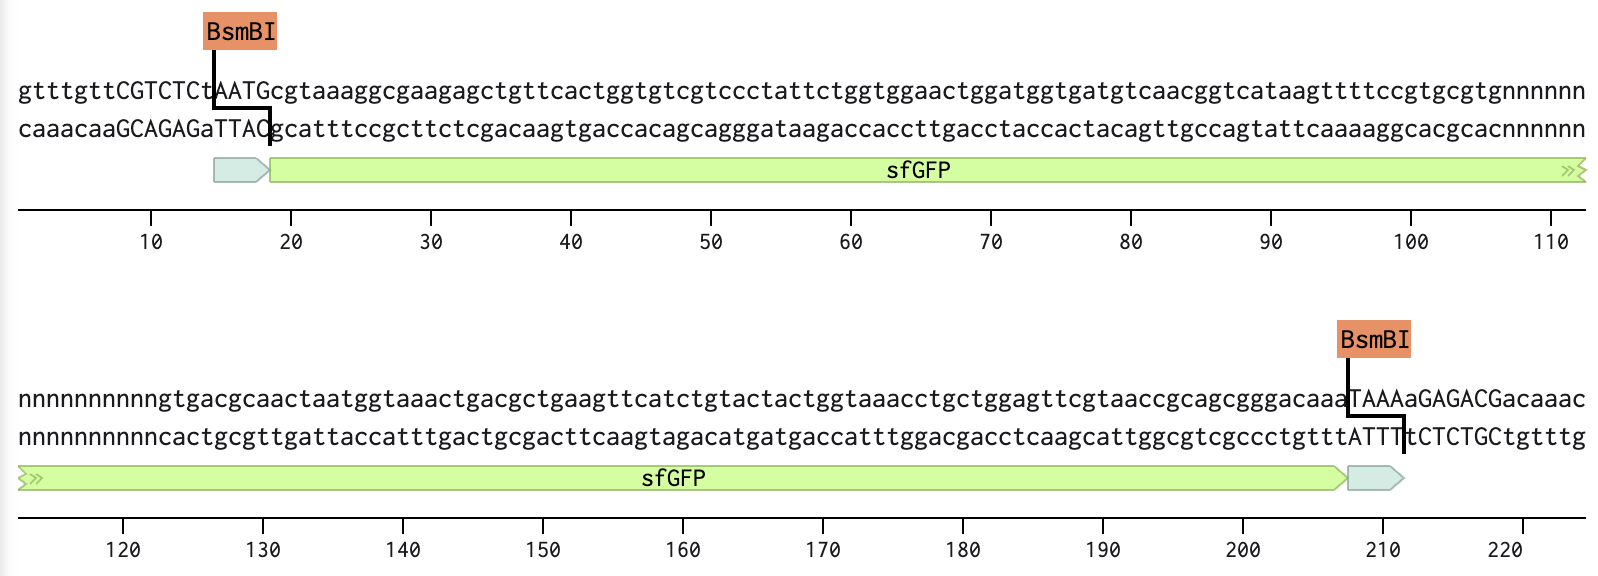
Part 3: sfGFP coding sequence
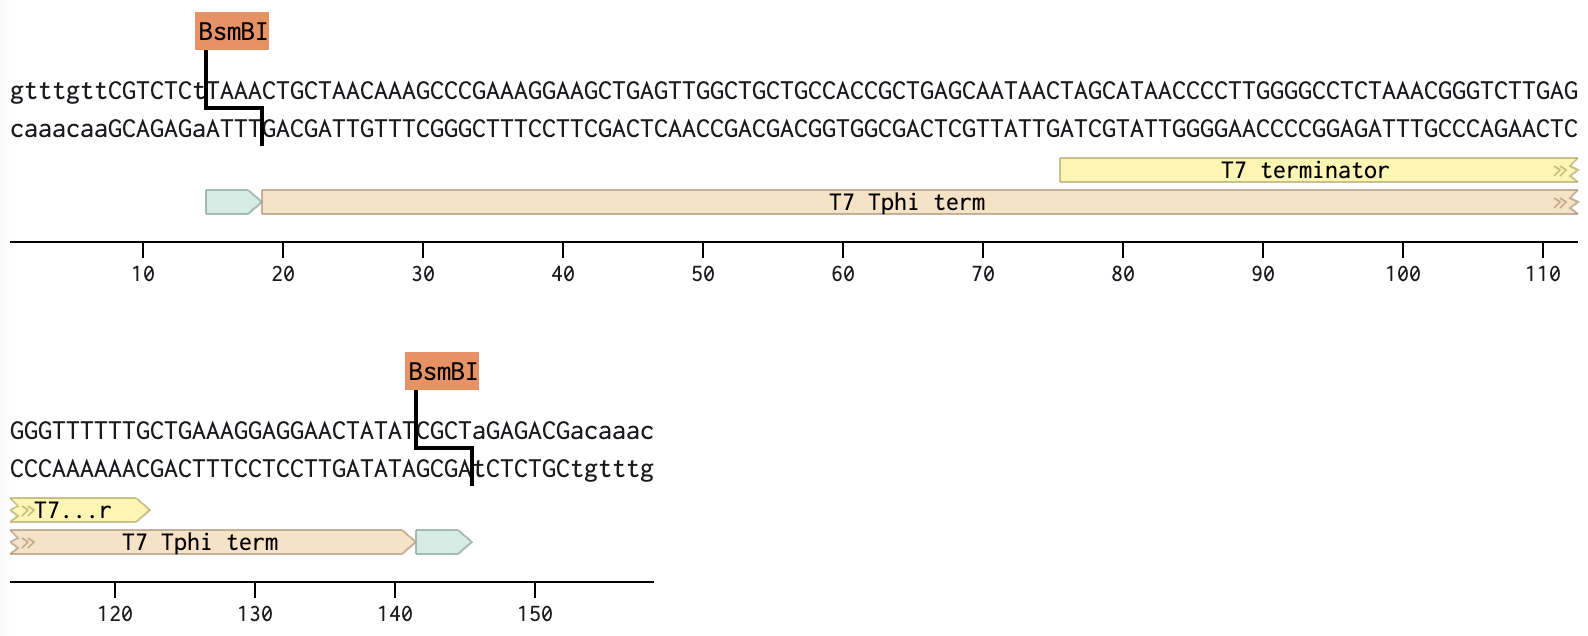
Part 4: T7 terminator
All parts include a type IIS enzyme recognition sequence (BsmB1) and an overhang sequence (4 bases) designed at both ends. To assemble in a sequential order, from Part 1 to Part 4, one of the two overhangs must overlap with the joining part that follows.
Below are the sequences of Parts, highlighting the enzyme sites and overhangs.
| Golden Gate assembly overview | Final plasmid assembly |
|---|---|
| 
|
Assignment: Asimov Kernel
1. Create a Repository for your work.
2. Create a blank Notebook entry to document the homework and save it to that Repository.
3. Explore the devices in the Bacterial Demos Repo to understand how the parts work together by running the Simulator on various examples, following the instructions for the simulator found in the “Info” panel (click the “i” icon on the right to open the Info panel).
4. Create a blank Construct and save it to your Repository.
- Recreate the Repressilator in that empty Construct by using parts from the Characterized Bacterial Parts repository.
- Search the parts using the Search function in the right menu.
- Drag and drop the parts into the Construct.
- Confirm it works as expected by running the Simulator (“play” button) and compare your results with the Repressilator Construct found in the Bacterial Demos repository.
- Document all of this work in your Notebook entry - you can copy the glyph image and the simulator graphs, and paste them into your Notebook.
| Example Construct Schematic |
|---|
|
| Example Construct Circle |
|---|
|
| Example Construct Simulation Plots |
|---|
|
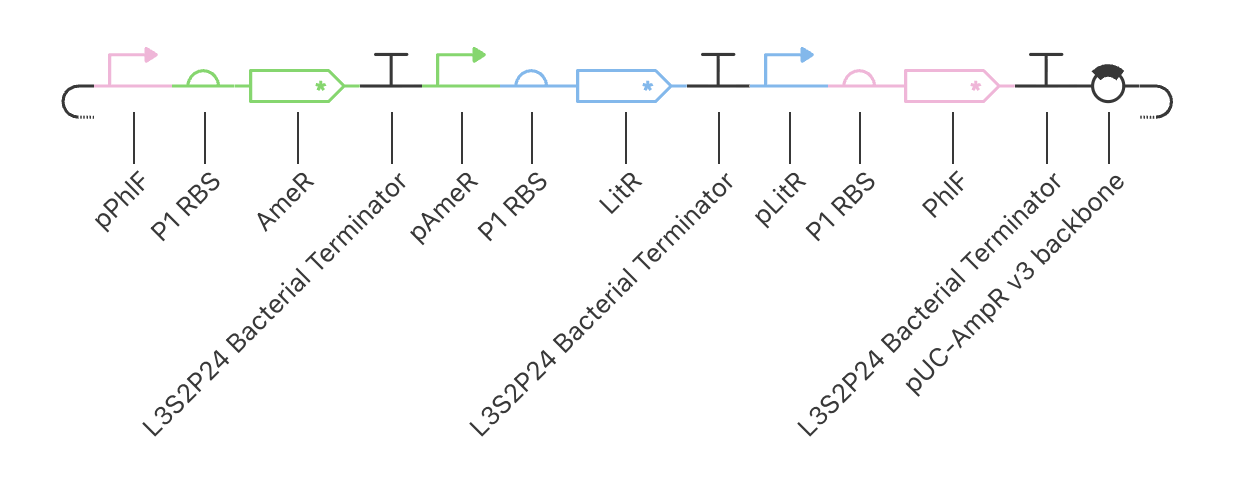
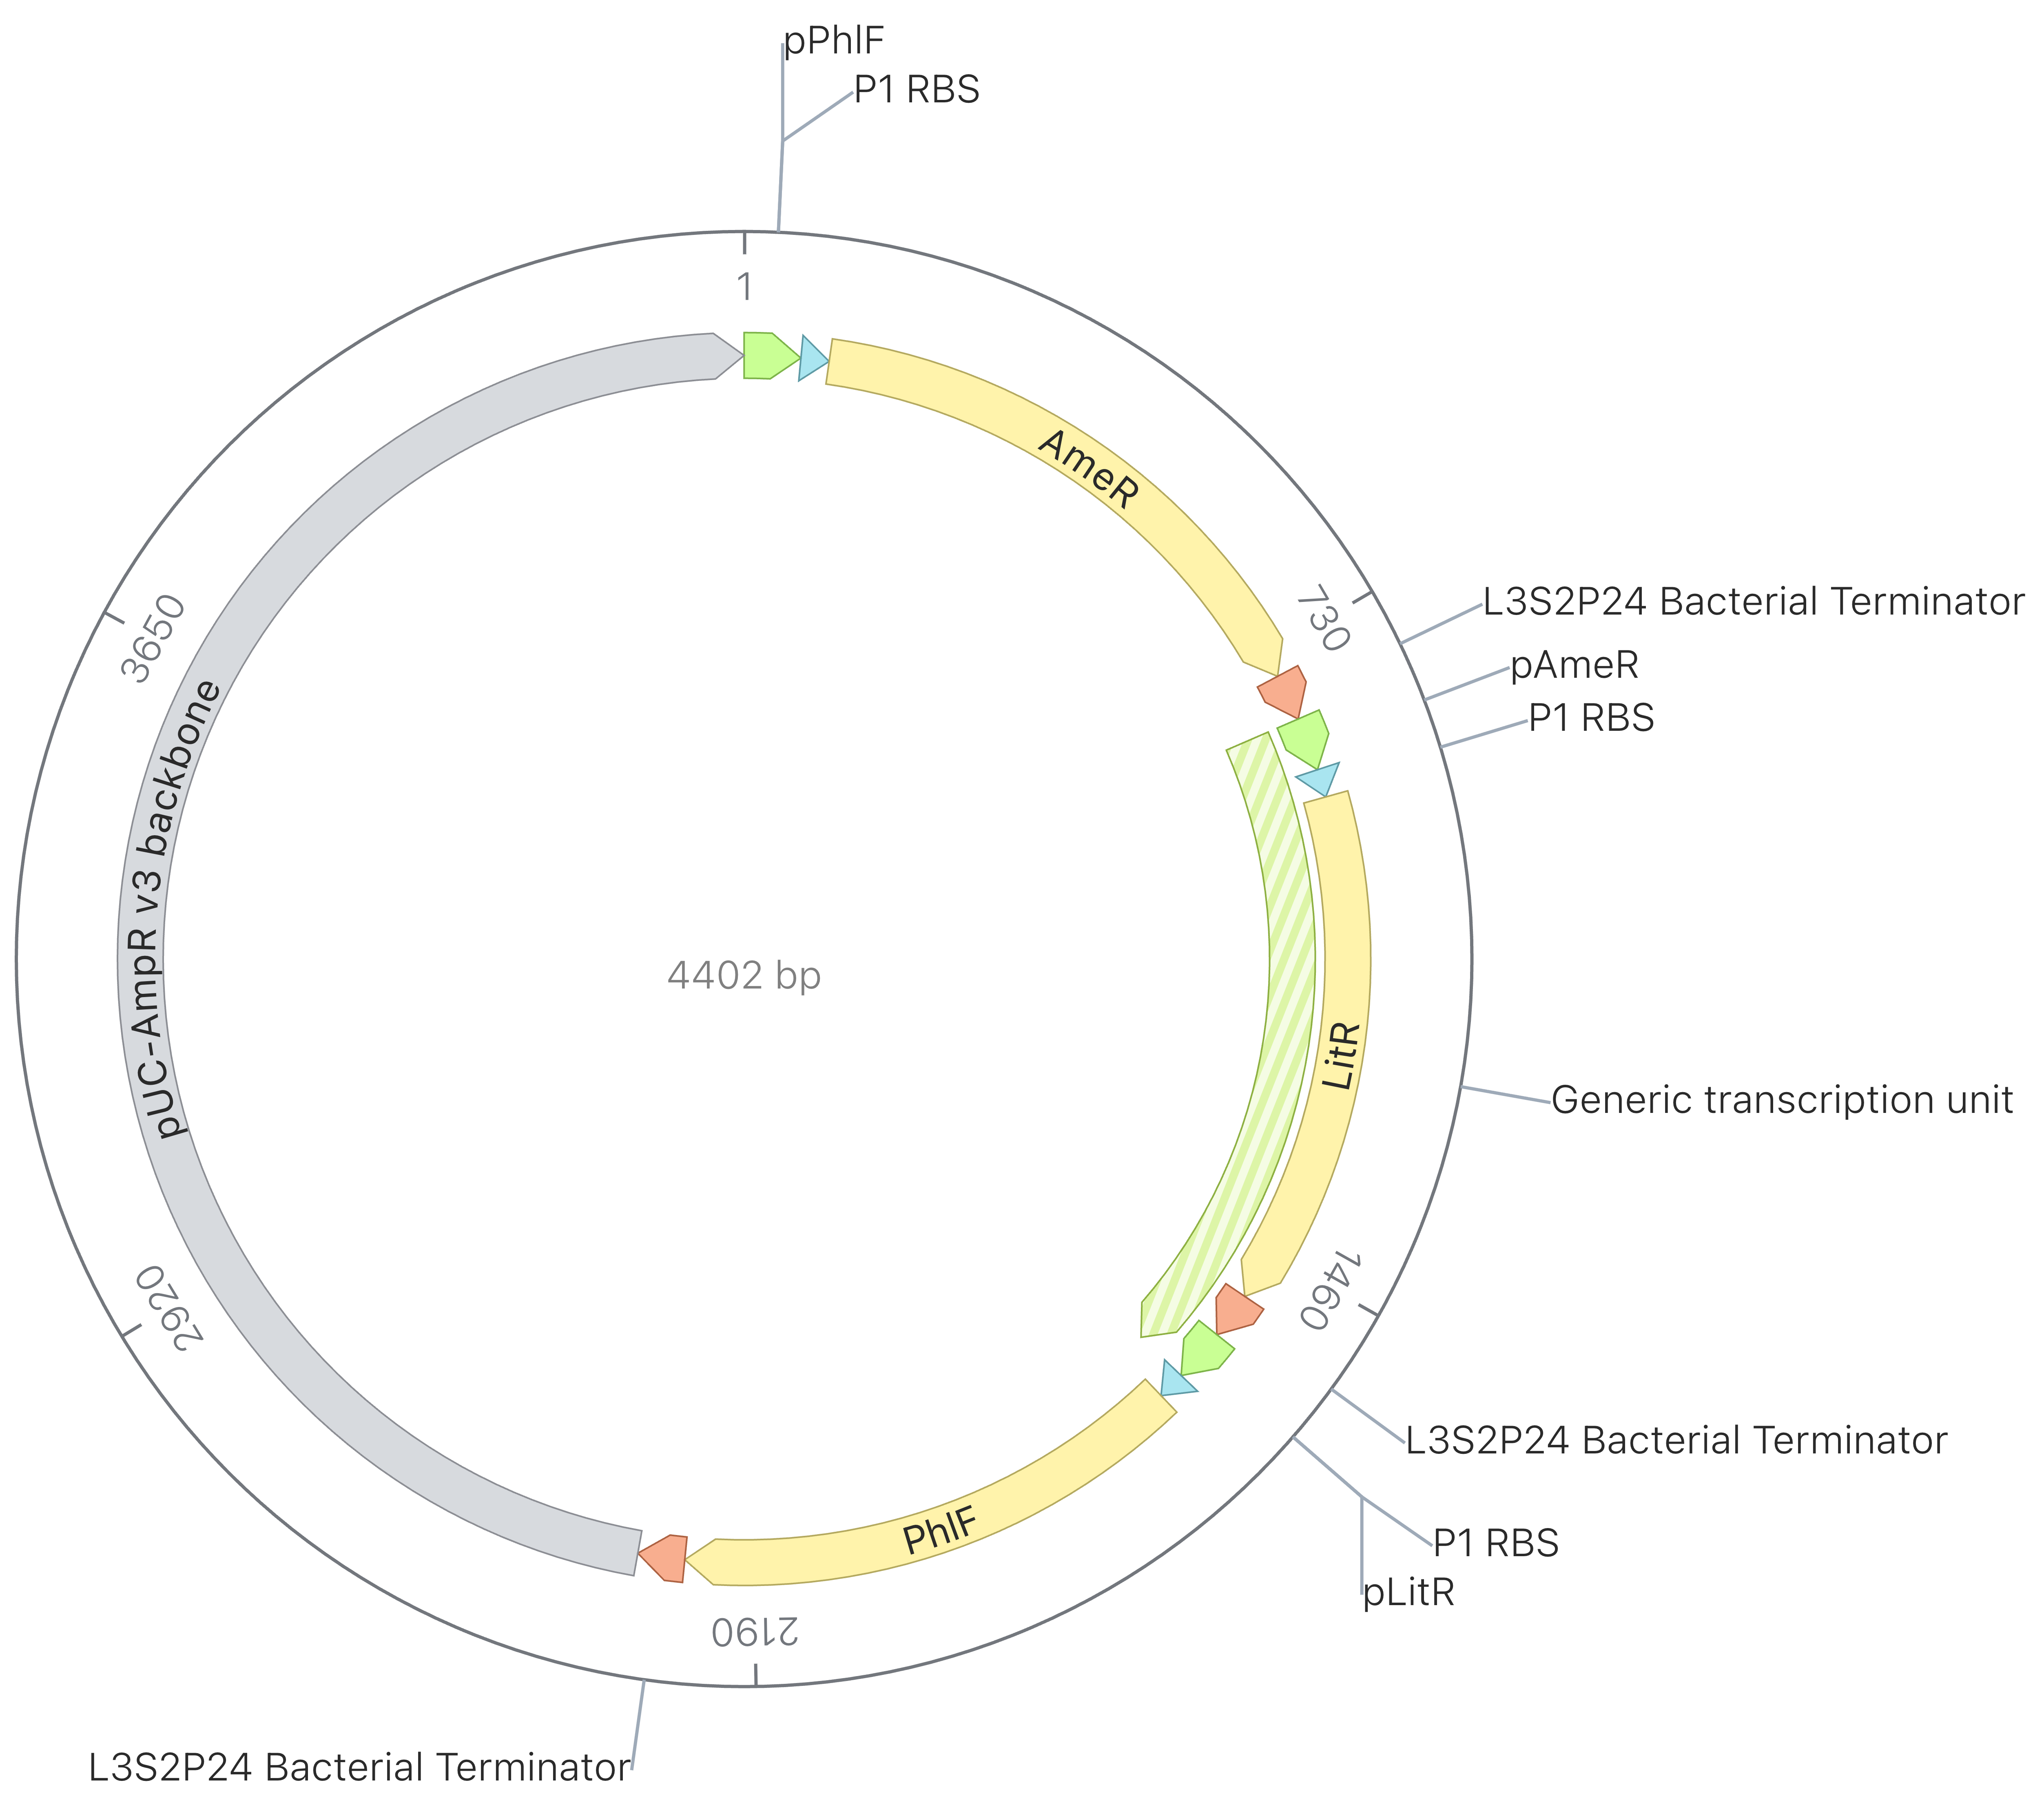
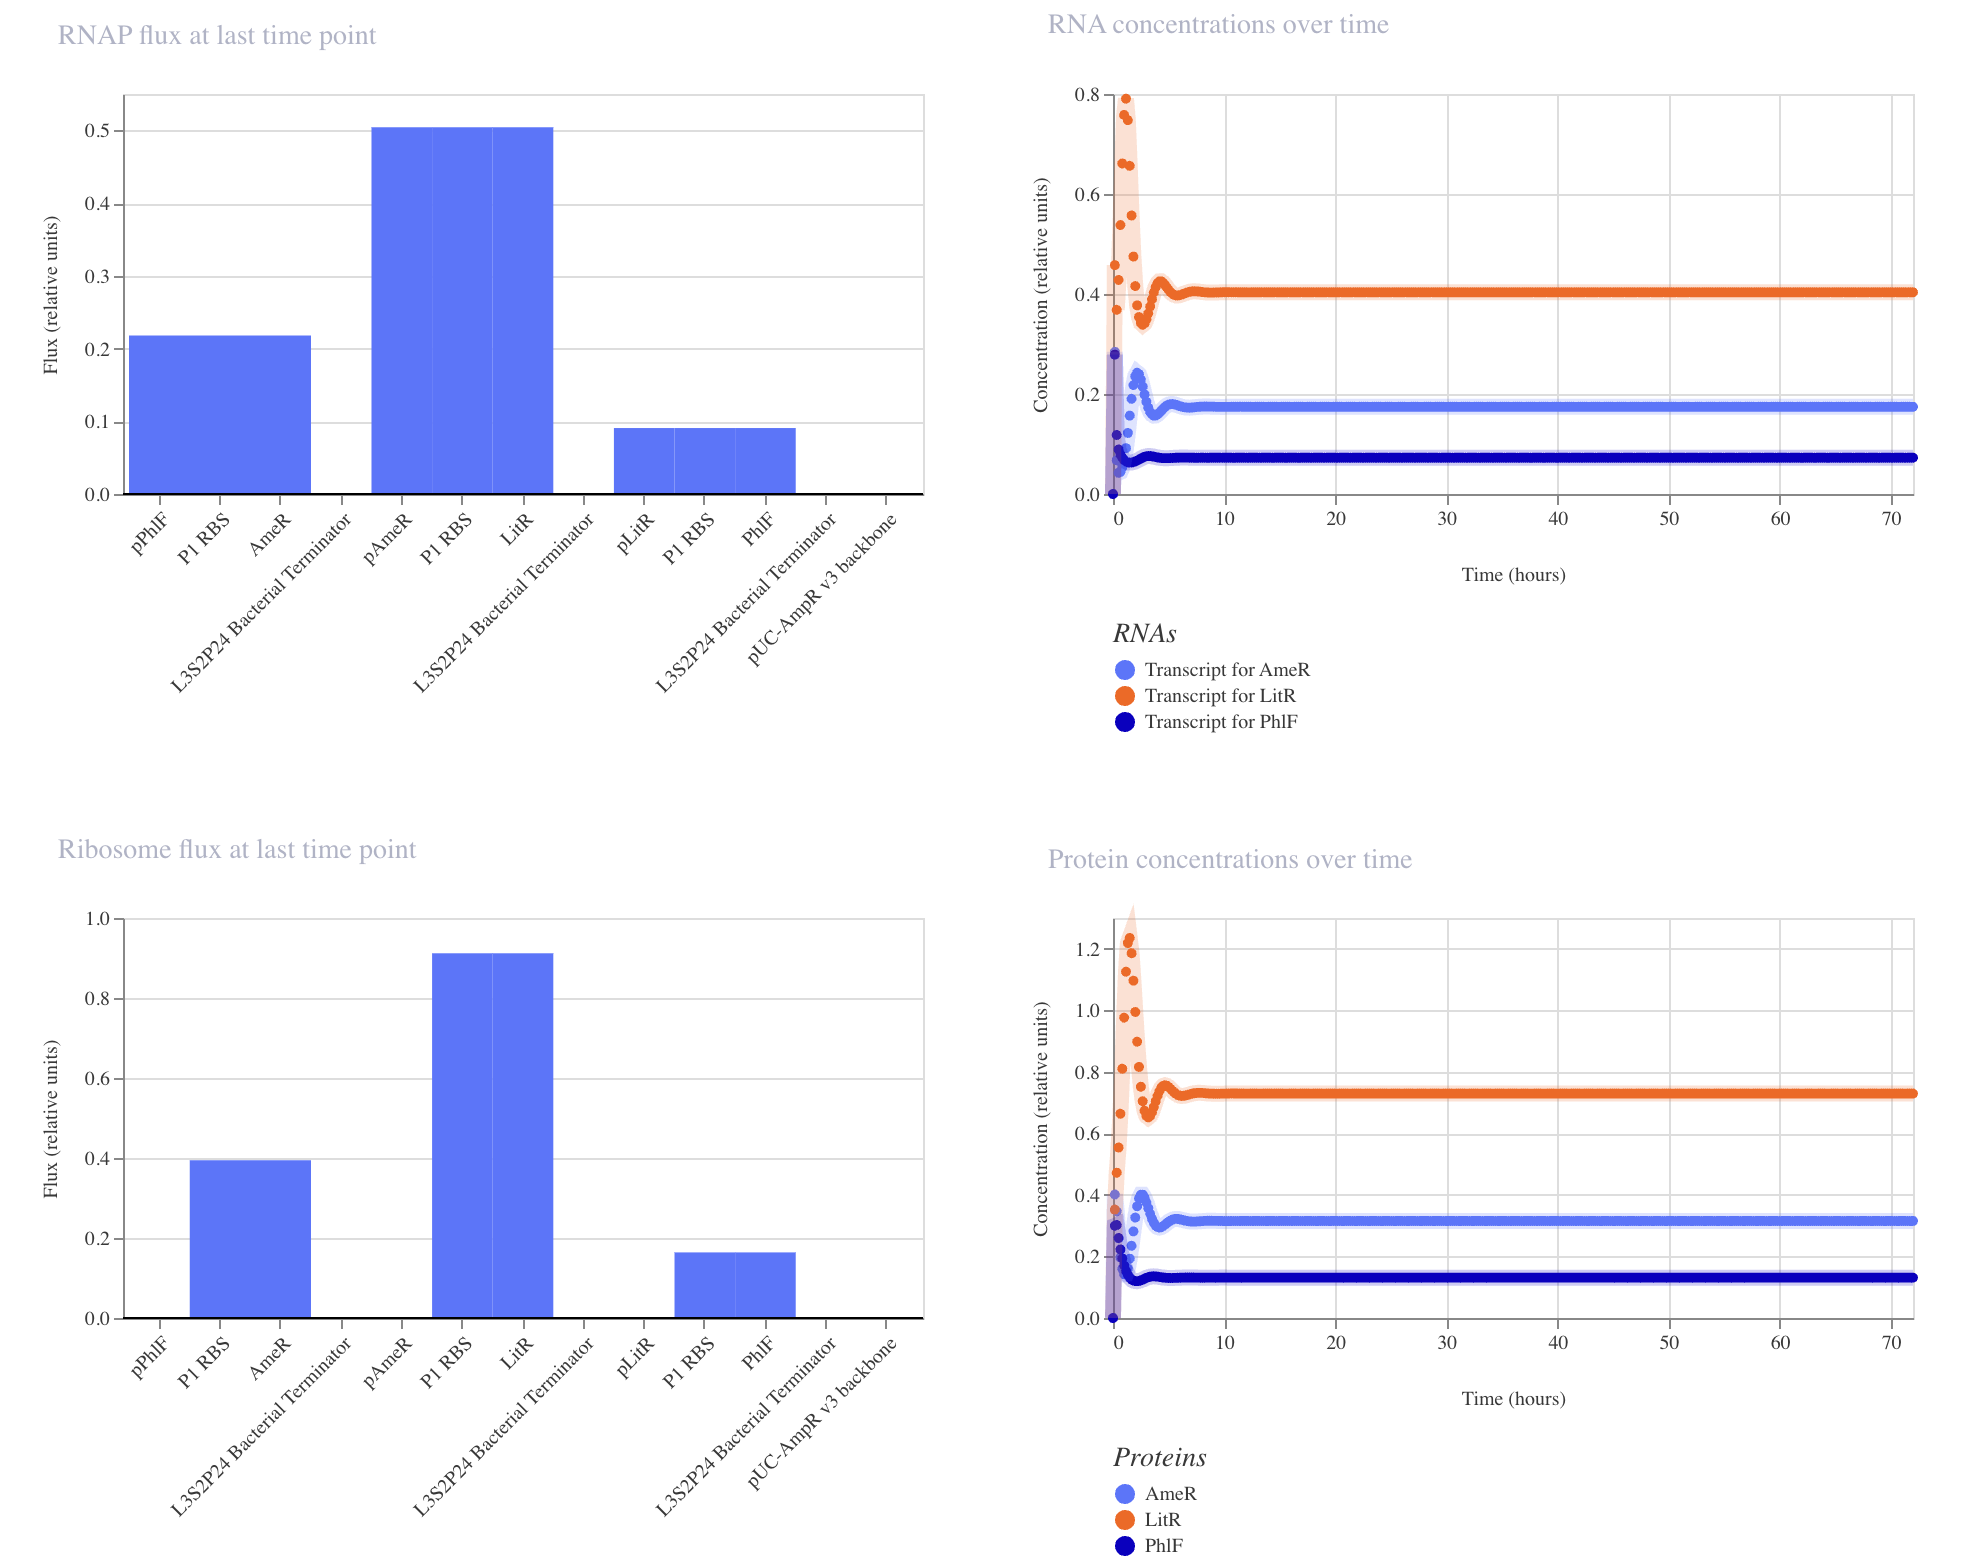
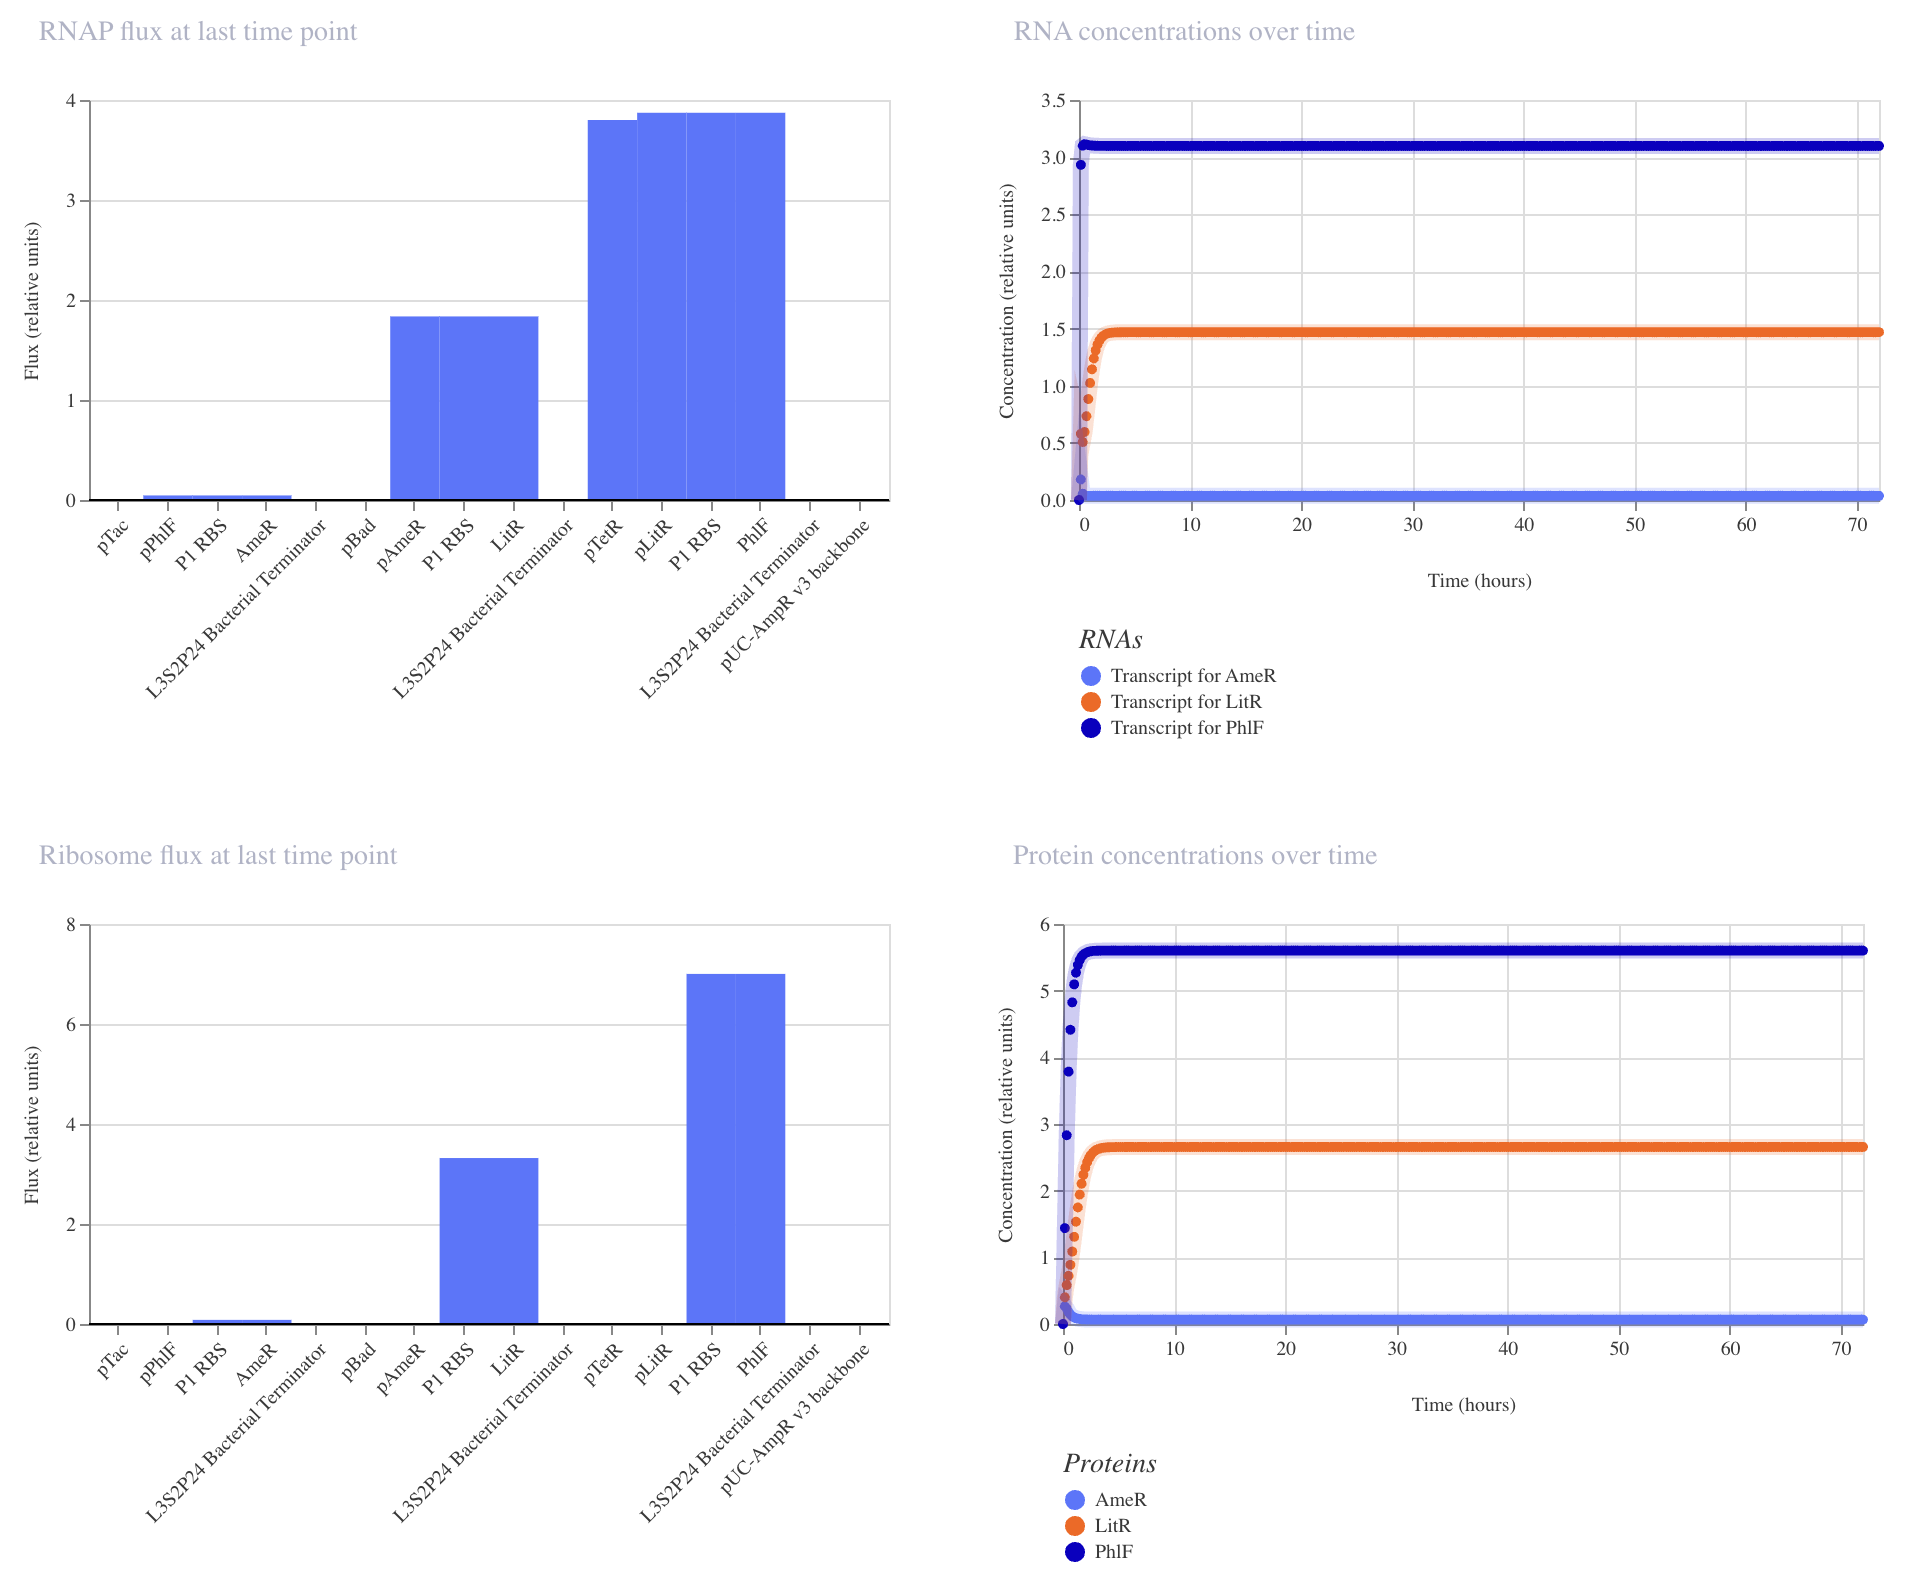
The Example Construct
PhlF represses pPhlF
AmeR represses pAmeR
LitR represses pLitR

This construct achieved low levels of protein production in the order of LitR > AmeR > PhlF.

The example construct did not behave as a represillator; there was no oscillation. Instead, all expression systems similarly achieved a very low level of expression.

I've learned through research that asymmetric expression is needed to kick in oscillatory behavior. Different methods can be applied here: the ribosome binding site can be altered to give different strengths of translation. Levels of repressors can be controlled by inducible promoters. Degradation systems can be built to lower the availability of repressors.

Below, I've modified the same construct with the addition of inducible promoters and monitored the change in the protein production outcome in simulation plots.
5. Build three of your own Constructs using the parts in the Characterized Bacterials Parts Repo
- Explain in the Notebook Entry how you think each of the constructs should function.
- Run the simulator and share your results in the Notebook Entry.
- If the results don’t match your expectations, speculate on why and see if you can adjust the simulator settings to get the expected outcome.
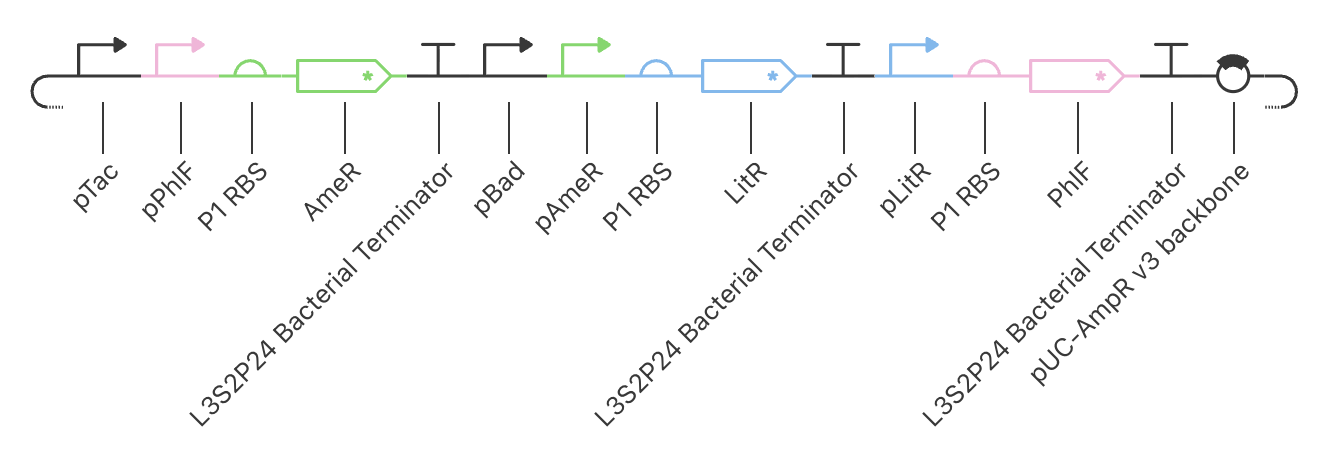
| Construct_1 Schematic |
|---|
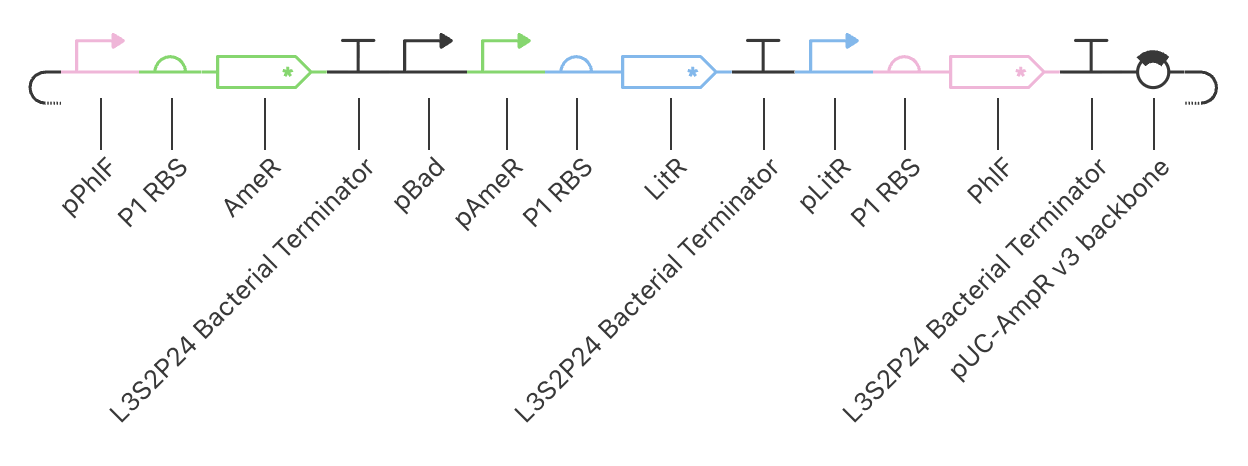
|
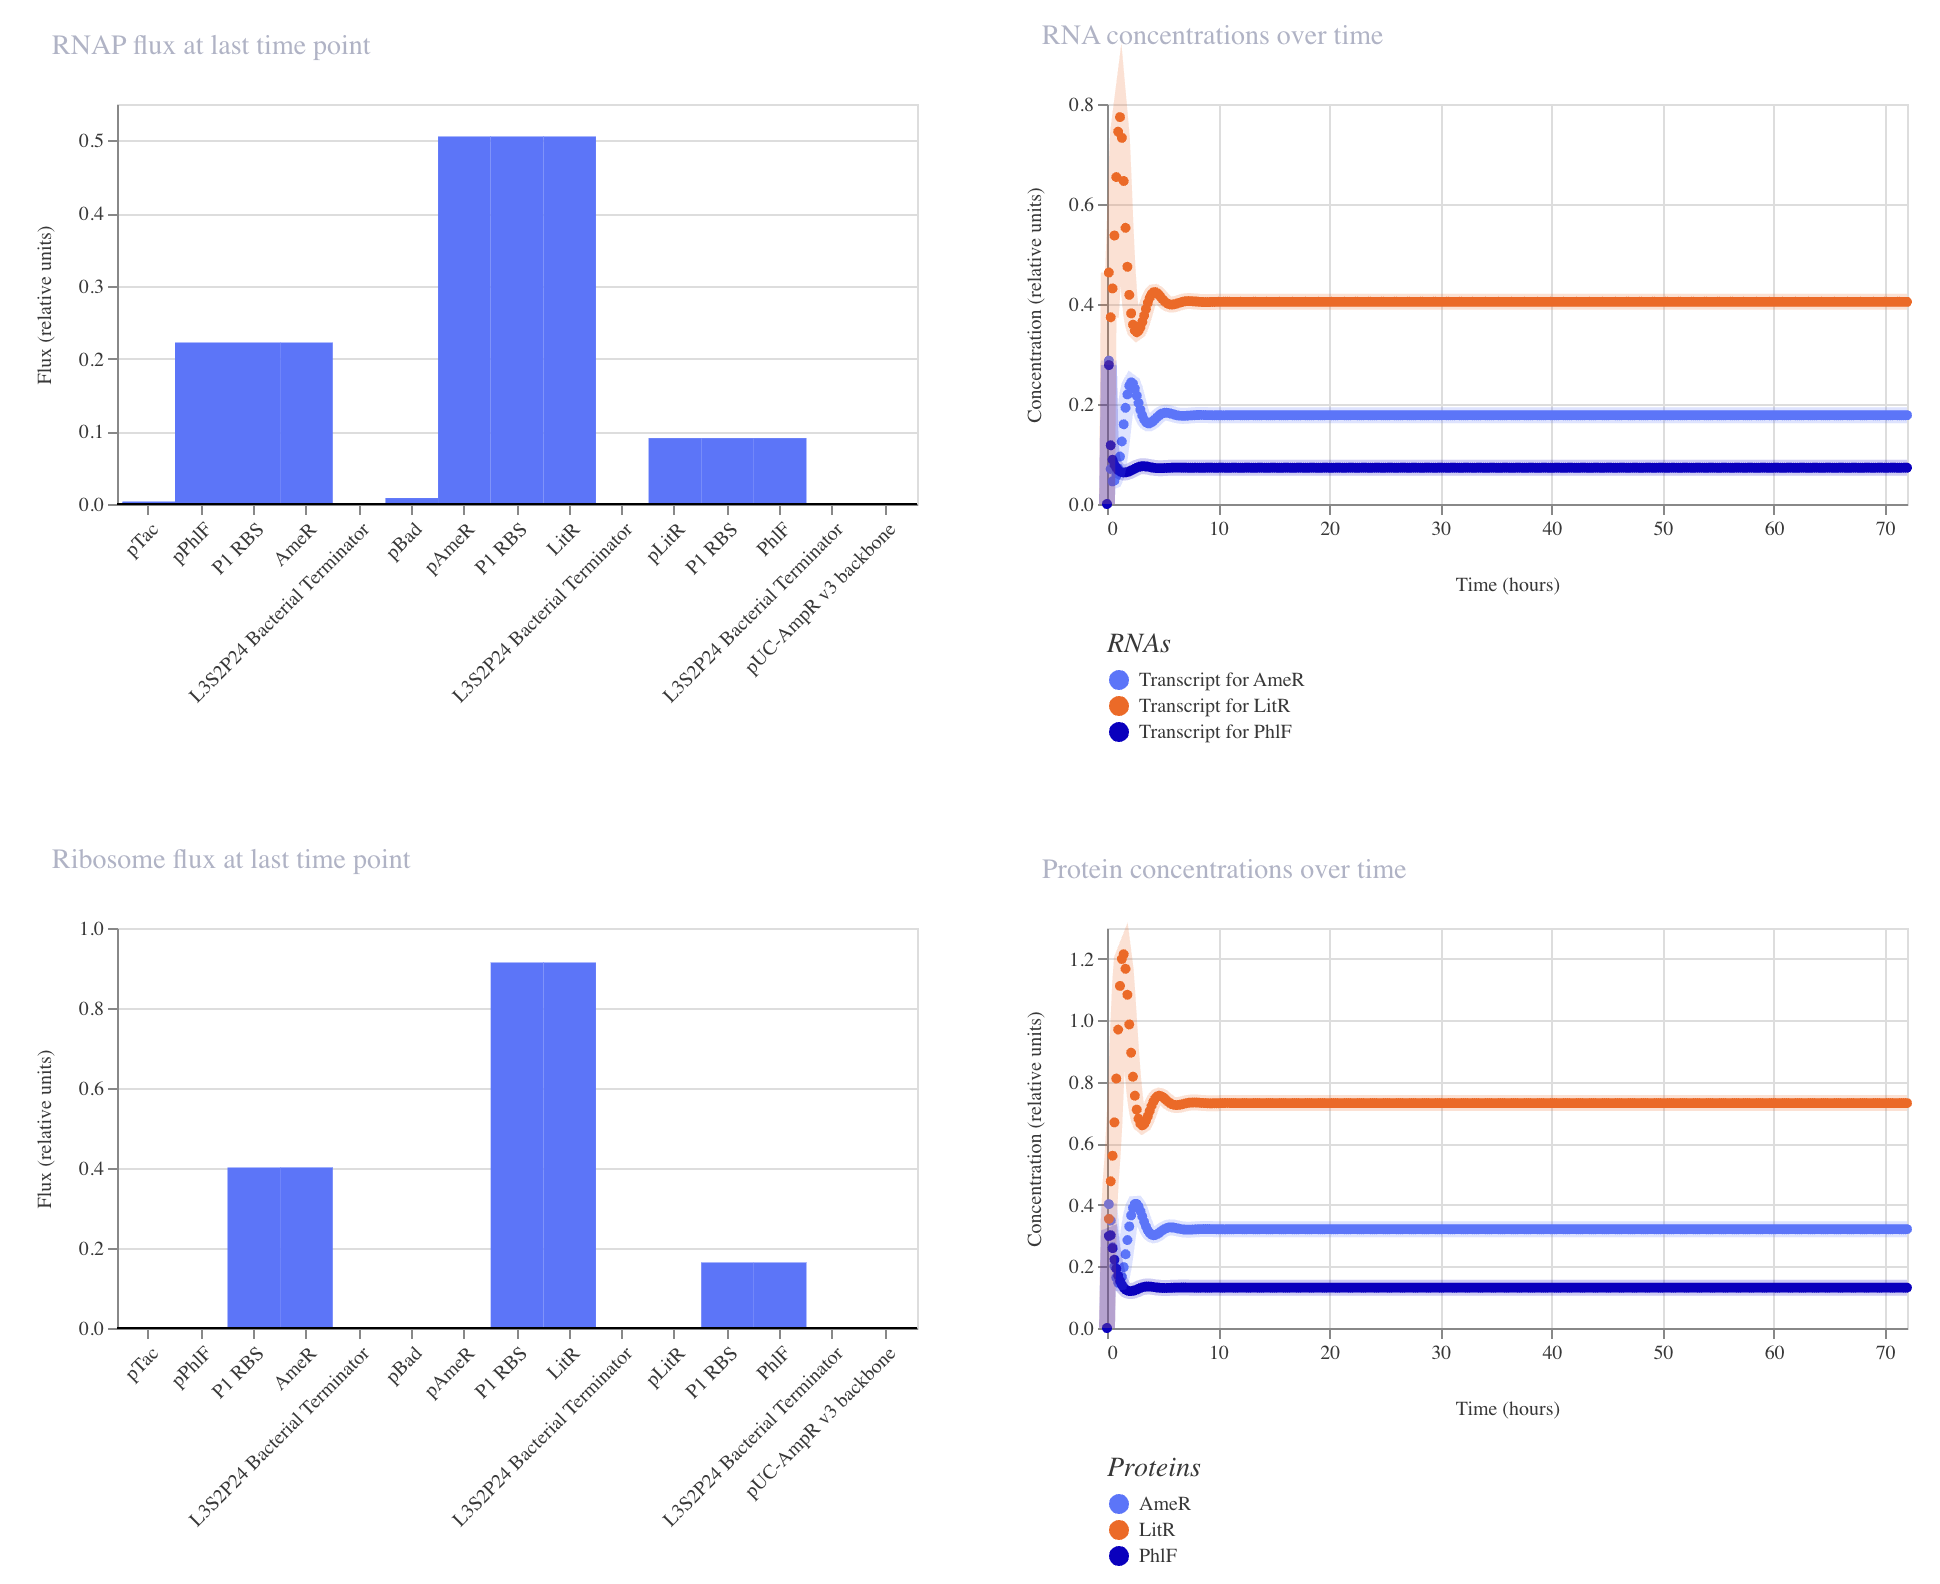
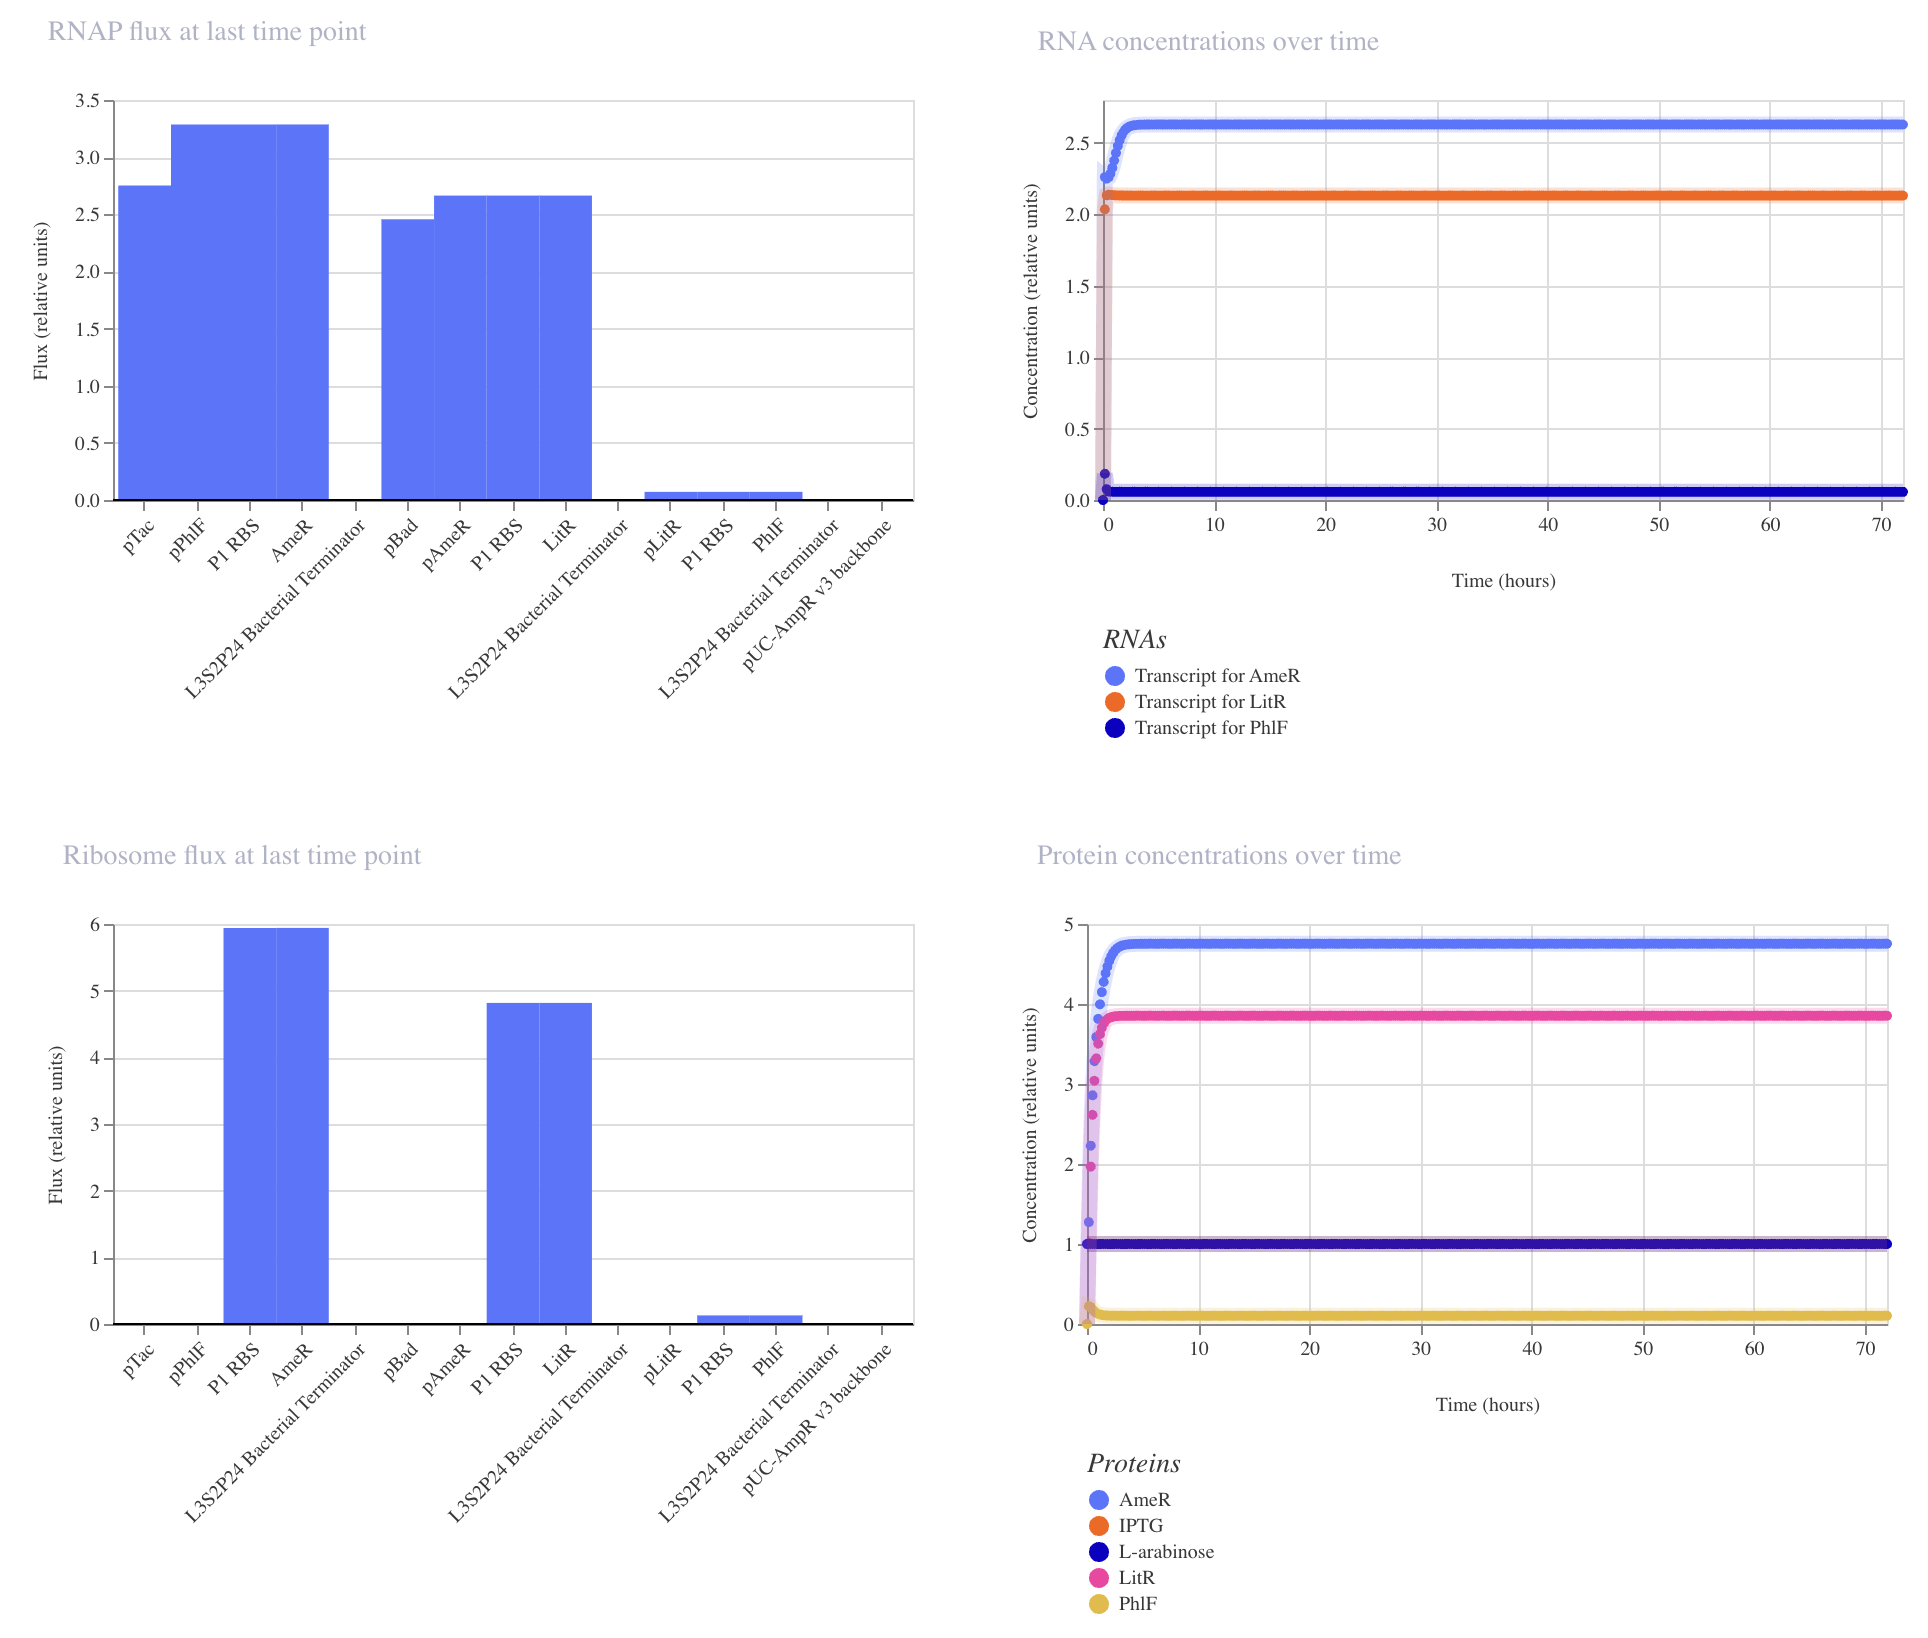
| Construct_1: no ligand | Construct_1: plus L-arabinose |
|---|---|
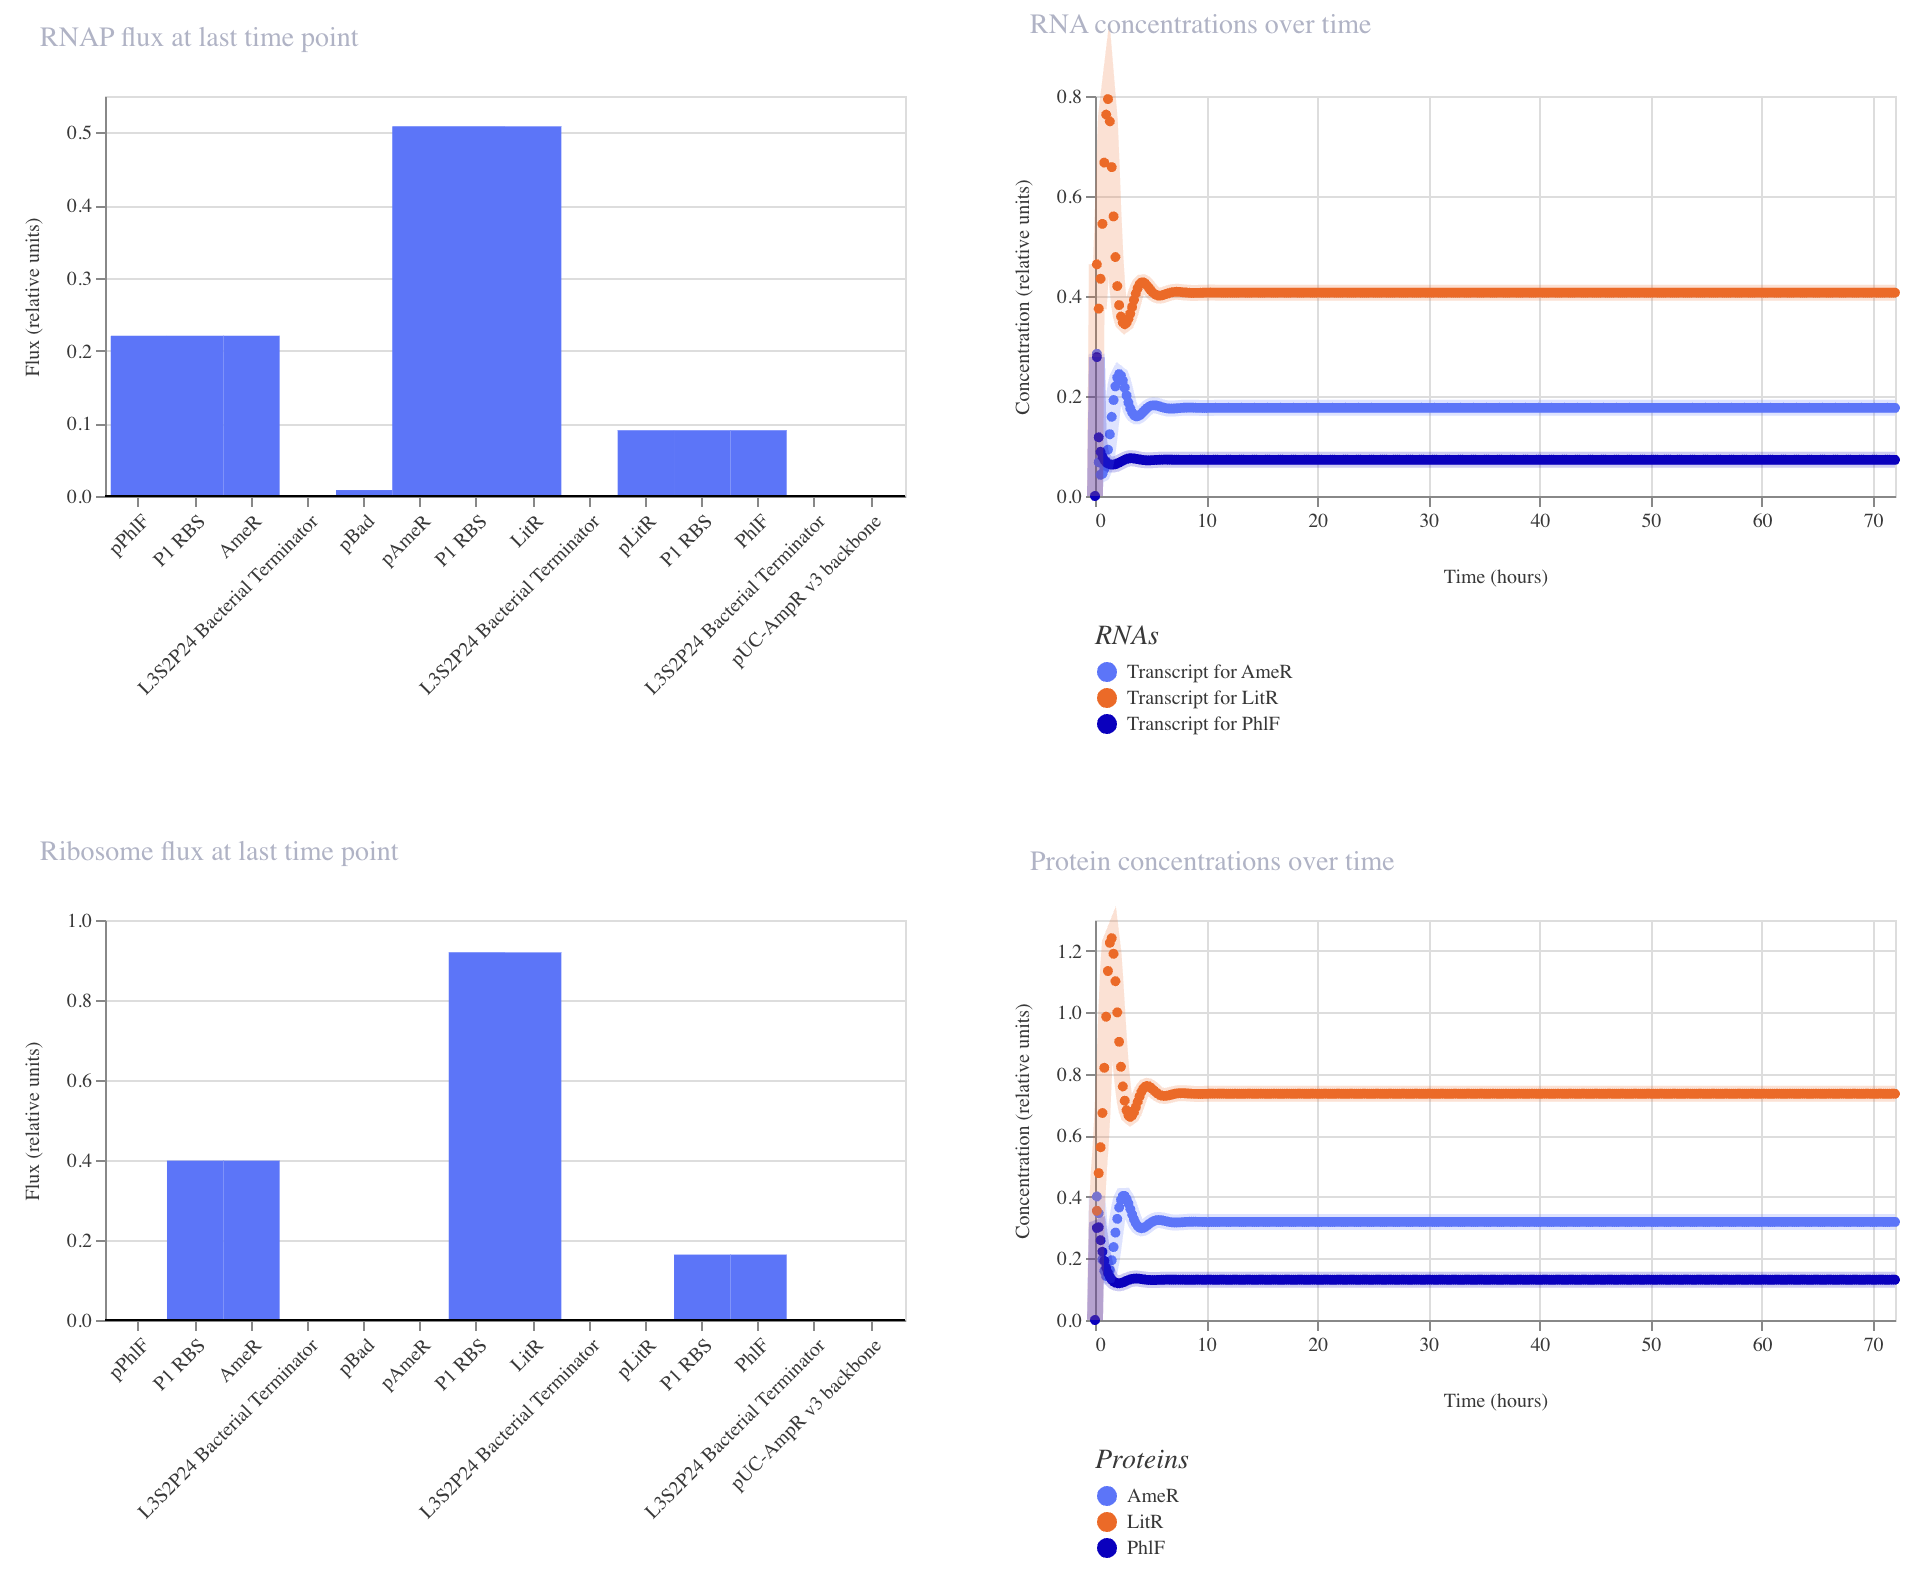
| 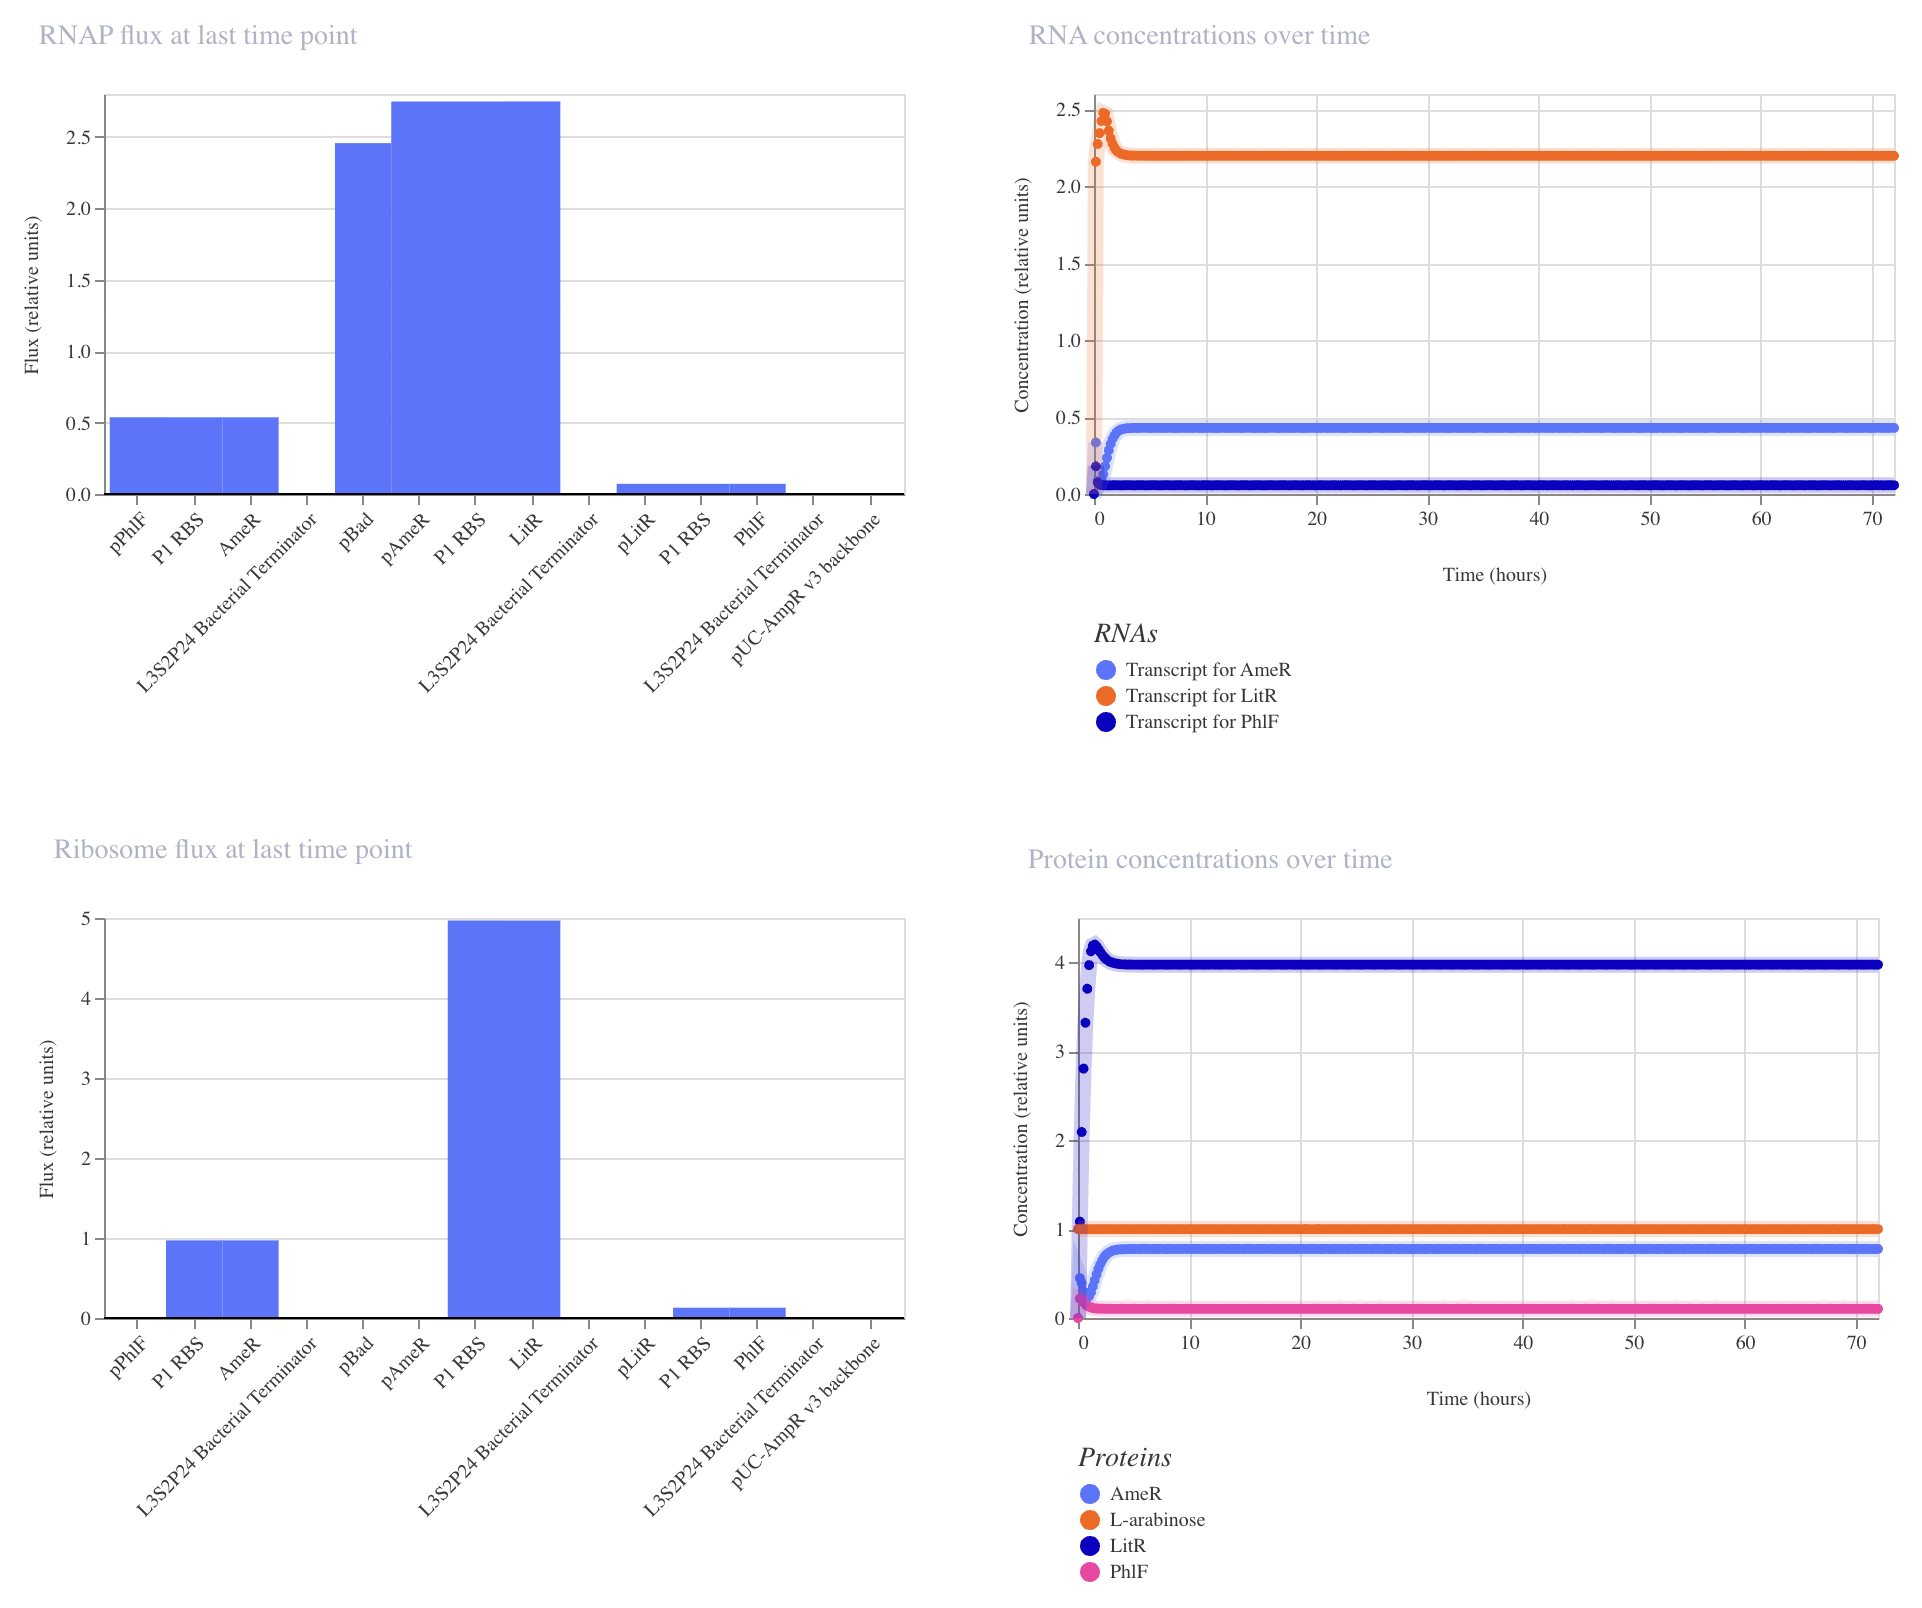
|
Construct_1
PhlF represses pPhlF
AmeR represses pAmeR
LitR represses pLitR
Inducible expression of LitR (pBad)

This construct achieved the highest levels of LitR. AmeR and PhlF remained low.
| Construct_2 Schematic |
|---|
|
| Construct_2: no ligand | Construct_2: plus L-arabinose, IPTG |
|---|---|
| 
|
Construct_2
PhlF represses pPhlF
AmeR represses pAmeR
LitR represses pLitR
Inducible expression of LitR (pBad)
Inducible expression of AmeR (pTac)

This construct achieved the highest levels of both LitR and AmeR. PhlF remained low.
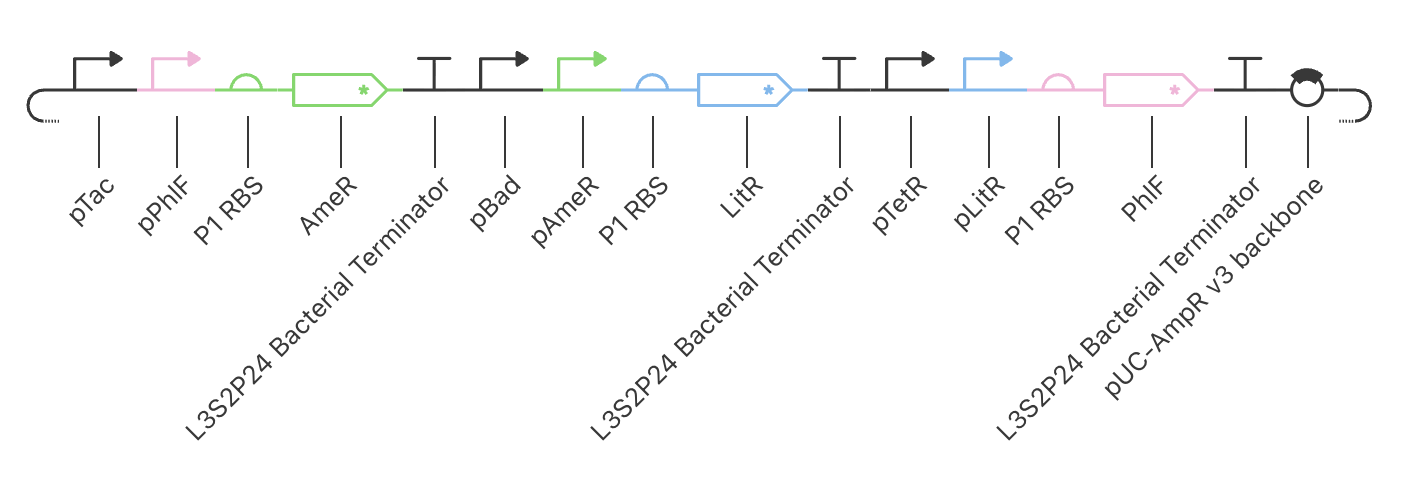
| Construct_3 Schematic |
|---|
|
| Construct_3: no ligand | Construct_3: plus L-arabinose, IPTG, aTc |
|---|---|
| 
|
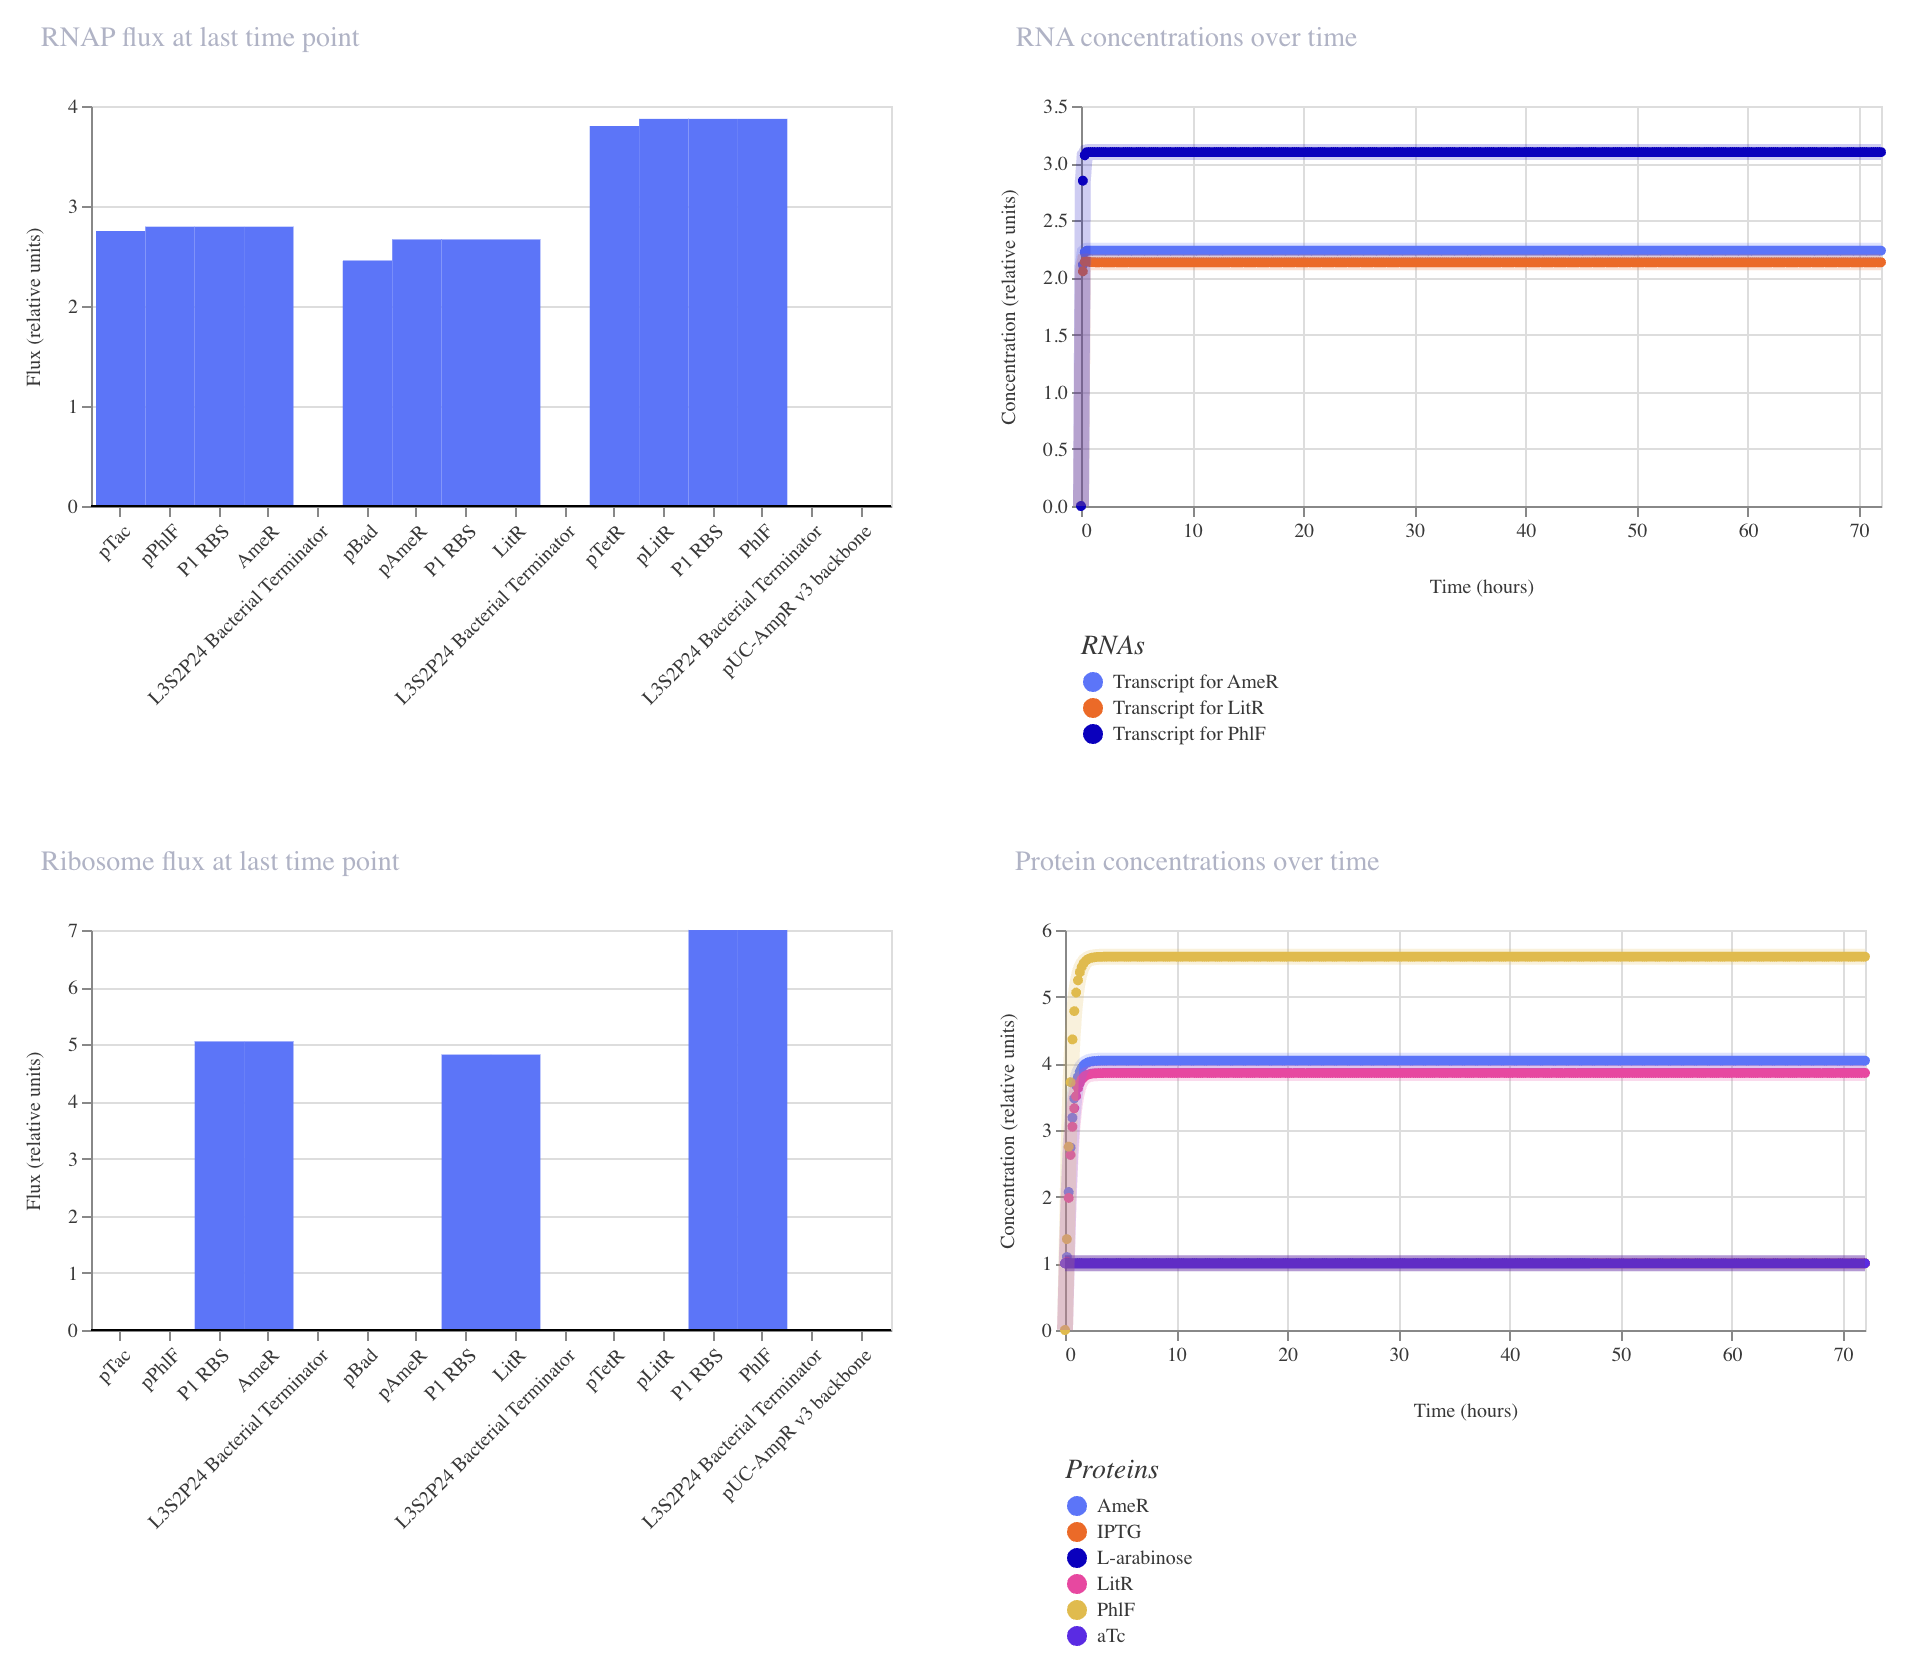
Construct_3
PhlF represses pPhlF
AmeR represses pAmeR
LitR represses pLitR
Inducible expression of LitR (pBad)
Inducible expression of AmeR (pTac)
Inducible expression of PhlF (paTc)

This construct achieved the highest levels of all repressors, PhlF, AmeR, and LitR. Although higher levels of expression have been achieved, there is still no oscillation. Further modifications are needed to gain a repressillator function.
I’ve used Claude AI research.
Prompts: Can you help me analyze this construct expressed in E. coli? Simulation data tell me that the expression is very low. Is that due to the continuous repression of each system?