Week 10 HW: Imaging and Measurement
Homework: Final Project
- Please identify at least one (ideally many) aspect(s) of your project that you will measure. It could be the mass or sequence of a protein, the presence, absence, or quantity of a biomarker, etc.
My final project focuses on the development of a biosensor based on a capture nanobody and reporter DNA aptamer, enabling the detection of a protein biomarker for the body’s iron status.
Key areas for measurement:
Characterization of the purified biomarker protein.
Screening and validation of DNA aptamers to biomarker proteins and determining binding affinity.
Electrochemical response measurements to characterize the liberation effect of the toehold region on the nanobody and the proximity effect of the toehold region with a branch-migration region on the DNA aptamer.
Please describe all of the elements you would like to measure, and furthermore, describe how you will perform these measurements.
What are the technologies you will use (e.g., gel electrophoresis, DNA sequencing, mass spectrometry, etc.)? Describe in detail.
1. Characterization of the purified biomarker protein: the human ferritin heavy chain
Total protein quantification by a colorimetric assay, such as a commercially available BCA (Bicinchoninic Assay). The assay is based on the reduction of copper by protein, a.k.a. the biuret reaction, with the output of color development. Color can then be detected by absorbance at 562 nm in a spectrophotometer. A calibration or standard curve must be generated with a known purified protein, such as BSA, at the same assay scale. The standard protein must be serially diluted at the assay’s linear range and run alongside the experimental samples. This way, measurement would be obtained under the same conditions, such as fluctuations from the instrument’s operational system. Using the standard curve, the concentration of the unknown sample can be calculated based on its absorbance values, which would be compared to the reference protein.
Visualization of the purified protein by SDS-PAGE (SDS Polyacrylamide Gel Electrophoresis) to understand whether the co-purified protein is present in the sample. The SDS-PAGE technique is a low-cost way to understand the purification process. This technique separates the proteins in denaturing conditions in an electrical field based on mass (molecular weight). A protein with a smaller mass would run quicker in the gel, and larger proteins would run slower. The protein gel is stained, and the protein band is visualized. Known protein markers are loaded as a ladder that can help guide the estimation of the mass of proteins on the gel. Furthermore, a protein mass can be quantified on the gel by quantifying the intensities of protein bands. An image of the gel would store data as pixels, and pixel intensities can be calculated. So, the protein gel after staining must be imaged. For quantification, similarly, a standard curve must be generated with a known protein as a reference.
Oligomeric state of the purified protein can be determined by CDMS (Charge Detection Mass Spectrometry) analysis. The human ferritin heavy chain is a 24-subunit protein with ~500 kDa mass that forms a 12 nm diameter spherical shell. The inside of the shell is hollow. Each subunit of ferritin is ~21 kDa. CDMS is particularly useful for analyzing large molecules such as ferritin. Technology has been developed to measure the masses of individual ions as they travel through a detection cylinder in the instrument. Signals coming from the induced charge are then used for calculating the mass-to-charge ratio and charge for each ion. This enables measurement of molecules with mass ranges extending to much higher masses. Since the ferritin is self-assembled into a 24-subunit sphere, CDMS analysis can be useful to identify the oligomeric status of the synthesized protein from the cell-free reaction.
2. Screening and validation of DNA aptamers to biomarker proteins and determining binding affinity.
- DNA aptamers for ferritin can be identified by SELEX and YSD:
SELEX (Systemic Evolution of Ligands by Exponential Enrichment) is a widely used in vitro technique that identifies candidate DNA aptamers with high binding affinity to the target protein from a library of oligos. The purified target protein immobilized on a bead and a library of DNA oligos go through several cycles of binding and elution. High-affinity binders obtained from this technique must be analyzed, and binding affinity must be measured.
Yeast surface display (YSD) is a cell-based in vivo method coupled with flow cytometry, which can be coupled with SELEX for the validation and characterization of aptamers. The target protein is expressed and displayed on the yeast surface, and immobilized targets are incubated with DNA aptamer-dye conjugates and are passed through flow cytometry. Protein/binder complexes are detected based on the excitation/emission spectra of the dye.
- DNA aptamer binding affinity measurements:
CDMS (Charge Detection Mass Spectrometry) can be used for characterizing the equilibrium binding affinity (Kd) of binders to the target protein in the native state.
NOTES on Ferritin DNA aptamers:
DNA aptamers known to interact with ferritin are not reported up-to-date. However, a nucleic acid aptamer against anti-ferritin antibodies has been reported with a Kd of 1600 nM after multi-round SELEX (Hamm 1996.)
- Nanobody binder for ferritin:
Strong nanobody binders to ferritin heavy chain have been identified after immunization of alpaca and immune library screening (Hu et al. 2022.) Hu et al. reported the CDR3 amino acid sequences of strong binders, Nb72 and Nb151, AAACDDGL——IIRTTVSY and AAACDDIL——NPRTTVVV, respectively.
3. Electrochemical response measurements to characterize the liberation effect of the toehold region on the nanobody and the proximity effect of the toehold region with a branch-migration region on the DNA aptamer.
As it would be the final version of this biosensor platform, electrochemical response measurements require the manufacturing of electrodes and the immobilization of the capture nanobody and reporter DNA aptamer on the electrode’s surface. For the sake of screens and selecting the working pairs, capturing and detecting DNA aptamers, I will approach multi-level assays that reveal different aspects of interactions in the biosensor development.
The main technical basis of the biosensor design does not rely on enzymatic activity for detection. It uses a mechanism called “the toehold-mediated strand displacement.” It is widely applied in biosensor designs (Wang et al. 2015.) In this strategy, the toehold is in a cage. It must be triggered to be released, which could happen by the target protein binding (steric hindrance) and proximity-induced strand invasion by the DNA aptamer binding to an adjacent epitope.
- Proximity Ligation Assay (PLA): An assay to reveal the proximity of the DNA aptamers. It measures direct interaction between two distinct DNA aptamers due to having complementary regions that lead to hybridization and ligation by the provided DNA ligase. If aptamers interact, it will produce a ligated hybrid molecule that can be detected by PCR amplification with a provided connector oligo. If the aptamers do not interact, no PCR product is produced (Fredriksson et al. 2002.) Aptamer interactions can also be detected by fluorescent dyes (Baldinotti et al. 2024.) Although the proposed project for ferritin detection does not use an enzymatic process or fluorescent dyes, PLA can be used as a screen in identifying the best proximity of the nanobody and the DNA aptamer pairs. So, nanobodies that are conjugated with a complementary oligo and the DNA aptamer carrying the complementary region to the cage will be incubated with the purified ferritin protein in solution and a PCR reaction will follow.
Homework: Waters Part I - Molecular Weight
We will analyze an eGFP standard on a Waters Xevo G3 QTof MS system to determine the molecular weight of intact eGFP and observe its charge state distribution in the native and denatured (unfolded) states. The conditions for LC-MS analysis of intact protein cause it to unfold and be detected in its denatured form (due to the solvents and pH used for analysis).
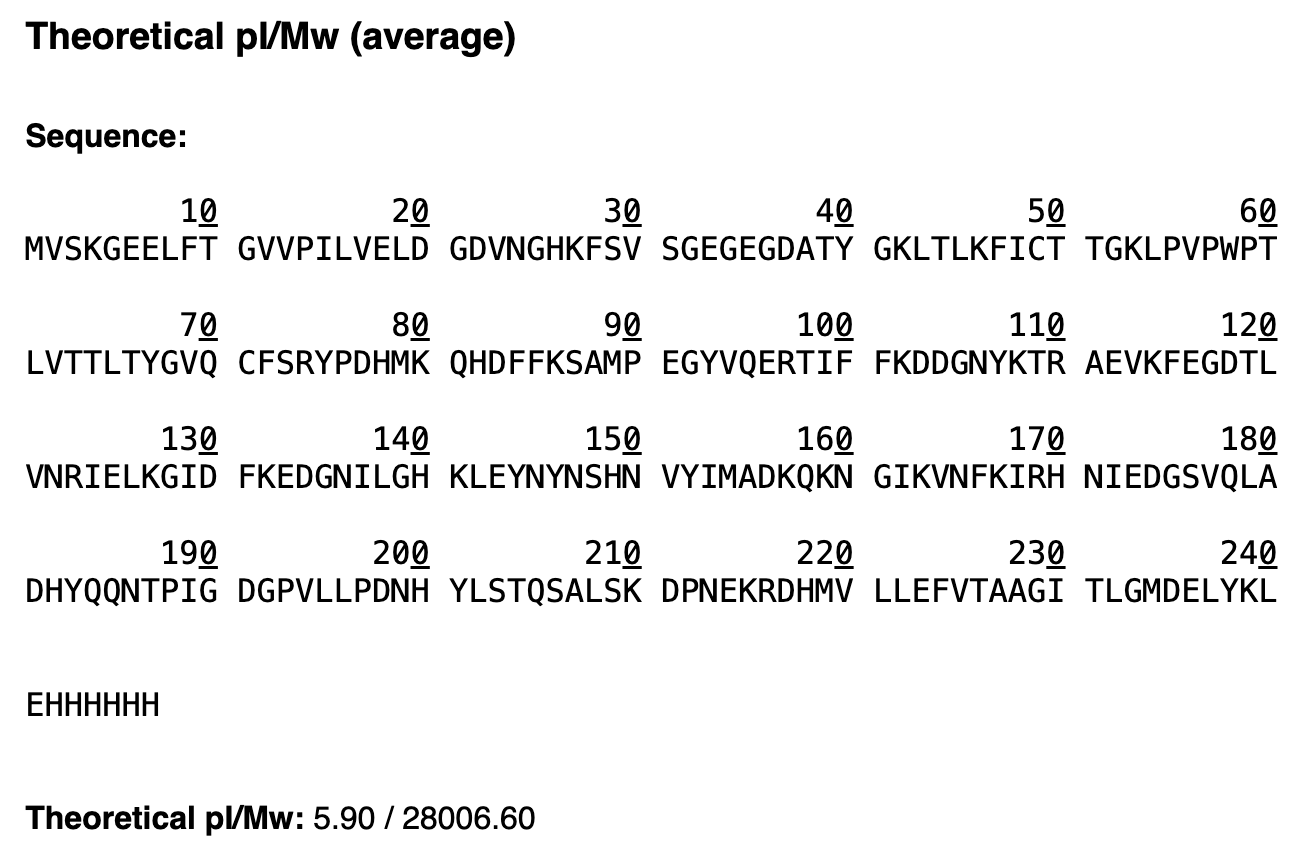
- Based on the predicted amino acid sequence of eGFP (see below) and any known modifications, what is the calculated molecular weight? You can use an online calculator like the one at link eGFP Sequence:
MVSKGEELFTG VVPILVELDG DVNGHKFSVS GEGEGDATYG KLTLKFICTT GKLPVPWPTL VTTLTYGVQC FSRYPDHMKQ HDFFKSAMPE GYVQERTIFF KDDGNYKTRA EVKFEGDTLV NRIELKGIDF KEDGNILGHK LEYNYNSHNV YIMADKQKNG IKVNFKIRHN IEDGSVQLAD HYQQNTPIGD GPVLLPDNHY LSTQSALSKD PNEKRDHMVL LEFVTAAGIT LGMDELYKLE HHHHHH
Note: This contains a His-purification tag (HHHHHH) and a linker (the LE before it).
GFP+LE+6xH = 247 amino acids
Below is the result from the online calculator:
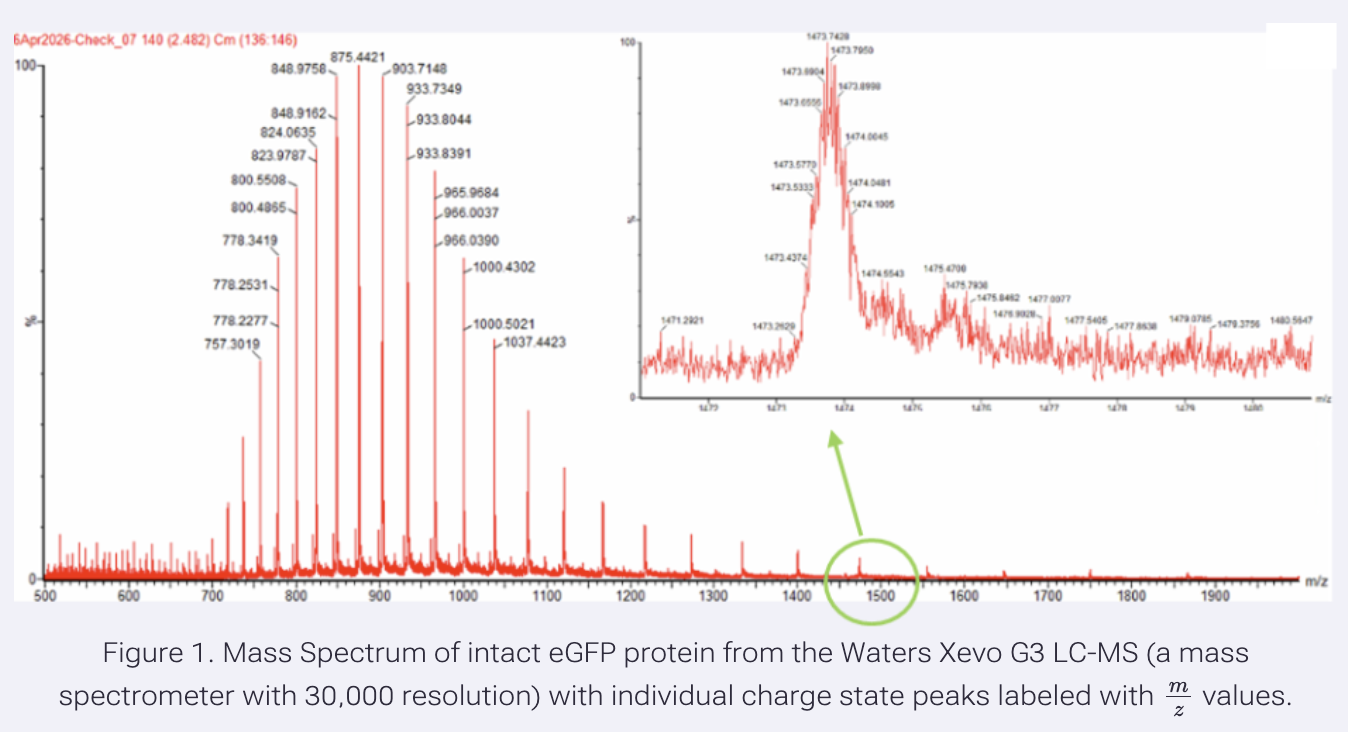
- Calculate the molecular weight of the eGFP using the adjacent charge state approach described in the recitation. Select two charge states from the intact LC-MS data (Figure 1) and:
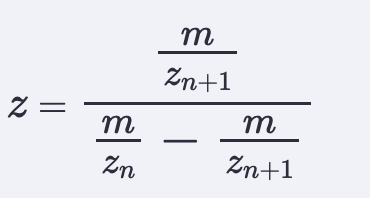
- Determine z for each adjacent pair of peaks (n, n + 1) using the formula below, left.
- Determine the MW of the protein using the relationship between m/zn, MW, and z.
- Calculate the accuracy of the measurement using the deconvoluted MW from 2.2 and the predicted weight of the protein from 2.1 using the formula below, right.
| 
|
Results:
I used the following peaks in this exercise:
- peak: 903.7148
- peak: 933.7349
Solving for z, the charge state:
The m/z values (peak values in Figure 1) are smaller when the charge state increases. It is because mass is constant, and it is divided by charge.
n is the charge; n+1 indicates the next level, the added charge, so it would be the next peak.
m/zn has lesser charge than m/zn+1
We need to enter the m/z values in the formula in the following way:
    z = m/z_n+1 / (m/z_n - m/z_n+1)

      = 903.7148 / (933.7349 - 903.7148)

      = 903.7148 / (30.0201)

      = 30.1036
Solving for molecular weight:
Ionized protein mass = (M_protein + z x 1.00728)
Because charge state (z) is the addition of protons, the formula uses the value of the hydrogen atom mass minus electron mass.
(Hydrogen atom = 1.00794 Da; electron mass = 0.000549 Da; proton mass = 1.00728 Da)
Since m/z is measured:
  m/z = (M + z x 1.00728) / z

  m/z x z = M + (z x 1.00728)

  M = m/z x z - (z x 1.00728)

    = 903.7148 x 30 - (30 x 1.00728)

    = 27,111.444 - (30.2184)

    = 27,081.2256 Da
Calculating for the other peak:
Since each peak has a charge value of +1 addition, we need to use “correct z” for the next peak.
The z value for the peak 903.7148 is 30
The z value for the peak 933.7349 is 29
  M = m/z x z - (z x 1.00728)

    = 933.7349 x 29 - (29 x 1.00728)

    = 27,078.3121 - (29.21112)

    = 27,049.10098 Da
Differences of M calculated from peaks: 903.7148 and 933.7349
 Difference =

 (Mass calculated from peak 903.7148) - (Mass calculated from peak 933.7349)

            = (27,081.2256 Da) - (27,049.10098 Da)

            = 0.032 Da
Accuracy:
Theoretical MW for GFP: 26941.48  (239 amino acids)

Experimental MW for GFP (calculated from the average of peaks 903.7148 and 933.7349) = 27,065.1632

Accuracy = (MW exp - MW theory) / MW theory

         = (27,065.1632 - 26,941.48) / 26,941.48

         = (123.6832) / 26,941.48

         = 0.004591

         = 0.004591 x 1,000,000 = 4,591 ppm
I’ve used Claude’s research for troubleshooting.
-I’ve learned that I’ve used the same z-value when calculating mass for 2 adjacent peaks, which is wrong. I went back and corrected that.
-Claude AI listed typical mass accuracy based on instruments. The Waters Xevo G3 has a typical mass accuracy of ~100-5,000 ppm. The calculated accuracy value of 4,591 ppm falls within that range.
-Used a standard formula for molecular weight calculations as provided with an explanation.
Homework: Waters Part II - Secondary/Tertiary Structure (Optional)
We will analyze eGFP in its native, folded state and compare it to its denatured, unfolded state on a quadrupole time-of-flight MS. We will be doing MS-only analysis (no liquid chromatography, also known as “direct infusion” experiments) on the Waters Xevo G3-QToF MS.
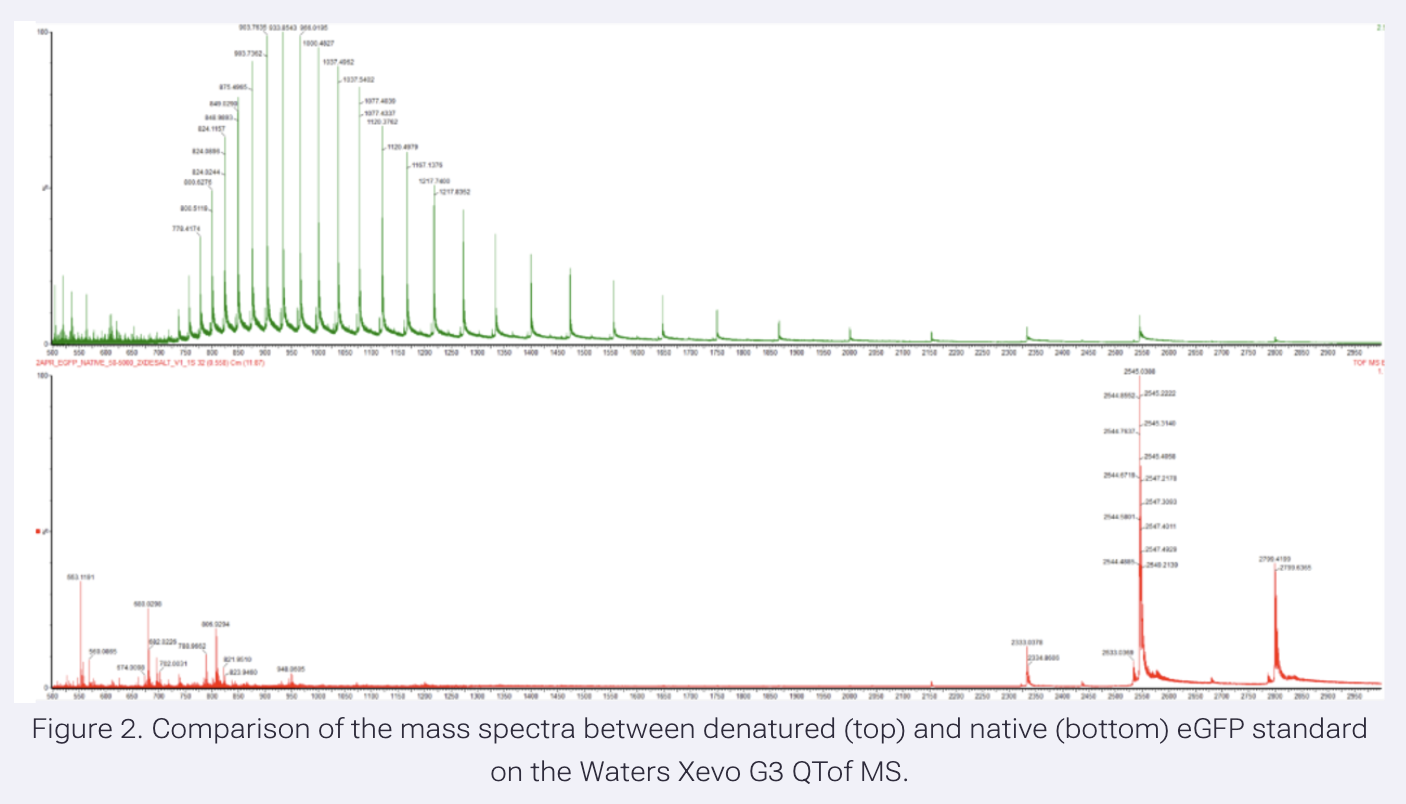
- Based on learnings in the lab, please explain the difference between native and denatured protein conformations. For example, what happens when a protein unfolds? How is that determined with a mass spectrometer? What changes do you see in the mass spectrum between the native and denatured protein analyses (Figure 2)?
Results:
Native proteins would be folded and have preserved their primary, secondary, tertiary, and quaternary structures.
Denatured proteins would be unfolded and be in their primary structure.

When a protein unfolds, non-covalent interactions such as the hydrogen bonds, which keep alpha helices and beta sheets in their folded structures, are disrupted. Other non-covalent interactions, such as hydrophobic, ionic, and Van der Waals bonds, are also disrupted. Detergents such as SDS and heat treatment can disrupt all non-covalent interactions. Covalent bonds such as peptide-bound (N-C) and disulfide bonds (S-S) cannot be altered by these treatments. Proteins having S-S bonds require reducing agents such as DTT to disrupt this bond. The peptide bond remains undisrupted. So, unfolded proteins would be linearized and have peptide bonds in their primary structure.

Because unfolded proteins would have hydrophobic surfaces exposed and available, bonds are disrupted, so more charge states can be generated, resulting in more m/z peaks with high charge values (z). Thus, m/z values are lower due to high z, and the peak distribution follows a bell shape. In the folded state, fewer charge states can be generated due to buried sites. The peaks' m/z values are higher due to low z values, and the peak distribution is unstructured.

The electrospray ionization process adds protons to the protein. Protonation of basic residues, Lys, Arg, and His, should occur. In the native folded state, buried basic residues are not available for protonation; thus, charge state generation is reduced. This gives away a pattern, the peak distribution, that can be used as an assessment tool for the state of the protein during mass spec measurements.
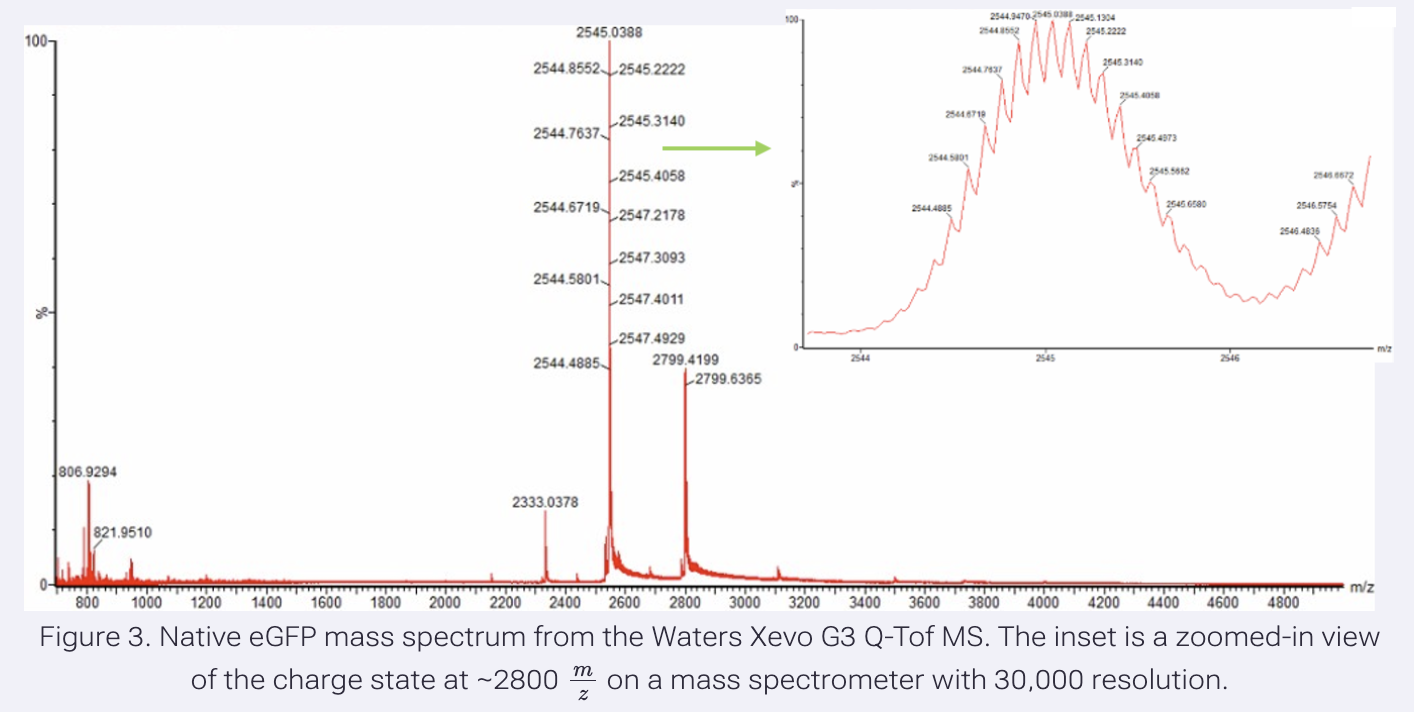
- Zooming into the native mass spectrum of eGFP from the Waters Xevo G3 QTof MS (see Figure 3), can you discern the charge state of the peak at ~2800 m/z? What is the charge state? How can you tell?
Homework: Waters Part III - Peptide Mapping - primary structure
We will digest the eGFP protein standard into peptides using trypsin (an enzyme that selectively cleaves the peptide bond after Lysine (K) and Arginine (R) residues. The resulting peptides will be analyzed on the Waters BioAccord LC-MS to measure their molecular weights and fragmented to confirm the amino acid sequence within each peptide – generating a “peptide map”. This process is used to confirm the primary structure of the protein.
There are a variety of tools available online to calculate protein molecular weight and predict a list of peptides generated from a tryptic digest. We will be using tools within the online resource Expasy (the bioinformatics resource portal of the Swiss Institute of Bioinformatics (SIB)) to predict a list of tryptic peptides from eGFP.
- How many Lysines (K) and Arginines (R) are in eGFP? Please circle or highlight them in the eGFP sequence given in Waters Part I question 1 above. (Note: adding the sequence to Benchling as an amino acid file and clicking biochemical properties tab will show you a count for each amino acid).
Results:
In the eGFP amino acid sequence (Part I, question 1), the frequencies of:
Lysine: 20
Arginine: 6
MVSKGEELFTGVVPILVELDGDVNGHKFSVSGEGEGDATYGKLTLKFICTTGKLPVPWPTLVTTLTYGVQCFSRYPDHMKQHDFFKSAMPEGYVQERTIFFKDDGNYKTRAEVKFEGDTLVNRIELKGIDFKEDGNILGHKLEYNYNSHNVYIMADKQKNGIKVNFKIRHNIEDGSVQLADHYQQNTPIGDGPVLLPDNHYLSTQSALSKDPNEKRDHMVLLEFVTAAGITLGMDELYKLEHHHHHH
- How many peptides will be generated from tryptic digestion of eGFP?
Navigate to https://web.expasy.org/peptide_mass/
Copy/paste the sequence above into the input box in the PeptideMass tool to generate expected list of peptides.
Apply relevant parameters to predict peptides from eGFP.
Click “Perform the Cleavage” button in the PeptideMass tool and report the number of peptides generated when using trypsin to perform the digest.
Results:
19 peptides would be generated after a trypsin digestion.
Below are the parameters applied in the peptide generation tool:
Cysteine and methionine modifications: none
Mass calculation: monoisotropic
Enzyme: Trypsin
allow ‘0’ missed cleavages
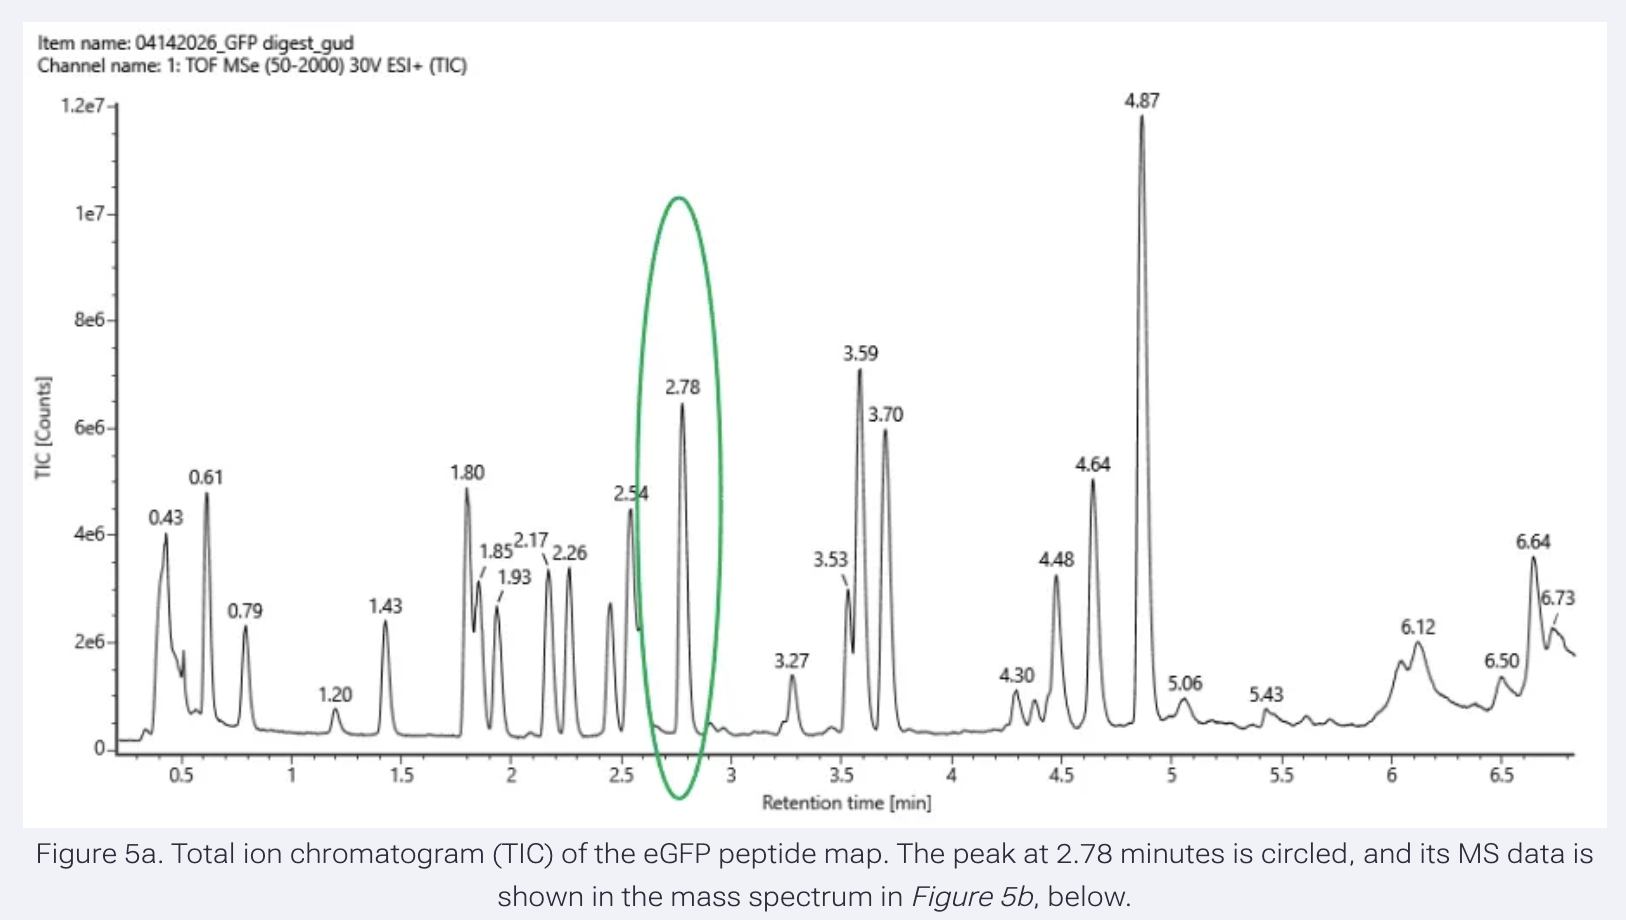
- Based on the LC-MS data for the Peptide Map data generated in lab (please use Figure 5a as a reference) how many chromatographic peaks do you see in the eGFP peptide map between 0.5 and 6 minutes? You may count all peaks that are >10% relative abundance.
Results:
In Figure 5a, the TIC value of the highest peak (4.87 retention time) is 1.2e7 (12,000,000 ion counts).
This sets the upper limit, 100%.
The corresponding TIC value for a 10% threshold would be 1.2e6 (1,200,000 counts).
I have counted peaks above 1.2e6 TIC: 19
- Assuming all the peaks are peptides, does the number of peaks match the number of peptides predicted from question 2 above? Are there more peaks in the chromatogram or fewer?
Results:
19 peaks match the predicted peptide fragments generated by the trypsin digestion.
There are more peaks in the chromatogram, but they are below the 10% threshold value.
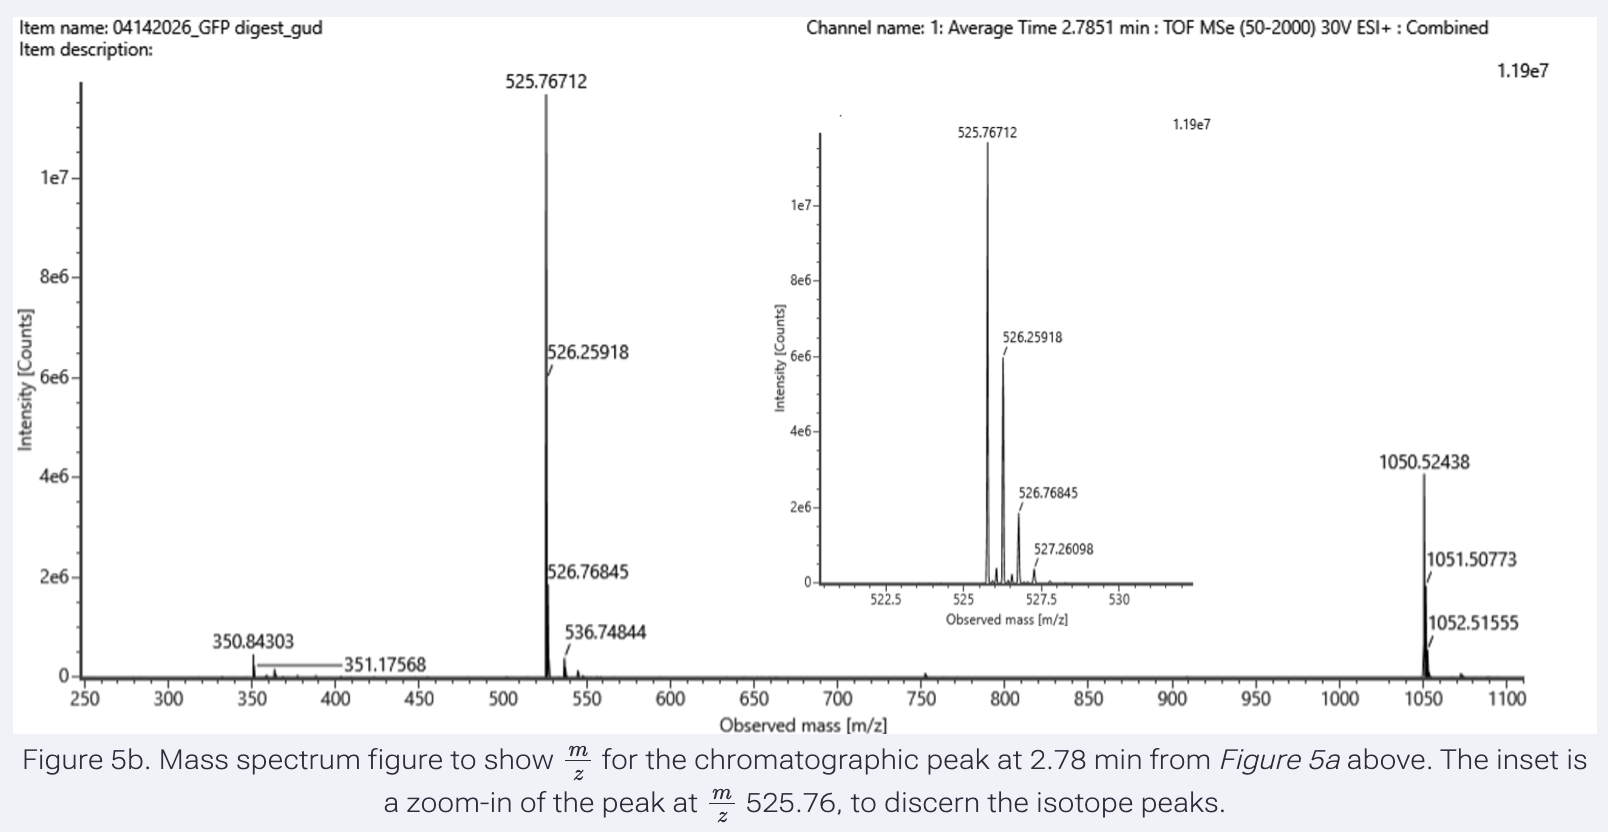
- Identify the mass-to-charge (m/z) of the peptide shown in Figure 5b. What is the charge (z) of the most abundant charge state of the peptide (use the separation of the isotopes to determine the charge state)? Calculate the mass of the singly charged form of the peptide ([M+H]+) based on its m/z and z.
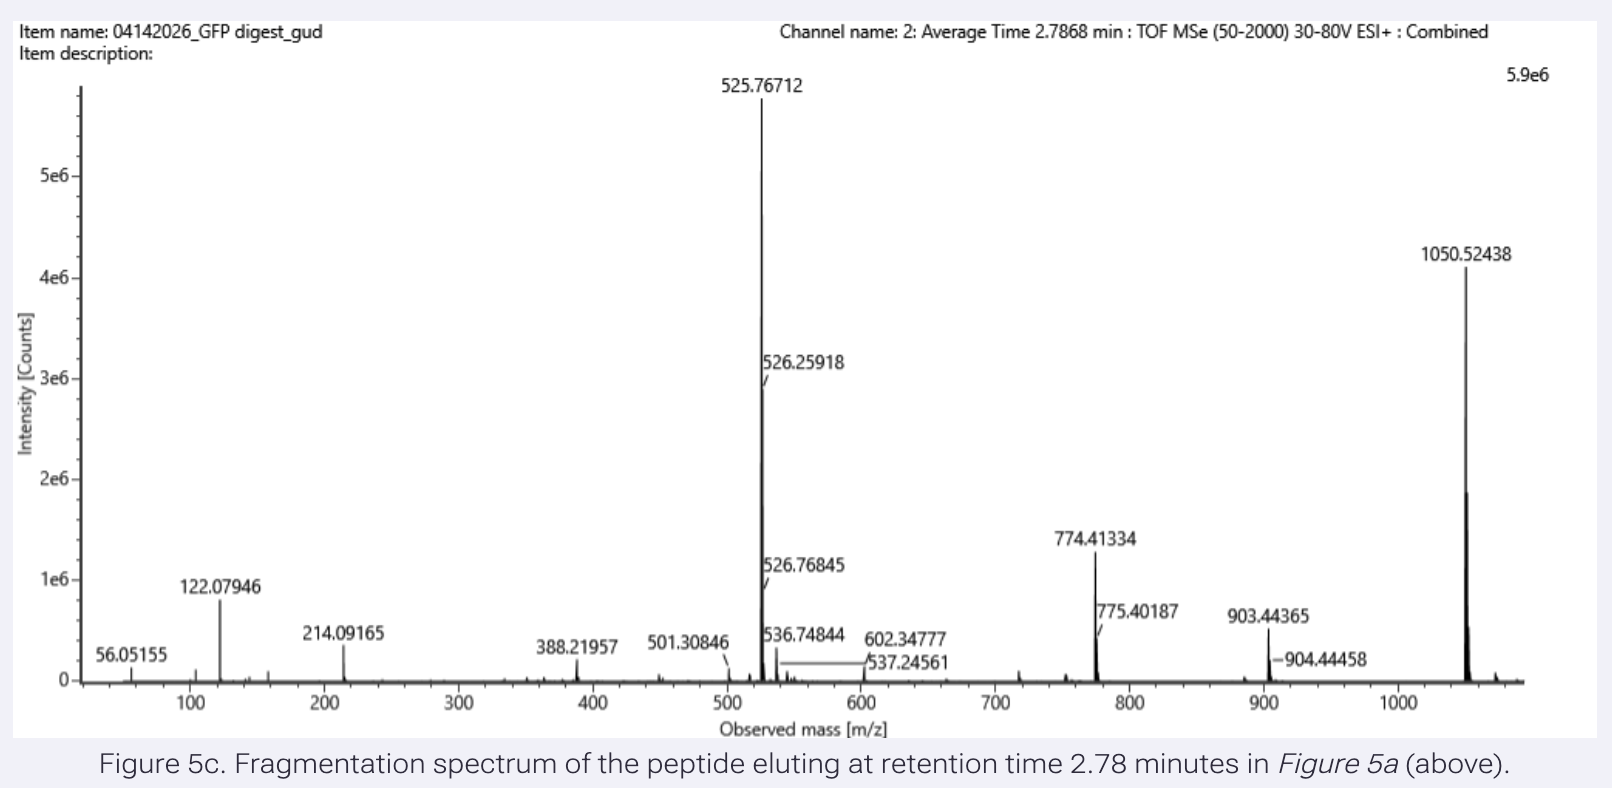
Results:
The most abundant isotope peak: 525.76712

To calculate charge state, I used the following peaks:

peak 1 m/z: 525.76712
peak 2 m/z: 526.25918

We need to apply the formula, z = 1 / Δ(m/z)

There is always a mixture of 12C and 13C isotopes in any given peptide, with 12C being the most abundant.

Isotopes differ in mass by 1 Da. But the peptides with different isotopes will have the same charge.

So, charge state is the difference in (m/z) over a 1 Da difference in mass.

z = 1 / (526.25918 - 525.76712)
  = 1 / (0.49206)
  = 2.0322  (The most abundant peptide takes 2 protons.)

To find the mass for the most abundant peptide:

M = m/z x z - (z x 1.00728)
  = 525.76712 x 2 - (2 x 1.00728)
  = 1051.53424 - (2.01456)
  = 1049.51968 Da   (This is the neutral mass, which will not appear on the chromatogram.)

To calculate the singly charged form of the peptide:

[M+H]⁺ = M + H⁺
       = 1049.51968 + 1.00728
       = 1050.527 Da  (1-proton-charge version of the peptide, as seen in the graph, very far right.)
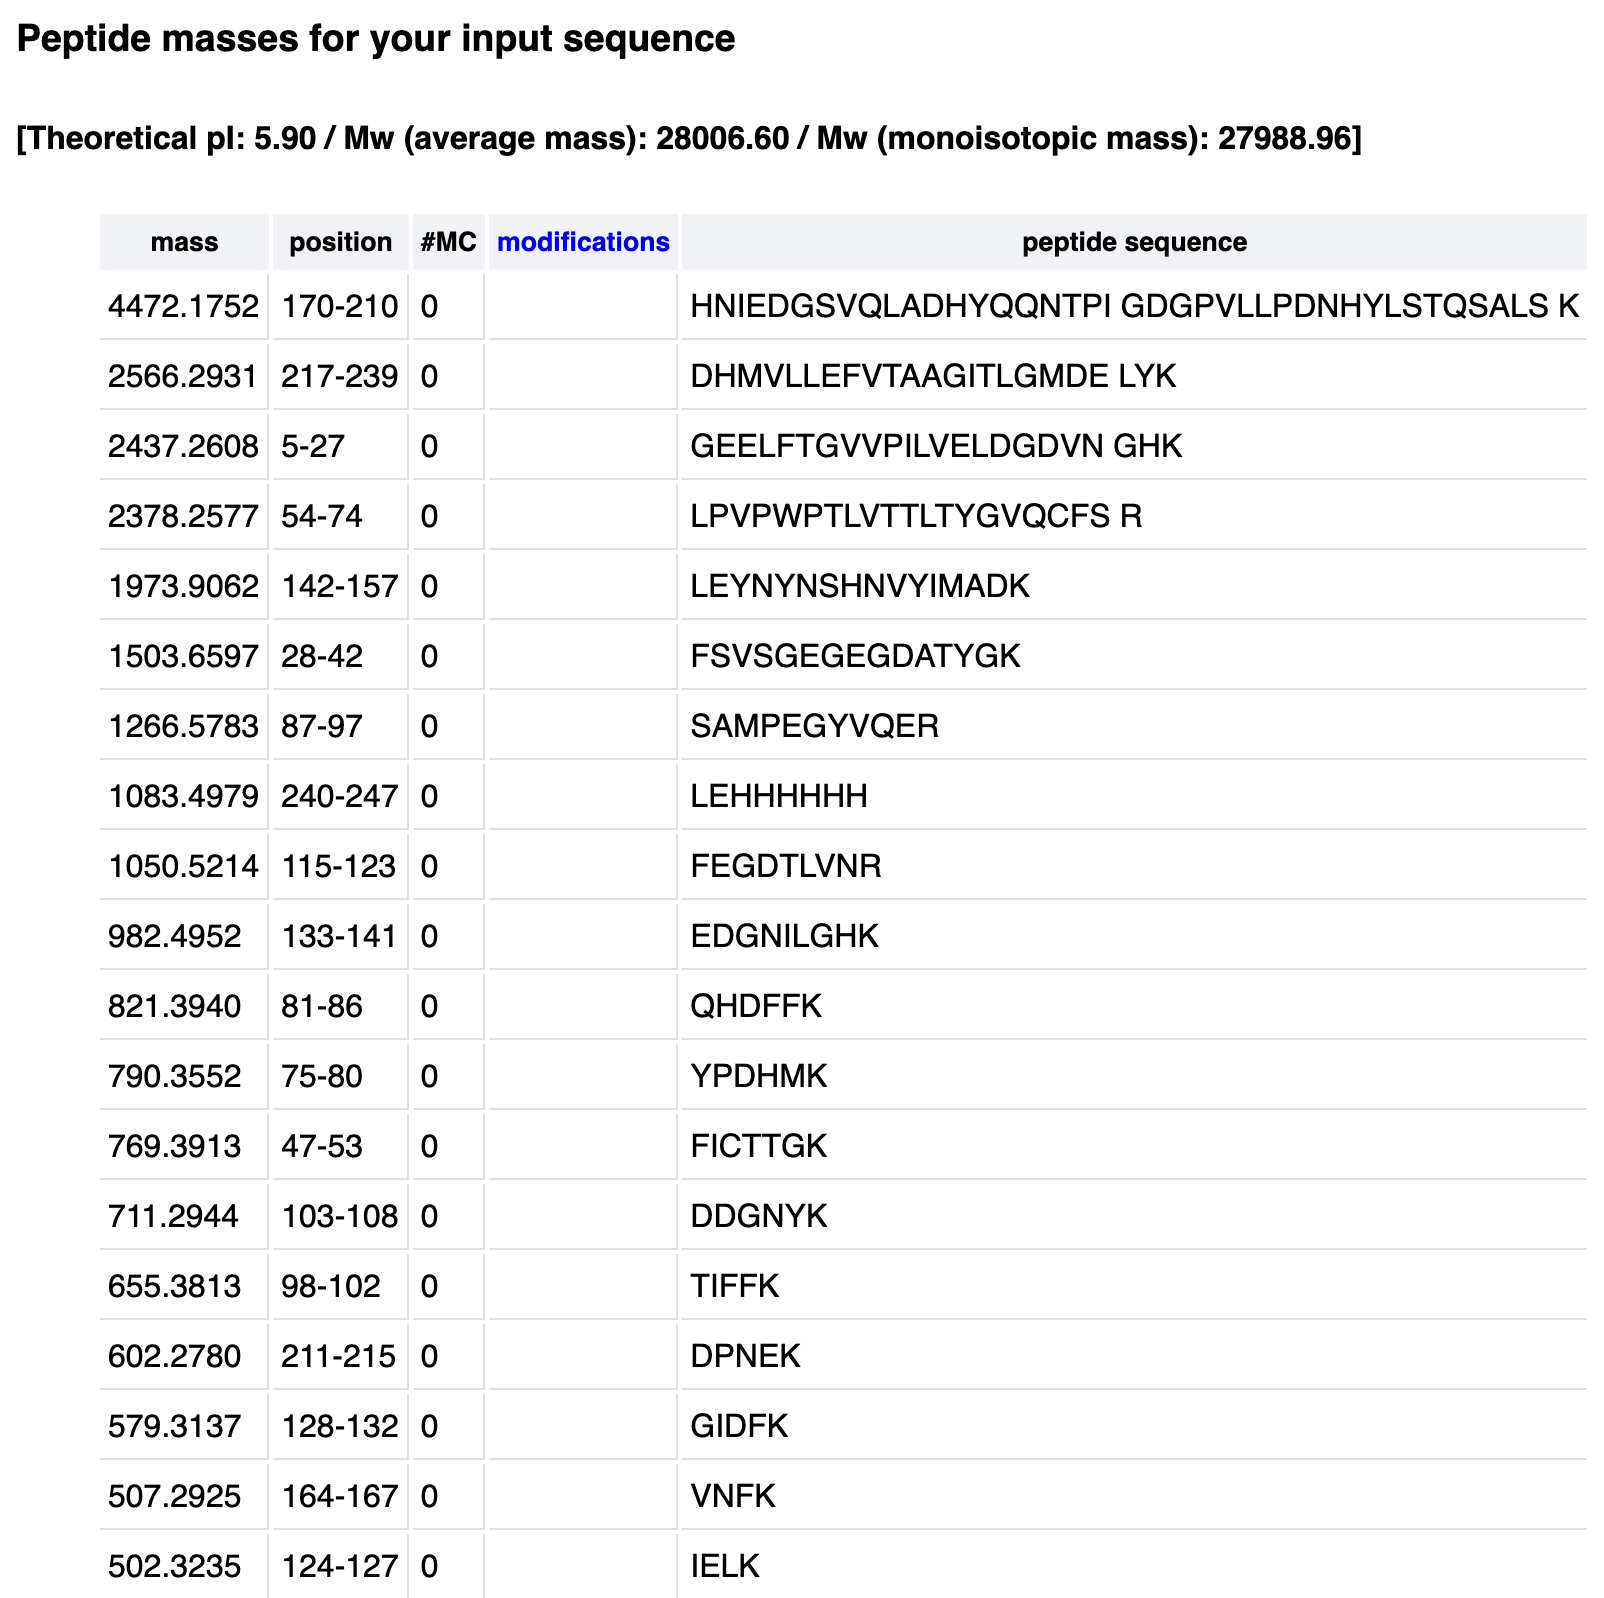
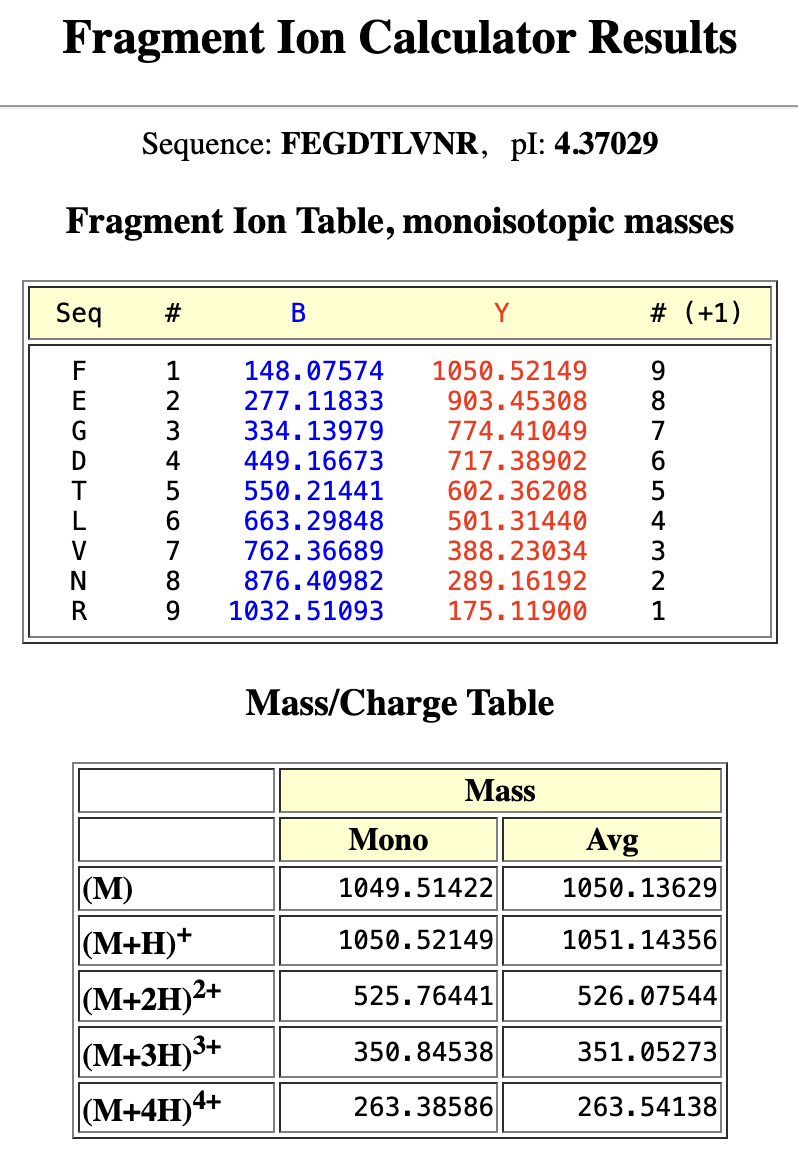
- Identify the peptide based on comparison to expected masses in the PeptideMass tool. What is the mass accuracy of measurement? Please calculate the error in ppm.
Results:
The PeptideMass tool reports masses from monoisotopic peptides. So, we need to compare masses from monoisotropic. As industry standards, we will need to use the mass from the singly charged version of the peptides (one proton added to the neutral mass), [M+H]⁺.

The monoisotropic peak of short peptides shows up on the far left with the lowest m/z value on the chromatogram. The peak with m/z 525.76712, [M+H]⁺, has a mass of 1050.527 Da and shows up very far right on the chromatogram.

The closest match in the PeptideMass-generated peptides is 1050.5214. The sequence: FEGDTLVNR

Accuracy = (MW exp - MW theory) / MW theory

         = (1050.527 - 1050.5214) / 1050.5214
         = (0.0056) / 1050.5214
         = 0.00000533
         = 0.00000533 x 1,000,000
         = 5.33 ppm
- What is the percentage of the sequence that is confirmed by peptide mapping? (see Figure 6)
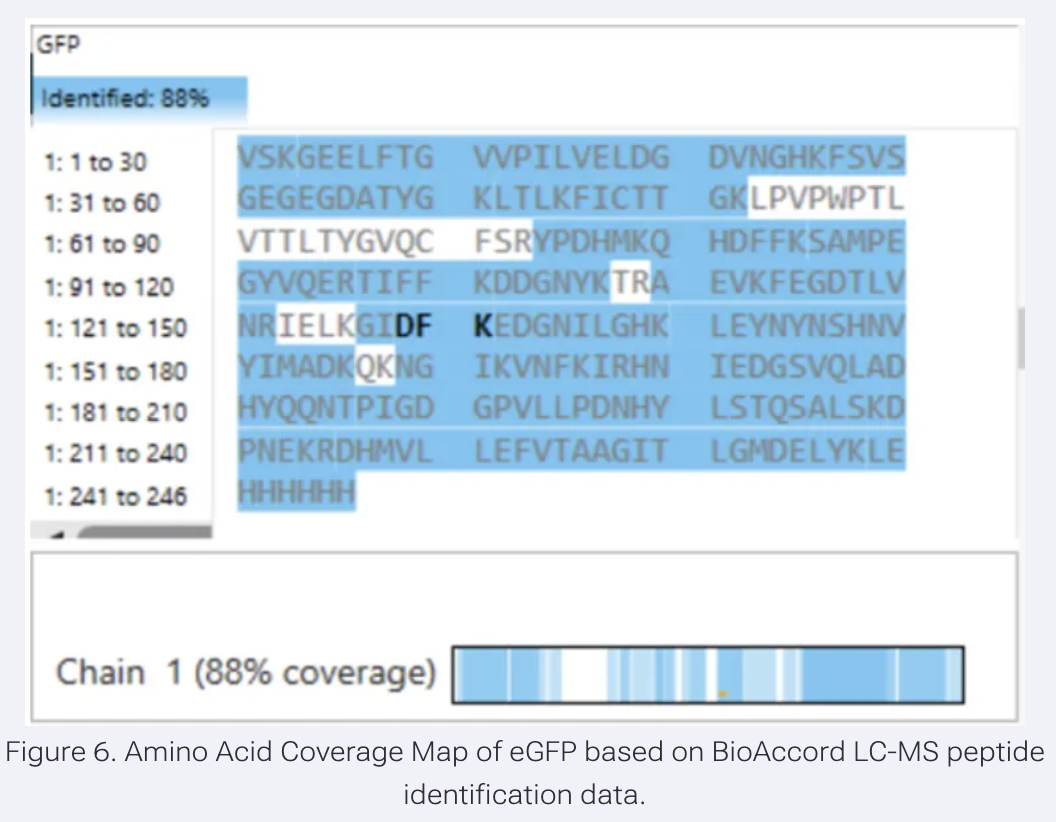
Results:
Based on Figure 6, as highlighted in blue, 88% of the amino acid sequence is identified. The remaining 12% was not.

Total amino acids: 246
88% identified: 216
12% not identified: 30
Bonus Peptide Map Questions
- Can you determine the peptide sequence for the peptide fragmentation spectrum shown in Figure 5c? (HINT: Use your results from Question 2 above to match the peptide molecular weight that is closest to that shown in Figure 5b. Copy and paste its sequence into this tool online to predict the fragmentation pattern based on its amino acid sequence: link. What is the sequence of the eGFP peptide that best matches the fragmentation spectrum in Figure 5c?
Results:
The peptide sequence is FEGDTLVNR, the closest match to the peptide molecular weight 1050.5214 as calculated for the isotope peak: 525.76712 in Figure 5b.

The best matches are found in the Y ions (C-terminal fragments):
Y9 1050.52149 (contains all 9 residues, FEGDTLVNR)
Y8 903.45308 (contains 8 residues, EGDTLVNR)
Y7 774.41049 (contains 7 residues, GDTLVNR)
Y5 602.36208 (contains 5 residues, TLVNR)
Y4 501.30846 (contains 4 residues, LVNR)
Y3 388.23034 (contains 3 residues, VNR)
- Does the peptide map data make sense, i.e. do the results indicate the protein is the eGFP standard? Why or why not? Consult with Figure 6, which depicts the % amino acid coverage of peptides positively identified using their calculated mass and fragmentation pattern.
Results:
Although the sequence has additions at the C-terminus (LE linker and 6x His), it cannot really be called the eGFP standard, but 88% identification suggests that this protein is eGFP.
Homework: Waters Part IV - Oligomers
We will determine Keyhole Limpet Hemocyanin (KLH)’s oligomeric states using charge detection mass spectrometry (CDMS). CDMS single-particle measurements of KLH allow us to make direct mass measurements to determine what oligomeric states (that is, how many protein subunits combine) are present in solution. Using the known masses of the polypeptide subunits (Table 1) for KLH, identify where the following oligomeric species are on the spectrum shown below from the CDMS (Figure 7):
7FU Decamer 8FU Didecamer 8FU 3-Decamer 8FU 4-Decamer
| Polypeptide Subunit Name | Subunit Mass |
|---|---|
| 7FU | 340 kDa |
| 8FU | 400 kDa |
Table 1: KLH Subunit Masses
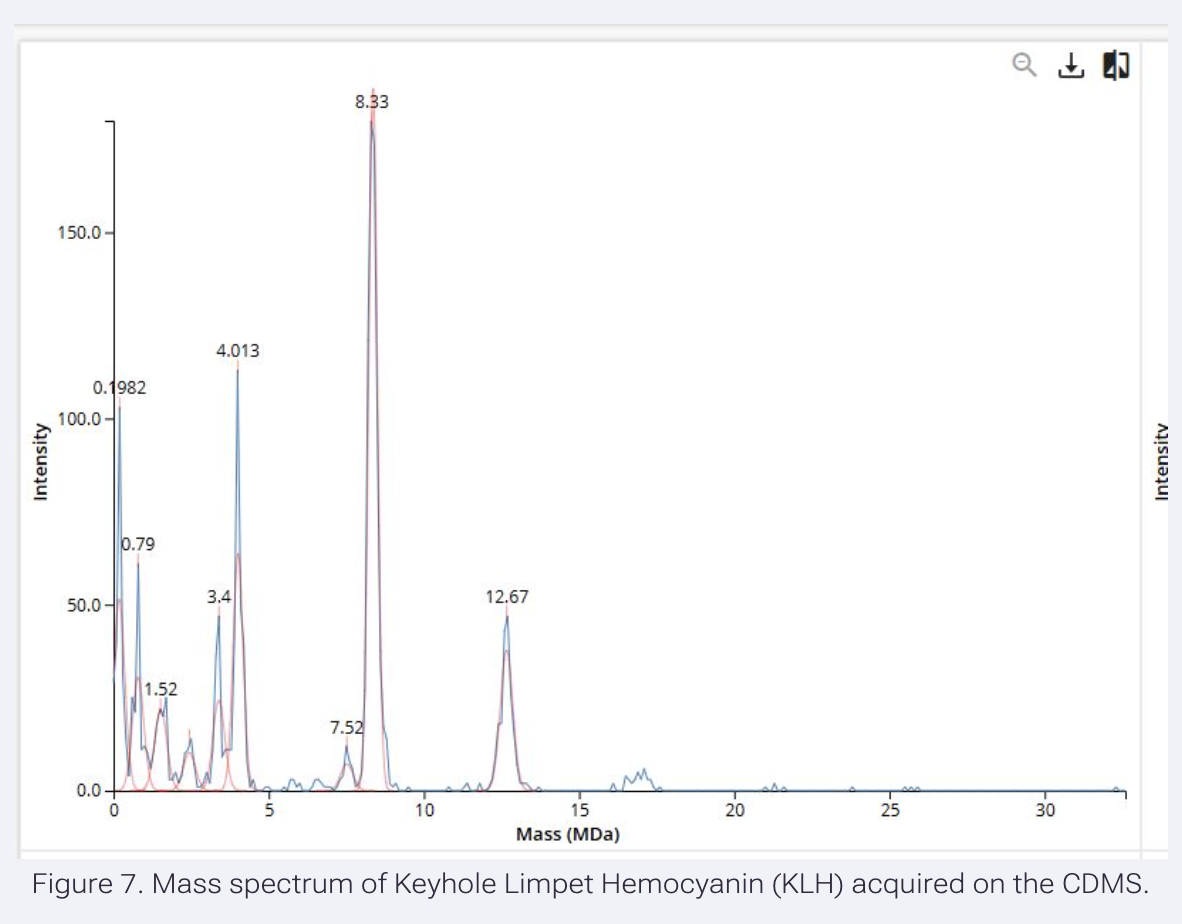
Results:
7FU;  Decamer 340 x 10 = 3400 kDa = 3.4 MDa

8FU;  Decamer 400 x 10 = 4000 kDa = 4 MDa
    Didecamer 400 x 20 = 8000 kDa = 8 MDa
    3-Decamer 400 x 30 = 12000 kDa = 12 MDa
    4-Decamer 400 x 40 = 16000 kDa = 16 MDa

Peaks found in Figure 7:

  3.4 MDa, possibly, corresponding to 7FU decamer
  8.33 MDa, possibly, corresponding to 8FU didecamer
  12.67 MDa, possibly, corresponding to 8FU 3-Decamer
no peak was found corresponding to 8FU 4-Decamer
Homework: Waters Part V - Did I make GFP?
Please fill out this table with the data you acquired from the lab work done at the Waters Immerse Lab in Cambridge, or else the data screenshots in this document if you were unable to have lab work done at Waters.
| Theoretical | Observed/measured on the Intact LC-MS | PPM Mass Error | |
|---|---|---|---|
| Molecular Weight )kDa) |