At the core of the project is the development of an improved bioprinter designed for two-color bacterial printing using two strains of Escherichia coli: a non-pathogenic, non-modified strain and a genetically transformed strain carrying a plasmid encoding the expression of a color marker. This approach enables the creation of visually distinguishable bacterial images and expands both the artistic and research potential of bioprinting.
Part 1: Benchling & In-silico Gel Art The process of simulation of Lambda genome Restriction Enzyme Digestion in Benchling: Final result: For Gel art pattern I used KpnI, SacI and SalI Restriction Enzyme Digestion. It is a pattern of wave.
Python Script for Opentrons Artwork My Python script which draws my design using the Opentrons. I used AI for adding my color parameters. I made a drawing of Totoro - the titular forest spirit from the 1988 Studio Ghibli animated film My Neighbor Totoro written and directed by Hayao Miyazaki.
On Ronan’s website:
Part A. Conceptual Questions 1. How many molecules of amino acids do you take with a piece of 500 grams of meat? (on average an amino acid is ~100 Daltons) Assumptions:
Lean meat (e.g., beef, chicken, fish) contains approximately 20% protein by weight (the remainder is water, fat, minerals, and glycogen). 500 g meat × 0.20 = 100 g of protein. Proteins are digested into individual amino acid monomers. Average molar mass of an amino acid residue ≈ 100 g/mol (as stated). Approximately 6 × 10²⁶ amino acid molecules are obtained from 500 g of meat.
Part A: SOD1 Binder Peptide Design (From Pranam) Part 1: Generate Binders with PepMLM the human SOD1 sequence (P00441): MATKAVCVLKGDGPVQGIINFEQKESNGPVKVWGSIKGLTEGLHGFHVHEFGDNTAGCTSAGPHFNPLSRKHGGPKDEERHVGDLGNVTADKDGVADVSIEDSVISLSGDHCIIGRTLVVHEKADDLGKGGNEESTKTGNAGSRLACGVIGIAQ
the A4V mutant SOD1 sequence: MATKVVCVLKGDGPVQGIINFEQKESNGPVKVWGSIKGLTEGLHGFHVHEFGDNTAGCTSAGPHFNPLSRKHGGPKDEERHVGDLGNVTADKDGVADVSIEDSVISLSGDHCIIGRTLVVHEKADDLGKGGNEESTKTGNAGSRLACGVIGIAQ
four peptides of length 12 amino acids conditioned on the mutant SOD1 sequence with the known SOD1-binding peptide FLYRWLPSRRGG for comparison:
Assignment: DNA Assembly 1. Components of Phusion High-Fidelity PCR Master Mix and their functions The Phusion High-Fidelity PCR Master Mix typically contains:
Phusion High-Fidelity DNA Polymerase
A thermostable DNA polymerase with 3’→5’ exonuclease proofreading activity, which significantly reduces the error rate during DNA amplification.
Assignment Part 1: Intracellular Artificial Neural Networks (IANNs) 1. What advantages do IANNs have over traditional genetic circuits, whose input/output behaviors are Boolean functions?
Intracellular Artificial Neural Networks (IANNs) provide several important advantages over traditional genetic circuits that operate using Boolean logic gates such as AND, OR, and NOT. Traditional genetic circuits typically generate binary outputs, where genes are either “ON” or “OFF.” In contrast, IANNs can process information in a continuous and weighted manner, similar to artificial neural networks used in computational machine learning.
Homework Part A: General and Lecturer-Specific Questions General homework questions 1. Explain the main advantages of cell-free protein synthesis over traditional in vivo methods, specifically in terms of flexibility and control over experimental variables. Name at least two cases where cell-free expression is more beneficial than cell production. Flexibility:
Homework: Final Project 1. Conjugation Frequency (Quantitative HGT Efficiency)
What is measured: The ratio of transconjugants to total recipient cells — the primary numerical output of the experiment. After overnight incubation on LB agar, cells are re-printed onto:
Plate A (no antibiotic) → counts all recipient colonies (pink) + donor (blue) Plate B (+ ampicillin 100 µg/mL) → only AmpR transconjugants survive in recipient zones Conjugation frequency = N(blue AmpR in recipient zone) / N(total recipient on Plate A)
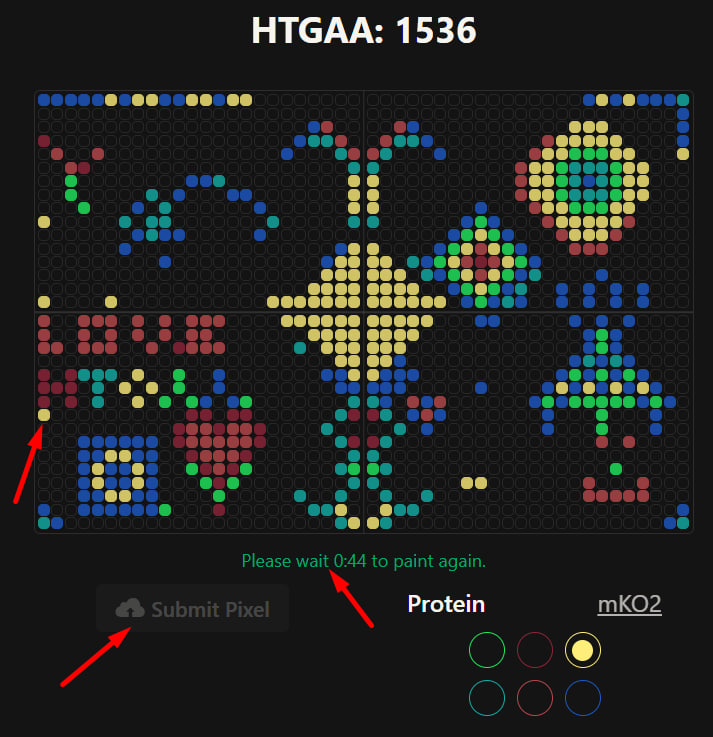
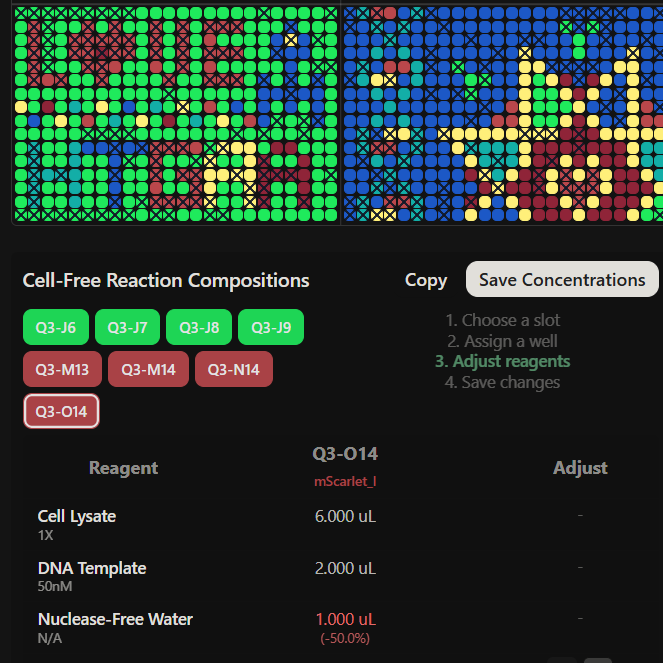
Part A: The 1,536 Pixel Artwork Canvas | Collective Artwork I contributed a one pixel on Q3 - H1 plate with mKO2 fluorescent protein, but it was overlapped by other contributions later. My involvement in the artwork was limited to placing a single pixel, which I used primarily to familiarize myself with the interface. I also initially assumed that the canvas had a limited number of available pixels relative to the large number of course participants. Nevertheless, I found the concept of a collaborative artwork compelling, and its implementation through a great interactive website was thoughtfully designed and inspiring. Also I found the timelapse feature particularly valuable, as it effectively illustrated both the temporal evolution of the image and the conceptual development of the artwork over time.
Subsections of Homework
Week 1 HW: Principles and Practices
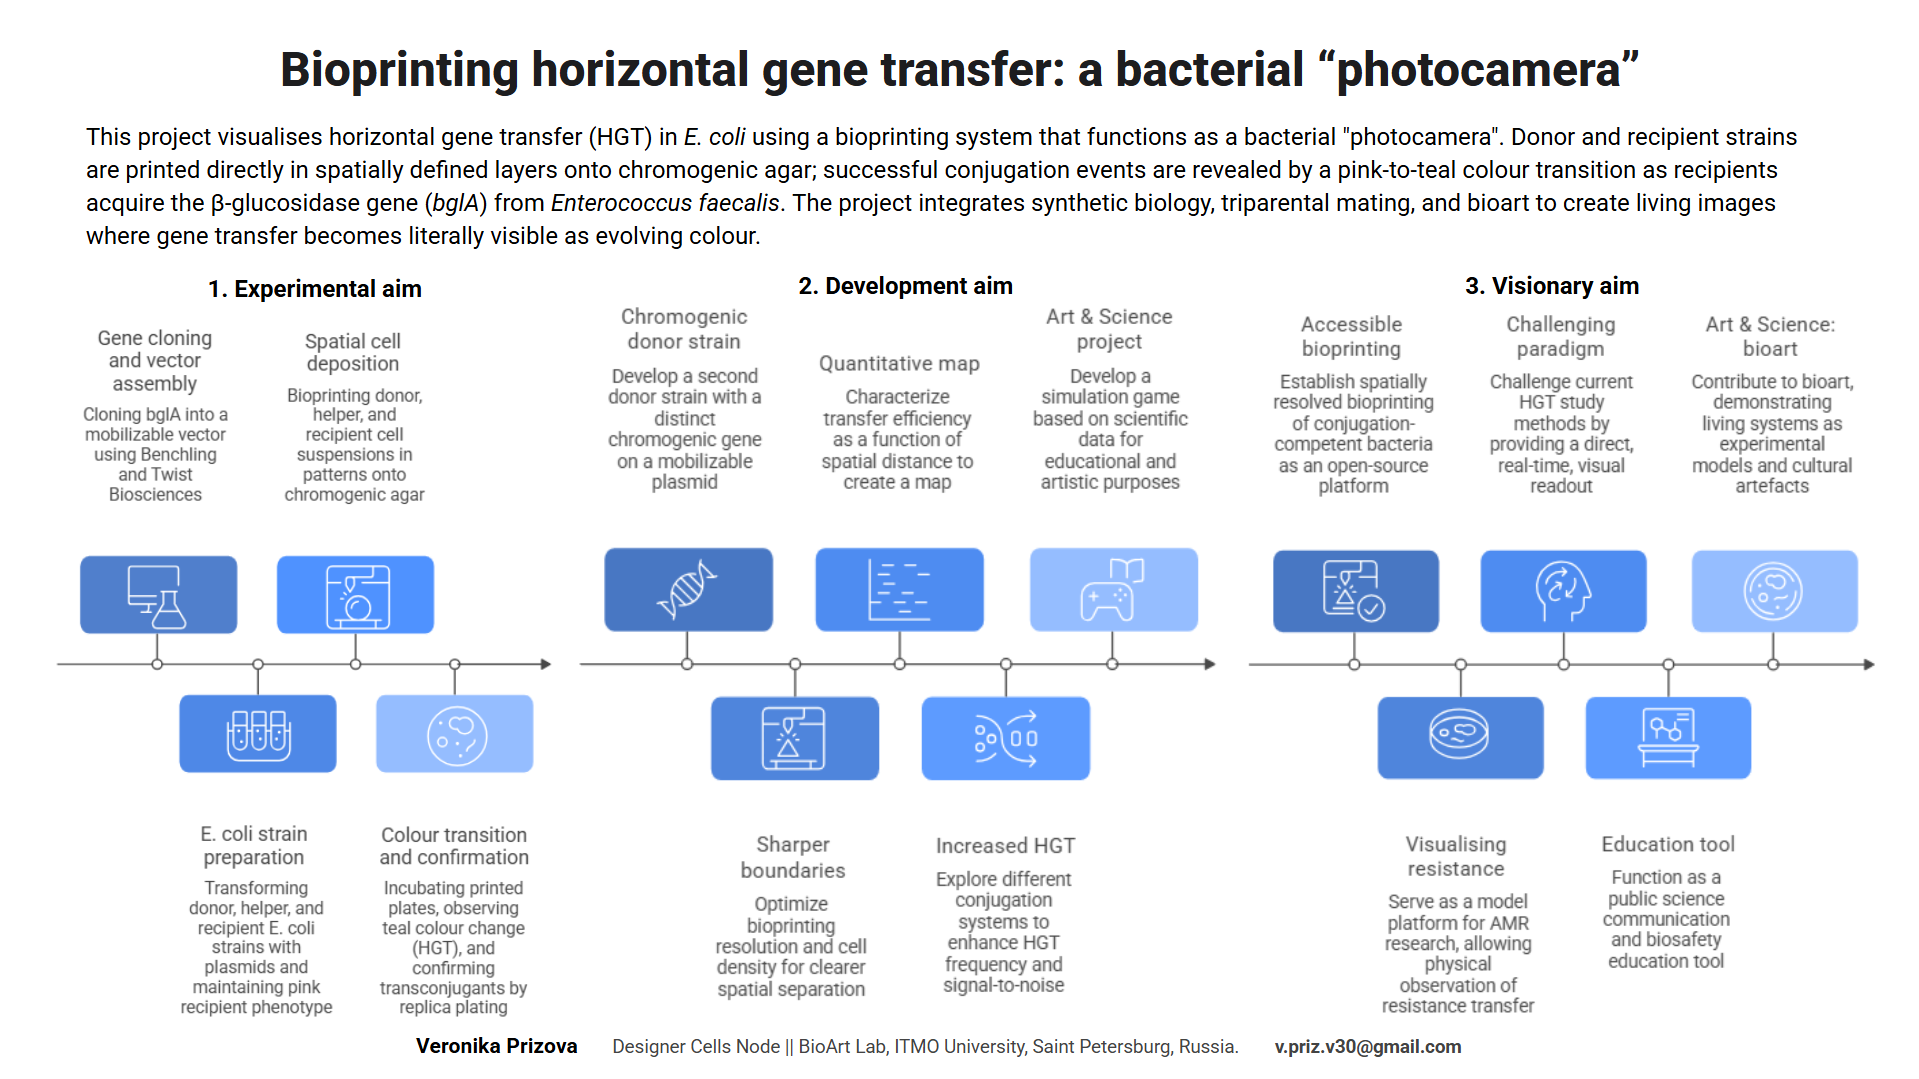
At the core of the project is the development of an improved bioprinter designed for two-color bacterial printing using two strains of Escherichia coli: a non-pathogenic, non-modified strain and a genetically transformed strain carrying a plasmid encoding the expression of a color marker. This approach enables the creation of visually distinguishable bacterial images and expands both the artistic and research potential of bioprinting.
The printing process is organized according to a principle conceptually similar to offset printing, where different “layers” or channels correspond to different bacterial suspensions. This makes it possible to consider the bioprinter both as a bioengineering tool and as an experimental platform for rethinking printing technologies. An important artistic dimension lies in the reinterpretation of bacteriological photography. What if documenting bacterial growth will be actively constructed and time-based compositioned, where biological processes function as both medium and subject? The project is based on research of authorship, temporality, and the limits in working with living matter.
The project will be integrated into the educational framework of the University and will be oriented toward an open and interdisciplinary format, as the developed technology, DIY solutions, and methodological approaches are intended to be used by students, researchers, artists, and participants in citizen science.
The project’s primary goal is to foster a constructive user community, uniting students, researchers, artists, and citizen science participants through an arts & science approach. The focus is on democratizing and improving bioprinting, providing accessible tools and documentation, and integrating the project into educational courses and workshops, alongside artistic contexts. This approach promotes education and engagement among a broad audience, fosters a culture of responsible use of living and genetically modified objects, and supports interdisciplinary interactions between science and art.
Purpose: In the local context, bioprinting training courses are limited to single-color cultures, and access to the technology for a wide range of participants is limited. This project proposes two-color bacterial printing using two E. coli strains (non-pathogenic and genetically modified with a colored marker), organized according to principles similar to offset printing. This will improve bioprinting technology and create visually distinguishable images. This allows for reproducible experiments and enables artistic interpretation of bacterial photography as a research phenomenon. The goal is to expand the educational, scientific, and artistic possibilities of bioprinting and make the technology accessible to students, artists, and citizen science participants.
Design:
DIY bioprinter working with two types of suspensions
Genetically modified and non-pathogenic E. coli strains, safe for use at the BSL-1 educational level
Safety and disposal protocols for working with live cultures
Software and digital data recording to control printing steps, seeding coordinates, and subsequent image analysis
Stakeholders: Faculty, laboratories, students, artists, and citizen science participants who must agree to and adhere to safety and ethical standards
Funding for materials, assembly of DIY devices, and organization of courses/workshops.
Assumptions: It’s important that participants follow safety protocols and not modify strains outside of an educational context or without properly created sterile conditions. Also, sometimes the artistic aspect (for example, bacterial photography) may be perceived as science visualization, but in reality, it’s about integrating science, technology, and art through educational and research tools. And creating a DIY device, using equipment and living objects/subjects, and conducting educational courses requires funding, which can be quite a challenge.
Risks of Failure & “Success“: Biological variability in strains can make two-color printing less reproducible. There’s also the possibility of contamination by other bacteria, as well as changes within the bacteria themselves. Technical failures in a DIY bioprinter or software can compromise the accuracy and repeatability of experiments. At the same time, natural biological variability is interesting from both a scientific and artistic perspective. Research into how to improve a DIY bioprinter or learn more about a living subject offers educational and creative value.
The most desirable actions are those aimed at broad audience engagement and democratization of technology. These activities have the greatest impact on the project’s success while simultaneously supporting the goals of citizen science, education, art, and science.
Homework Questions from Professor Jacobson:
1:106. The error rate decreases from 1:106 to 1:109, i.e. 3 thousand bp, there will be 3 thousand of these base pairs in the genome. Lead to irreversible mutations (base substitutions, insertions, or deletions). This affects the stability of the genome, causing hereditary diseases, cancer (oncogenic potential), and cellular aging.
There are DNA repare systems: MutS, MutH, and MutL among prokaryotes, MSH and MLH in eukaryotes.
For the average human protein, consisting of approximately 300-400 amino acids, there is a colossal, virtually infinite number of nucleotide coding (DNA) variants. Due to the degeneracy of the genetic code (64 codons for 20 amino acids), a single amino acid sequence can be encoded by (10^{50}-10^{100}) or more different DNA sequence variants.
In practice what are some of the reasons that all of these different codes don’t work to code for the protein of interest? There will be mutations and altered more complex proteins, their function will be lost. There are conservative domains providing mRNA and/or folding stability, some functional patterns, zones marking exons/introns, start/termination of translation etc. So some sequences won’t give chemically stable, functioning or translation apropriate proteins.
Homework Questions from Dr. LeProust:
Next Generation (Chip Based) Oligo Nucleotide Synthesis.
Yield decrease with further synthesis steps, lower fidelity + error accumulation, hairpin / dimers / cloggs formation.
Direct oligo synthesis is step-by-step base addition to the chain. With this technology, the yield of the full-length product decreases exponentially with each added base. Even if synthesize exact 2000 bp oligo, it would be hard to purify from, for instance, 1990 bp oligo by gel electrophoresis.
Homework Question from George Church:
Essential amino acids are 10 organic compounds (valine, leucine, isoleucine, lysine, methionine, threonine, tryptophan, phenylalanine, histidine, arginine) that are not synthesized in the human body and must be obtained from food for muscle growth, immunity and metabolism. There is pyrrolysine also, wich occurs only in some organisms. Lysine Contigency in “Jurassic Park” movie was presented as “engineered” lack of dinosaurs’ ability to produce lysine amed to tie them to the park therritory where they could get needed supplements.
Week 2 HW: DNA read, write and edit
Part 1: Benchling & In-silico Gel Art
The process of simulation of Lambda genome Restriction Enzyme Digestion in Benchling:
Final result:
For Gel art pattern I used KpnI, SacI and SalI Restriction Enzyme Digestion.
It is a pattern of wave.
Part 3: DNA Design Challenge
I chose the RecA protein from Enterococcus faecalis. I chose this protein because I am interested in horizontal gene transfer in bacteria. RecA is one of the key proteins involved in homologous recombination and DNA repair, which are important processes during horizontal gene transfer and bacterial adaptation. Studying RecA helps understand how bacteria exchange genetic material and acquire new traits such as antibiotic resistance.
3.1. Choose your protein
The protein sequence was obtained from UniProt.
Protein: RecA from Enterococcus faecalis
sp|P42444|RECA_ENTFA Protein RecA OS=Enterococcus faecalis (strain ATCC 700802 / V583) OX=226185 GN=recA PE=3 SV=2
3.2. Reverse Translation: Protein Sequence to DNA Sequence
To obtain the nucleotide sequence corresponding to the RecA protein, I used the reverse translation tool from Sequence Manipulation Suite. Reverse translation converts an amino acid sequence into a possible DNA sequence based on the genetic code.
Codon optimization is important because different organisms prefer different codons to encode the same amino acid. Although the genetic code is universal, some codons are used more frequently in certain species. Using preferred codons improves translation efficiency, increases protein expression, and can improve protein stability.
I chose to optimize the RecA gene for Escherichia coli because E. coli is one of the most commonly used organisms for recombinant protein production. It grows quickly, is inexpensive to culture, and has many well-established molecular biology tools available. Since RecA is a bacterial protein and is not highly toxic, expression in E. coli is relatively straightforward.
For protein expression, I would use the plasmid pET-28a(+). To insert the optimized RecA gene into the plasmid, restriction enzymes can be used. A suitable pair of restriction enzymes would be NdeI and XhoI. These enzymes are commonly used with pET-28a(+) because their recognition sites are present in the plasmid multiple cloning site and allow directional cloning of the gene insert. Directional cloning ensures that the gene is inserted in the correct orientation for expression. I used Codon Optimization Tool from Vector Builder.
After codon optimization, the DNA sequence encoding RecA can be synthesized and inserted into the pET-28a(+) plasmid. The recombinant plasmid is then introduced into Escherichia coli cells through transformation. Because the pET-28a(+) vector can add a His-tag to the protein, the expressed RecA protein could later be purified using nickel affinity chromatography.
Expression in E. coli is a practical approach because bacterial systems are simple, cost-effective, and most practical method because RecA is a non-toxic bacterial protein and bacterial expression systems are highly optimized for this type of protein production.
Part 4: Prepare a Twist DNA Synthesis Order
4.2. Build Your DNA Insert Sequence
In Benchling I uploaded a sequence of RecA gene featured with Promoter, RBS, Start Codon, Coding Sequence, His Tag, Stop Codon, Terminator.
I used pTwist Amp High Copy as a Twist cloning vector because I require constant expression of the RecA gene for my experiment.
Benchling
Part 5: DNA Read/Write/Edit
5.1 DNA Read
(i) What DNA would you want to sequence (e.g., read) and why?
In the context of my idea project, I would sequence DNA from putative transconjugant E. coli colonies that appear blue in the recipient-printed zones on chromogenic agar (Plate B + ampicillin).
Why:
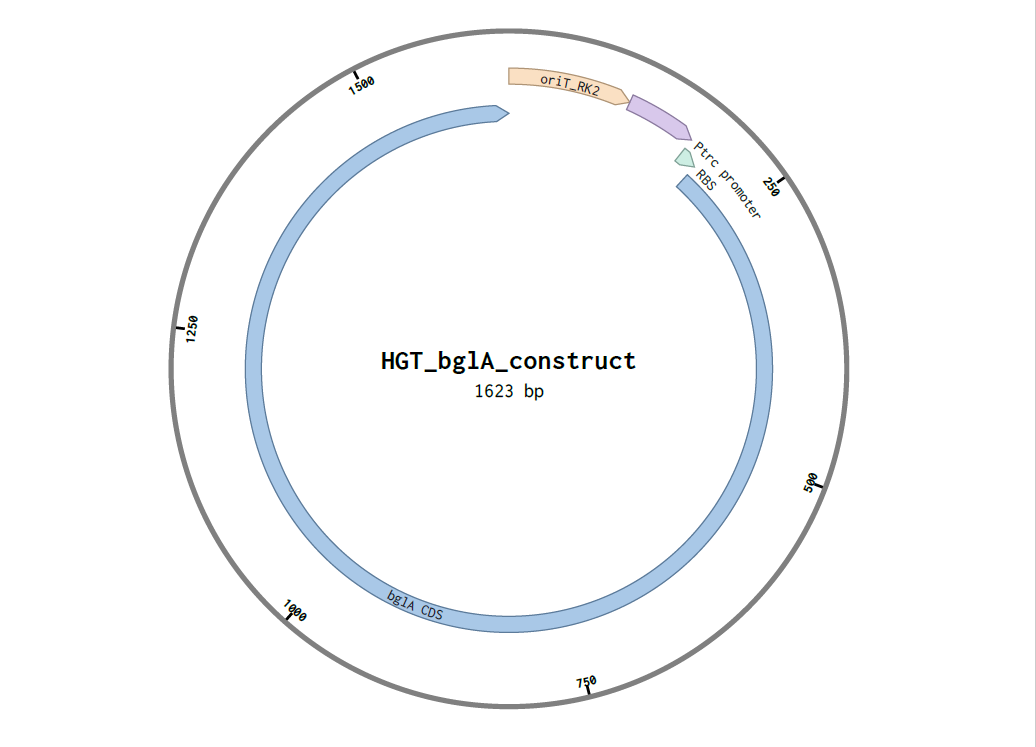
Confirm true horizontal gene transfer (conjugation): verify that recipient cells acquired the mobilizable plasmid carrying oriT_RK2–Ptrc–RBS–bglA, rather than the blue phenotype being caused by donor contamination, spontaneous mutations, or unexpected chromogenic substrate metabolism.
Verify construct integrity after transfer: check whether bglA, Ptrc, BBa_B0034, and oriT_RK2 are intact (no deletions/rearrangements), since plasmids can mutate or recombine.
Map spatial HGT patterns: sequence colonies sampled from different printed coordinates (e.g., overlap boundary vs center) to see whether transfer frequency or plasmid variants correlate with spatial proximity and incubation conditions.
(ii) What technology or technologies would you use to perform sequencing on your DNA and why?
I would use a two-tier approach:
Sanger sequencing (targeted validation)
Fast and cost-effective for confirming a limited number of colonies and key regions (bglA + junctions).
High per-base accuracy and straightforward interpretation.
Appropriate when sequencing many colonies across multiple printed locations.
High accuracy and depth for detecting low-frequency variants.
Oxford Nanopore long-read sequencing
Useful for reading the entire plasmid in one/few long reads and detecting structural rearrangements.
Is your method first-, second- or third-generation or other? How so?
Sanger sequencing:first-generation (chain-termination; low throughput; ~700–900 bp reads with high accuracy).
Illumina:second-generation (massively parallel sequencing-by-synthesis with cluster amplification; short reads).
Oxford Nanopore:third-generation (single-molecule, real-time, long reads; PCR not mandatory).
What is your input? How do you prepare your input (e.g. fragmentation, adapter ligation, PCR)? List the essential steps.
Input:
Colonies from chromogenic plates:
Putative transconjugants: blue colonies in recipient zones on Plate B (+ ampicillin)
Controls: donor strain, original recipient strain, and ideally a “no-helper” negative control mating
Essential preparation steps (by method):
A) Sanger (PCR + sequencing)
Pick colony → short liquid culture (or colony PCR).
DNA extraction (plasmid miniprep or crude lysate).
PCR amplify:
bglA internal region (presence/identity)
junctions (e.g., oriT→Ptrc, Ptrc→RBS, RBS→bglA) to confirm correct order/integrity
PCR cleanup.
Sanger sequencing.
B) Illumina (amplicon-seq or plasmid-enriched sequencing)
DNA extraction (preferably plasmid-enriched if focusing on the construct).
Either:
PCR amplify target regions (amplicon sequencing), or
Fragment DNA for whole-plasmid/whole-genome sequencing.
End repair / A-tailing (kit-dependent).
Adapter ligation + indexing (barcodes).
PCR enrichment (often used).
Sequencing.
C) Nanopore (whole plasmid)
Extract high-quality DNA with minimal shearing.
End repair (kit-dependent).
Ligate nanopore adapters with motor protein.
Load onto flow cell.
What are the essential steps of your chosen sequencing technology, how does it decode the bases of your DNA sample (base calling)?
Sanger: ddNTP incorporation terminates extension; fragments are separated by capillary electrophoresis; fluorescence color determines the terminal base.
Illumina: sequencing-by-synthesis with fluorescent reversible terminators; imaging each cycle; base calling from image intensities.
Nanopore: DNA passes through a pore and modulates ionic current; neural-network base calling converts current traces (“squiggles”) into bases.
What is the output of your chosen sequencing technology?
Sanger: chromatograms (.ab1) + base-called sequences for each amplicon.
Illumina:FASTQ short reads (e.g., 2×150 bp) with Phred quality scores.
Nanopore:FASTQ long reads (plus raw signal files such as POD5/FAST5, workflow-dependent).
5.2 DNA Write
(i) What DNA would you want to synthesize (e.g., write) and why?
I would synthesize the mobilizable bglA expression cassette that generates the blue phenotype after conjugation:
oriT_RK2 (mobilization origin; enables plasmid transfer using RK2 machinery supplied by pRK2013 in trans)
Ptrc promoter (strong E. coli-compatible promoter for robust expression)
bglA CDS from Enterococcus faecalis (β-glucosidase intended to produce a blue chromogenic phenotype)
Why: this DNA encodes the key “sensor output” of the system: recipient cells become blue only after acquiring bglA via HGT, enabling spatial visualization of conjugation.
(ii) What technology or technologies would you use to perform this DNA synthesis and why?
I would use:
Phosphoramidite-based chemical DNA synthesis (commercial gene synthesis / oligo pools)
Assembly methods such as Gibson Assembly or Golden Gate Assembly
Why:
Phosphoramidite chemistry is the standard for accurate, scalable oligo/gene-fragment synthesis.
Gibson/Golden Gate support modular assembly of oriT, promoter, RBS, and CDS, and enable rapid variant construction.
1) What are the essential steps of your chosen synthesis methods?
Oligo/gene fragment synthesis (phosphoramidite cycles).
Assembly (Gibson/Golden Gate) into the plasmid backbone.
Transformation into E. coli and clone picking.
Sequence verification (Sanger/Illumina) of bglA and junctions.
Functional validation on chromogenic agar.
2) What are the limitations of your synthesis method (if any) in terms of speed, accuracy, scalability?
Length limits: single oligos are short; longer constructs require multi-fragment assembly.
Error accumulation: synthesis errors accumulate with length; verification and clone screening are required.
Sequence-dependent difficulty: repeats, strong secondary structures, and extreme GC can reduce synthesis/assembly success.
Speed: outsourcing is fast but still usually days–weeks including cloning and verification.
Scalability bottleneck: generating variants is feasible; the limiting step becomes screening + validation (though the color phenotype helps throughput).
5.3 DNA Edit
(i) What DNA would you want to edit and why?
To improve the robustness and interpretability of the HGT, I would edit DNA in the recipient strain and/or the plasmid system.
Examples of useful edits:
Recipient genome edits to reduce background coloration or off-pathway metabolism on chromogenic media, making blue strictly dependent on bglA acquisition and expression.
Regulatory tuning edits (promoter/RBS fine-tuning) to calibrate the onset and intensity of the blue signal and improve spatial resolution.
Plasmid stability edits (e.g., removing recombinogenic sequences or adding stability features) to reduce plasmid loss and signal variability.
Why: the project’s readout is phenotypic (color), so improving specificity and stability directly strengthens conclusions about HGT frequency and spatial dynamics.
(ii) What technology or technologies would you use to perform these DNA edits and why?
I would use CRISPR-based editing in E. coli:
CRISPR-Cas9 + recombineering (λ-Red) + donor DNA for precise insertions/replacements, and/or
Base editors for targeted point mutations in promoters/RBS without introducing double-strand breaks.
Why:
Cas9 + recombineering is well established for precise bacterial genome engineering.
Base editing is ideal for fine-tuning regulatory elements controlling bglA expression.
How does your technology of choice edit DNA? What are the essential steps?
CRISPR-Cas9 + donor DNA (with recombineering):
Design gRNA targeting the locus of interest (adjacent to a PAM).
Deliver Cas9 + gRNA (typically via plasmid expression).
Provide a donor DNA template with desired edits flanked by homology arms.
Cas9 creates a double-strand break at the target site.
λ-Red recombination integrates the donor sequence → precise edit.
Cure editing plasmids if needed and verify.
Base editing:
Design gRNA near the base(s) to be changed.
Express nCas9/dCas9 fused to a deaminase.
Targeted binding induces base conversion (C→T or A→G) within an editing window.
Screen and sequence-verify edited clones.
What preparation do you need to do (e.g. design steps) and what is the input for the editing?
Donor DNA template (ssDNA/dsDNA) for precise edits
Editing plasmids and recombineering functions (λ-Red)
Competent E. coli cells (recipient/donor as appropriate)
What are the limitations of your editing methods (if any) in terms of efficiency or precision?
Variable efficiency depending on locus, strain, and delivery; requires optimization.
DSB toxicity/lethality if repair/recombination is inefficient.
Off-target edits are possible and require sequencing verification.
Base-editing constraints: depends on PAM availability and the editor’s window/context; not all bases are targetable.
Plasmid/genome context issues: copy number, recombination, and selection dynamics can complicate stable outcomes.
Week 3 HW: Lab Automation
Python Script for Opentrons Artwork
My Python script which draws my design using the Opentrons. I used AI for adding my color parameters.
I made a drawing of Totoro - the titular forest spirit from the 1988 Studio Ghibli animated film My Neighbor Totoro written and directed by Hayao Miyazaki.
On Ronan’s website:
In Google colab Execute Simulation:
Printed Totoro by Opentrons liquid handling robot in Designer Cells Lab Node:
Not everything printed successfully due to the size of the points, but the general pattern is still readable.
Post-Lab Questions
1.
del Olmo Lianes et al. (2023) developed COPICK, an upgrade to the Opentrons OT-2 that automates bacterial colony screening directly on Petri dishes. By mounting a camera on the robot deck, the system captures images of agar plates and selects colonies based on size, colour, and fluorescence criteria, achieving a picking rate of ~240 colonies/hour with 82% performance on E. coli. This paper is directly relevant to my final project, which also relies on spatial bacterial patterning and colour-based readout of gene transfer events on chromogenic agar plates using the Opentrons OT-2.
Reference: del Olmo Lianes I. et al. (2023) Front. Bioeng. Biotechnol. 11:1202836. Can read here.
2.
For my final project, the Opentrons OT-2 serves as a precision bioprinter, depositing 10 µL spots of three bacterial cell suspensions (donor, helper, and recipient, each at OD₆₀₀ = 0.6) in defined spatial patterns directly onto agar plates. The robot runs three sequential deposition steps using a single Python script with fixed XY coordinates:
Deposit donor, helper, and recipient suspensions in defined zones onto plain LB agar (no antibiotics) → overnight incubation at 37°C for triparental mating
Reprint the identical pattern onto CHROMagar without antibiotic (Plate A — bioart image: pink + blue simultaneously)
Reprint the identical pattern onto CHROMagar + ampicillin 100 µg/mL (Plate B — scientific confirmation: blue in recipient zones = confirmed HGT)
The key advantage of Opentrons over manual pipetting is spatial reproducibility: the same XY coordinates are used across all three plates, ensuring that colour patterns can be directly compared between the bioart plate and the confirmation plate. This spatial precision is essential for the “photocamera” concept — the printed image must remain consistent across experimental replicates.
Final Project Ideas
1 idea
2 idea
3 idea
Week 4 HW: Protein design part I
Part A. Conceptual Questions
1. How many molecules of amino acids do you take with a piece of 500 grams of meat? (on average an amino acid is ~100 Daltons)
Assumptions:
Lean meat (e.g., beef, chicken, fish) contains approximately 20% protein by weight (the remainder is water, fat, minerals, and glycogen).
500 g meat × 0.20 = 100 g of protein.
Proteins are digested into individual amino acid monomers.
Average molar mass of an amino acid residue ≈ 100 g/mol (as stated).
Approximately 6 × 10²⁶ amino acid molecules are obtained from 500 g of meat.
2. Why do humans eat beef but do not become a cow, eat fish but do not become fish?
This is explained by the central dogma of molecular biology, digestion, and genetic isolation:
Digestion breaks down macromolecules:
Dietary proteins are hydrolyzed by proteases (pepsin, trypsin, chymotrypsin, peptidases) into individual amino acids and small peptides.
Nucleic acids (DNA/RNA) are degraded by nucleases into nucleotides and then further into nucleosides and bases.
Intact macromolecular information does not survive digestion.
Absorption yields building blocks, not genetic information:
Absorbed amino acids, sugars, nucleotides, and fatty acids enter a common metabolic pool.
These are reassembled into human proteins according to instructions encoded in the human genome, transcribed into human mRNA, and translated by human ribosomes.
No horizontal gene transfer from diet:
Eukaryotic cells lack mechanisms to incorporate foreign dietary DNA into the nuclear genome.
Even if intact DNA fragments reached intestinal cells, they would be degraded by DNases or excluded by chromatin and membrane barriers.
3. Why are there only 20 natural amino acids?
The canonical set of 20 proteinogenic amino acids (plus selenocysteine and pyrrolysine in some organisms) reflects an evolutionary and biochemical optimum:
Chemical diversity and functional sufficiency:
The 20 amino acids cover a wide range of chemical properties: hydrophobic, polar, charged (acidic/basic), aromatic, and conformationally constrained (proline).
This diversity is sufficient to fold proteins into stable structures and catalyze essentially all cellular reactions.
Genetic code constraints:
The genetic code maps 64 codons to amino acids and stop signals. Expanding the amino acid repertoire requires:
New aminoacyl-tRNA synthetases
Orthogonal tRNAs
Unambiguous codon assignments
Adding more amino acids increases translational errors and slows ribosomal elongation.
Historical contingency and error minimization:
Early life likely used a smaller subset (~10 amino acids).
The code expanded gradually and became “frozen” because the existing arrangement minimizes the phenotypic impact of point mutations (error minimization principle).
Further expansion offers diminishing returns relative to the evolutionary cost of maintaining additional biosynthetic pathways and quality control.
4. Can you make other non-natural amino acids? Design some new amino acids.
Three Rationally Designed Non-Natural Amino Acids:
Metal coordination: High-affinity binding to Fe²⁺, Cu²⁺, Ru²⁺. Useful for installing synthetic metallocofactors, creating redox-active sites, or building metalloproteins with tunable properties.
ε-Azido-lysine
Lysine with azide (–N₃) on ε-amino group
Bioorthogonal chemistry: Azide is inert to biological functional groups but reacts rapidly via click chemistry (e.g., strain-promoted azide-alkyne cycloaddition), enabling site-specific labeling, crosslinking, and drug conjugation.
ncAAs expand protein functionality for drug design, biosensors, biomaterials, mechanistic enzymology, and synthetic biology.
5. Where did amino acids come from before enzymes that make them, and before life started?
1. Atmospheric/oceanic synthesis (Miller–Urey type experiments):
Reducing atmospheres (CH₄, NH₃, H₂, H₂O) subjected to energy sources (UV radiation, lightning, volcanic heat) produce amino acids.
Modern models favor weakly reducing atmospheres (CO₂, N₂, H₂O + H₂) near hydrothermal vents, which still yield amino acids via formose-like and Strecker-like reactions.
2. Strecker synthesis (aqueous chemistry):
Aldehydes or ketones react with HCN and NH₃ to form α-aminonitriles, which hydrolyze to amino acids.
This pathway occurs in alkaline hydrothermal vent systems and interstellar ice analogs.
3. Extraterrestrial delivery:
Amino acids (>80 types, including non-biological ones) have been detected in carbonaceous chondrites (e.g., Murchison meteorite).
Some samples show L-enantiomer excess, suggesting chiral symmetry-breaking in space.
Comets and interstellar ices likely contributed to Earth’s prebiotic inventory.
6. If you make an α-helix using D-amino acids, what handedness (right or left) would you expect?
A polypeptide composed entirely of D-amino acids would form a left-handed α-helix. The reason because L-amino acids favor backbone dihedral angles φ ≈ –60°, ψ ≈ –45° (right-handed helical geometry). D-amino acids are mirror images (enantiomers) of L-amino acids, so their favorable φ/ψ angles are sign-inverted: φ ≈ +60°, ψ ≈ +45°. And these angles produce a left-handed helix with the same hydrogen-bonding pattern (i → i+4) but opposite helical sense.
7. Can you discover additional helices in proteins?
Yes. Beyond the canonical α-helix, 3₁₀-helix, and π-helix, new and rare helical motifs continue to be identified.
Known non-canonical helices:
Polyproline II helix (PPII): left-handed, extended; common in collagen and disordered regions.
γ-helix: rare; tighter than α-helix.
α_L-helix: left-handed α-helix (rare in L-peptides; seen in certain contexts or D-residues).
Hybrid/transitional helices: local 3₁₀/α blends or distorted segments.
Tools for discovery:
High-resolution X-ray crystallography and cryo-EM: reveal short, rare, or distorted helices.
NMR spectroscopy: detects transient helical states (e.g., via residual dipolar couplings, relaxation dispersion).
AlphaFold2/3 and molecular dynamics (MD): predict metastable helical conformations and sample rare states via enhanced sampling (replica exchange, metadynamics).
Why new helices appear:
Local sequence context, post-translational modifications, ligand binding, membrane environments, and pH shift φ/ψ distributions.
Helices exist on a continuum; subtle energy differences stabilize non-canonical H-bond patterns.
8. Why are most molecular helices right-handed?
In biological polymers, right-handedness arises from monomer chirality and steric optimization.
For proteins (L-amino acids):
L-amino acids favor φ/ψ angles (≈ –60°, –45°) that produce right-handed α-helices with minimal side-chain clashes and optimal backbone hydrogen bonding.
Left-handed helices require φ/ψ values that place side chains in sterically unfavorable positions (forbidden regions of the Ramachandran plot).
General principle:
Chirality of monomers dictates handedness.
If you swap L ↔ D (e.g., D-amino acids), you get the mirror-image helix (left-handed).
In synthetic/achiral polymers:
Handedness is determined by packing efficiency, torsional strain, and solvent interactions.
Without chirality, helices may form as racemic mixtures or adopt the handedness that minimizes steric/electronic repulsion.
9. Why do β-sheets tend to aggregate? What is the driving force for β-sheet aggregation?
β-sheets are intrinsically prone to intermolecular association due to their geometry and chemical properties.
β-strands often alternate polar and nonpolar residues on opposite faces. When β-sheets associate, hydrophobic side chains pack against each other, displacing high-energy ordered water molecules → favorable entropy gain.
Aggregation is often initiated by partial unfolding, cleavage, or mutation, exposing β-strand-prone sequences.
Some organisms use cross-β aggregates as structural materials (e.g., spider silk, curli fibers in biofilms).
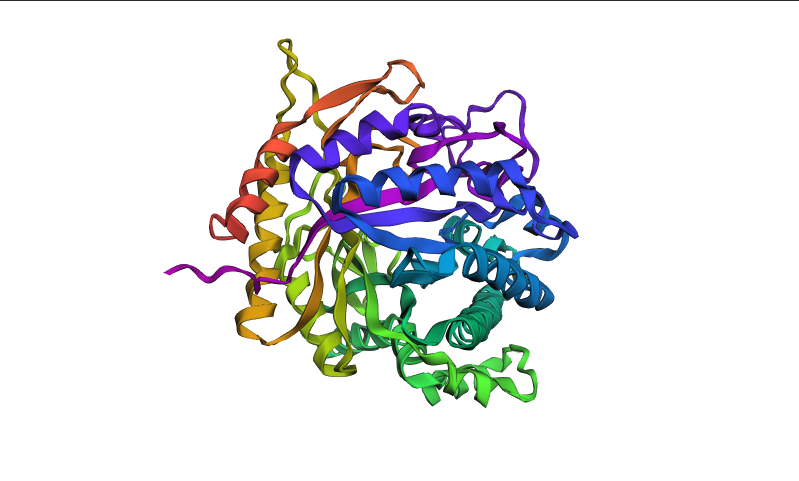
Part B: Protein Analysis and Visualization
I selected the BglA (β-glucosidase) protein because my project focuses on horizontal gene transfer (HGT) in Escherichia coli using a bioprinting system. In this system, donor and recipient bacterial strains are printed onto agar plates in spatially defined layers. Successful conjugation events are visualized by a color change from pink to teal after recipient cells acquire the bglA gene from Enterococcus faecalis and begin producing β-glucosidase activity on chromogenic media.
There is limited structural information available for the E. faecalis BglA protein, so I used the structurally characterized homolog from E. coli. Although E. coli and E. faecalis are not from the same bacterial family, both proteins belong to the β-glucosidase enzyme group and perform similar functions.
The protein sequence for E. coli BglA was obtained from UniProt.
The most frequent amino acids in the sequence is Glycine (G) as it appears in the sequence 42 times.
The BglA protein from E. coli contains 479 amino acids.
Using the UniProt BLAST tool, 250 results were identified as potential homologs of the BglA protein (UniProt ID: Q46829) with sequence identities ranging from 74.7% to 100%. Most homologs were found in bacteria (249 results), which is expected because β-glucosidases are common enzymes involved in bacterial carbohydrate metabolism. One homologous sequence was also identified in the eukaryotic organism Trichuris trichiura (1 result).
BglA belongs to the glycoside hydrolase family 1 (GH1) of β-glucosidases. These enzymes hydrolyze glycosidic bonds in carbohydrates and are involved in sugar metabolism.
The structure was solved using X-ray crystallography and released in 2011. The resolution of the structure is 2.30 Å, which is considered good quality for a protein crystal structure because lower resolution values indicate more precise atomic positions.
In addition to the protein, the structure contains sulfate ions (SO₄²⁻) and bromide ions. These molecules are commonly present from crystallization conditions and may stabilize the structure during crystal formation.
The protein belongs to the glycoside hydrolase structural family, which typically contains catalytic domains rich in α/β folds involved in carbohydrate hydrolysis.
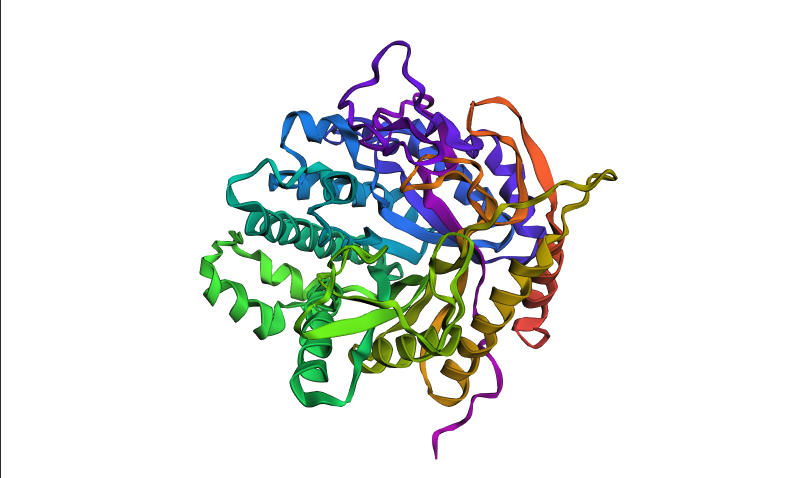
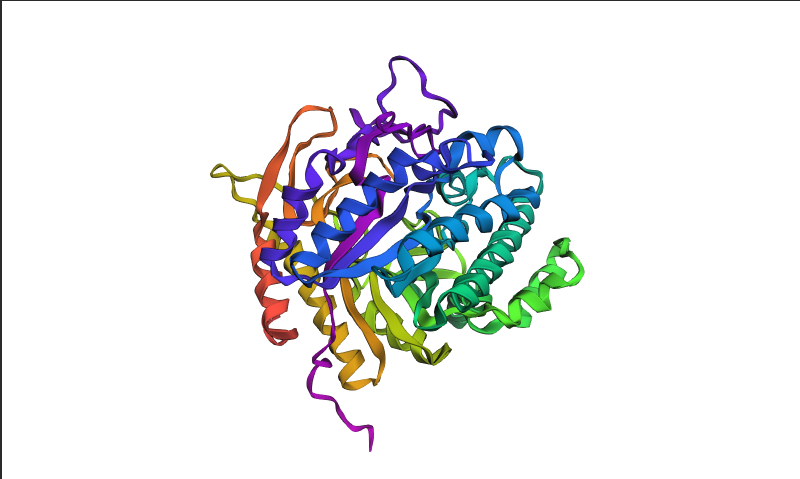
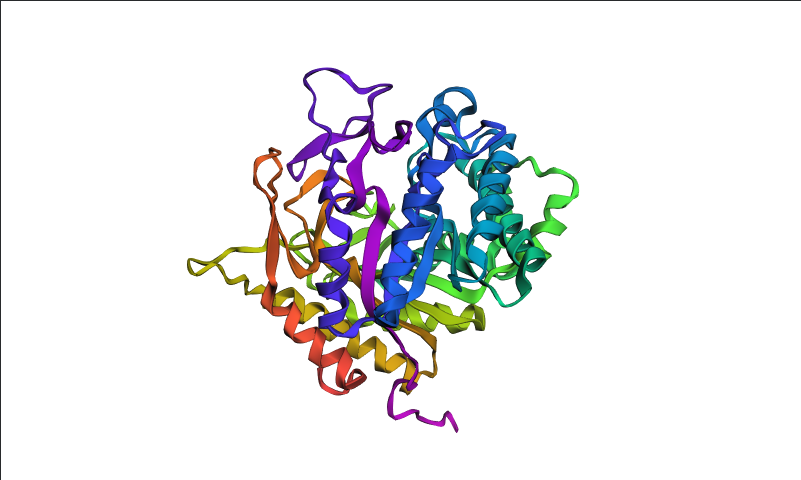
Visualized protein in PyMol using cartoon representations:
Visualized protein in PyMol using ribbon representations:
Visualized protein in PyMol using ball-and-stick representations:
Secondary structure
After coloring the protein by secondary structure in PyMol, the structure appeared to contain substantially more α-helices than β-sheets. Loops and turns were also distributed throughout the structure. The predominance of α-helices is consistent with the overall fold of many glycoside hydrolase enzymes.
Residue type distribution
After coloring the protein by residue type in PyMol, hydrophobic residues (yellow) appeared to cluster mainly in the internal regions of the protein structure, while hydrophilic residues (cyan) were more exposed on the protein surface. This organization is characteristic of soluble enzymes and contributes to protein stability and interactions with the aqueous environment.
Surface visualization
Surface representation was colored according to B-factor values using a blue-white-red spectrum. Regions with higher B-factors (red/pink) indicate increased atomic displacement or structural flexibility, while lower B-factor regions (blue) correspond to more rigid parts of the structure. The protein surface exhibits several grooves and cavities, consistent with the typical topology of glycoside hydrolases, which often possess an elongated substrate-binding cleft.
Part C. Using ML-Based Protein Design Tools
C1. Protein Language Modeling
Deep Mutational Scans - Crystal Structure of E.coli BglA protein.
Columns with more dark cells (the wild-type amino acid is strongly preferred) indicate more conserved residues, which are likely important for the structure and function of the protein.
Latent Space Analysis
Neighboring proteins usually share the same SCOPe structural class and superfamily number, which indicates that the latent space captures structural and functional similarities between proteins.
C2. Protein Folding
Folding a protein
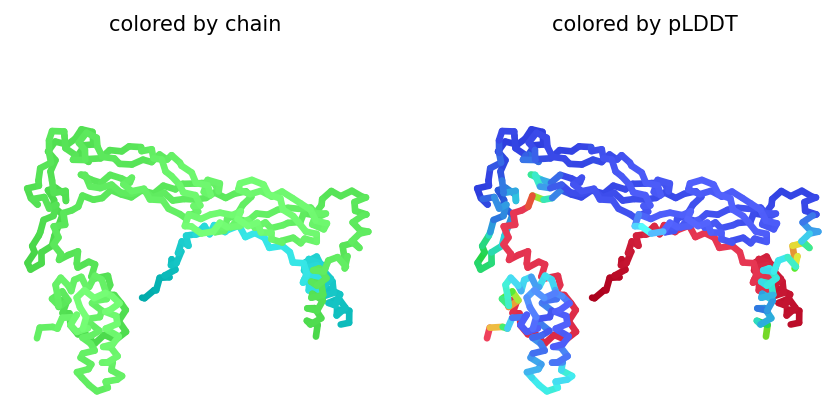
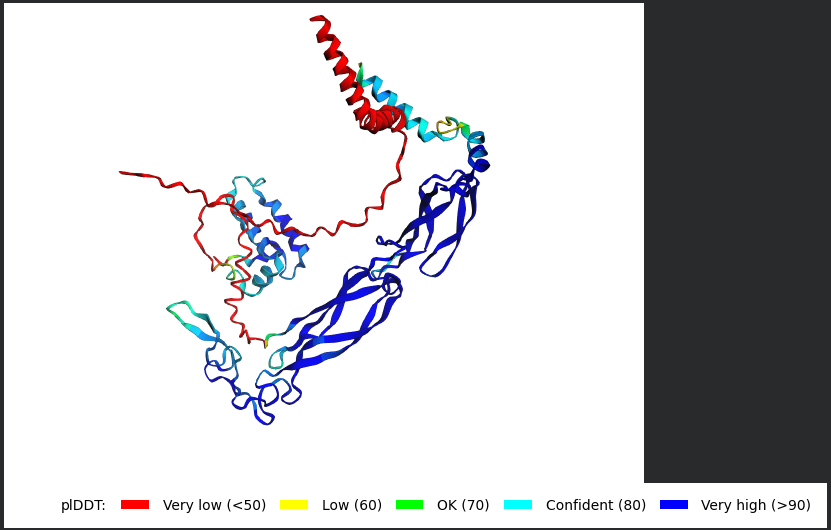
The ESMFold prediction for BglA produced a highly confident structure with a pTM score of 0.936 and an average pLDDT of 91.16. Most regions were colored blue or green, indicating high local confidence, while only a few loop regions showed lower confidence (yellow/red). The predicted fold closely matched the experimentally determined crystal structure, suggesting that ESMFold accurately reproduced the overall topology of the protein.
The E164A point mutation had minimal effect on the predicted structure of BglA. The pTM score remained nearly unchanged (0.935 vs. 0.936 for the wild type), and the average pLDDT stayed very high (91.05), indicating that the overall fold and structural confidence were preserved. This suggests that the BglA structure is resilient to single amino acid substitutions.
Deletion of a larger sequence segment resulted in a moderate decrease in prediction confidence (pLDDT 89.1 vs. 91.2 in the wild type), while the overall fold remained largely preserved. The predicted structure retained a similar topology and confidence-color distribution, suggesting that the deleted region is not essential for maintaining the global structural framework of BglA.
Large mutation (removed segment GYCCSGVVYTEHENPEETMY)
ESMFold accurately reproduced the experimentally determined fold of BglA with high confidence scores (pTM 0.936; pLDDT 91.16). A single-point mutation (E164A) had almost no effect on the predicted structure, indicating high resilience to minor sequence changes. Deletion of a larger sequence segment caused a moderate reduction in confidence scores but did not significantly disrupt the overall fold, suggesting that BglA maintains a robust global structural architecture even after substantial sequence perturbation.
C3. Protein Generation
Inverse-Folding a protein
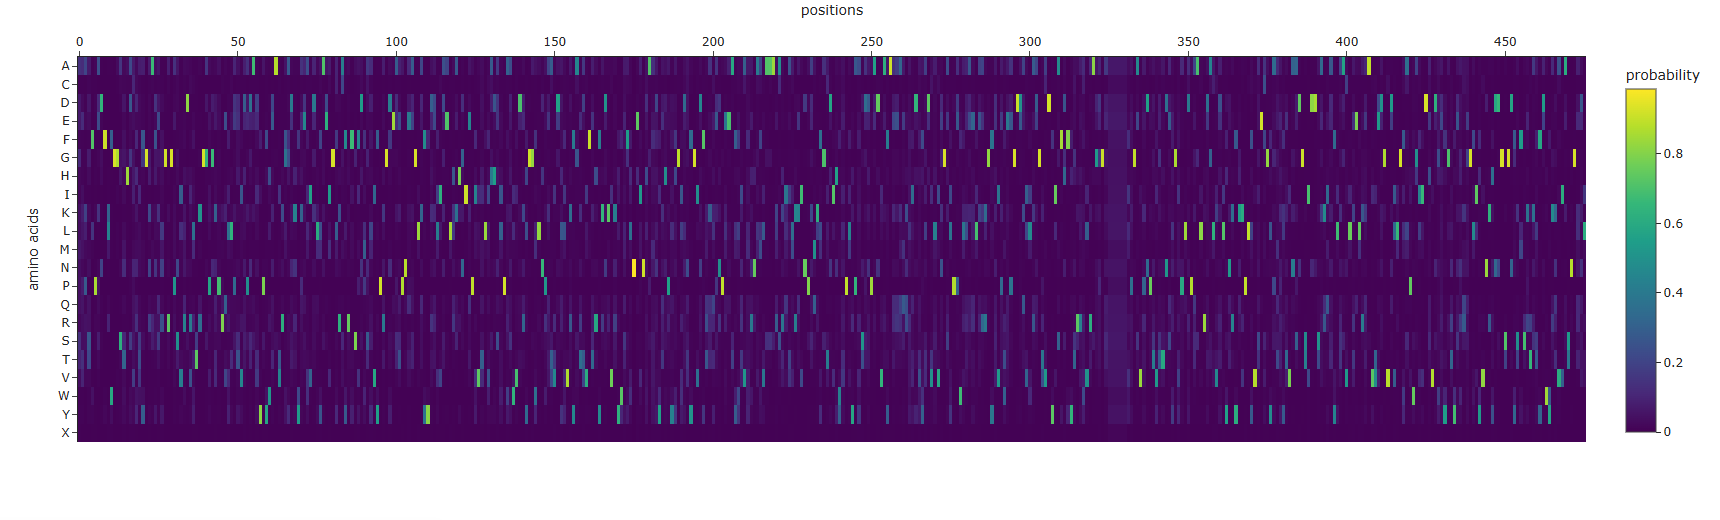
Predicted sequence probabilities
I used ProteinMPNN (model v_48_020, sampling temperature 0.1) to perform inverse folding on the backbone structure of BglA (PDB: 2XHY). The designed sequence achieved a sequence recovery of 45.5%, indicating that nearly half of the original amino acids were reproduced by the model. This suggests that the BglA backbone imposes substantial structural constraints on sequence selection, particularly within the conserved catalytic core and structurally important regions. Probability maps showed several highly confident residue positions, while other regions tolerated greater sequence variability, especially likely in surface-exposed loops.
ProteinMPNN amino acid probabilities at each position. Bright spots indicate positions where the model is highly confident about which residue should occupy that position.
Folding the designed sequence with ESMFold
I folded the ProteinMPNN-designed sequence of BglA with ESMFold and compared it to the original crystal structure.
Structure
pTM
pLDDT
Original BglA
0.936
91.16
ProteinMPNN-designed sequence
0.923
87.95
The ProteinMPNN-designed sequence retained a highly similar overall fold compared to the original BglA structure. Confidence coloring was also largely unchanged, with most regions remaining blue and green, indicating that the designed sequence still folds into a stable and well-defined globular structure.
Although the designed sequence recovered only ~45.5% of the original amino acids, the predicted structure remained highly similar to the native fold. This demonstrates that multiple different amino acid sequences can support the same overall protein architecture. In BglA, the structural constraints imposed by the conserved catalytic core and the α/β-fold appear to strongly determine the global topology even when substantial sequence variation is introduced.
BglA is a structured enzymatic protein with a robust and evolutionarily conserved fold. As a result, ProteinMPNN was able to design an alternative sequence that still folds with high confidence into a structure closely resembling the original enzyme.
Part D. Group Brainstorm on Bacteriophage Engineering
Main goal
Increased stability
Will focus on stabilizing the L protein computationally. By increasing its thermodynamic stability, there is aim to reduce its dependence on the bacterial chaperone DnaJ for proper folding and membrane insertion. A more stable L protein should maintain function even if E. coli mutates DnaJ, thereby helping the phage overcome host resistance mechanisms. This also indirectly supports higher toxicity by ensuring more functional lysis protein reaches the membrane.
Project Objective Propose to computationally design stabilizing mutations in the MS2 L lysis protein to make it less reliant on the host chaperone DnaJ while preserving (or enhancing) its ability to form oligomeric pores in the bacterial membrane. The long-term goal is to create L protein variants that increase phage lysis efficiency and reduce the evolutionary window in which E. coli can develop resistance during phage therapy.
Proposed Tools and Computational Approaches Will use a combination of modern protein design and structure prediction tools introduced in recitation:
Protein Language Models (ESM-2 / ESMFold) for initial in silico mutagenesis and variant generation.
AlphaFold3 (or AlphaFold-Multimer) to predict monomer structures and protein–protein/membrane complexes.
FoldX and/or Rosetta (ddG protocol) to quantitatively evaluate mutational effects on folding stability (ΔΔG).
ProteinMPNN for sequence redesign of surface residues to improve packing and reduce aggregation propensity.
Molecular Dynamics (MD) simulations (short runs using GROMACS or OpenMM with a coarse-grained membrane model) to assess membrane insertion and oligomerization of top candidates.
Why These Tools Are Likely to Help
ESM-2 and ProteinMPNN These models excel at proposing evolutionarily plausible and physically stable mutations without requiring an experimentally solved structure. Since the MS2 L protein is small, membrane-associated, and structurally under-characterized, sequence-based generative models provide an ideal starting point. They allow to explore sequence space while preserving foldability constraints learned from millions of natural protein sequences.
AlphaFold3 / AlphaFold-Multimer AlphaFold enables structure prediction of the L protein monomer and potential oligomeric states. Using Multimer mode, can be modeled the L–DnaJ interaction to assess whether specific mutations preserve structural integrity while weakening dependence on the host chaperone. Recent AlphaFold versions handle small peptides and membrane proteins reasonably well, especially when modeled in a membrane-mimetic context.
FoldX / Rosetta (ddG calculations) These physics-based tools estimate the change in folding free energy (ddG) upon mutation. Variants predicted to have ddG < -1.5 kcal/mol are likely more thermodynamically stable than wild type. This allows to prioritize mutations that may improve folding robustness and reduce chaperone dependence.
Molecular Dynamics (MD) Simulations MD simulations provide dynamic validation. They allow to evaluate whether stabilized variants:
Maintain structural integrity over time
Insert more efficiently into lipid bilayers
Form stable oligomeric pore-like assemblies
This connects computational stability predictions to functional outcomes such as faster lysis and potentially higher phage titers.
Overall Strategy By integrating:
Evolutionary information (protein language models)
Deep learning-based structure prediction (AlphaFold)
The L protein is short (~75 amino acids), partially disordered, and membrane-associated. AlphaFold confidence scores (pLDDT) may be low in flexible or transmembrane regions. This uncertainty can propagate into inaccurate ddG predictions and false positives.
Mitigation strategy:
Use consensus scoring (ESM + Rosetta + FoldX)
Focus on mutations in higher-confidence structural regions
Experimentally validate multiple top-ranked variants in parallel
2. Limited Training Data on Phage–Host Interactions
Most protein language models and structural predictors are trained primarily on soluble globular proteins and well-characterized complexes. The L–DnaJ interaction has limited structural and mutational data, which may reduce predictive accuracy for engineering chaperone independence.
Mitigation strategy:
Prioritize global stability improvements before fine-tuning interface mutations
Maintain diversity among selected candidates
Use rapid experimental feedback (Stages 4–5) to iteratively refine computational predictions
Expected Outcome and Next Steps
This computational stage (Stage 1) will generate a prioritized list of 5–8 L protein variants predicted to exhibit improved thermodynamic stability and reduced reliance on host chaperones.
Selected variants will then:
Be synthesized via Twist Bioscience
Be cloned using Gibson Assembly
Be structurally evaluated using the Nuclera system
Be tested in E. coli for lysis efficiency and phage propagation
By focusing on stability, there is aim to engineer a more robust L protein that enhances MS2’s ability to lyse E. coli efficiently. This reduces the evolutionary window for bacterial resistance and strengthens the therapeutic potential of MS2-based phage therapy.
Pipeline Schematic
Phase
Methods
Purpose
Sequence Design
ESM-2, ProteinMPNN
Generate stabilized variants
Structure Modeling
AlphaFold3, Multimer
Preserve fold, weaken DnaJ dependence
Stability Filtering
FoldX / Rosetta
Select low ddG mutants
Functional Validation
MD simulations
Evaluate membrane behavior
Experimental Transfer
Gene synthesis
Move to wet lab testing
Week 5 HW: Protein design part II
Part A: SOD1 Binder Peptide Design (From Pranam)
Part 1: Generate Binders with PepMLM
the human SOD1 sequence (P00441):
MATKAVCVLKGDGPVQGIINFEQKESNGPVKVWGSIKGLTEGLHGFHVHEFGDNTAGCTSAGPHFNPLSRKHGGPKDEERHVGDLGNVTADKDGVADVSIEDSVISLSGDHCIIGRTLVVHEKADDLGKGGNEESTKTGNAGSRLACGVIGIAQ
the A4V mutant SOD1 sequence:
MATKVVCVLKGDGPVQGIINFEQKESNGPVKVWGSIKGLTEGLHGFHVHEFGDNTAGCTSAGPHFNPLSRKHGGPKDEERHVGDLGNVTADKDGVADVSIEDSVISLSGDHCIIGRTLVVHEKADDLGKGGNEESTKTGNAGSRLACGVIGIAQ
four peptides of length 12 amino acids conditioned on the mutant SOD1 sequence with the known SOD1-binding peptide FLYRWLPSRRGG for comparison:
index
Binder
Pseudo Perplexity
1
WRYGPAAAAHWK
9.318684
2
WHYPAVVLRWKX
16.435002
3
WLYYPAAVRLWK
16.527933
4
WLYYVAVVALGE
22.958134
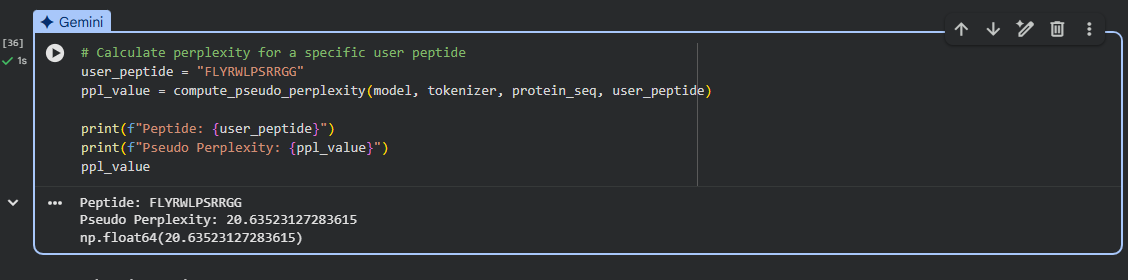
5
FLYRWLPSRRGG
20.63523127283615
Conclusion
The model assigned the lowest perplexity (9.32) to peptide WRYGPAAAAHWK, indicating the highest sequence plausibility according to the language model.
The experimentally validated SOD1-binding peptide FLYRWLPSRRGG showed one of the higher perplexity (20.63), suggesting that the language model does not necessarily rank experimentally verified binders as the most probable sequences.
One generated peptide (WHYPAVVLRWKX) contains the residue “X”, which denotes an unknown or unspecified amino acid. This likely reflects a tokenization or sampling artifact of the language model. Because “X” does not correspond to a defined amino acid, this peptide should be interpreted cautiously when evaluating potential binding candidates which suggests that such a peptide may be invalid.
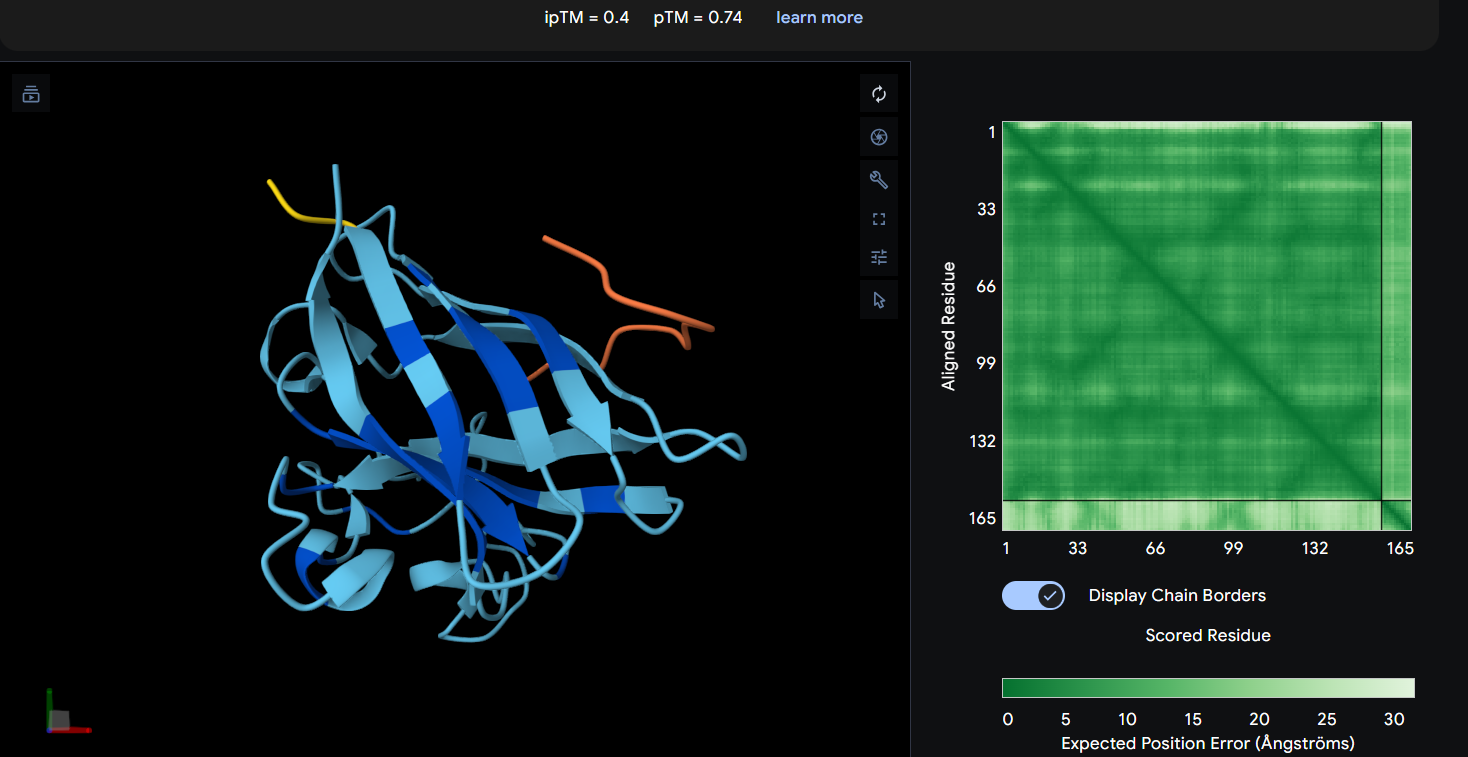
Part 2: Evaluate Binders with AlphaFold3
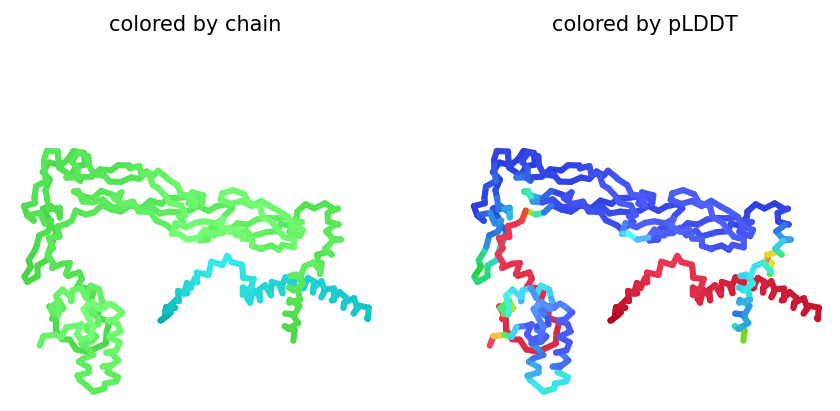
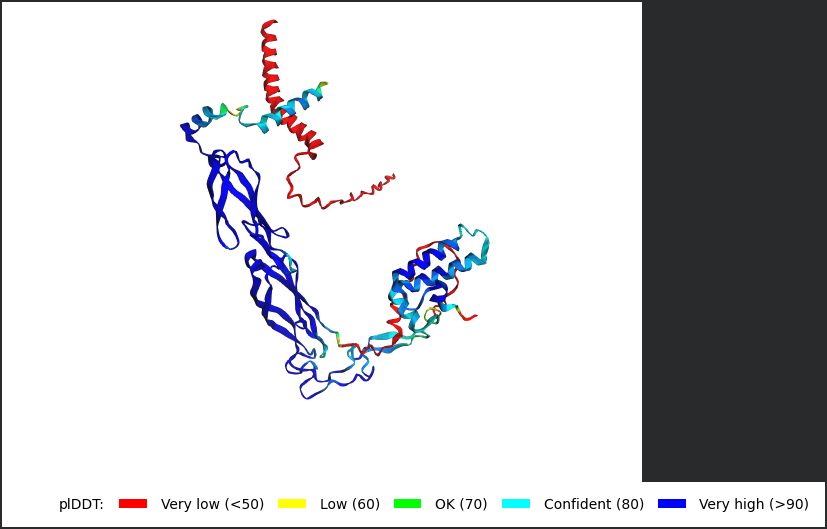
Each peptide was modeled in a separate AlphaFold 3 run using a two-chain setup. Chain A consisted of the SOD1 A4V mutant, while Chain B contained a single 12-residue peptide. All peptides were evaluated individually to compare ipTM scores and binding poses. Peptide 2 (WHYPAVVLRWKX) containing X was excluded from structural analysis because X denotes an unknown amino acid.
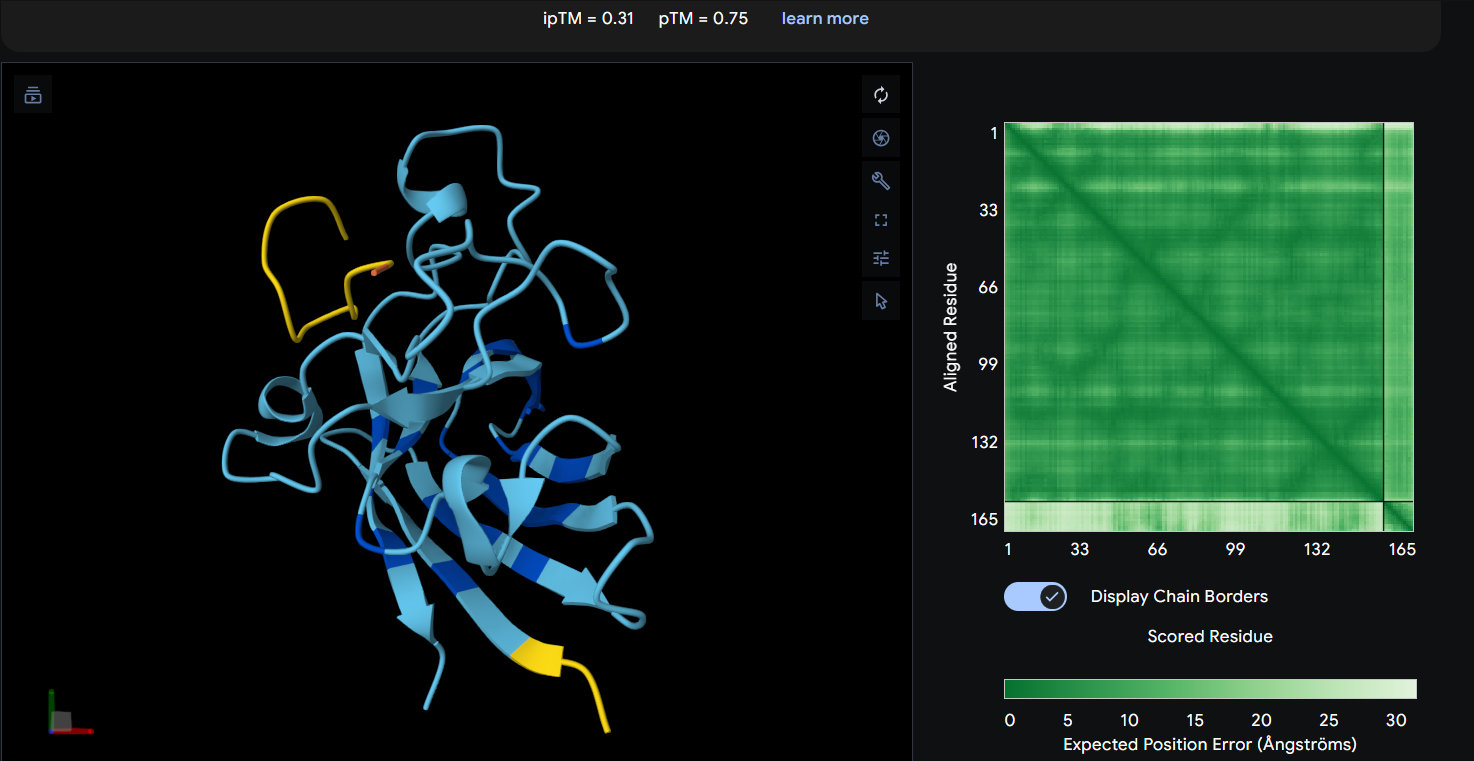
Peptide 1: WRYGPAAAAHWK (ipTM = 0.40)
Peptide 2: WHYPAVVLRWKX skipped (invalid X residue)
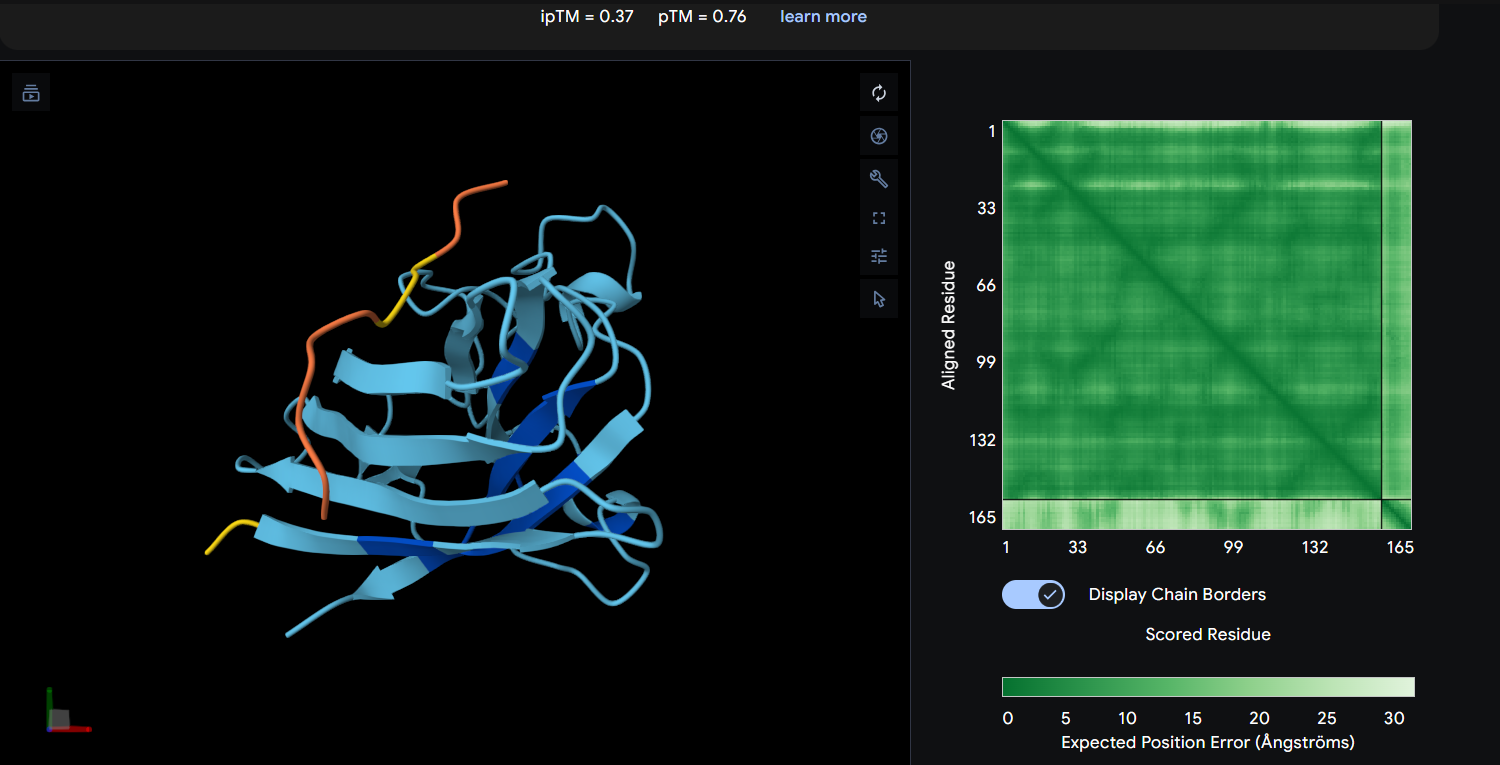
Peptide 3: WLYYPAAVRLWK (ipTM = 0.37)
Peptide 4: WLYYVAVVALGE (ipTM = 0.31)
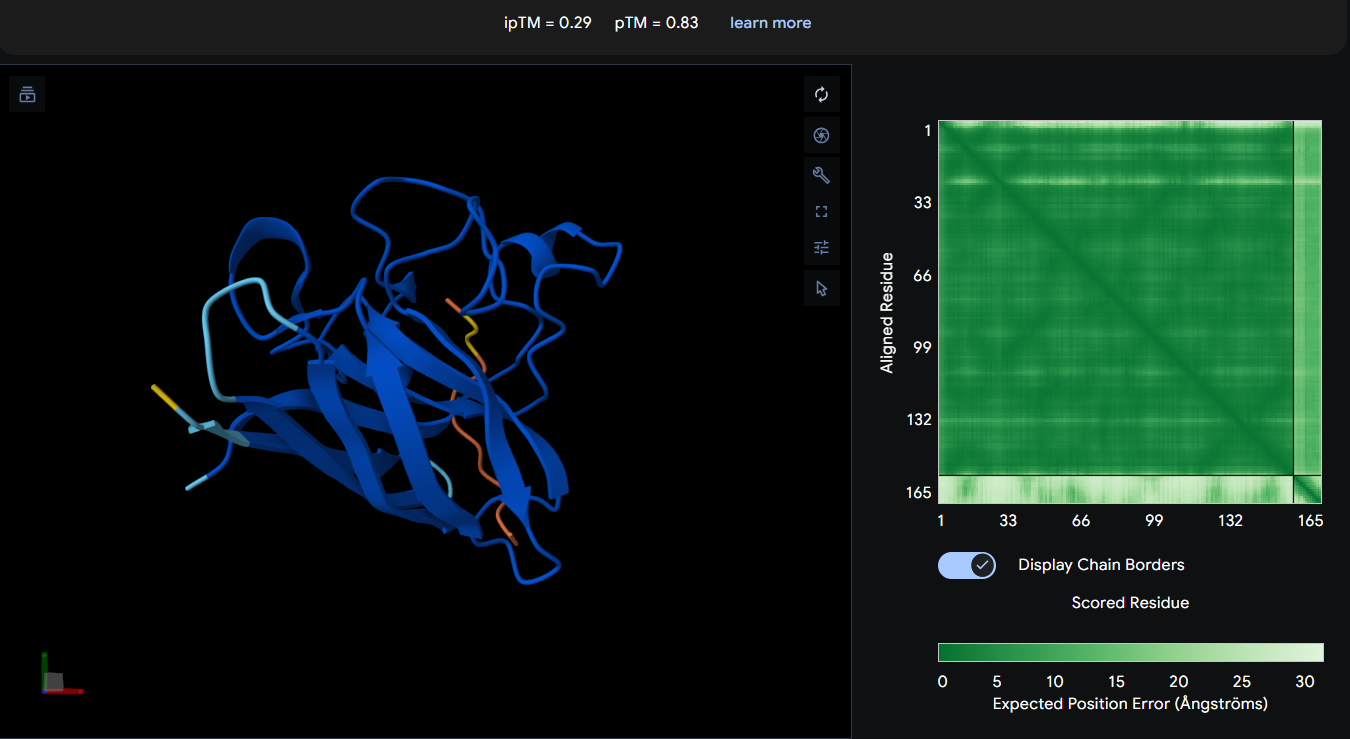
Known Binder: FLYRWLPSRRGG (ipTM = 0.29)
Peptide
ipTM
pTM
Binding Interpretation
WRYGPAAAAHWK
0.40
0.74
Highest interface confidence among generated peptides, suggesting the most stable predicted interaction, although overall binding confidence remains low and primarily surface-associated.
WLYYPAAVRLWK
0.37
0.76
Weak and uncertain interaction with limited localized confidence; likely transient surface binding without a clearly defined interface.
WLYYVAVVALGE
0.31
0.75
Weakest predicted interface among generated peptides; interaction appears diffuse and poorly stabilized.
FLYRWLPSRRGG (known binder)
0.29
0.83
Despite being an experimentally known SOD1-binding peptide, AlphaFold3 predicted low interface confidence, suggesting that transient or flexible peptide interactions may not be captured reliably by structural prediction alone.
Conclusion
AlphaFold3 analysis revealed generally low interface confidence across all peptide–SOD1 complexes, with all ipTM values remaining below 0.5. Among the PepMLM-generated peptides, WRYGPAAAAHWK achieved the highest ipTM score (0.40), indicating the strongest predicted interaction with the A4V mutant SOD1 structure, although the interaction still appeared weak and primarily surface-associated. WLYYPAAVRLWK and WLYYVAVVALGE showed progressively lower ipTM values (0.37 and 0.31, respectively), suggesting less stable peptide binding interfaces. None of the generated peptides localized clearly to the N-terminal region containing the A4V mutation, and no strongly buried or highly ordered binding mode was observed. Interestingly, the experimentally known SOD1-binding peptide FLYRWLPSRRGG produced the lowest ipTM score (0.29) despite its validated biological interaction, highlighting a limitation of AlphaFold3 in modeling transient or flexible peptide-mediated interactions. Overall, the results suggest that while some PepMLM-generated peptides may form weak surface interactions with mutant SOD1, none demonstrated highly confident or stable binding according to AlphaFold3 predictions.
Part 3: Evaluate Properties with PeptiVerse
Each peptide was evaluated against the A4V mutant SOD1 sequence using PeptiVerse for predicted binding affinity, solubility, hemolysis probability, net charge, and molecular weight.
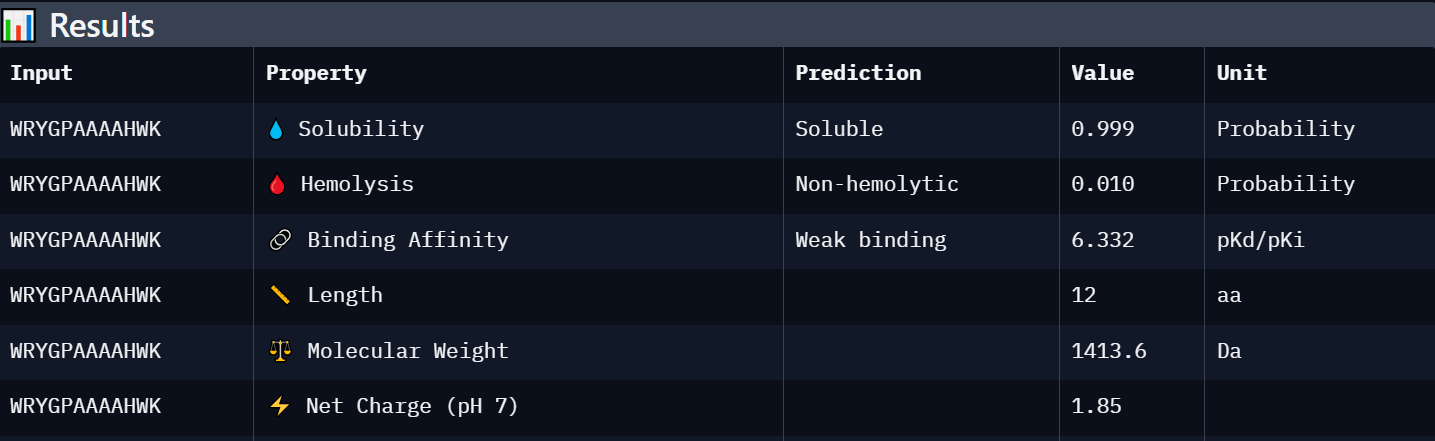
Peptide 1: WRYGPAAAAHWK
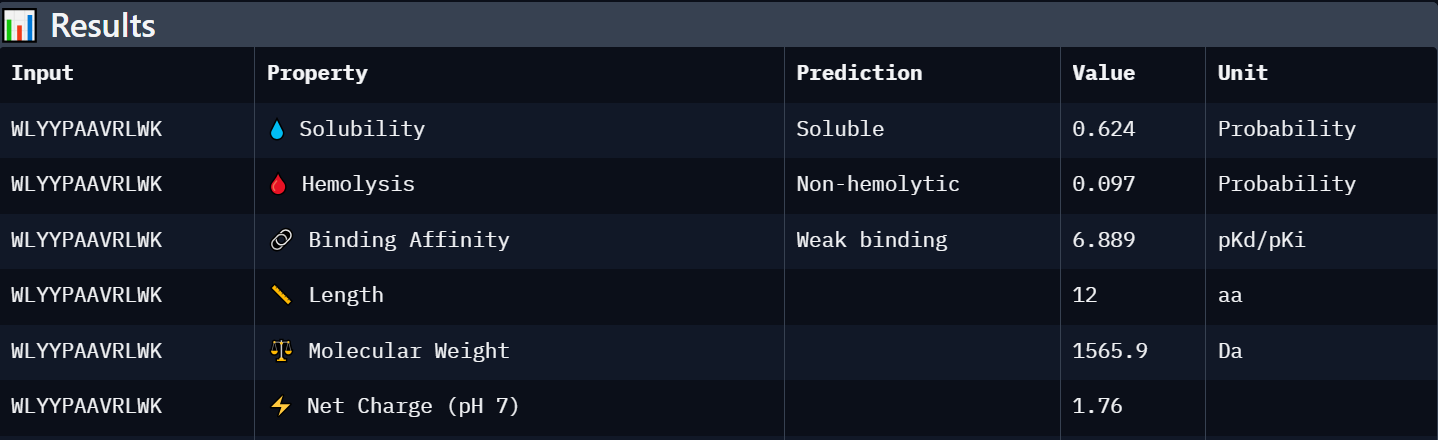
Peptide 3: WLYYPAAVRLWK
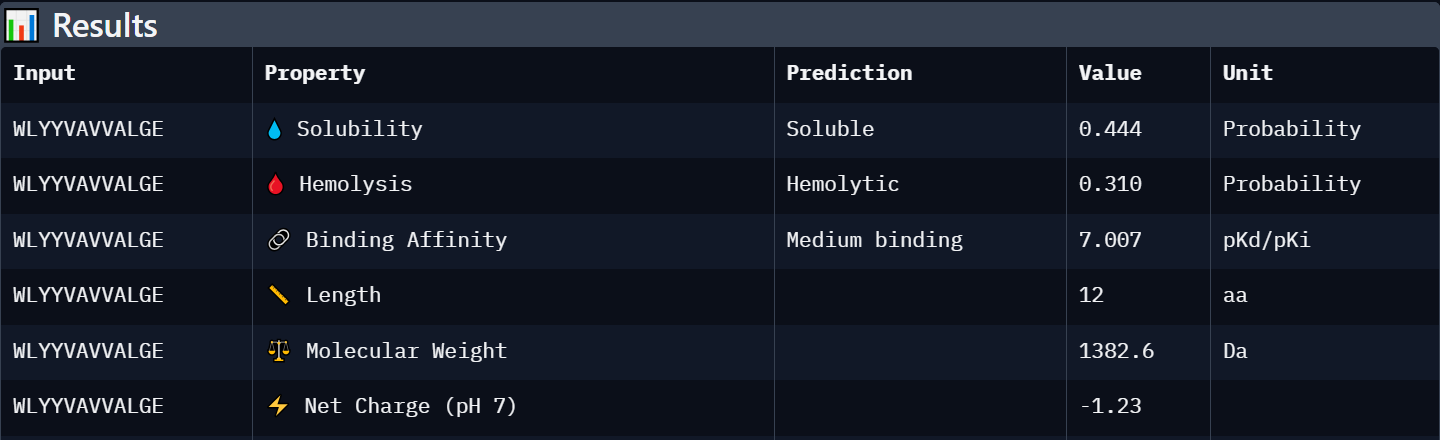
Peptide 4: WLYYVAVVALGE
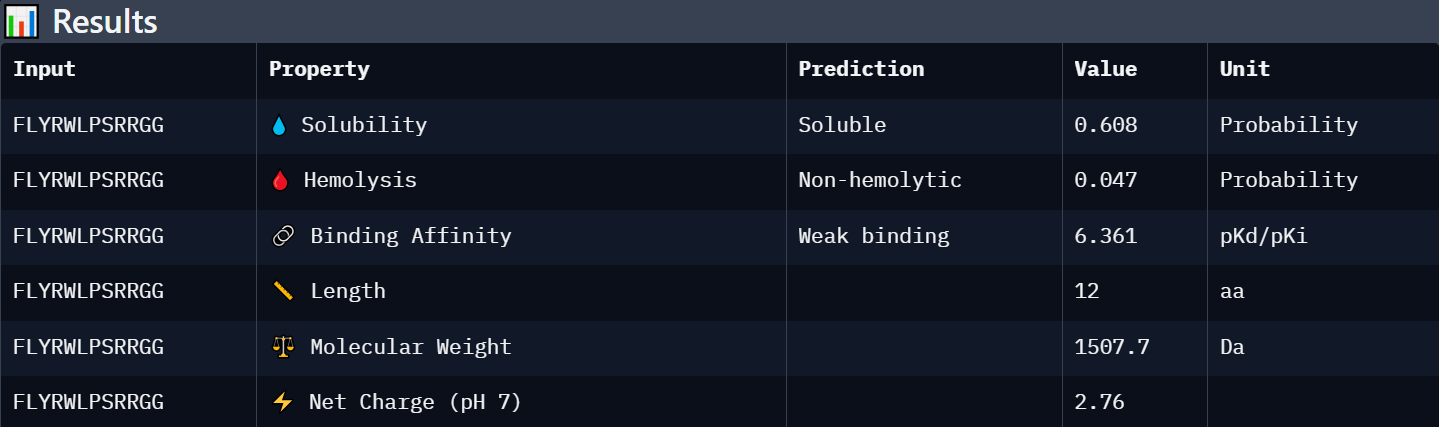
Known Binder: FLYRWLPSRRGG
Peptide
Predicted Binding Affinity
Solubility
Hemolysis Probability
Net Charge (pH 7)
Molecular Weight
Interpretation
FLYRWLPSRRGG
Weak binding (6.361)
Soluble (0.608)
Non-hemolytic (0.047)
+2.76
1507.7
Known SOD1-binding reference peptide with moderate solubility, low toxicity, and acceptable predicted affinity.
WRYGPAAAAHWK
Weak binding (6.332)
Soluble (0.999)
Non-hemolytic (0.010)
+1.85
1413.6
Best overall candidate with the strongest predicted affinity among generated peptides, excellent solubility, and minimal predicted toxicity.
WLYYPAAVRLWK
Weak binding (6.889)
Soluble (0.624)
Non-hemolytic (0.097)
+1.76
1565.9
Intermediate candidate with acceptable solubility and low hemolysis risk, but weaker predicted affinity and structural confidence.
WLYYVAVVALGE
Weak binding (6.889)
Soluble (0.444)
Hemolytic (0.310)
-1.23
1382.6
Least favorable candidate due to lower solubility, predicted hemolytic activity, and weak structural interaction confidence.
Conclusion
Each peptide was evaluated against the A4V mutant SOD1 sequence using PeptiVerse for predicted binding affinity, solubility, hemolysis probability, net charge, and molecular weight. Among the PepMLM-generated peptides, WRYGPAAAAHWK showed the strongest overall profile, combining the highest AlphaFold3 ipTM score (0.40) with the best predicted binding affinity (6.332), excellent solubility (0.999), and extremely low hemolysis probability (0.010). In contrast, WLYYVAVVALGE demonstrated weaker structural confidence (ipTM 0.31), lower solubility, and a higher predicted hemolysis probability (0.310), making it a less favorable therapeutic candidate despite similar predicted affinity values. WLYYPAAVRLWK showed intermediate behavior with moderate solubility and low hemolysis risk but weaker predicted binding and interface confidence than WRYGPAAAAHWK. Overall, peptides with higher ipTM values tended to display slightly stronger predicted binding affinity and more favorable therapeutic properties. Compared with the known binder FLYRWLPSRRGG, WRYGPAAAAHWK achieved a comparable affinity prediction while exhibiting superior solubility and lower predicted toxicity.
Among the evaluated candidates, WRYGPAAAAHWK I would select for further development. Although its predicted binding remains modest, it achieved the highest ipTM score among the generated peptides and demonstrated the most favorable therapeutic profile, including excellent solubility and minimal predicted hemolytic activity. These properties suggest a better balance between structural interaction potential and developability compared with the other candidates.
Part 4: Generate Optimized Peptides with moPPIt
moPPIt was run targeting motif positions 2–8 of A4V SOD1, with objectives set to Hemolysis Probability, Solubility, Predicted Affinity, and Motif (all weights = 1). Five 12-mer peptides were generated.
Peptide
Hemolysis Probability
Solubility
Predicted Affinity
Motif
Interpretation
CTSGENVGAGVS
0.0666
0.9999
6.0910
0.6461
Highly soluble and low-risk peptide with moderate predicted affinity and acceptable motif targeting near the selected SOD1 region.
ANAPWPPAFSFH
0.0155
1.0000
6.0548
0.6574
Very low predicted hemolysis and excellent solubility, with moderate affinity and balanced therapeutic properties.
PSEKQCVKFHTT
0.0481
1.0000
5.8624
0.8456
Strong motif guidance score with improved predicted affinity and excellent solubility, making it one of the most balanced candidates.
MYAGIFEKNKQT
0.0307
0.9999
5.6291
0.7912
Best predicted affinity among generated peptides with low hemolysis probability and excellent solubility, representing the strongest overall candidate.
QPTCGSGQFNWF
0.0334
1.0000
6.3863
0.8244
Excellent solubility and favorable motif score, although predicted affinity is weaker compared with the other moPPIt peptides.
Conclusion
moPPIt-generated peptides demonstrated consistently favorable therapeutic property predictions compared with the earlier PepMLM-generated candidates. All peptides showed near-perfect predicted solubility (~1.0) and very low hemolysis probabilities, indicating improved safety and developability profiles. In contrast to PepMLM, which generated peptides with mixed structural and therapeutic characteristics, moPPIt produced candidates optimized simultaneously for affinity, motif targeting, and physicochemical properties. Among the generated peptides, MYAGIFEKNKQT achieved the strongest predicted affinity score (5.6291) while maintaining excellent solubility and low predicted toxicity, making it the most promising overall candidate. PSEKQCVKFHTT also showed strong performance due to its high motif score (0.8456), suggesting improved targeting of the selected SOD1 A4V-adjacent region. Overall, the moPPIt peptides appeared more balanced and therapeutically favorable than the original PepMLM-generated peptides, highlighting the advantages of guided multi-objective peptide optimization.
Before advancing these peptides toward clinical development, additional validation would be required, including molecular docking, molecular dynamics simulations, biochemical binding assays, aggregation inhibition studies, cytotoxicity testing, and evaluation in cellular or animal ALS models to confirm both efficacy and safety.
Part C: Final Project: L-Protein Mutants
The goal of this project is to reduce the interaction between the MS2 lysis protein (L-protein) and the bacterial chaperone DnaJ. Since DnaJ is important for proper folding and processing of the L-protein, weakening this interaction may help the phage remain functional even if bacteria modify DnaJ. To study this interaction, co-folding predictions were performed using AlphaFold2 Multimer with both proteins entered together. In AlphaFold2, both sequences are inserted into a single input field separated by a colon :.
Mutations were introduced only in the soluble N-terminal domain of the L-protein and not in the transmembrane region.
Among the generated AlphaFold2 multimer models, the top-ranked model (rank_001, model_4) was selected for analysis because it showed the highest predicted interaction confidence with an ipTM score of 0.165.
Metric
Value
pLDDT
74.8
pTM
0.528
ipTM
0.165
3D structure of top-ranked model (rank_001, model_4)
Explanation
This mutant was designed to weaken the interaction between the L-protein and DnaJ. The soluble N-terminal domain contains several positively charged arginine residues that may participate in electrostatic interactions with DnaJ. Replacing arginine with alanine removes positive charges and may reduce binding affinity to the chaperone.
Alanine substitutions were chosen because alanine is small and structurally non-disruptive, allowing the protein to maintain overall folding while reducing interaction surfaces.
The transmembrane domain was left unchanged because it is important for lysis activity.
Conclusion
Mutant 1 remained structurally stable after introducing alanine substitutions in the soluble domain. The pLDDT score indicates that the mutant protein still folds with moderate confidence.
However, the ipTM score was low (0.165), indicating a weak predicted interaction between DnaJ and the mutant L-protein. This suggests that the introduced arginine-to-alanine substitutions may successfully reduce DnaJ binding while preserving overall protein structure.
The structural model also showed limited contact between the two proteins, supporting the hypothesis that these mutations weaken the DnaJ–L-protein interaction.
Among the generated AlphaFold2 multimer models, the top-ranked model (rank_001, model_4) was selected for analysis because it showed the highest predicted interaction confidence with an ipTM score of 0.149.
Metric
Value
pLDDT
74.4
pTM
0.523
ipTM
0.149
3D structure of top-ranked model (rank_001, model_4)
Explanation
This mutant was designed to improve autonomous folding of the L-protein and reduce dependence on DnaJ. The soluble domain contains multiple glutamine residues that may contribute to structural flexibility and chaperone dependence. Replacing some glutamines with leucine increases hydrophobic stabilization, while replacing others with alanine reduces polar interactions. These mutations may stabilize local folding and decrease the need for DnaJ-assisted folding.
The transmembrane region was not modified to preserve lysis function.
Conclusion
Mutant 2 remained structurally stable after introducing glutamine-to-leucine and glutamine-to-alanine substitutions in the soluble domain. However, the low ipTM score (0.149) indicates a weak interaction with DnaJ. These results suggest that the mutations may reduce DnaJ dependence while maintaining overall folding of the L-protein.
Week 6 HW: Genetic circuits part I
Assignment: DNA Assembly
1. Components of Phusion High-Fidelity PCR Master Mix and their functions
The Phusion High-Fidelity PCR Master Mix typically contains:
Phusion High-Fidelity DNA Polymerase A thermostable DNA polymerase with 3’→5’ exonuclease proofreading activity, which significantly reduces the error rate during DNA amplification.
dNTPs (dATP, dTTP, dCTP, dGTP) The nucleotide building blocks used for DNA strand synthesis.
Optimized reaction buffer (HF or GC buffer) Maintains optimal pH, salt concentration, and ionic conditions required for high-fidelity enzyme activity.
Mg²⁺ ions (MgCl₂) Essential cofactor for DNA polymerase activity; influences yield and specificity.
Stabilizing agents Improve enzyme stability and reaction robustness under thermal cycling conditions.
2. Factors affecting primer annealing temperature in PCR
The annealing temperature depends on:
Primer melting temperature (Tm) – the primary determinant
GC content – higher GC content increases Tm due to stronger hydrogen bonding
Primer length – longer primers generally have higher Tm
Sequence composition – base distribution affects duplex stability
Salt concentration (especially Mg²⁺) – stabilizes primer-template hybridization and increases effective Tm
Mismatches (e.g., intentional mutations) – reduce binding stability and lower effective annealing temperature
3’-end stability – a GC clamp increases binding specificity and efficiency
3. PCR vs Restriction Enzyme Digestion
PCR is a method used to amplify specific DNA fragments using sequence-specific primers.
Advantages:
Enables site-directed mutagenesis
Does not require restriction sites
Highly flexible for cloning design
Compatible with Gibson/HiFi assembly workflows
Limitations:
Risk of polymerase-induced mutations (even with high-fidelity enzymes)
Limited efficient fragment size (~up to 10 kb)
Restriction enzymes cut DNA at specific recognition sequences.
Advantages:
Highly predictable and precise cleavage
Produces defined sticky or blunt ends
Efficient for classical cloning workflows
Limitations:
Requires suitable restriction sites in the DNA
Can leave sequence “scars”
Less flexible for seamless cloning or mutagenesis
When to use each method
PCR is preferred when:
Introducing mutations (e.g., chromophore engineering in amilCP)
No suitable restriction sites are available
Using Gibson or HiFi assembly
Restriction digestion is preferred when:
Standard cloning vectors are used
Appropriate restriction sites are present
Performing traditional ligation-based cloning
4. Ensuring DNA compatibility for Gibson Assembly
To ensure successful Gibson assembly:
Design overlapping regions (20–40 bp) between adjacent fragments
Ensure overlaps are:
perfectly complementary
free of strong secondary structures
balanced in GC content
Maintain correct:
reading frame (for coding sequences)
fragment orientation
Verify:
no unintended mutations in coding regions
correct fragment order (backbone → insert → backbone logic)
5. How plasmid DNA enters E. coli during transformation
Plasmid DNA enters E. coli through temporary membrane permeabilization:
Heat shock transformation
CaCl₂ treatment neutralizes negative charges on DNA and membrane
Rapid temperature shift (0°C → 42°C) creates transient pores
DNA enters the cell by diffusion and electrochemical forces
Electroporation
High-voltage pulse creates temporary nanopores in the bacterial membrane
DNA passes directly through these pores into the cytoplasm
After transformation:
Cells recover in SOC medium
Express antibiotic resistance genes
Only successfully transformed cells survive on selective media
6. Alternative assembly method: Golden Gate Assembly
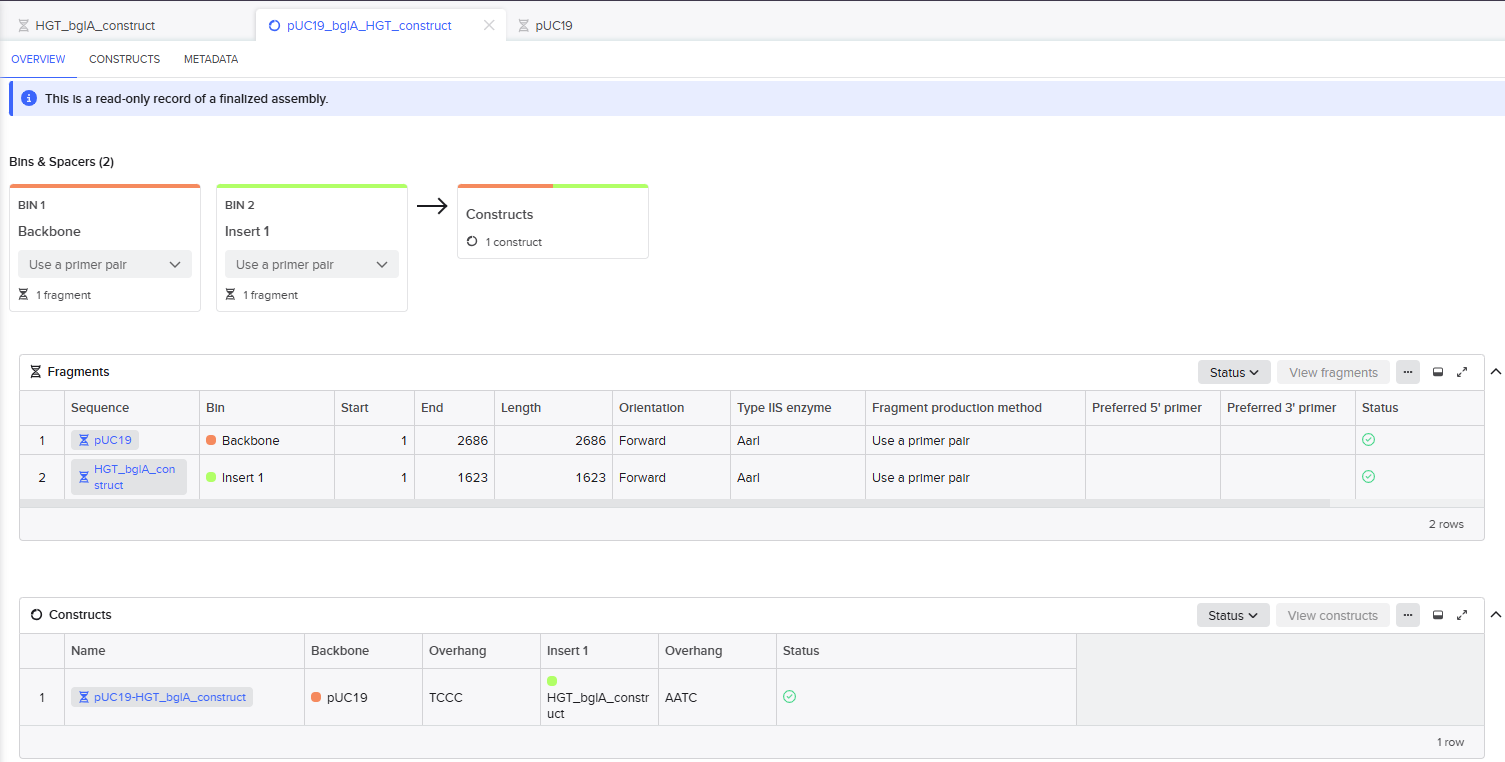
Golden Gate Assembly uses Type IIS restriction enzymes (e.g., AarI), which cut outside their recognition sites to generate custom overhangs. This enables directional assembly of multiple DNA fragments in a single reaction. The reaction cycles between 37°C (digestion) and 16°C (ligation), allowing simultaneous cutting and ligation steps. Because the recognition sites are removed during assembly, the final construct is seamless (“scarless”). This method is highly efficient for multi-part DNA assembly and library construction.
Schematic diagram
Fragment A          Fragment B          Fragment C
   AarI                AarI                AarI
    ↓                   ↓                   ↓

Cuts generate compatible sticky ends:

A ---------> B ---------> C

Ligation step (T4 DNA ligase):

Final construct:
A-B-C (scarless Golden Gate assembly)
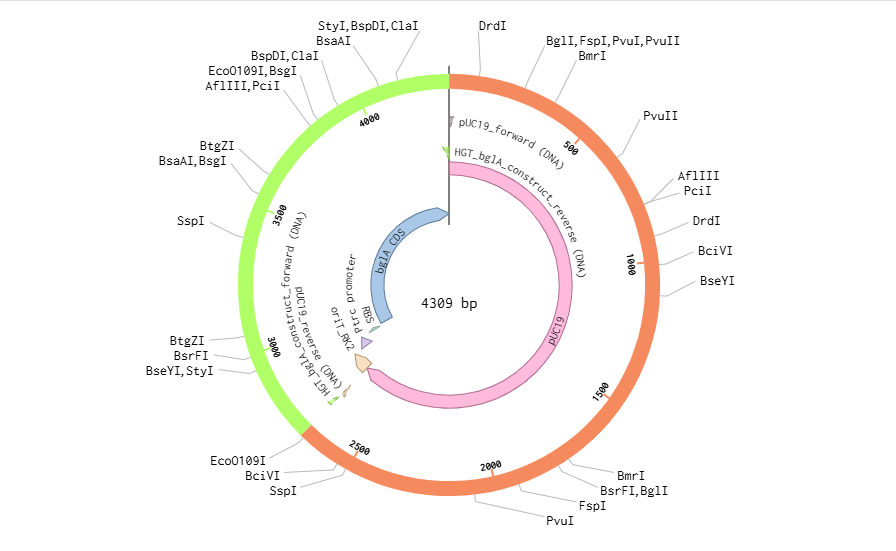
Simulation of the Golden Gate Assembly method in Benchling
The pUC19 backbone and the final project insert (oriT-Ptrc-RBS-bglA) were added. The Golden Gate AarI Type IIS enzyme was chosen as it didn’t cut sites in my selected fragments. The Golden Gate Assembly was created successfully.
Assignment: Asimov Kernel
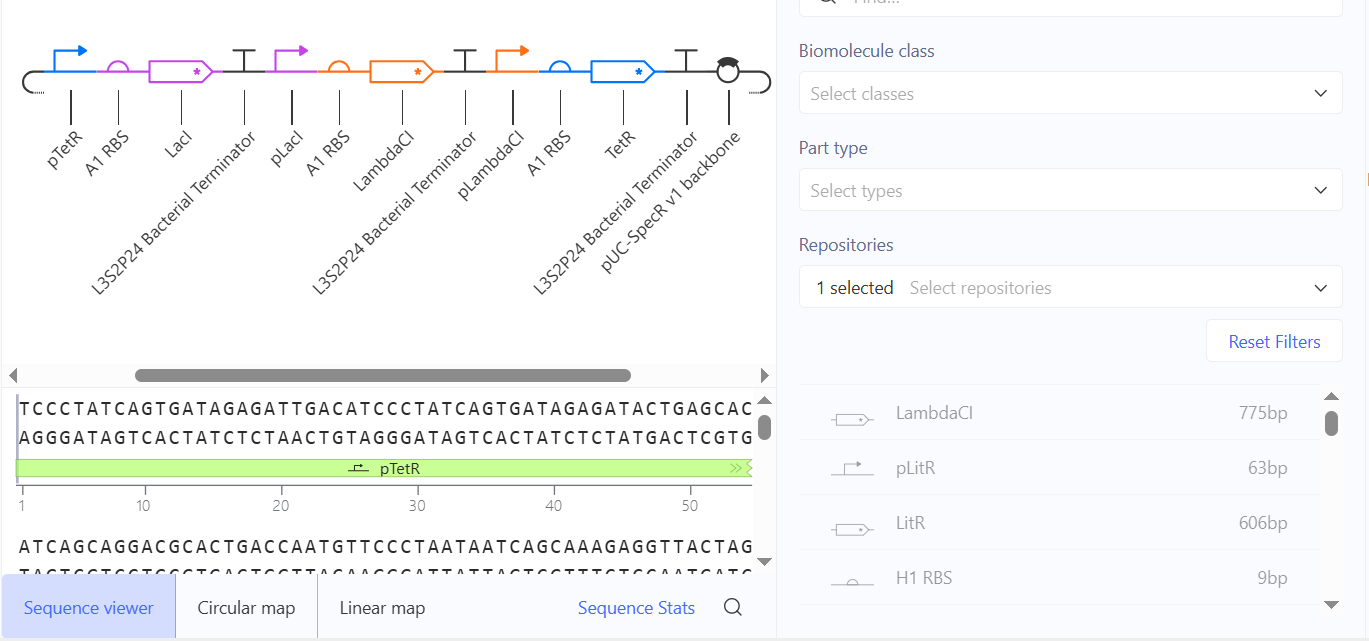
Repressilator Construct
I recreated the Repressilator by using parts from the Characterized Bacterial Parts repository.
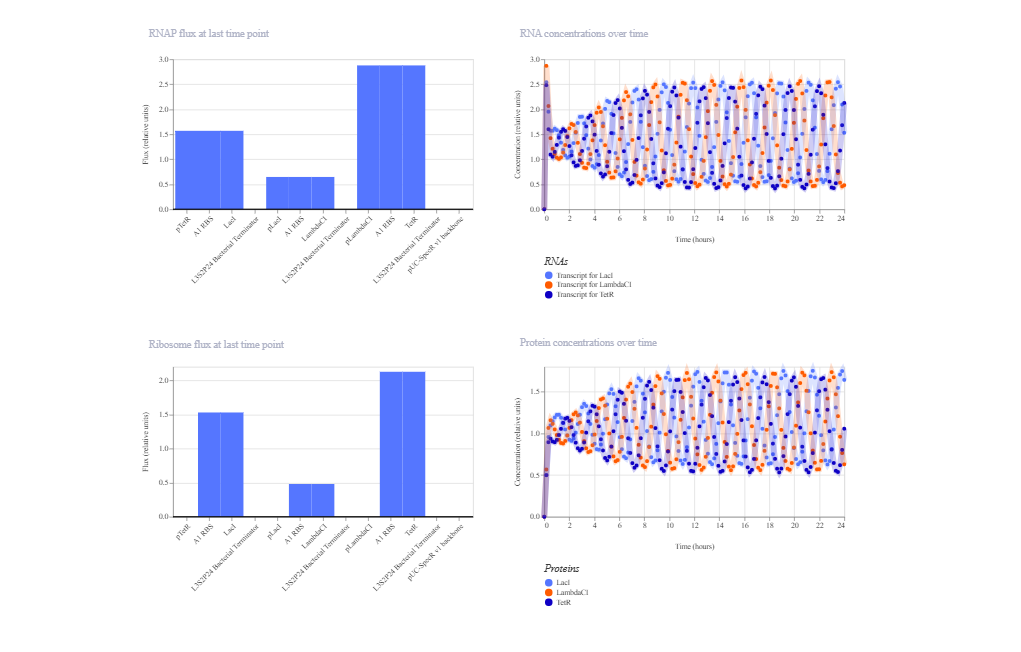
The repressilator circuit was simulated in Asimov Kernel under standard E. coli conditions (24 hours, 10-minute timestep, transient transfection, no ligands). The RNA and protein concentration plots show sustained oscillatory behavior of LacI, LambdaCI, and TetR over the full simulation period. The three proteins cycle out of phase, with each repressor periodically suppressing the next promoter in the loop, generating stable temporal oscillations. The RNA profiles mirror the protein oscillations with expected phase relationships and slight amplitude differences due to transcription–translation dynamics.
These results are consistent with the Repressilator construct in the Bacterial Demos repository, which also exhibits sustained, out-of-phase oscillations of the three repressors. The qualitative agreement in oscillation pattern, phase shift, and long-term stability confirms that the reconstructed circuit functions as expected.
My Constructs
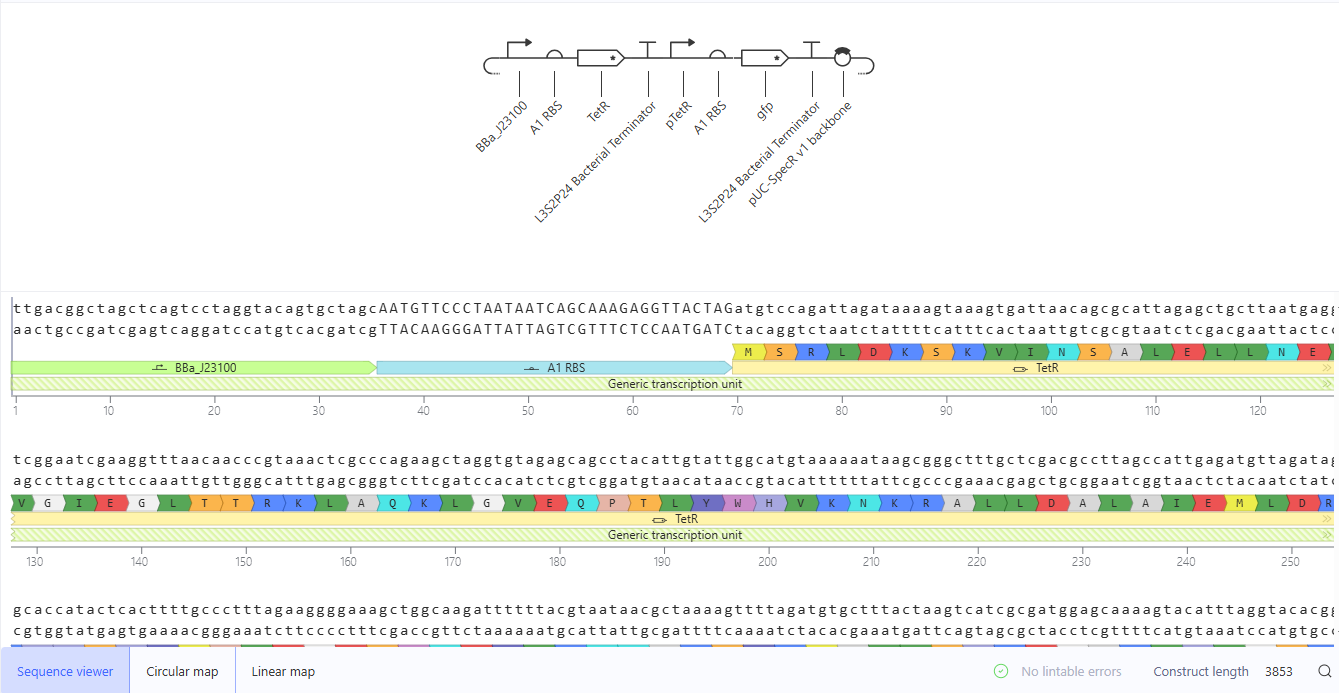
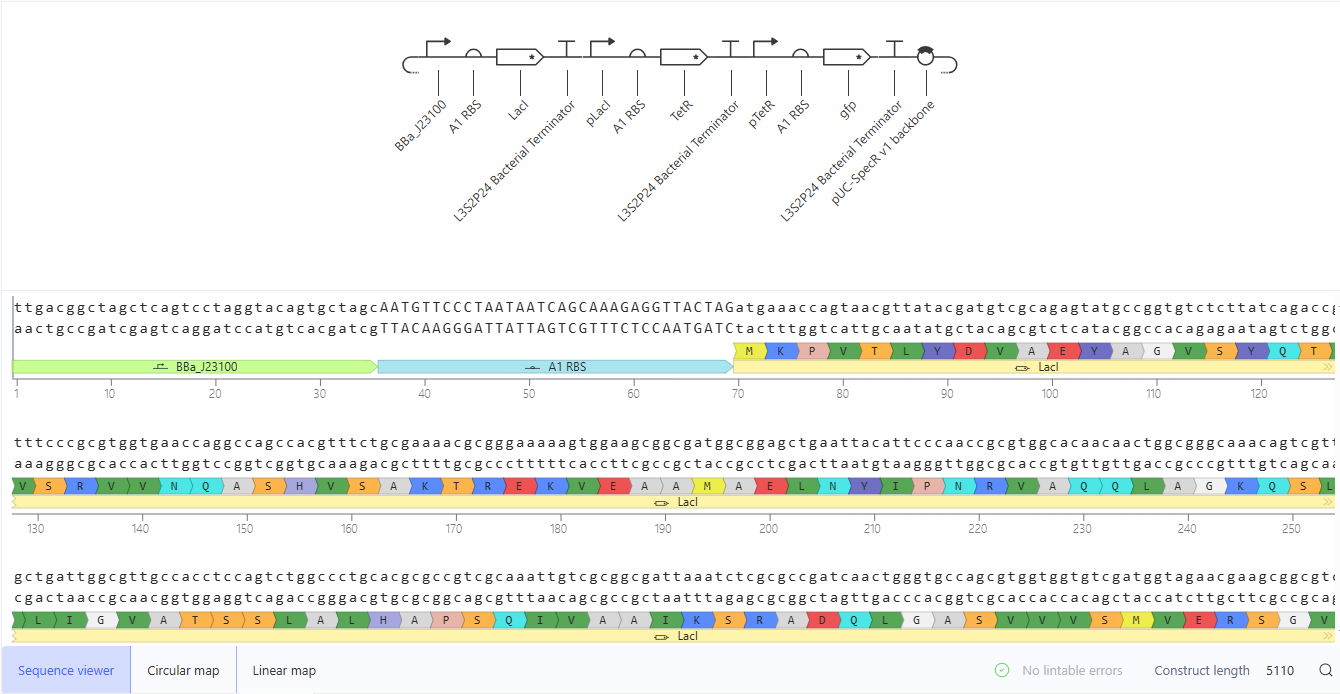
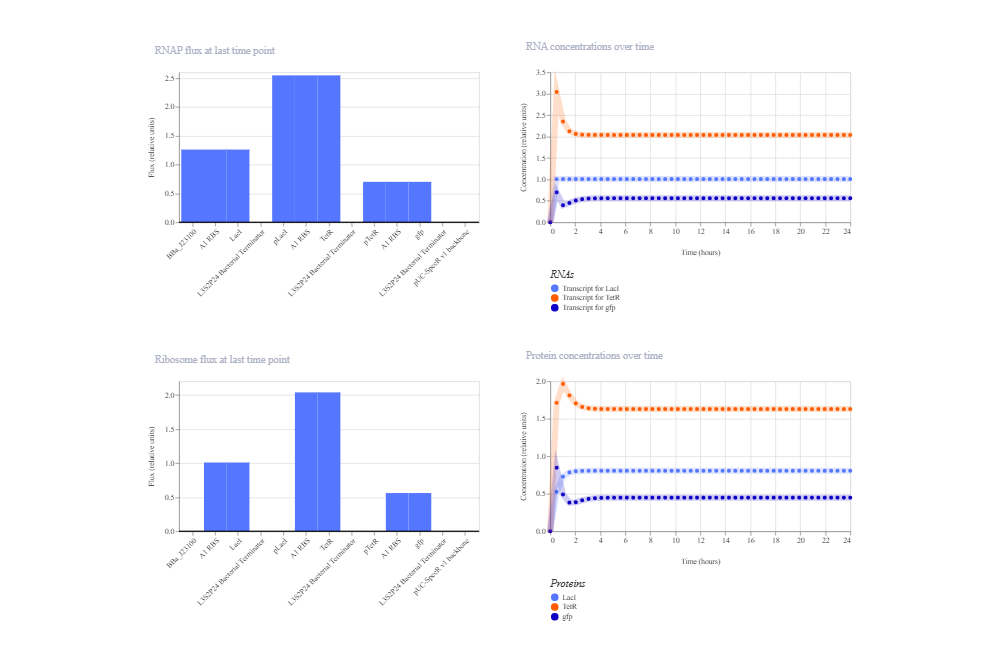
1. Simple Repression (TetR represses GFP)
This construct consists of constitutive TetR expression (J23100 → B0034 → TetR → Terminator) and a GFP reporter controlled by the TetR-repressible promoter pTetR. TetR is expected to repress pTetR, resulting in low GFP expression at steady state.
Simulation conditions:
Organism: E. coli, Transfection: Transient, Ligands: None, Duration 24 h, Timestep 30 min, no ligands
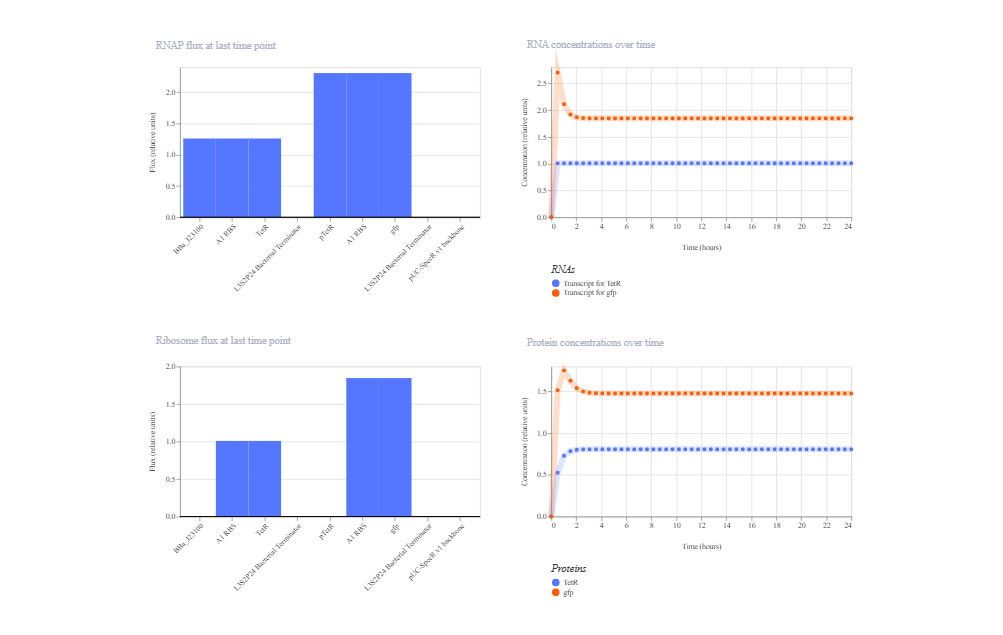
The simulation shows that the system reaches a stable steady state without oscillations. However, GFP repression is less pronounced than theoretically expected. This outcome is likely due to the balance between the strength of the constitutive TetR promoter, the basal (leaky) activity of pTetR, and the protein degradation parameters defined in the Kernel model. Overall, the circuit functions as a steady repression system, but repression efficiency is parameter-dependent.
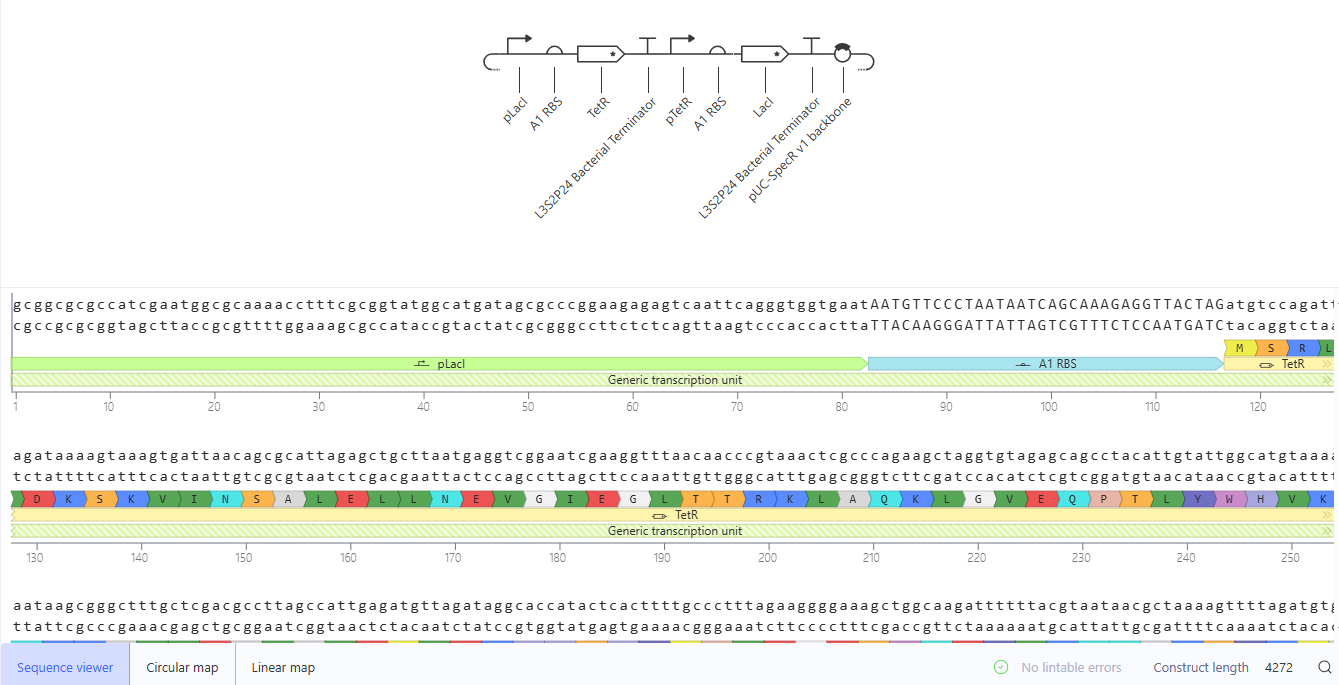
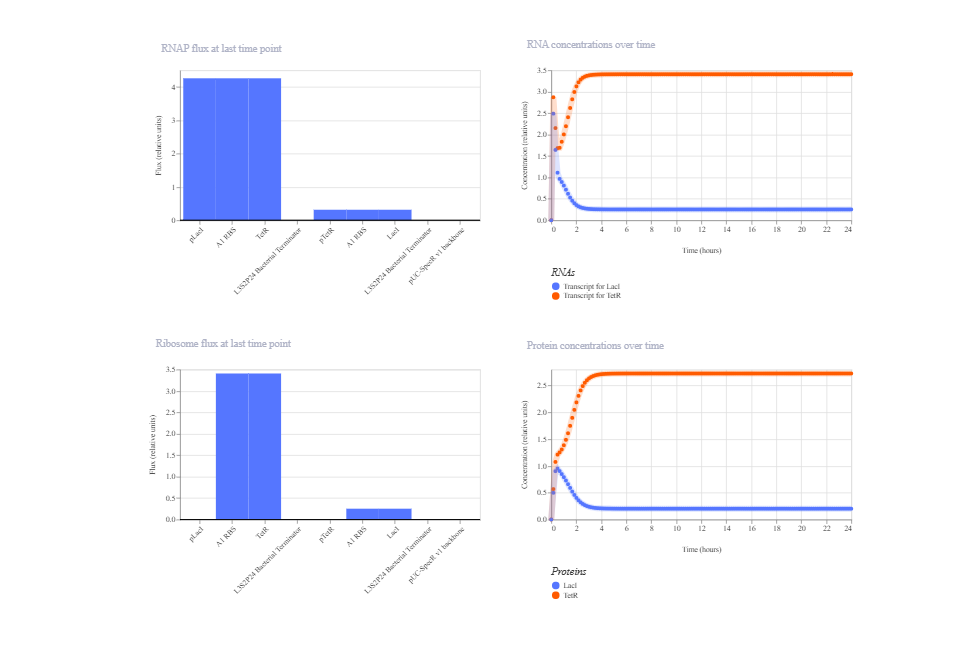
2. Double Negative Cascade
This construct implements a repression cascade: LacI is constitutively expressed and represses TetR via pLacI. TetR in turn represses GFP via pTetR. Because LacI suppresses TetR, repression of GFP should be relieved, leading to GFP expression at steady state.
Simulation conditions:
Organism: E. coli, Transfection: Transient, Ligands: None, Duration 24 h, Timestep 30 min, no ligands
The simulation matches the expected behavior of a linear repressive cascade: high LacI levels suppress TetR, resulting in activation of GFP expression. The system reaches a stable steady state without oscillations, consistent with cascade architecture. Minor deviations in expression levels can be explained by the balance of promoter strengths, RBS efficiencies, and degradation parameters specified in the Kernel model.
3. Toggle Switch (Mutual Repression)
This construct implements mutual repression between LacI and TetR. Each protein represses the promoter driving expression of the other, forming a bistable genetic toggle switch. The system is expected to stabilize in one of two possible states: LacI high/TetR low or TetR high/LacI low.
Simulation conditions:
Organism: E. coli, Transfection: Transient, Ligands: None, Duration 24 h, Timestep 10 min, no ligands
The simulation confirms the functioning of mutual repression and demonstrates robust bistable behavior. The system rapidly selects one dominant state (TetR high, LacI low) and maintains it throughout the simulation. This behavior is consistent with the theoretical toggle switch model, where the final state is determined by the balance of kinetic parameters, promoter strengths, and initial conditions defined in the Kernel simulation.
Week 7 HW: Genetic circuits part II
Assignment Part 1: Intracellular Artificial Neural Networks (IANNs)
1. What advantages do IANNs have over traditional genetic circuits, whose input/output behaviors are Boolean functions?
Intracellular Artificial Neural Networks (IANNs) provide several important advantages over traditional genetic circuits that operate using Boolean logic gates such as AND, OR, and NOT. Traditional genetic circuits typically generate binary outputs, where genes are either “ON” or “OFF.” In contrast, IANNs can process information in a continuous and weighted manner, similar to artificial neural networks used in computational machine learning.
One major advantage of IANNs is their ability to perform analog signal processing. Biological environments are inherently noisy and variable; therefore, binary logic often oversimplifies intracellular dynamics. IANNs can integrate multiple molecular inputs with different weights and thresholds, enabling graded responses rather than discrete binary outcomes. This allows cells to make more nuanced decisions based on complex environmental conditions.
Another advantage is scalability and computational complexity. Boolean genetic circuits become increasingly difficult to engineer as the number of inputs grows because the number of required regulatory interactions expands rapidly. IANN architectures are more modular and compact, enabling implementation of higher-order decision-making processes using fewer genetic components.
IANNs also possess superior pattern-recognition capabilities. Since neural-network-like systems can classify multidimensional input patterns, they are better suited for applications such as disease-state detection, metabolic-state monitoring, or adaptive therapeutic responses. Traditional Boolean circuits struggle with ambiguous or overlapping biological signals because they rely on rigid thresholds.
IANNs may support adaptive and learning-like behaviors when combined with feedback regulation and dynamic tuning mechanisms. Although current synthetic biology implementations remain relatively simple, the neural-network paradigm offers a conceptual framework for constructing programmable living systems capable of sophisticated information processing.
2. Describe a useful application for an IANN; include a detailed description of input/output behavior, as well as any limitations an IANN might face to achieve your goal.
A highly promising application of IANN is intelligent cancer-cell detection and targeted therapeutic activation in mammalian cells.
In this system, the IANN would receive multiple intracellular molecular inputs associated with cancer progression. For example:
X1: concentration of oncogenic microRNA (e.g., miR-21),
X2: hypoxia-associated transcription factors,
X3: abnormal metabolic markers such as elevated lactate levels,
X4: DNA damage-response proteins.
Each input would regulate synthetic genetic components corresponding to weighted neuronal connections. The network would integrate these signals through regulatory interactions mediated by transcription factors, CRISPR regulators, or endoribonucleases such as Csy4.
The output layer would produce a therapeutic response only when the overall molecular profile strongly matches a cancerous state. Possible outputs include:
expression of apoptosis-inducing proteins,
activation of immune-signaling molecules,
release of fluorescent reporters for diagnostics,
controlled secretion of anticancer drugs.
Unlike Boolean circuits, which require exact combinations of signals, the IANN could classify partially overlapping or noisy molecular patterns. For example, moderate levels of hypoxia combined with high miR-21 expression might still trigger therapy even if another marker remains weak. This resembles probabilistic classification in artificial intelligence systems.
The input/output behavior would therefore be continuous and weighted:
low cumulative activation → no response,
intermediate activation → weak reporter signal,
high activation → strong therapeutic gene expression.
But several limitations remain:
Biological noise presents a major challenge. Gene-expression variability may distort weighted signal integration and reduce classification accuracy.
Scalability is limited by cellular resource competition. Large synthetic networks consume transcriptional and translational machinery, potentially impairing normal cellular function.
Precise tuning of regulatory weights and thresholds is difficult in living systems because promoter strengths, RNA degradation rates, and protein interactions vary across cells and environmental conditions.
Signal crosstalk between synthetic and endogenous pathways may generate unintended outputs or toxicity.
Evolutionary instability may occur over long timescales, as cells can mutate or silence synthetic constructs to reduce metabolic burden.
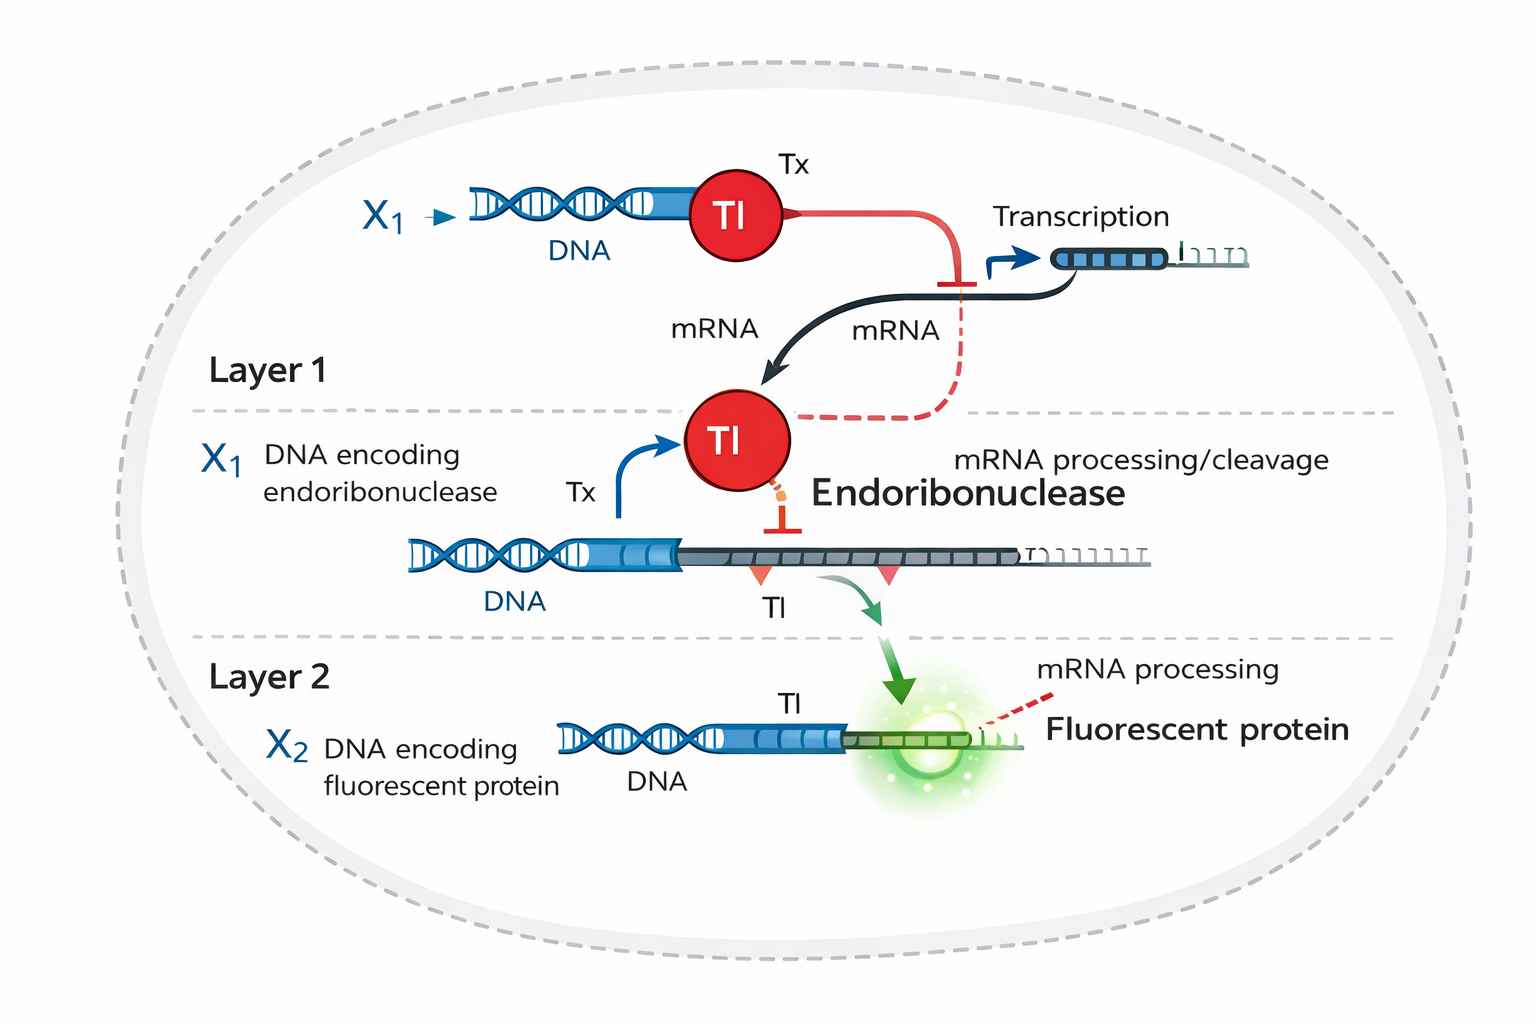
3
A diagram for an intracellular multilayer perceptron
Assignment Part 2: Fungal Materials
1.1 Mycelium-Based Composites
Applications:
Packaging materials (replacement for polystyrene foam)
Thermal and acoustic insulation panels
Construction biomaterials
Furniture and interior design elements
Principle: Mycelium (the vegetative body of fungi) grows through a lignocellulosic substrate (e.g., sawdust, agricultural waste), binding particles into a cohesive composite. Growth is terminated by heat treatment.
Advantages:
Biodegradable
Utilize agricultural waste as feedstock
Lower energy consumption compared to plastics and cement production
Reduced carbon footprint
Disadvantages:
Lower mechanical strength compared to synthetic polymers and concrete
Moisture sensitivity (if untreated)
Limited standardization of material properties
1.2 Mycelium Leather
Applications:
Footwear
Bags and accessories
Clothing
Automotive interiors
Advantages:
Alternative to animal leather without livestock production
Potentially lower environmental impact
Tunable texture and thickness
Disadvantages:
Mechanical durability may be inferior to high-quality natural leather
Often requires coatings or treatments, which may reduce biodegradability
1.3 Chitin and Chitosan
Applications:
Biomedical materials (wound dressings, drug delivery systems)
Biodegradable films
Water purification (adsorbents)
Advantages:
Biocompatible
Antimicrobial properties (especially chitosan)
Biodegradable
Disadvantages:
Higher cost compared to conventional synthetic polymers
Limited mechanical strength unless combined into composites
2.1 Enhancement of Mechanical Properties
Increased synthesis of chitin or β-glucans
Modification of cell wall architecture
Goal: to create stronger, more durable structural biomaterials.
2.2 Control of Morphogenesis
Regulation of hyphal branching
Control over mycelial density
Goal: to standardize material properties and control porosity and mechanical performance.
2.3 Bioremediation Enhancement
Upregulation of oxidoreductases (e.g., laccases, peroxidases)
Goal: to improve degradation of xenobiotics, plastics, and petroleum-derived pollutants.
The advantages of doing synthetic biology in fungi as opposed to bacteria
Fungi are eukaryotes and therefore capable of post-translational modifications, proper folding of complex multidomain proteins, secretion of functional eukaryotic proteins
Filamentous fungi naturally secrete large quantities of enzymes into the extracellular environment, simplifying downstream processing in industrial applications.
Mycelium forms natural three-dimensional networks, making fungi uniquely suited for growing structural materials without requiring an external scaffold. Bacteria typically require additional matrices to achieve similar structures.
Assignment Part 3: First DNA Twist Order
1.Final Project Title
Bioprinting horizontal gene transfer: a bacterial “photocamera”
Short Final Project Description
This project visualises horizontal gene transfer (HGT) in E. coli using a bioprinting system that functions as a bacterial “photocamera”. Donor and recipient strains are printed directly in spatially defined layers onto chromogenic agar; successful conjugation events are revealed by a pink-to-teal colour transition as recipients acquire the β-glucosidase gene (bglA) from Enterococcus faecalis. The project integrates synthetic biology, triparental mating, and bioart to create living images where gene transfer becomes literally visible as evolving colour.
Aim 1: Experimental Aim
The first aim of my final project is to visualise plasmid-mediated horizontal gene transfer between spatially organised E. coli populations by utilising a triparental mating system combined with direct chromogenic bioprinting on selective chromogenic agar.
This aim will be achieved through:
Plasmid design: cloning the bglA β-glucosidase gene from Enterococcus faecalis into a mobilizable vector backbone (e.g., pBBR1MCS series with oriT) carrying an appropriate antibiotic resistance marker, using Benchling for sequence design and Twist/IDT for gene synthesis
Strain construction: transforming the mobilizable bglA plasmid into donor E. coli; using pRK2013 (Addgene #37636) in a helper strain to provide conjugation machinery; maintaining an unmarked recipient strain with pink chromogenic phenotype
Bioprinting: spatially depositing donor, helper, and recipient cell suspensions in defined geometric patterns directly onto chromogenic agar using the lab bioprinter, creating layered arrangements that maximise cell-to-cell contact
HGT visualisation: incubating printed plates and observing colour transition from pink (recipient only) to teal (successful HGT of bglA) as the spatial visual readout of gene transfer; transconjugants confirmed by replating on selective agar with the corresponding antibiotic
Methods / Resources: triparental mating protocol, chromogenic agar, selective agar with antibiotic (to be confirmed based on vector choice), bioprinter, Benchling (plasmid design), Twist Biosciences (gene synthesis), pRK2013 (Addgene #37636), standard E. coli transformation workflow.
I selected Addgene, Twist Biosciences, New England Biolabs, and Opentrons because they collectively cover both the scientific reproducibility and artistic visualization goals of my bacterial “photocamera” of my project. That consists of plasmid sourcing and gene synthesis to cloning reagents and bioprinting automation. Addgene provides the essential pRK2013 helper plasmid for triparental mating, Twist enables rapid bglA gene synthesis from design to DNA, and NEB supports the molecular cloning workflow. Opentrons brings automation expertise relevant to spatial bioprinting of bacterial suspensions.
Homework Part A: General and Lecturer-Specific Questions
General homework questions
1. Explain the main advantages of cell-free protein synthesis over traditional in vivo methods, specifically in terms of flexibility and control over experimental variables. Name at least two cases where cell-free expression is more beneficial than cell production.
Flexibility:
All components (DNA template, ribosomes, substrates, cofactors, chaperones, detergents) can be added, removed, or tuned in real time without the constraints of cellular membranes or homeostasis.
No need for cloning, transformation, culture optimization, or induction. Protein production begins within minutes to hours.
Proteins that are lethal to cells, misfolded in vivo, or subject to proteolytic degradation can be synthesized without harming host viability.
Control over experimental variables:
can be precisely set and maintained.
easier than metabolic incorporation; simply add ncAA and orthogonal tRNA/synthetase.
ATP/GTP levels and redox balance (NAD⁺/NADH) can be independently controlled.
Two cases where cell-free is more beneficial:
1: Production of toxic or membrane-disruptive proteins. These proteins lyse or kill host cells, preventing scalable in vivo production. Cell-free systems bypass cell viability entirely.
2: Incorporation of multiple non-canonical amino acids for structural/biophysical studies. Metabolic incorporation in vivo is limited by cellular uptake, toxicity, and competition with natural amino acids. Cell-free systems allow direct supplementation of ncAAs at high concentrations with orthogonal suppressor tRNAs, achieving near-complete incorporation at desired positions.
2. Describe the main components of a cell-free expression system and explain the role of each component.
A typical prokaryotic cell-free system (e.g., E. coli S30 or PURE system) contains:
Component
Role
Cell lysate or reconstituted translation machinery
Provides ribosomes (30S + 50S subunits), translation factors (IF, EF-Tu, EF-G, RF), aminoacyl-tRNA synthetases, and chaperones. In PURE systems, each component is individually purified and defined.
DNA template or mRNA
Encodes the target protein. Linear DNA (PCR product) or plasmid with a T7 (or SP6) promoter is commonly used. mRNA can be added directly if pre-synthesized.
T7 RNA polymerase (if using DNA template)
Transcribes DNA into mRNA in situ.
Amino acids (20 canonical + optional ncAAs)
Building blocks for protein synthesis.
tRNAs (charged or uncharged + synthetases)
Deliver amino acids to ribosomes; aminoacyl-tRNA synthetases charge tRNAs.
Energy substrates
ATP, GTP, CTP, UTP for transcription and translation; phosphoenolpyruvate (PEP) or creatine phosphate for ATP regeneration.
Energy regeneration enzymes
Pyruvate kinase (uses PEP → pyruvate, regenerates ATP) or creatine kinase (uses creatine phosphate).
Salts and buffer
Mg²⁺ (critical for ribosome activity and nucleotide binding), K⁺, NH₄⁺, pH ~7–8 (Tris or HEPES buffer).
Redox system
NAD⁺/NADH, reduced glutathione, or DTT to maintain reducing conditions.
3. Why is energy provision and regeneration critical in cell-free systems? Describe a method you could use to ensure continuous ATP supply in your cell-free experiment.
ATP and GTP are rapidly consumed during transcription (NTP incorporation), translation (aminoacyl-tRNA charging, peptide bond formation, ribosome translocation), and chaperone activity.
Unlike living cells, cell-free systems lack glycolysis and oxidative phosphorylation and cannot regenerate ATP metabolically.
Without regeneration, ATP is depleted within minutes, halting protein synthesis prematurely and drastically reducing yield.
Cas9 is a bacterial protein with no requirement for glycosylation or complex eukaryotic PTMs.
High yield is desirable for genome editing applications and structural studies.
E. coli cell-free systems (especially PURE or S30 extracts) produce functional Cas9 rapidly and cost-effectively.
Can incorporate ncAAs for labeling or crosslinking studies without eukaryotic metabolism interference.
Protein choice for eukaryotic system:
Protein: Erythropoietin (EPO) – a therapeutic glycoprotein hormone
EPO requires N-linked glycosylation for stability, serum half-life, and biological activity.
Prokaryotic systems cannot perform glycosylation; EPO produced in E. coli is inactive or rapidly degraded in vivo.
Eukaryotic cell-free systems (e.g., CHO lysate, insect cell extract, or wheat germ supplemented with microsomes) can glycosylate nascent chains co-translationally or post-translationally.
Cell-free allows rapid prototyping of glycosylation site mutants without lengthy cell-line development.
5. How would you design a cell-free experiment to optimize the expression of a membrane protein? Discuss the challenges and how you would address them in your setup.
Challenges of membrane protein expression in cell-free systems:
Hydrophobicity → aggregation: Membrane proteins have large hydrophobic transmembrane domains that aggregate and precipitate in aqueous solution.
Loss of native structure and function: Without a lipid bilayer, transmembrane proteins misfold.
Low solubility and yield.
Experimental design to optimize membrane protein expression:
1. Choice of membrane-mimetic environment:
Detergent micelles
Add nonionic detergents (e.g., Brij-35, digitonin, DDM) or zwitterionic detergents (Fos-Choline) directly to the reaction.
6. Imagine you observe a low yield of your target protein in a cell-free system. Describe three possible reasons for this and suggest a troubleshooting strategy for each.
Reason 1: Inefficient transcription or translation initiation
Troubleshooting strategy:
Check DNA template integrity: run agarose gel to confirm template is intact and at expected size.
Verify transcription: isolate RNA from a small aliquot of the reaction and run on denaturing gel or use RT-qPCR to quantify mRNA levels. Low mRNA → transcription problem.
Optimize RBS/5′ UTR: test different spacing between RBS and start codon (optimal is ~5–9 nt for E. coli); use strong synthetic RBS sequences (e.g., BBa_B0034).
Add more T7 RNA polymerase or fresh enzyme if transcription is limiting.
Reason 2: Protein aggregation or misfolding
Troubleshooting strategy:
Add molecular chaperones: supplement with DnaK/DnaJ/GrpE (Hsp70 system), GroEL/ES, or trigger factor.
Adjust redox conditions: for proteins requiring disulfide bonds, add oxidized glutathione (GSSG) or protein disulfide isomerase (PDI). For reducing environment, add DTT or β-mercaptoethanol.
Lower reaction temperature: reduce from 37°C to 25–30°C to slow synthesis and allow more time for folding.
Check solubility: centrifuge reaction and analyze supernatant vs pellet by SDS-PAGE. If protein is in pellet, it aggregated → try detergents or co-expression of solubility tags (MBP, SUMO).
Reason 3: Rapid degradation of the target protein
Troubleshooting strategy:
Add protease inhibitors: include a cocktail (e.g., PMSF, leupeptin, pepstatin, aprotinin, or EDTA-free complete protease inhibitor tablets).
Use nuclease-treated lysates: commercial kits often pre-treat extracts to remove nucleases and reduce protease activity.
Time-course experiment: sample the reaction at multiple time points (e.g., 30 min, 1 h, 2 h, 4 h) and run Western blot or SDS-PAGE. If protein appears early then disappears → degradation. If it never appears → synthesis problem.
Stabilize protein: add ligands, substrates, or cofactors that stabilize the native fold.
Check sequence: ensure no internal stop codons, frameshifts, or rare codons that stall ribosomes (leading to abortive peptides).
Homework question from Kate Adamala
1. Pick a function and describe it
a1. What would your synthetic cell do?
The synthetic minimal cell (SMC) will function as a heavy metal biosensor and detoxification system. It will detect toxic mercury ions (Hg²⁺) in water and respond by producing a fluorescent signal and binding the mercury ions to reduce toxicity.
a2. What is the input and output?
Input: Mercury ions (Hg²⁺)
Output:
Green fluorescent protein (GFP) signal
Mercury-binding protein (MerP)
b. Could this function be realized by cell-free Tx/Tl alone, without encapsulation?
Partially, yes. A cell-free Tx/Tl system could detect Hg²⁺ and produce GFP in solution. However, encapsulation is important because:
it protects the reaction components,
increases system stability,
prevents diffusion of proteins,
allows controlled interaction with the environment.
c. Could this function be realized by genetically modified natural cells?
Yes. Genetically modified E. coli could perform the same task using the mercury resistance operon. However, synthetic minimal cells are safer because:
they are non-living,
they cannot replicate,
they reduce biosafety concerns,
they are easier to control experimentally.
d. Describe the desired outcome of your synthetic cell operation.
When mercury ions are present:
Hg²⁺ enters the synthetic cell.
A mercury-responsive genetic circuit activates.
GFP fluorescence is produced.
MerP binds mercury ions.
The contaminated sample becomes fluorescent and partially detoxified.
2. Design all components that would need to be part of your synthetic cell
A bacterial transcription/translation system containing:
ribosomes,
tRNAs,
amino acids,
RNA polymerase,
ATP regeneration system,
nucleotides,
cofactors.
Small molecules
ATP
GTP
amino acids
Mg²⁺ ions
K⁺ buffer
phosphoenolpyruvate (energy source)
DNA plasmids
Plasmids encoding:
Mercury-responsive regulator (merR)
Green fluorescent protein (gfp)
Mercury-binding protein (merP)
Membrane pore protein (hla)
c. Which organism will the Tx/Tl system come from?
The Tx/Tl system will come from bacterial E. coli extract. A bacterial system is sufficient because:
mercury-responsive promoters naturally exist in bacteria,
bacterial Tx/Tl systems are inexpensive and robust,
no mammalian-specific regulation is required.
d. How will your synthetic cell communicate with the environment?
Mercury ions are small enough to diffuse slowly through lipid membranes. To improve transport efficiency, the membrane will contain pores formed by α-hemolysin.
b. How will you measure the function of your system?
Measure GFP fluorescence using fluorescence microscopy, microplate reader, flow cytometry.
Measure mercury removal using atomic absorption spectroscopy (AAS), ICP-MS (inductively coupled plasma mass spectrometry).
Homework question from Peter Nguyen
One-Sentence Pitch
Freeze-dried cell-free biosensor systems embedded in façade panels enable buildings to detect airborne pollutants and trigger visible color changes or catalytic neutralization in response to poor air quality.
How the Idea Works
The concept integrates freeze-dried, cell-free synthetic biology systems directly into porous architectural materials such as façade tiles, wall panels, or concrete coatings. These systems contain DNA-encoded biosensors that respond to specific airborne pollutants (e.g., NOx, SO₂, formaldehyde, or particulate-associated toxins).
Upon activation by environmental moisture (rain, humidity, or condensation), the cell-free reaction initiates transcription–translation processes that produce either:
A visible pigment (e.g., chromoprotein) that changes the color of the surface to signal pollution levels, and/or
An inducible enzyme (e.g., oxidoreductases or peroxidases) capable of catalytically degrading certain pollutants at the material surface.
The biological components are compartmentalized in microcapsules distributed throughout the material matrix. When exposed to specific chemical triggers, the capsules activate locally, enabling spatially resolved sensing across the building envelope.
Societal Challenge / Market Need
Urban air pollution is a major public health issue linked to respiratory and cardiovascular diseases. However, pollution monitoring infrastructure is sparse, expensive, and often spatially limited. Buildings themselves represent large, underutilized surface areas in cities.
This system transforms passive architectural surfaces into distributed environmental sensors and potentially active remediation platforms. It addresses the need for:
Hyperlocal, real-time pollution monitoring
Increased public awareness of environmental conditions
Integration of sustainability and smart functionality into construction materials
Addressing Limitations of Cell-Free Systems
1. Water Activation
Freeze-dried systems are naturally stable in dry conditions and activate upon hydration. In architecture, this can be leveraged by designing materials that respond specifically to rain events or high humidity, which often correlate with pollutant deposition.
2. Stability
The cell-free components can be stabilized using:
Trehalose or other lyoprotectants
Polymer encapsulation
UV-protective coatings
Encapsulation in hydrogel microdomains within the material can further enhance thermal and environmental stability.
3. One-Time Use Limitation
The material can contain distributed micro-reservoirs that activate sequentially over time.
Replaceable surface coatings or modular façade tiles can be designed for periodic renewal.
Alternatively, the system can be designed as an event-reporting sensor (e.g., long-term color change after threshold exposure), functioning as a cumulative environmental record rather than a continuously active device.
Homework question from Ally Huang
1. Provide background information that describes the space biology question or challenge you propose to address. Explain why this topic is significant for humanity, relevant for space exploration, and scientifically interesting.
Long-duration spaceflight exposes astronauts to elevated levels of ionizing radiation, increasing the risk of DNA damage, cancer, and degenerative diseases. Current monitoring systems primarily measure physical radiation dose rather than biological impact. A lightweight, low-resource method to assess functional DNA damage in space would improve astronaut health monitoring and countermeasure development. Cell-free systems are particularly suitable for space missions due to their stability, low mass, and independence from living cells. Developing a molecular assay that links radiation exposure to functional gene expression capacity addresses a critical challenge for deep-space exploration missions to the Moon and Mars.
2. Name the molecular or genetic target that you propose to study. Examples of molecular targets include individual genes and proteins, DNA and RNA sequences, or broader -omics approaches.
Radiation-induced DNA double-strand breaks in a GFP reporter plasmid, quantified through reduction of functional protein expression in the BioBits® cell-free system.
3. Describe how your molecular or genetic target relates to the space biology question or challenge your proposal addresses.
Ionizing radiation induces DNA double-strand breaks (DSBs), among the most severe forms of genomic damage. DSBs disrupt gene integrity and impair transcription and translation. A plasmid encoding GFP can serve as a functional reporter: radiation-induced strand breaks decrease or abolish GFP expression in a cell-free system. Therefore, fluorescence intensity directly reflects template integrity. This strategy measures biologically meaningful damage rather than only absorbed radiation dose. By linking molecular lesions to protein synthesis capacity, the assay provides insight into how radiation may compromise essential genetic processes during spaceflight.
4. Clearly state your hypothesis or research goal and explain the reasoning behind it.
Space radiation exposure reduces functional GFP expression from a reporter plasmid in the BioBits® cell-free system in proportion to accumulated DNA damage.
Ionizing radiation generates strand breaks and base modifications that interfere with transcription and translation. If a GFP-encoding plasmid is exposed to spaceflight conditions and subsequently used in a cell-free protein expression reaction, DNA lesions should decrease protein yield. By comparing fluorescence output between spaceflight-exposed and Earth-based control plasmids, we can quantify functional DNA integrity. This approach provides a biologically relevant readout of radiation damage using minimal hardware. The research goal is to validate a compact, rapid assay capable of assessing molecular radiation damage during long-duration space missions.
5. Outline your experimental plan - identify the sample(s) you will test in your experiment, including any necessary controls, the type of data or measurements that will be collected, etc.
Identical GFP plasmid samples will be divided into: (1) spaceflight-exposed samples and (2) ground-based controls. After exposure, plasmids may be amplified using the miniPCR® (to assess amplifiability) and then expressed using the BioBits® cell-free protein expression system. GFP fluorescence will be measured with the P51 Molecular Fluorescence Viewer. Controls include no-DNA reactions (negative control) and non-exposed plasmid reactions (positive control). Fluorescence intensity will be quantified and normalized to DNA input. Reduced fluorescence in spaceflight samples relative to controls will indicate functional radiation-induced DNA damage.
Homework Part B: Individual Final Project
Week 10 HW: Imaging and measurement
Homework: Final Project
1. Conjugation Frequency (Quantitative HGT Efficiency)
What is measured: The ratio of transconjugants to total recipient cells — the primary numerical output of the experiment.
After overnight incubation on LB agar, cells are re-printed onto:
Plate A (no antibiotic) → counts all recipient colonies (pink) + donor (blue)
Plate B (+ ampicillin 100 µg/mL) → only AmpR transconjugants survive in recipient zones
Conjugation frequency = N(blue AmpR in recipient zone) / N(total recipient on Plate A)
2. Chromogenic Phenotype — Colorimetric Measurement (pink → blue transition)
What is measured: The spatial and quantitative shift in colony colour as a direct proxy for bglA expression and β-glucosidase enzymatic activity in transconjugants.
Flatbed scan of agar plates at high resolution (≥600 dpi)
Extract RGB pixel values per colony zone using ImageJ or Python
Pink colonies: H ≈ 330–350°; blue transconjugants: H ≈ 170–190°
Quantify the fractional area of blue signal within recipient-zone boundaries
Technologies:
Digital image analysis (ImageJ, ColourDeconvolution plugin)
3. Plasmid Presence in Transconjugants — Colony PCR
What is measured: Physical confirmation that the mobilizable plasmid (carrying oriT_RK2–Ptrc–RBS–bglA) has transferred into recipient cells.
Pick 12–24 blue AmpR colonies from Plate B recipient zones
Colony PCR with primers flanking bglA CDS (~950 bp amplicon) and a second primer pair spanning the oriT–Ptrc junction
Controls: donor lysate (positive), untransformed recipient (negative), water (NTC)
Technologies:
ATC Thermal Cycler using 96-Armadillo PCR plates
Reaction setup: Echo525 acoustic liquid handler for master mix dispensing into 384-well format (high-throughput screening of many colonies)
1% agarose gel electrophoresis with ethidium bromide / SYBR Safe staining, UV transilluminator; band at ~950 bp confirms transfer
What is measured: Direct enzymatic activity of the bglA gene product (aryl-phospho-β-D-glucosidase from E. faecalis) in cell lysates — the most quantitative functional readout.
Grow 3–5 blue transconjugant colonies overnight → pellet → lyse by bead-beating or freeze-thaw
Add pNPG (para-nitrophenyl-β-D-glucopyranoside) substrate to lysate in 96-well microplate
Read absorbance at 405 nm over time (kinetic assay, 30 min)
Compare: transconjugants vs. untransformed recipient vs. donor vs. blank
Technologies:
Spark Plate Reader or PHERAstar FSX — kinetic absorbance at 405 nm in 96-round-axygen half-deep plates
Reagent dispensing: Multiflo automated microplate dispenser for substrate addition
Data: calculate specific activity in nmol pNP / min / mg total protein (protein concentration by Bradford assay at 595 nm on same reader)
5. Spatial Resolution of Bioprinting — Image Analysis
What is measured: The geometric precision of the Opentrons OT-2 deposition — do donor and recipient zones remain spatially segregated, and how sharp is the boundary?
Scan plates before and after incubation
In ImageJ: draw intensity line profiles across zone boundaries → measure zone width, boundary sharpness (µm), and bleed-through area
Vary deposited volume (0.5 µL, 1 µL, 2 µL) and cell density (OD600 0.1–1.0) to optimize printing parameters
Technologies:
Flatbed scanner (600–1200 dpi)
ImageJ macro for automated line-profile extraction
Python + matplotlib for plotting bleed-through as a function of print volume
Homework: Waters Part I — Molecular Weight
1.
By using the molecular weight calculator provided by the ExPASy portal, the molecular weight of the N-terminally tagged eGFP presented above was calculated to be MWth = 28,006.60Da.
2.1.
From Figure 10.1 I chose two adjacent charge state peaks:
m/zₙ = 903.7148
m/zₙ₊₁ = 875.4421
Therefore:
903.7148 → z = 31
875.4421 → z = 32
2.2.
Based on the calculations of the previous segment the experimentally measured MW of eGFP is MWexp approximately 27,984Da
2.3.
By applying the mathematical formula, the accuracy of the measurement is approximately 8.1x10⁻⁴.
3.
The peaks in the zoomed-in region are not clearly separated, likely due to limited instrument resolution at this m/z range. Because the isotopic peaks are only partially resolved and somewhat noisy, it is difficult to directly determine the charge state from isotope spacing alone.
However, by counting the charge states from previously assigned peaks (moving toward higher m/z and decreasing the charge by one for each peak), the zoomed-in peak at m/z ≈ 1474 corresponds to approximately the 19 charge state.
Homework: Waters Part III — Peptide Mapping - primary structure
1.
Lysine (K): 20 residues. Arginine (R): 6 residues. Total K + R: 26.
The eGFP peptide map (Figure 5a) contains 21 chromatographic peaks between 0.5 and 6 minutes with >10% relative abundance. These are the labeled peaks at retention times:
0.61, 0.79, 1.20, 1.43, 1.80, 1.85, 1.93, 2.17, 2.26, 2.54, 2.78, 3.27, 3.53, 3.59, 3.70, 4.30, 4.48, 4.64, 4.87, 5.06, and 5.43 min.
All exceed 10% relative abundance (threshold: ~1.2e6 counts, based on the tallest peak at 4.87 min with ~1.2e7 counts).
4.
No, the numbers do not exactly match. There are more peaks (21) than predicted peptides (19). This difference can be explained by incomplete ionization, co-eluting peptides, very small peptides not retained well on the column, missed detection due to low abundance, or peptides outside the 0.5–6 min window.
5.
The most abundant (base) peak in the spectrum is at m/z 525.76712. The charge state of the most abundant form of the peptide is 2+.
To calculate the singly charged mass, I use: [M+H]+ = (m/z × z) − (z − 1) × 1.0073
By comparing the experimentally determined singly charged mass ([M+H]+ ≈ 1050.53 Da) with the theoretical tryptic peptide masses from the ExPASy PeptideMass tool, the peptide eluting at 2.78 min most likely corresponds to: FEGDTLVNR. The theoretical monoisotopic mass ([M+H]+) is: 1050.5214 Da.
Mass error: 12.2 ppm. The error is slightly above 10 ppm, which is typically considered the upper confidence threshold for peptide identification.
7.
According to Figure 6, the sequence coverage for eGFP is 88%.
Homework: Waters Part IV — Oligomers
Oligomer
Theoretical Mass (MDa)
Observed Peak (MDa)
7FU Decamer
3.4
~3.4
8FU Didecamer
8.0
~8.3
8FU 3-Decamer
12.0
~12.67
8FU 4-Decamer
16.0
~16
Homework: Waters Part V — Did I make GFP?
Theoretical
Observed/measured on the Intact LC-MS
PPM Mass Error
Molecular weight (kDa)
28.0066 kDa
27.9840 kDa
807 ppm
Yes, the data confirms the production of eGFP. The observed mass is in close agreement with the theoretical calculation (~28.0 kDa), with a relative mass error of 0.081% (807 ppm).
Week 11 HW: Bioproduction & Cloud Labs
Part A: The 1,536 Pixel Artwork Canvas | Collective Artwork
I contributed a one pixel on Q3 - H1 plate with mKO2 fluorescent protein, but it was overlapped by other contributions later.
My involvement in the artwork was limited to placing a single pixel, which I used primarily to familiarize myself with the interface. I also initially assumed that the canvas had a limited number of available pixels relative to the large number of course participants. Nevertheless, I found the concept of a collaborative artwork compelling, and its implementation through a great interactive website was thoughtfully designed and inspiring. Also I found the timelapse feature particularly valuable, as it effectively illustrated both the temporal evolution of the image and the conceptual development of the artwork over time.
Part B: Cell-Free Protein Synthesis | Cell-Free Reagents
1.
E. coli Lysate
Provides the core transcription–translation machinery, including ribosomes, tRNAs, aminoacyl-tRNA synthetases, metabolic enzymes, and cofactors. The BL21 (DE3) Star lysate specifically contains T7 RNA polymerase, enabling transcription from T7 promoter-driven DNA templates.
Salts / Buffer
Potassium Glutamate Maintains intracellular-like ionic strength and supports ribosomal stability and enzymatic activity.
HEPES-KOH (pH 7.5) Buffers the reaction environment to maintain optimal pH for transcription and translation.
Magnesium Glutamate Supplies Mg²⁺ ions, essential cofactors for ribosomes, RNA polymerase, ATP-dependent enzymes, and stabilization of nucleotides.
Potassium Phosphate Monobasic / Dibasic Contribute to buffering capacity and phosphate balance, supporting nucleotide metabolism and energy regeneration pathways.
Energy / Nucleotide System
Ribose Serves as a precursor for nucleotide biosynthesis, supporting sustained transcription.
Glucose Provides a carbon and energy source for endogenous metabolic enzymes in the lysate to regenerate ATP.
AMP, CMP, GMP, UMP Nucleotide monophosphates that are enzymatically converted into nucleotide triphosphates (ATP, GTP, CTP, UTP) required for RNA synthesis and energy transfer.
Guanine Precursor for GMP/GTP synthesis, supporting transcription and translation processes.
Translation Mix (Amino Acids)
17 Amino Acid Mix Supplies the majority of standard amino acids required for protein synthesis.
Tyrosine Added separately due to solubility limitations; required as a substrate for protein synthesis.
Cysteine Added separately due to oxidation sensitivity; essential for protein synthesis and disulfide bond formation.
Additives
Nicotinamide Precursor for NAD⁺ biosynthesis, supporting redox balance and metabolic reactions required for sustained energy regeneration.
Backfill
Nuclease-Free Water Adjusts the final reaction volume while preventing degradation of DNA or RNA templates.
2.
The 1-hour PEP-NTP system directly supplies phosphoenolpyruvate (PEP) and nucleotide triphosphates (NTPs), enabling rapid, high-level protein production but limiting reaction duration due to fast energy depletion. In contrast, the 20-hour NMP-Ribose-Glucose system relies on nucleotide monophosphates and simple carbon sources that are enzymatically converted into active nucleotides and ATP, allowing slower yet sustained protein expression through metabolic energy regeneration.
Part C: Planning the Global Experiment | Cell-Free Master Mix Design
1.
sfGFP (superfolder GFP) is engineered for highly efficient folding and rapid maturation, making it particularly robust in cell-free systems. Its fast chromophore formation allows fluorescence to appear quickly, which improves signal reliability during short incubations.
mRFP1 has a relatively slower maturation time compared to GFP variants, which can delay fluorescence readout in cell-free expression systems. In addition, red fluorescent proteins often require more efficient folding conditions to achieve maximal fluorescence.
mKO2 is an orange fluorescent protein with relatively fast maturation among orange/red fluorophores, which improves early fluorescence detection. However, it is somewhat sensitive to acidic conditions, meaning pH fluctuations in the reaction can reduce fluorescence intensity.
mTurquoise2 is a cyan fluorescent protein with very high quantum yield and brightness, producing strong fluorescence even at moderate expression levels. Proper folding is important for maintaining its efficient chromophore structure and high signal output.
mScarlet-I is a bright red fluorescent protein with improved folding efficiency and photostability, but it still requires longer maturation times than GFP-like proteins. In cell-free systems, prolonged energy availability is important to allow complete chromophore maturation and maximal fluorescence.
Electra2 is a fluorescent protein optimized for specific spectral or functional properties, but its fluorescence output can depend strongly on oxygen availability because chromophore maturation requires oxidation reactions. Limited oxygen diffusion in dense cell-free reactions may therefore reduce fluorescence efficiency.
2.-4.
Cell-Free protein expression optimization strategy
This experiment aims to optimize fluorescence output in a cell-free expression system over a 36-hour incubation by systematically targeting limiting biochemical factors. I selected two fluorescent proteins with distinct maturation kinetics:
sfGFP (fast-folding, rapid maturation)
mScarlet-I (slow maturation, higher dependence on sustained expression)
To maintain interpretability, a controlled experimental design is used, where each protein is optimized along a single dominant axis:
Fluorescence output of sfGFP is primarily limited by translation efficiency. Increasing magnesium glutamate concentration will enhance ribosome stability and catalytic activity, resulting in increased protein yield and fluorescence. Because sfGFP folds efficiently and matures rapidly, fluorescence output is expected to scale with total protein synthesis rather than maturation time.
Fluorescence output of mScarlet-I is limited by energy availability over extended incubation. Increasing glucose and ribose concentrations will prolong ATP regeneration, enabling sustained protein synthesis and improved chromophore maturation. mScarlet-I requires extended translation time and post-translational chromophore maturation. Thus, system longevity is the dominant constraint.
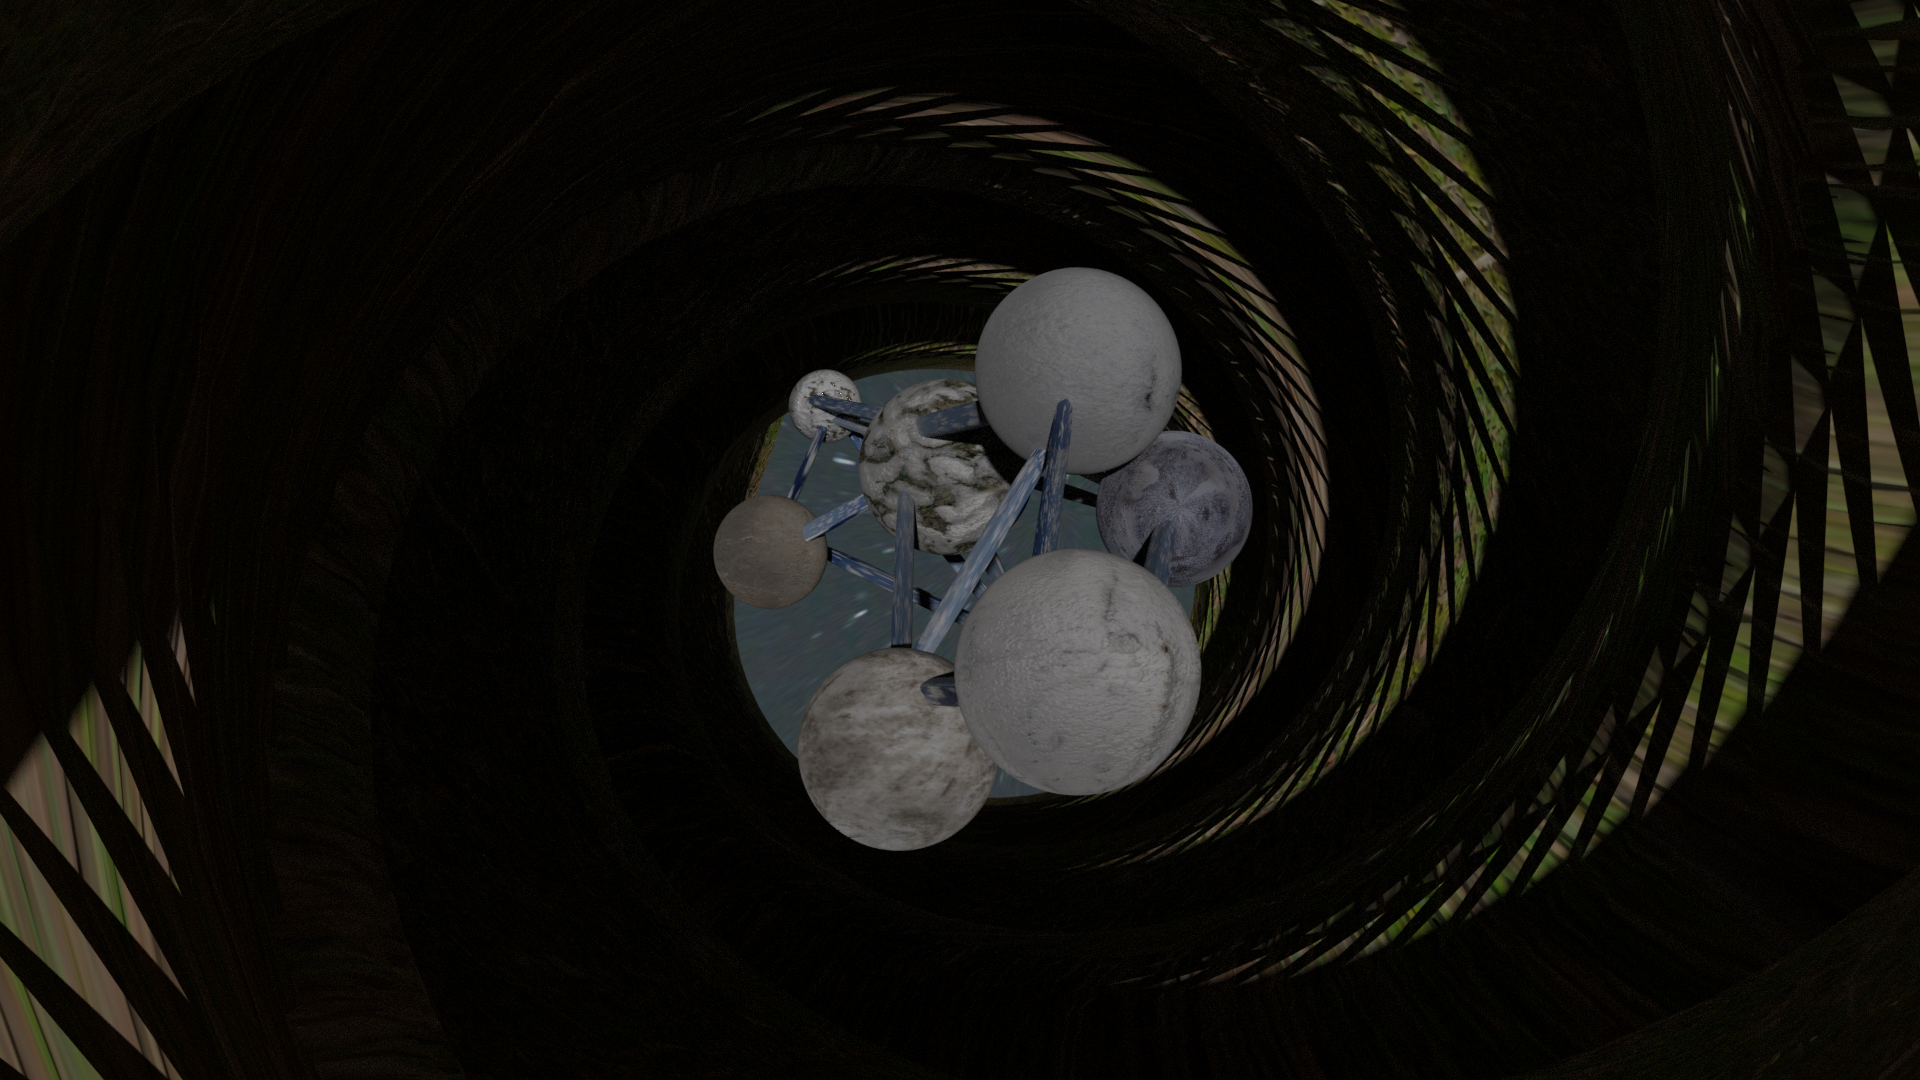
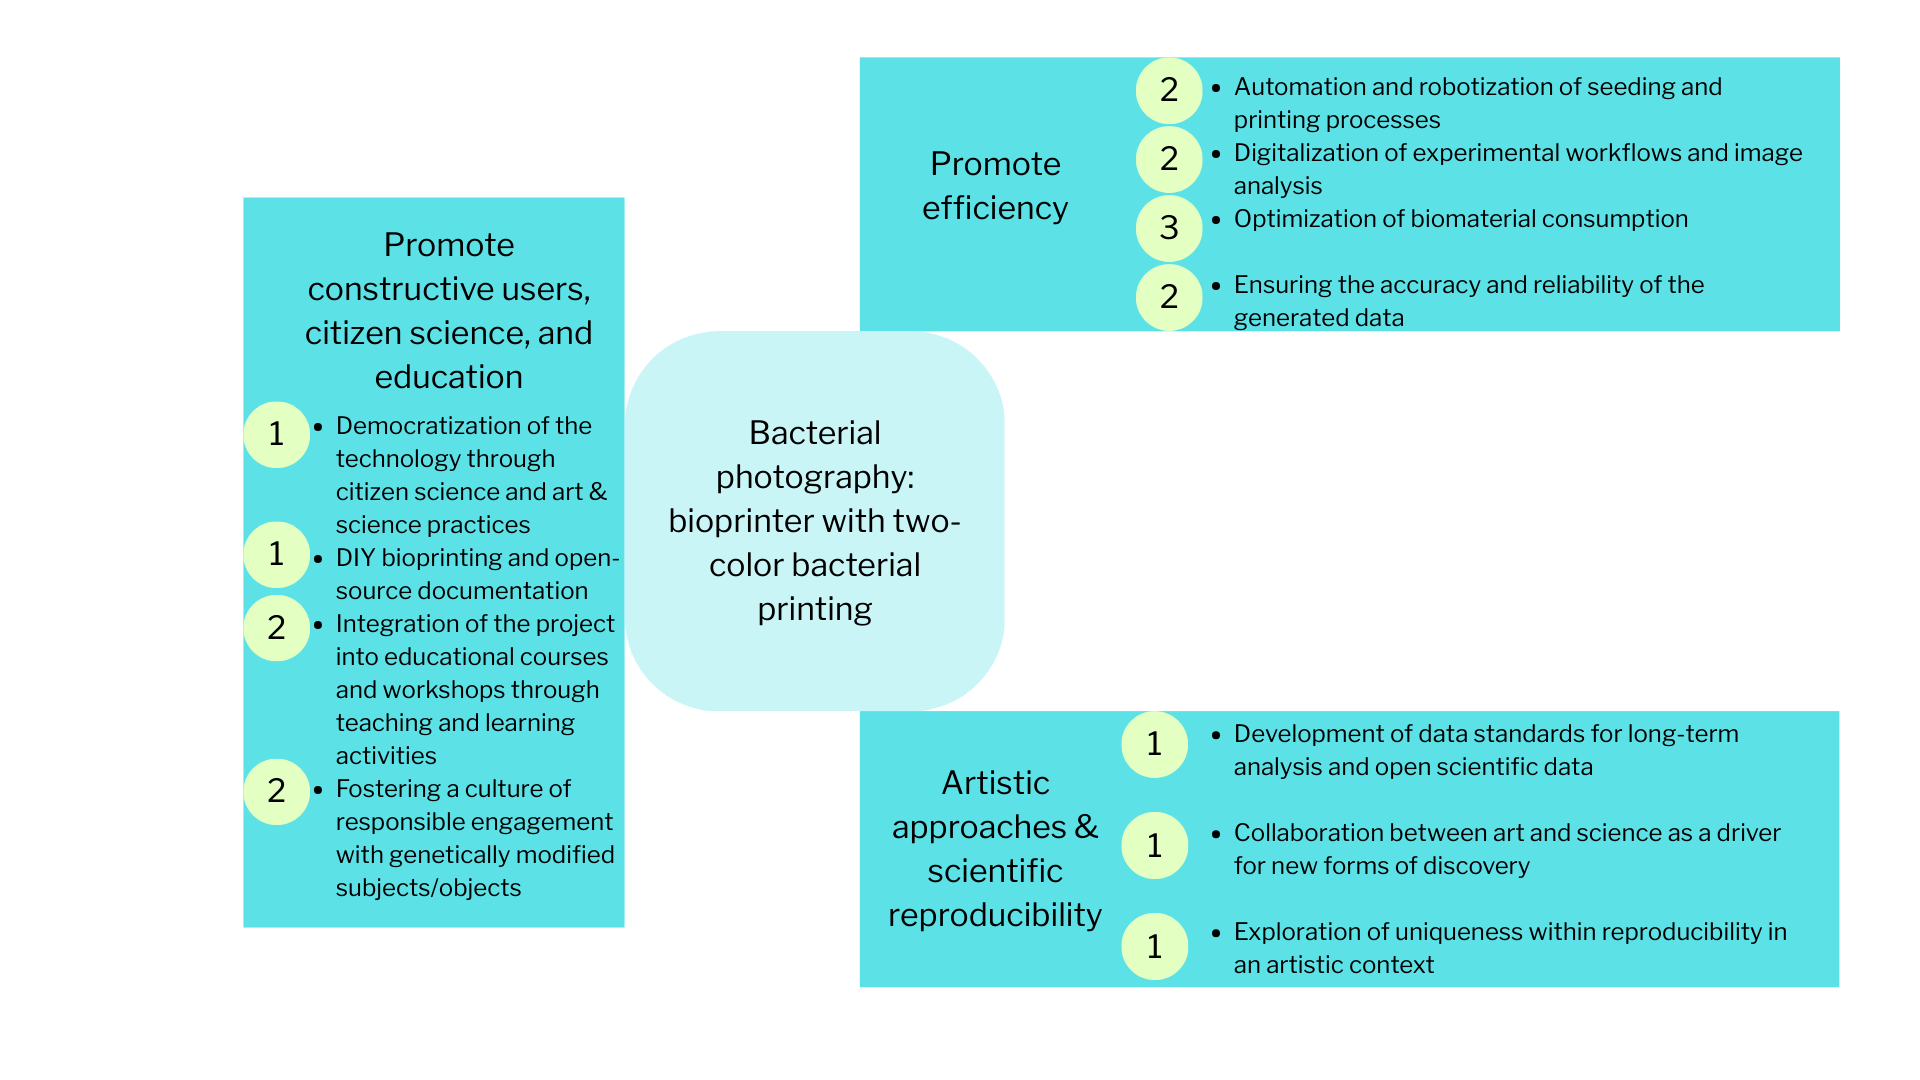
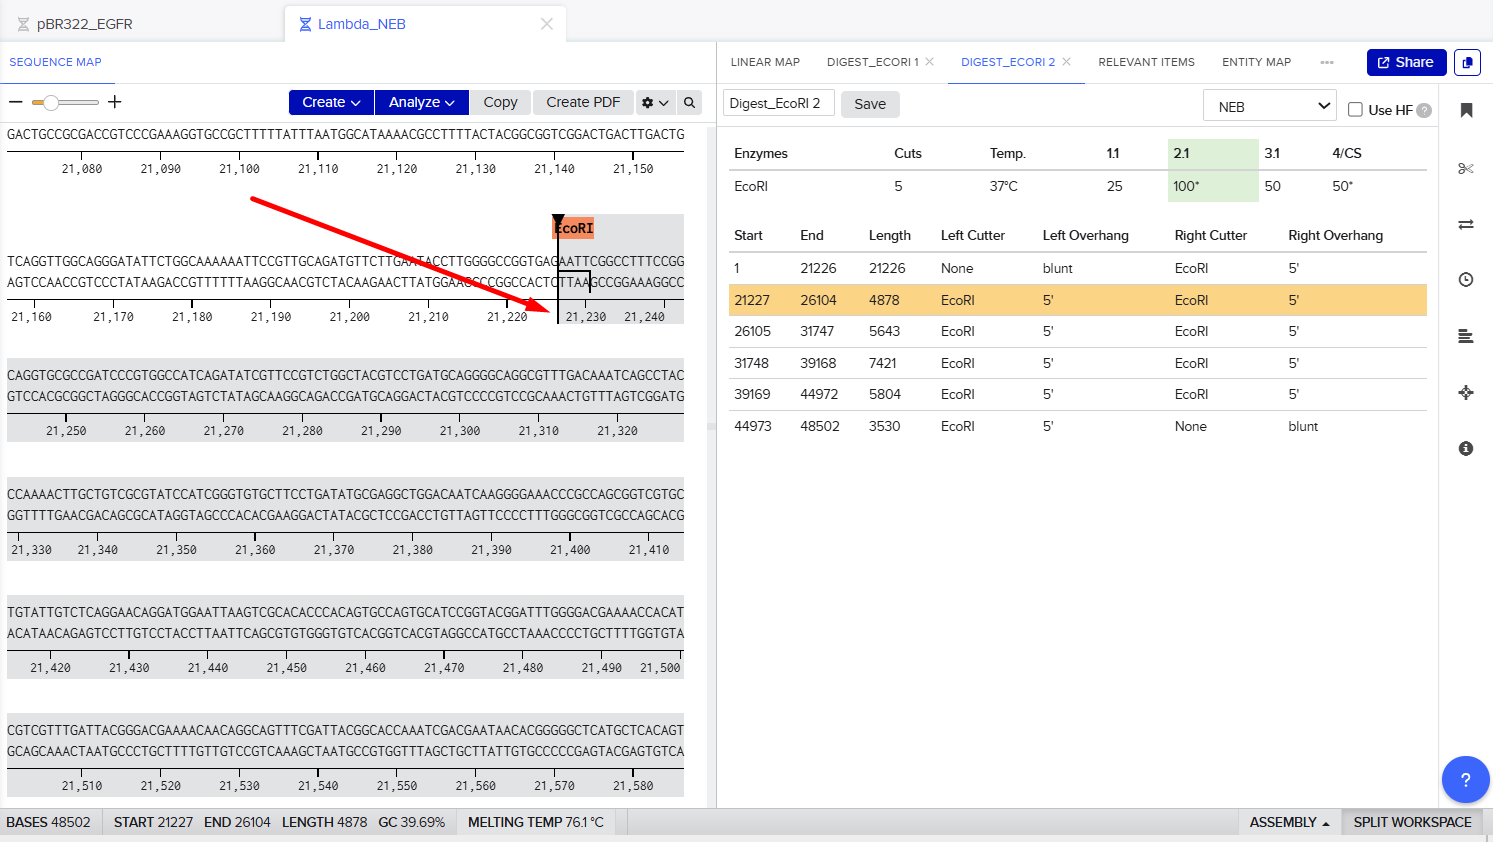
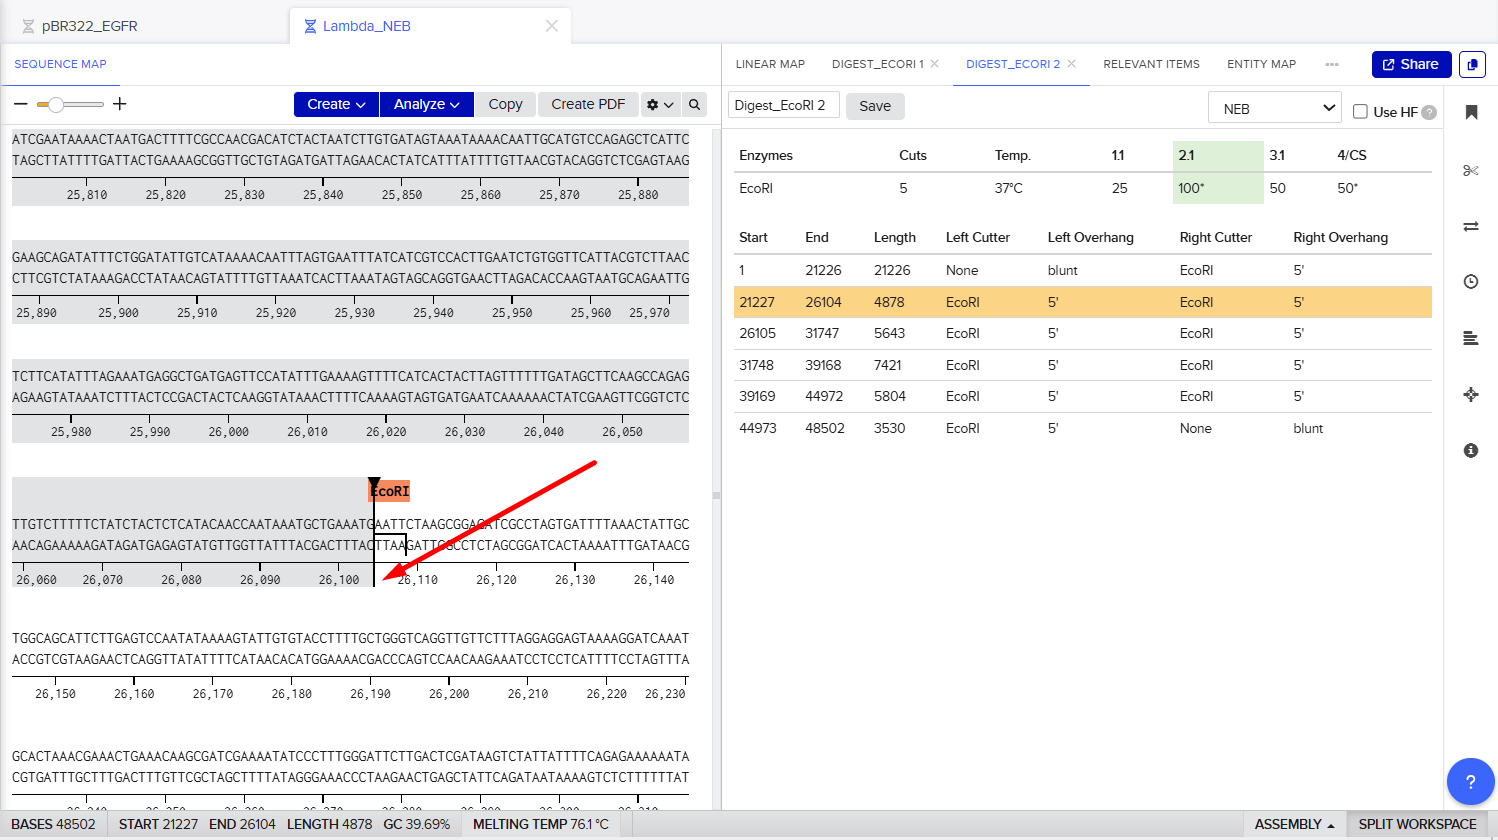
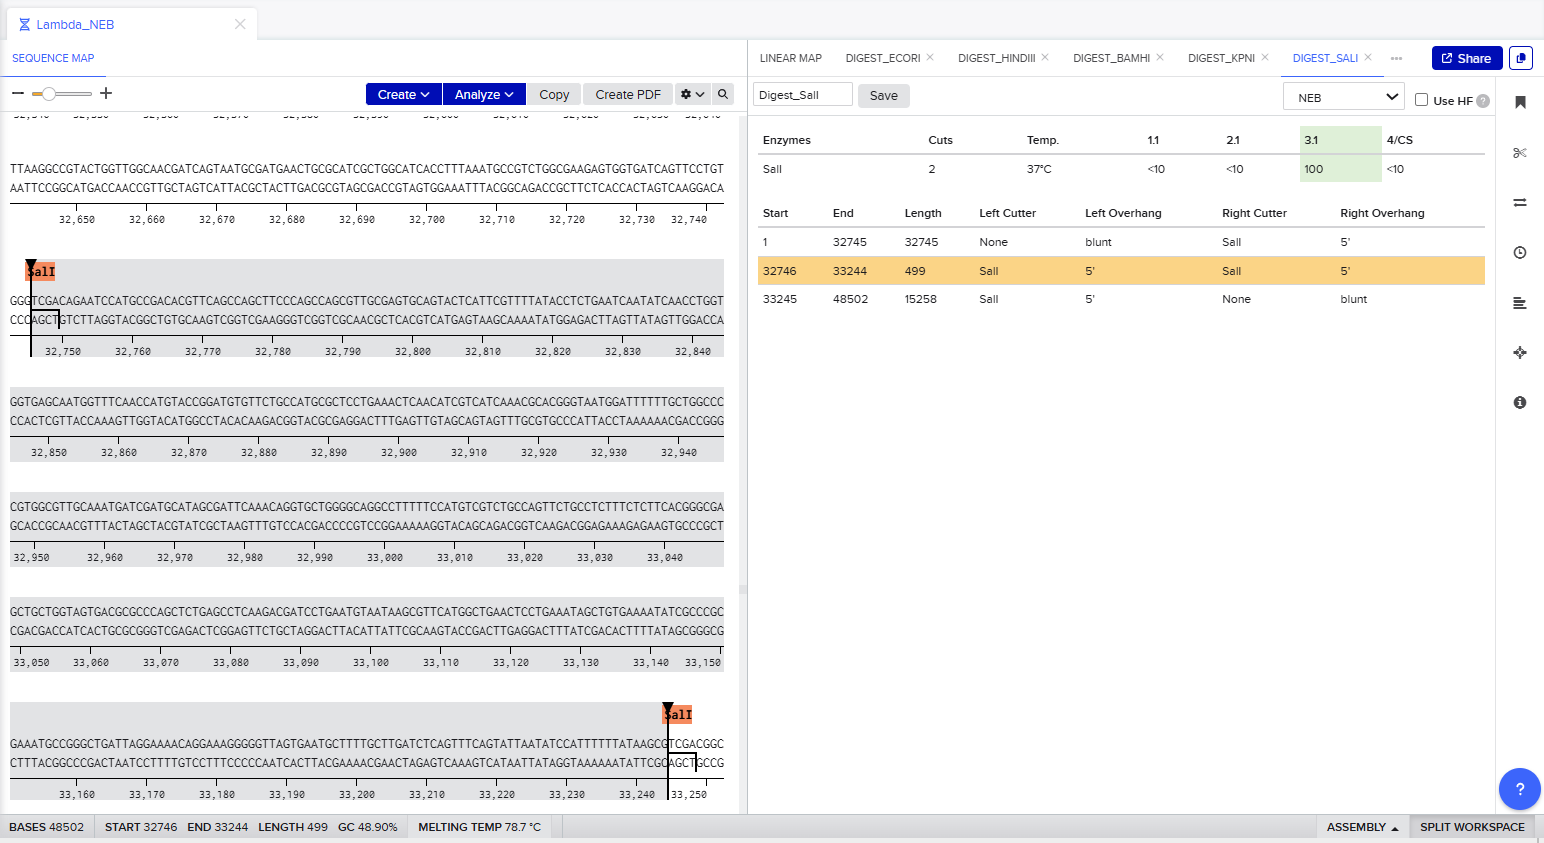
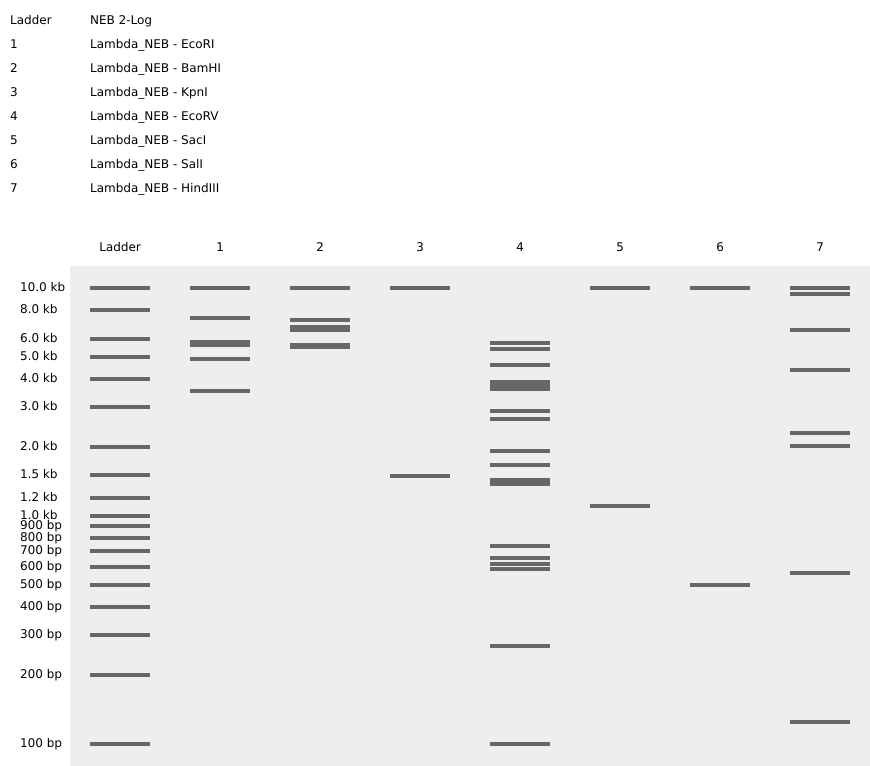
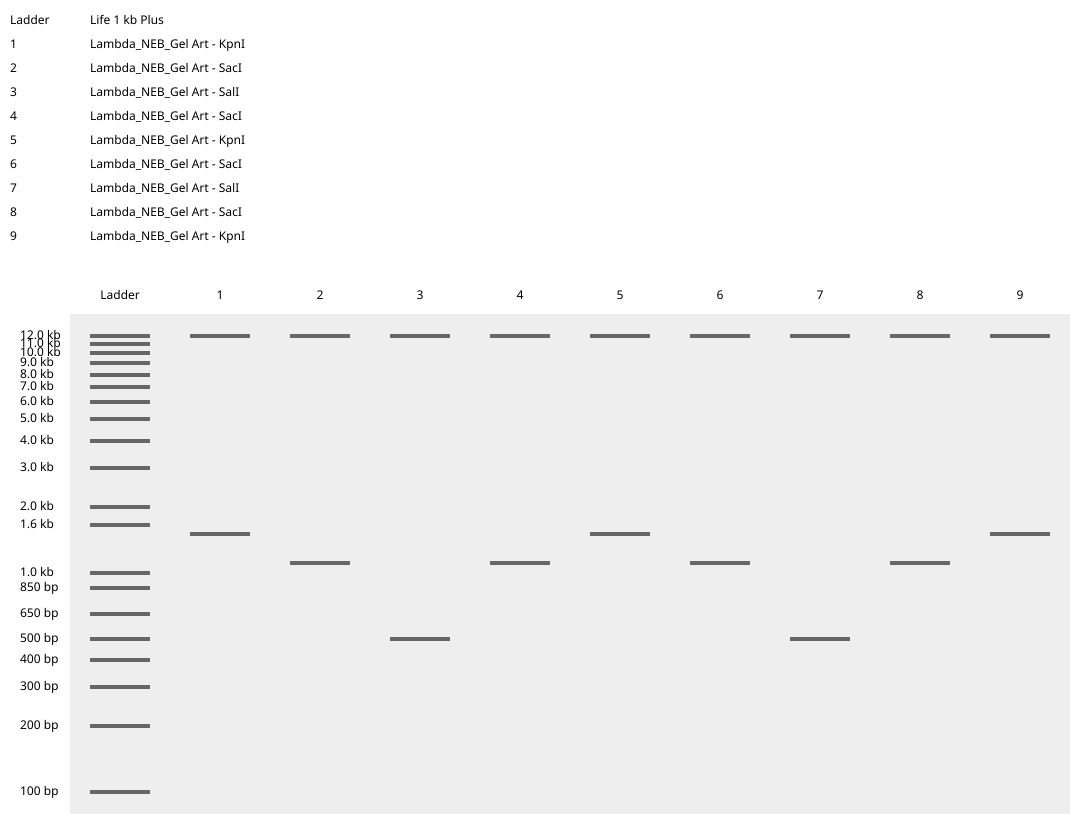
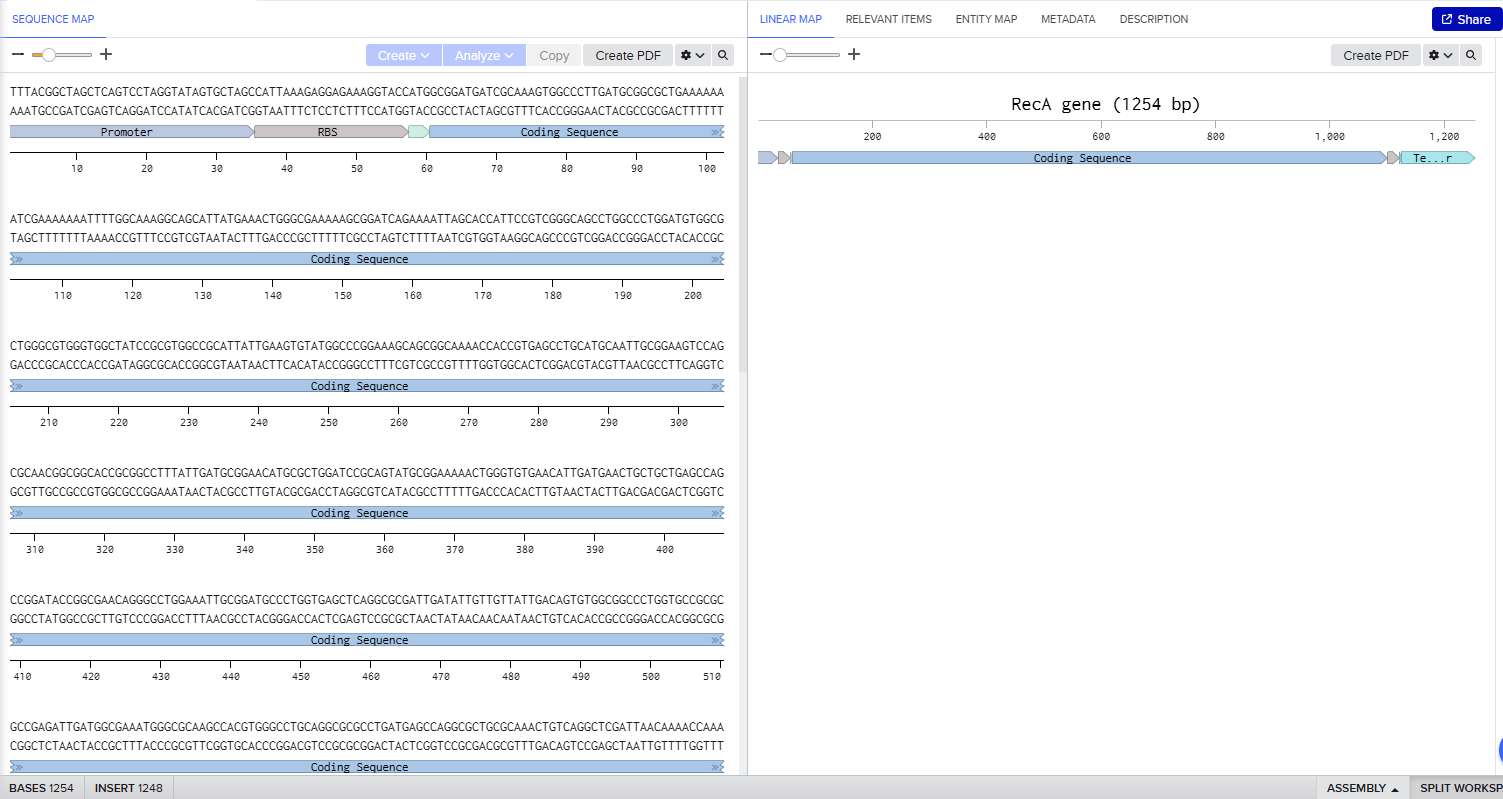
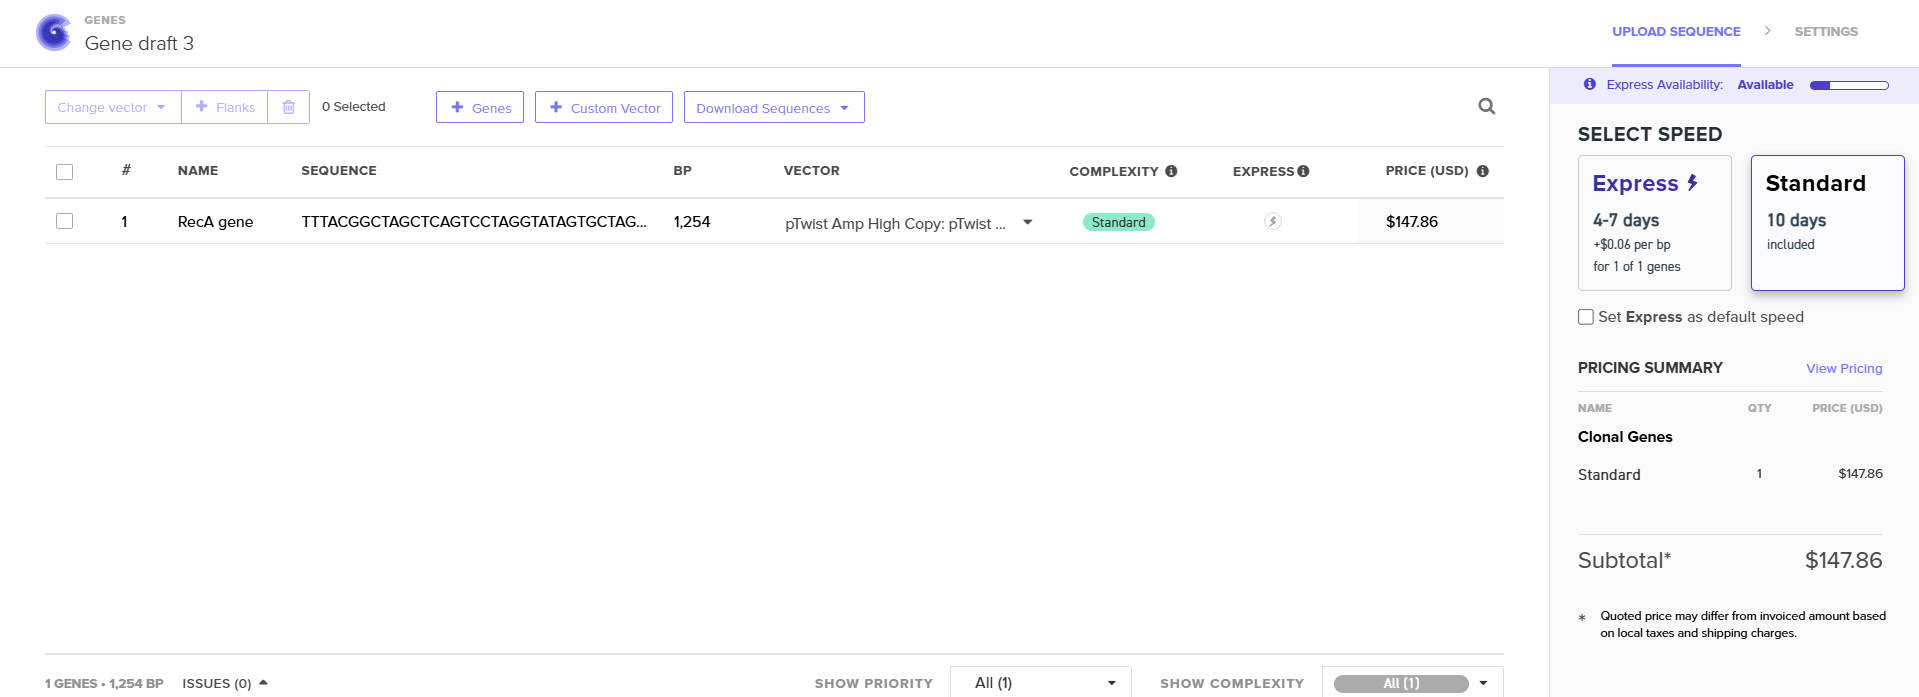
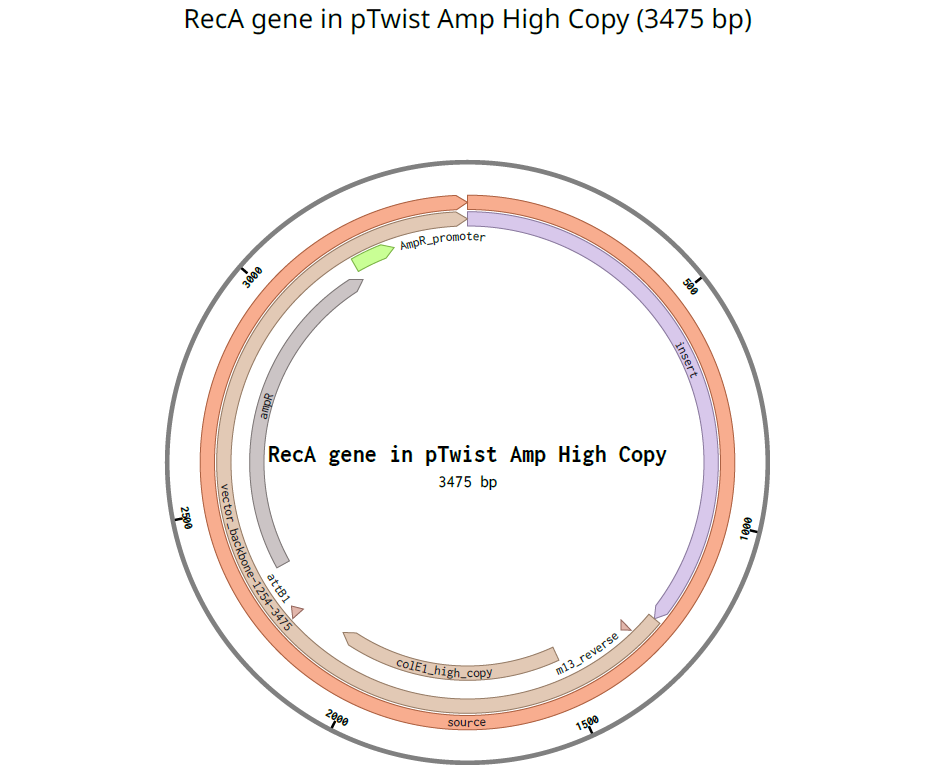

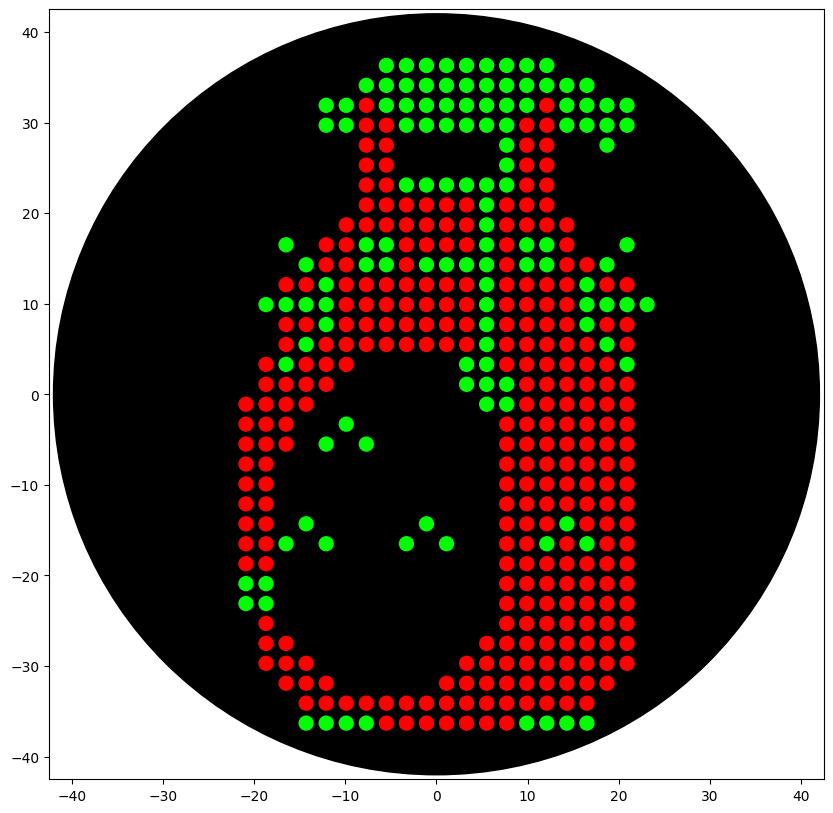
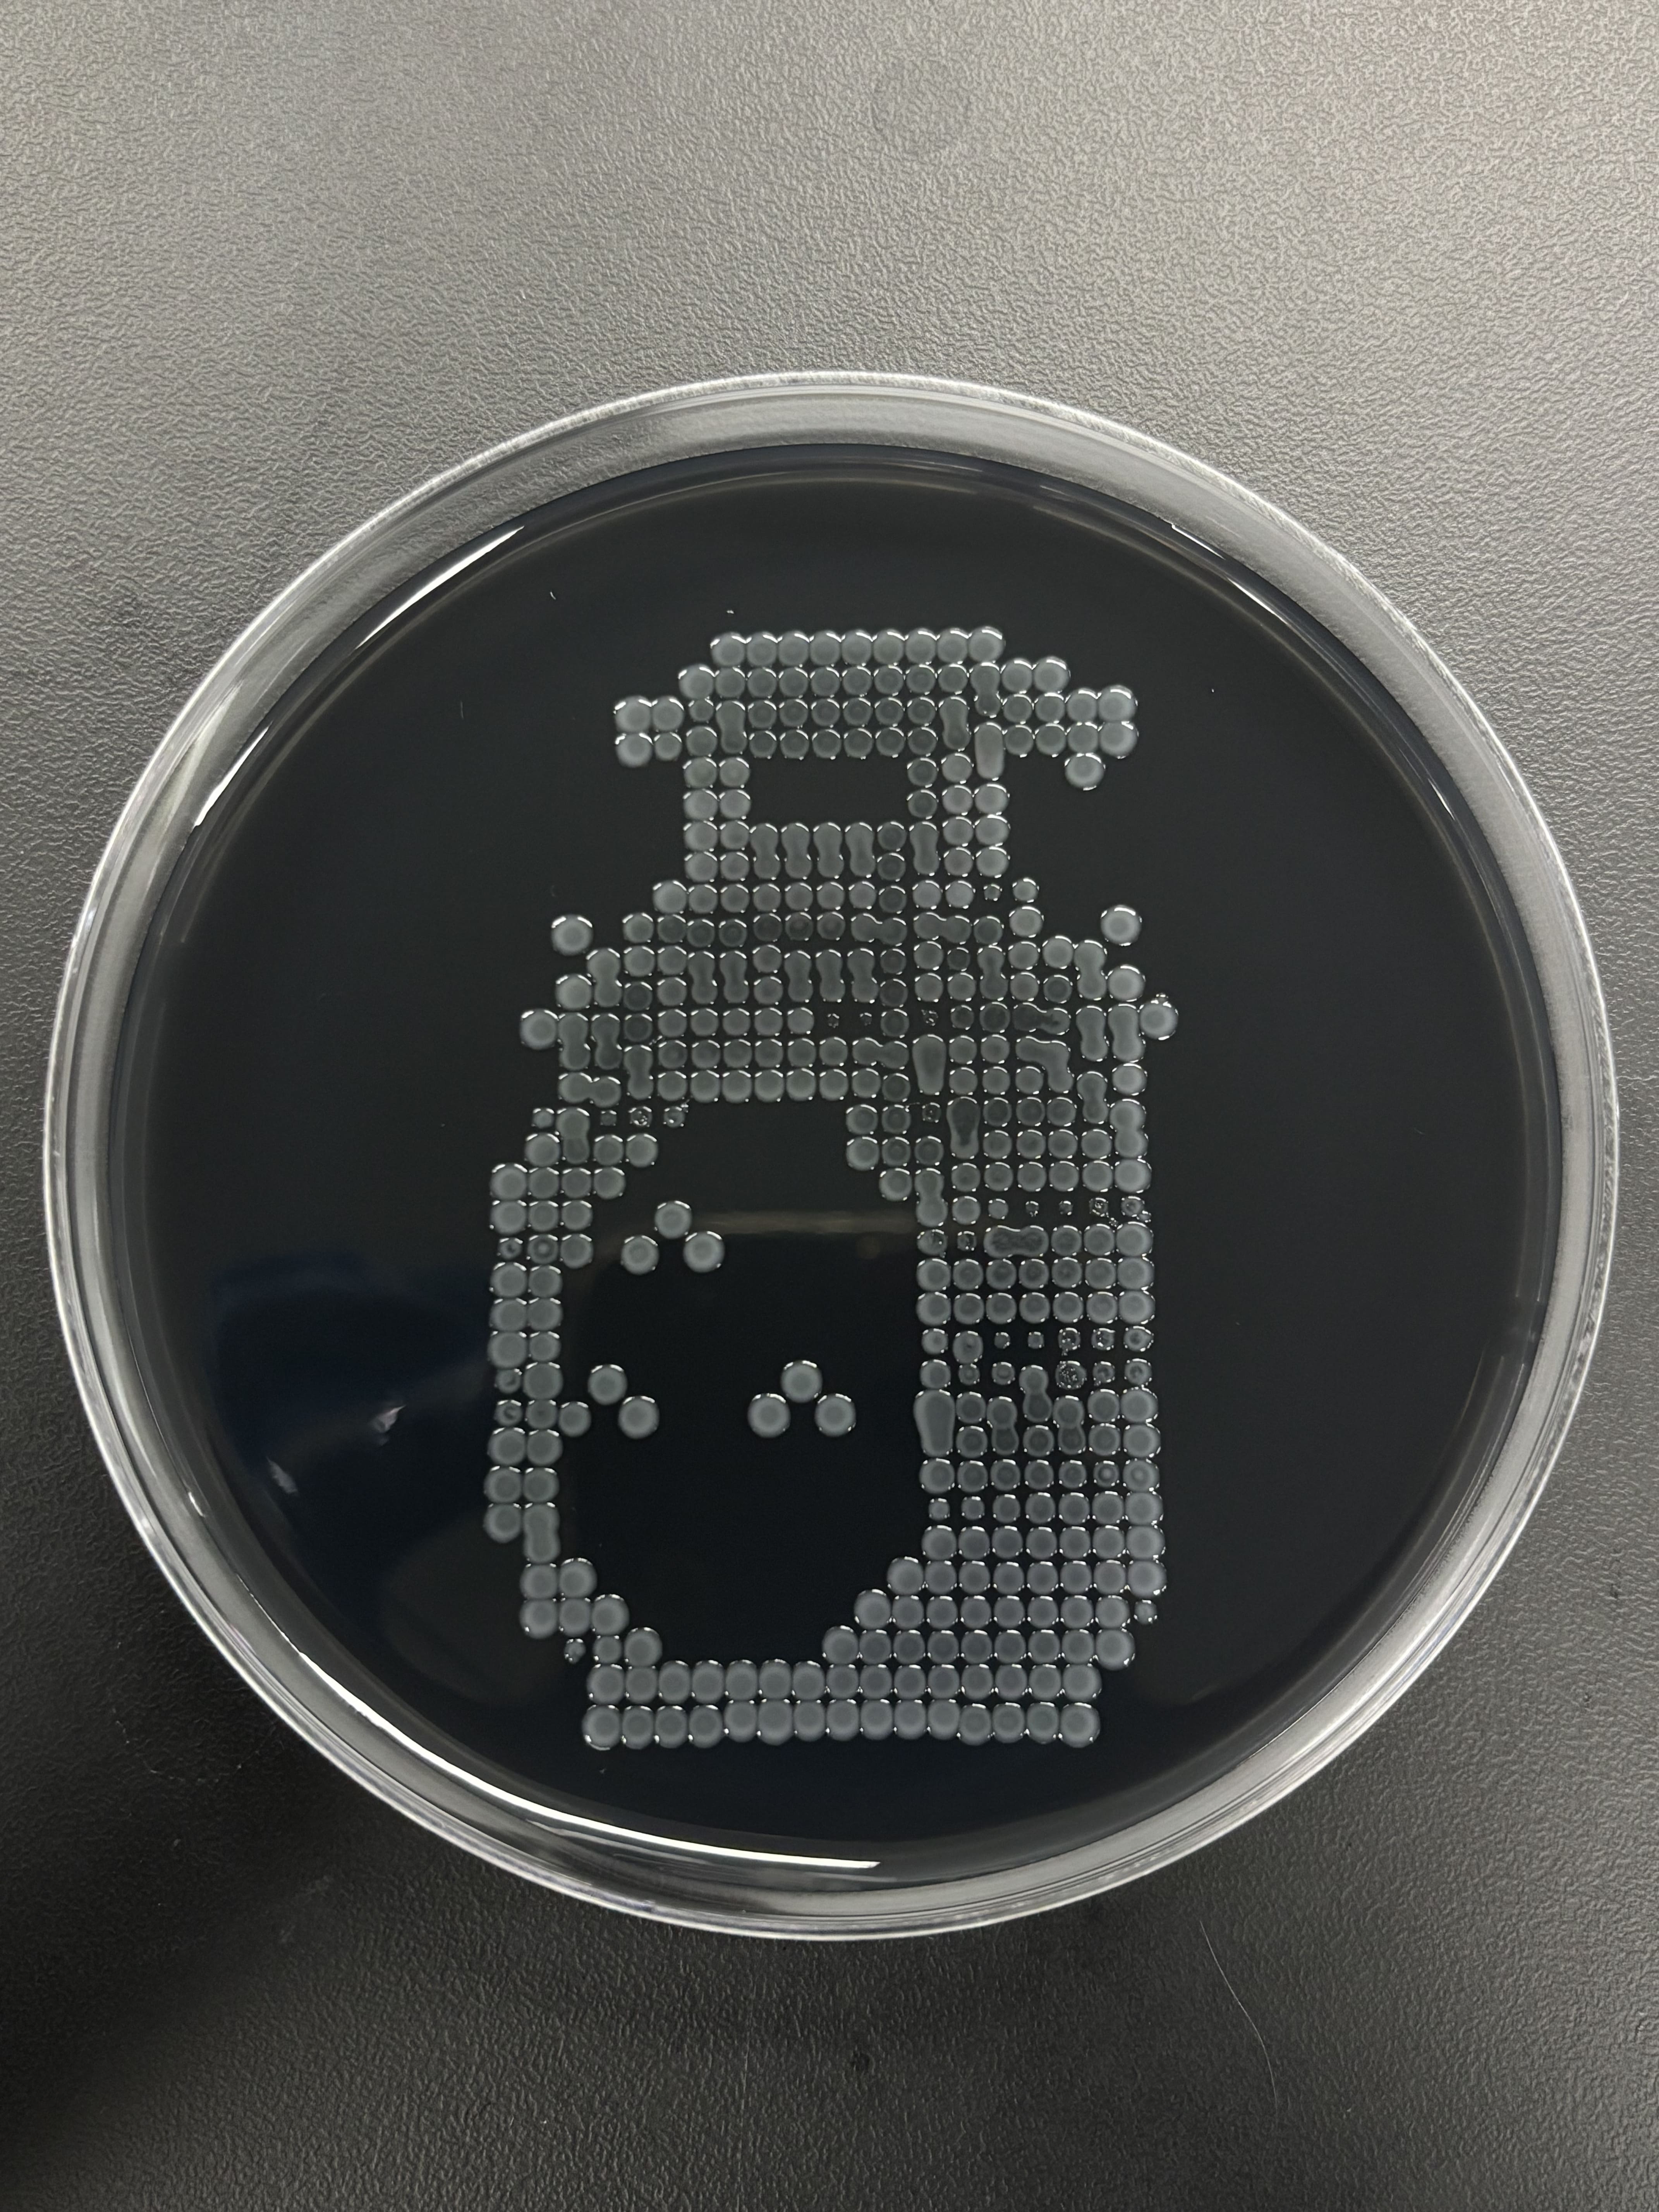

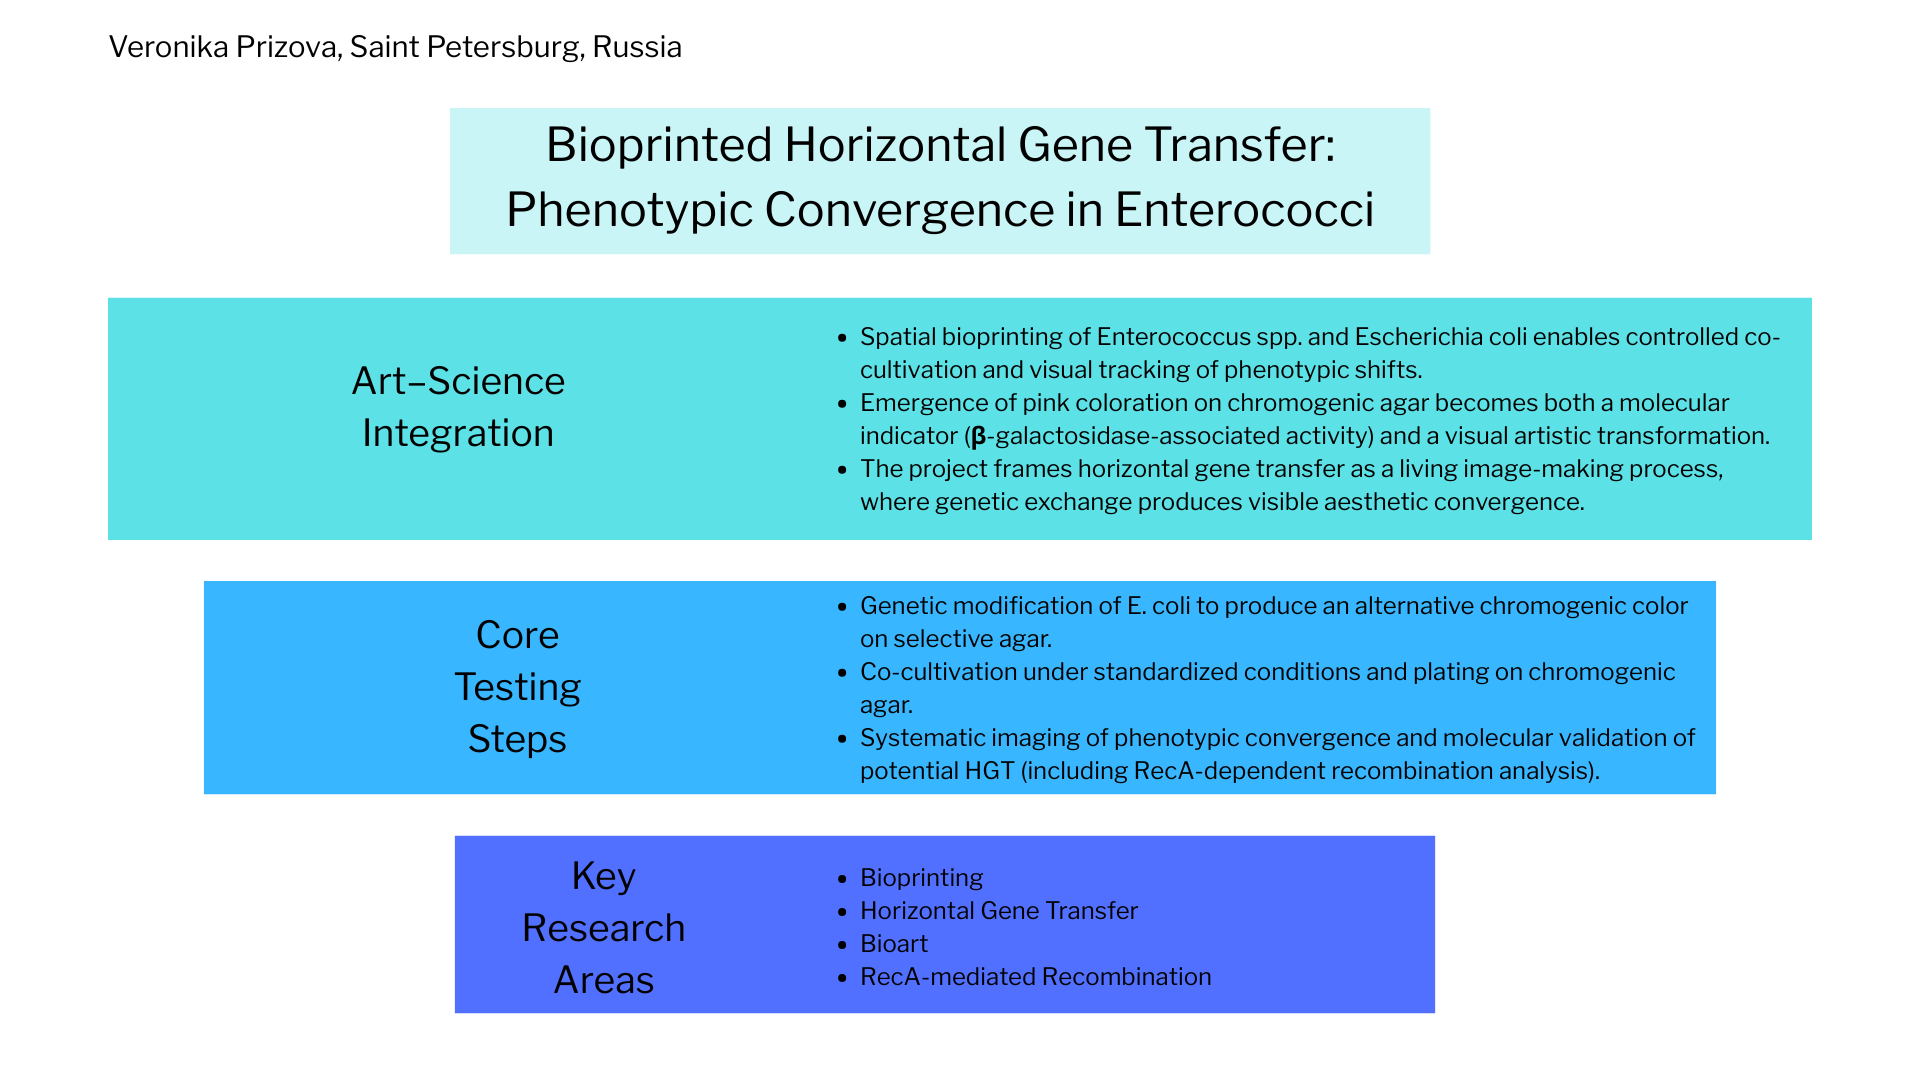
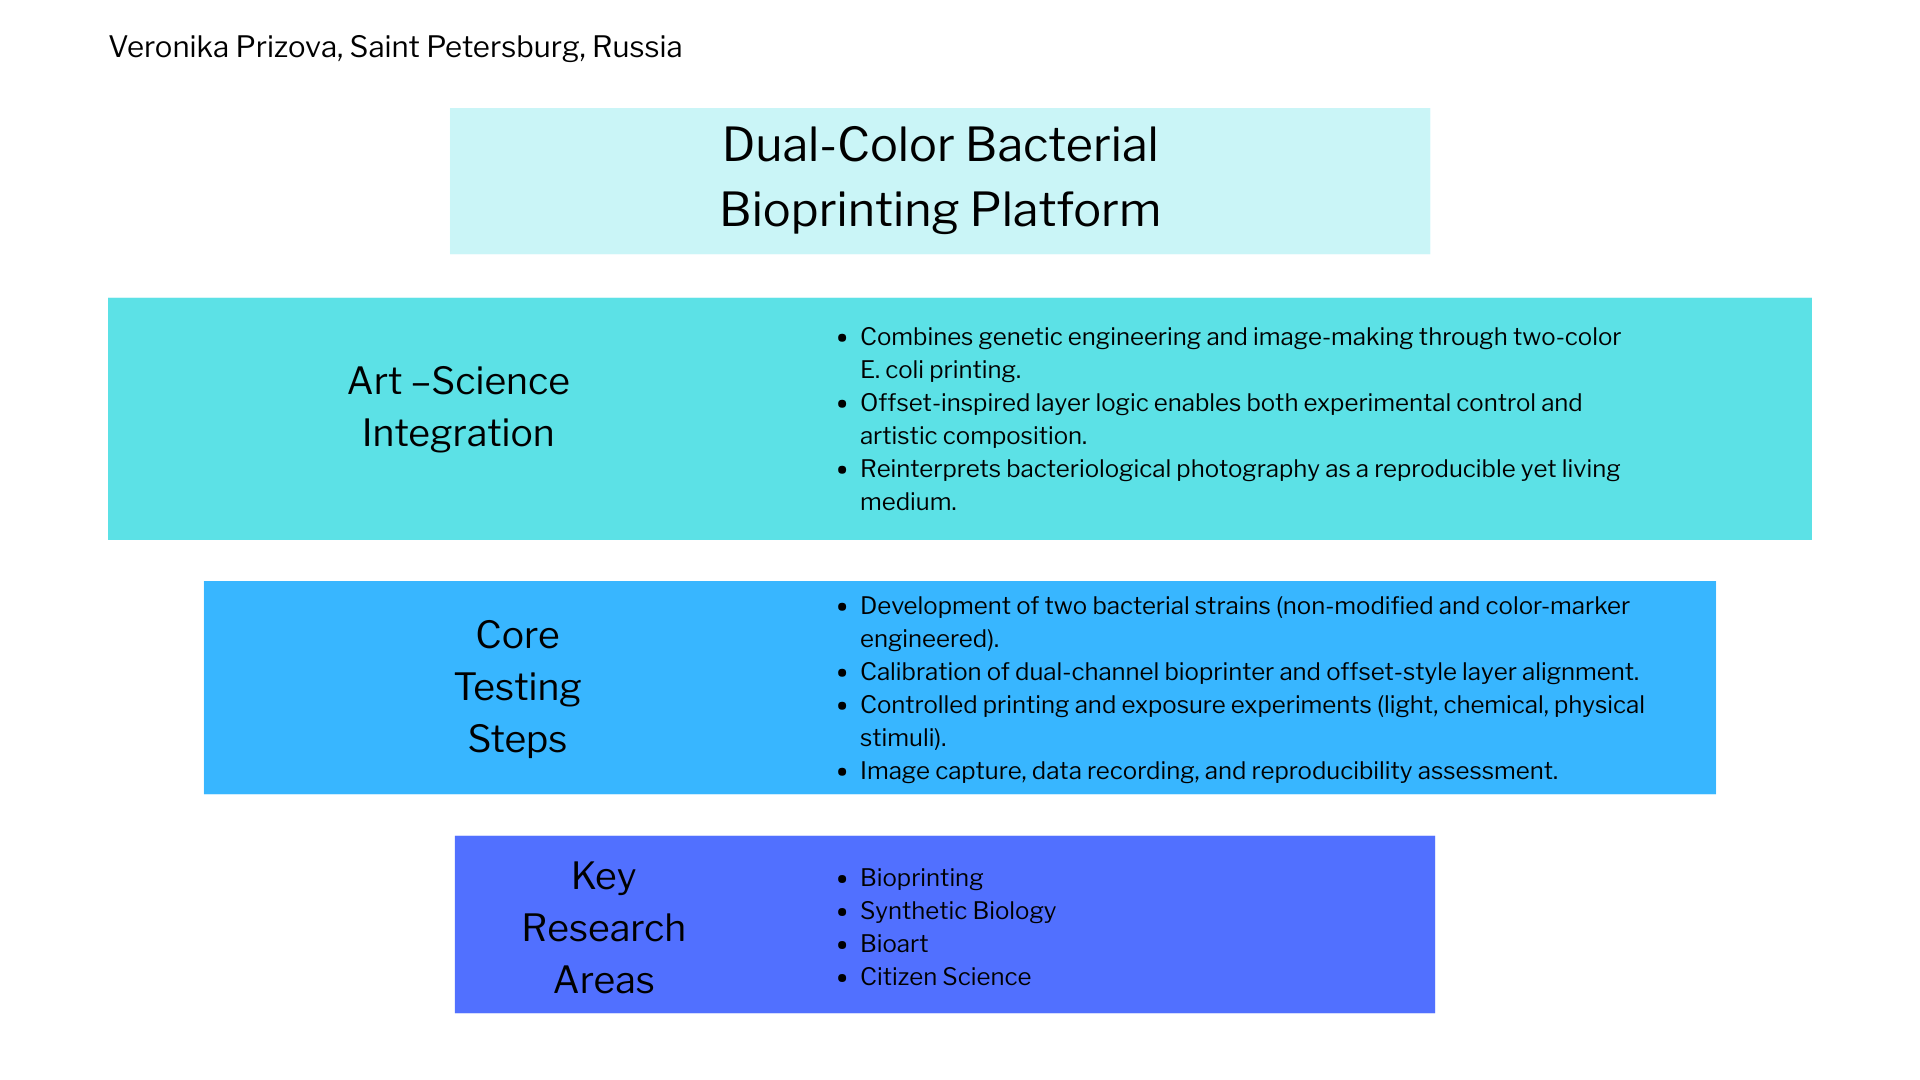
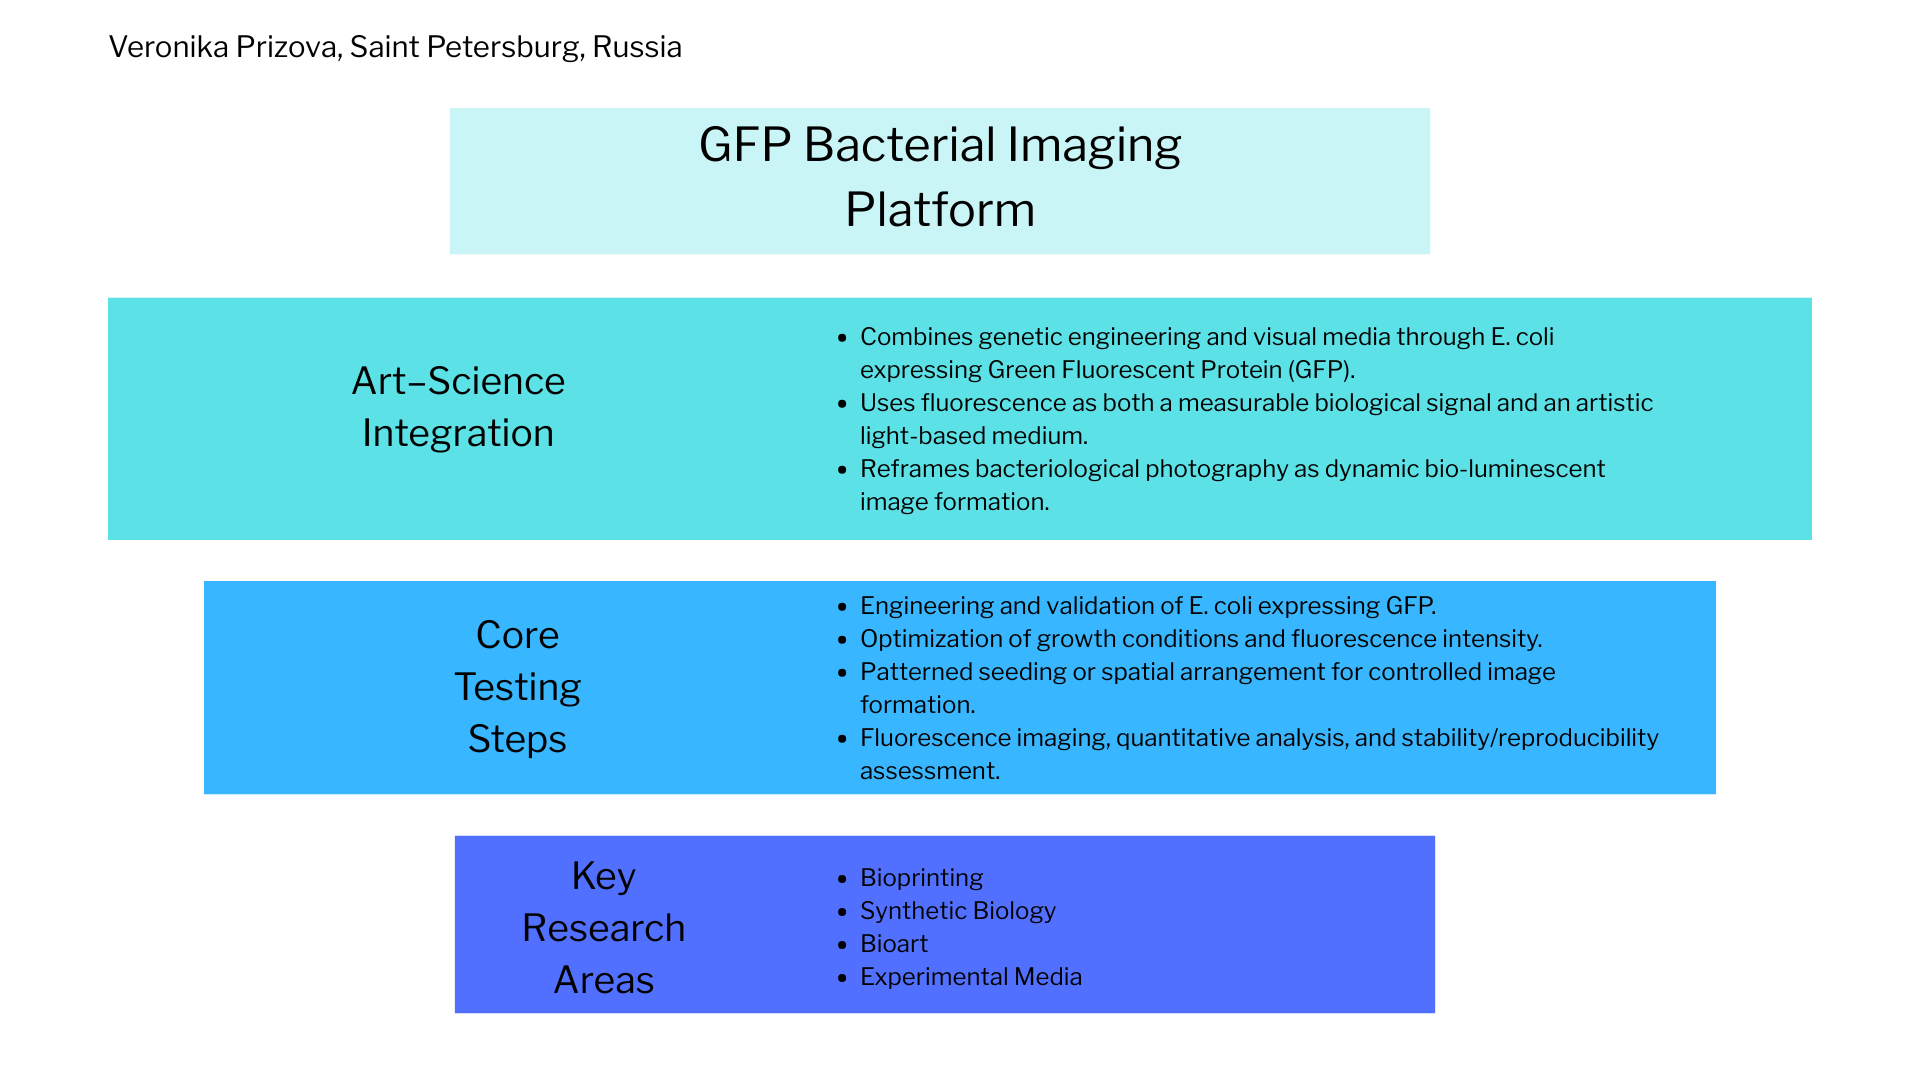
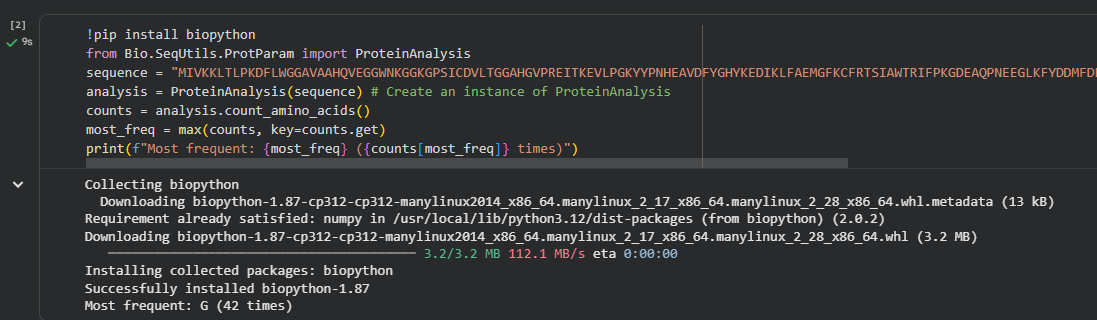
.png)
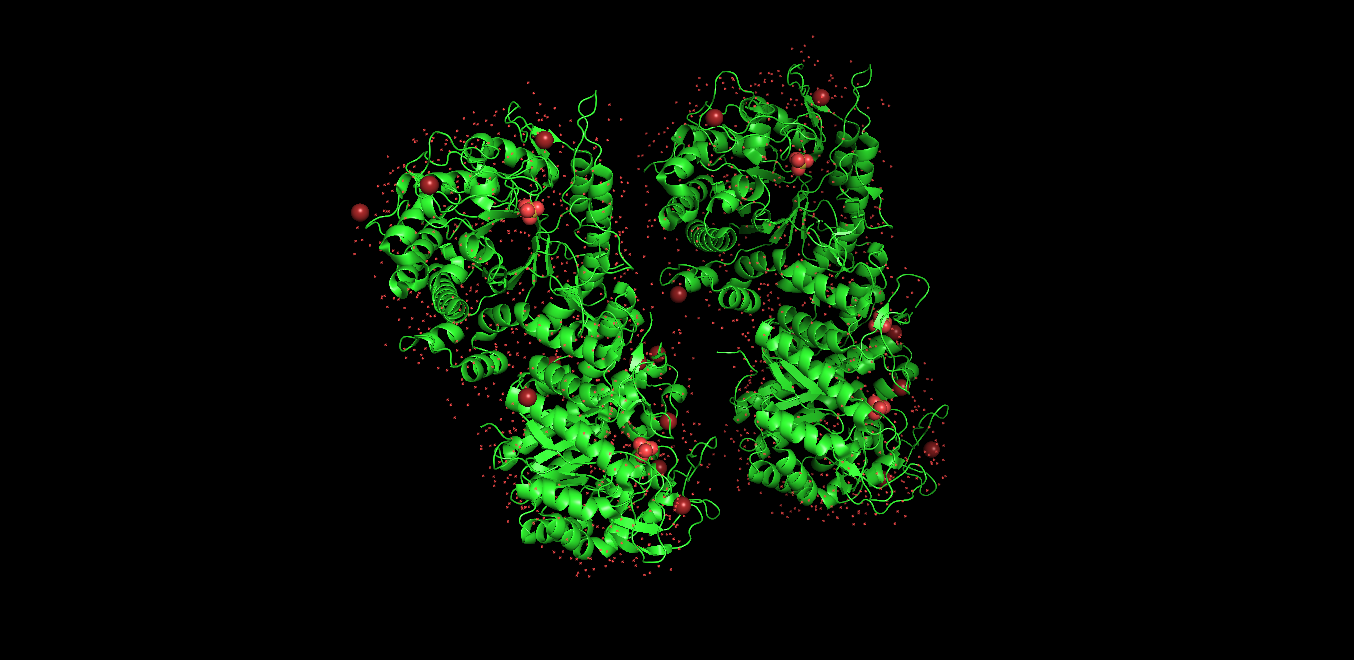
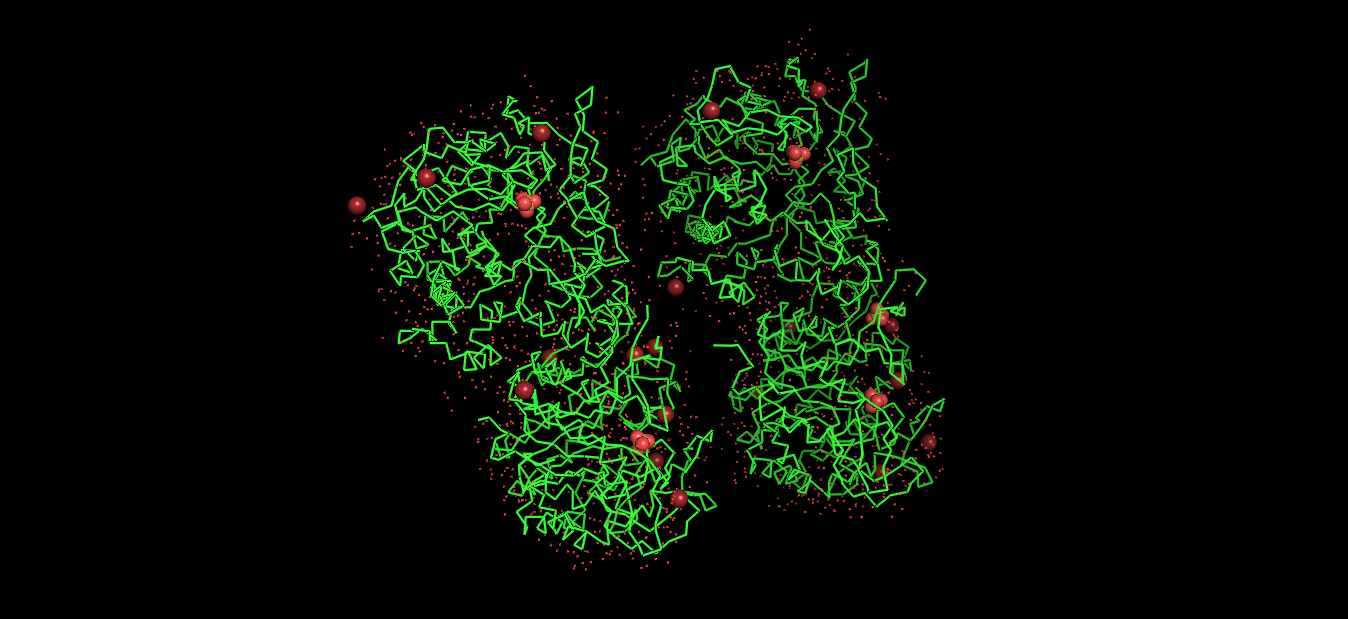
.png)
.png)
.png)
.png)