Week 10 Lab: Pipetting
Mass Spectrometry
Special Note: As a Committed Listener without lab access, documentation within my page is for purely acknowledgement purposes. There were no explicit instructions for Committed Listeners to submit lab work for this week, and with that, I reviewed the material.
The appendix listed figures to be used for the homework. These were downloaded and posted below for documentation purposes.
See: “Appendix – Figures from Lab work to be used for Homework” from https://2026a.htgaa.org/2026a/course-pages/weeks/week-10/lab/index.html
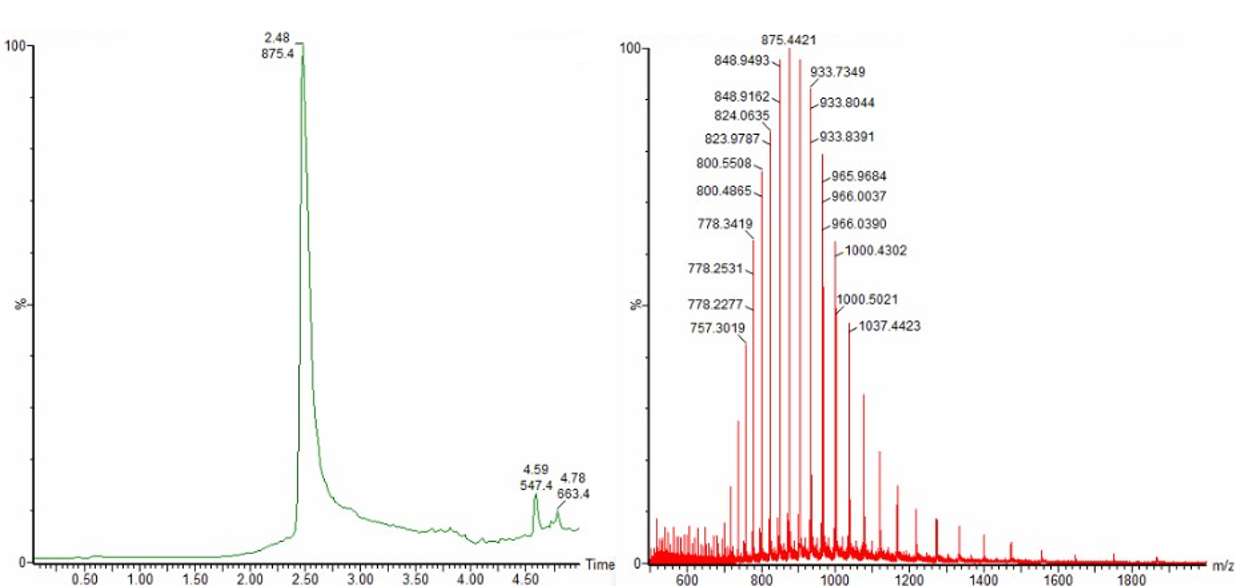
Figure 5. LC-MS chromatogram and MS spectrum of eGFP from the intact MS analysis on Xevo G3 QTof.
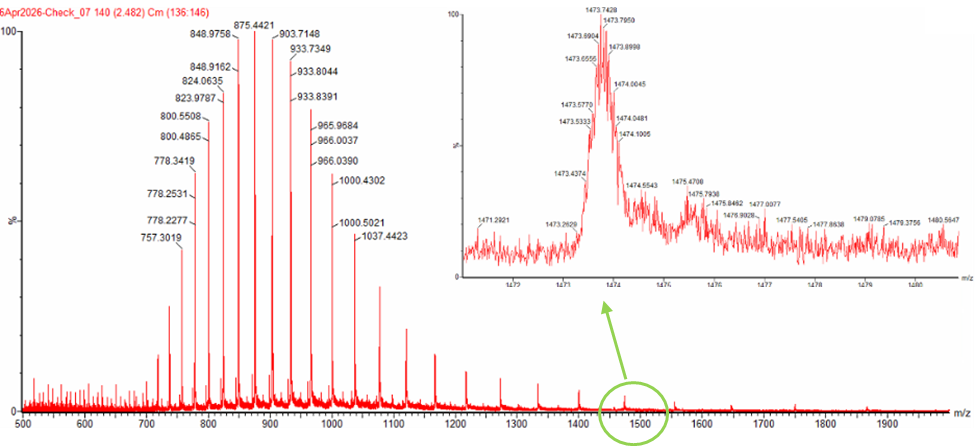
Figure 6. Intact MS spectrum for eGFP from Xevo G3 QTof. Inset: Zoom-in of the 10+ charge state.
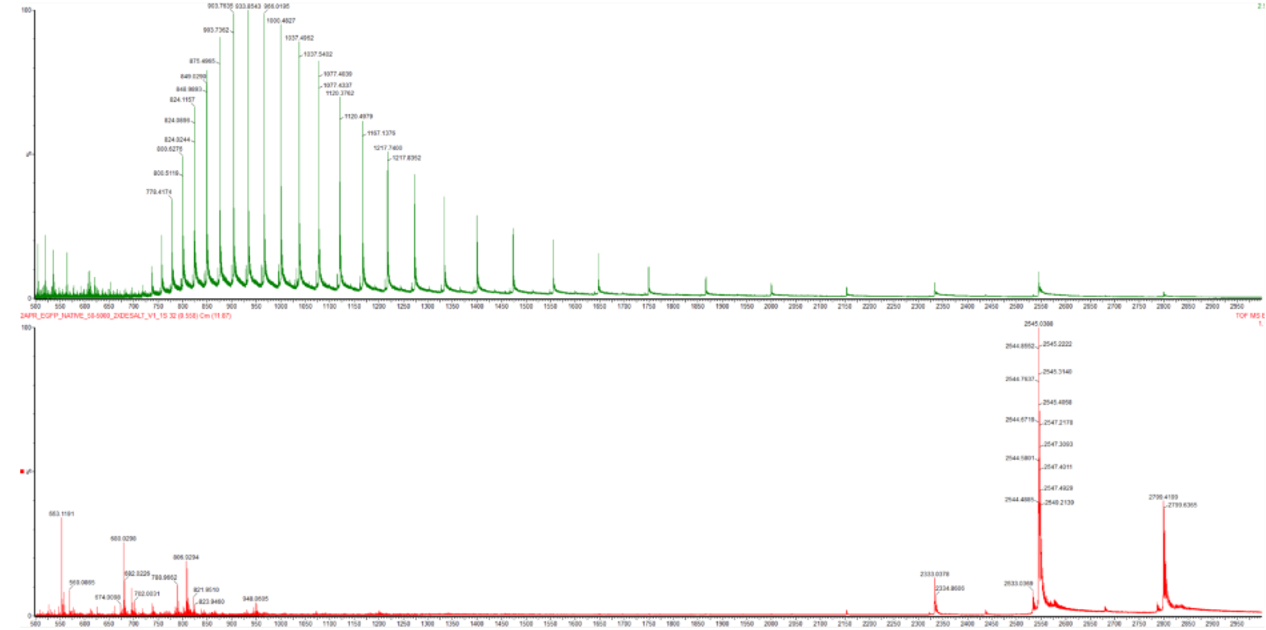
Figure 7. Native eGFP protein mass spectrum from the Waters Xevo G3 QTof MS. The inset is a zoom-in of the charge state at m/z 2800. Use the spacing between the peaks in the zoom-in to determine the charge state (z) and calculate the molecular weight of the protein.
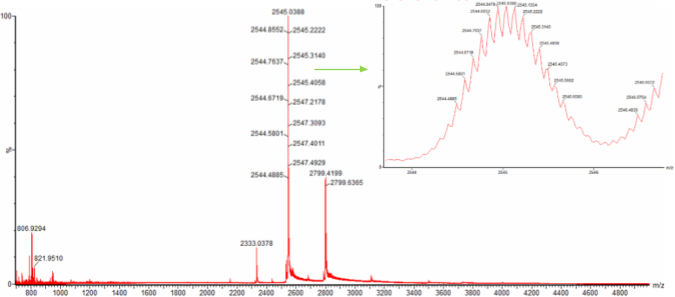
Figure 8. Native eGFP protein mass spectrum from the Waters Xevo G3 QTof MS. The inset is a zoom-in of the charge state at m/z 2800. Use the spacing between the peaks in the zoom-in to determine the charge state (z) and calculate the molecular weight of the protein.
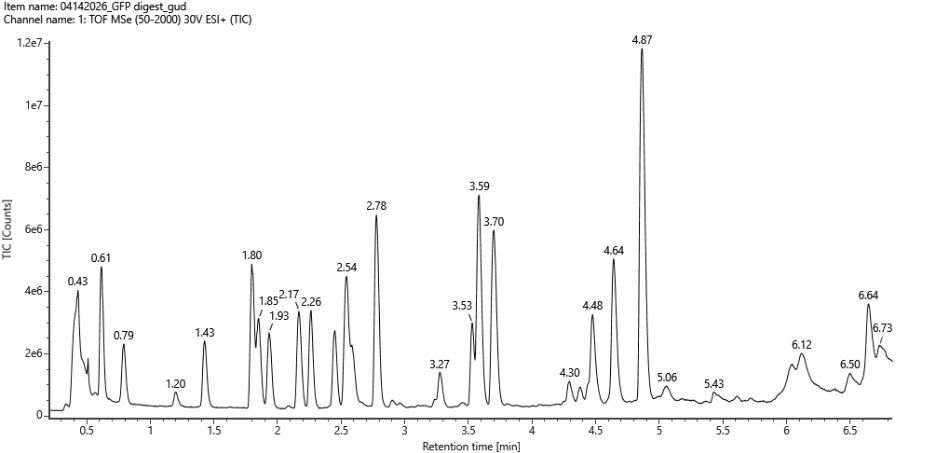
Figure 9. LC-MS Chromatogram of the eGFP tryptic peptide map from the Waters BioAccord system.
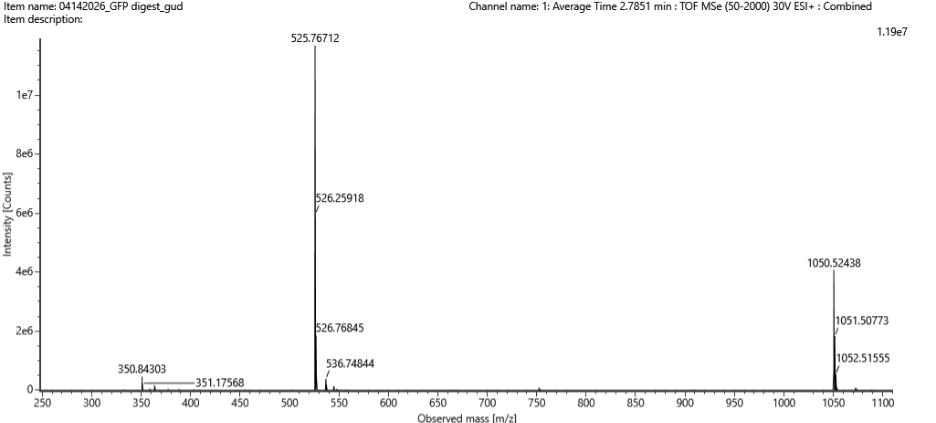
Figure 10. Mass Spectrum of a tryptic peptide from eGFP (at 2.78 minutes from Figure 9) to show different charge states of a selected peptide from the Waters BioAccord LC-MS system
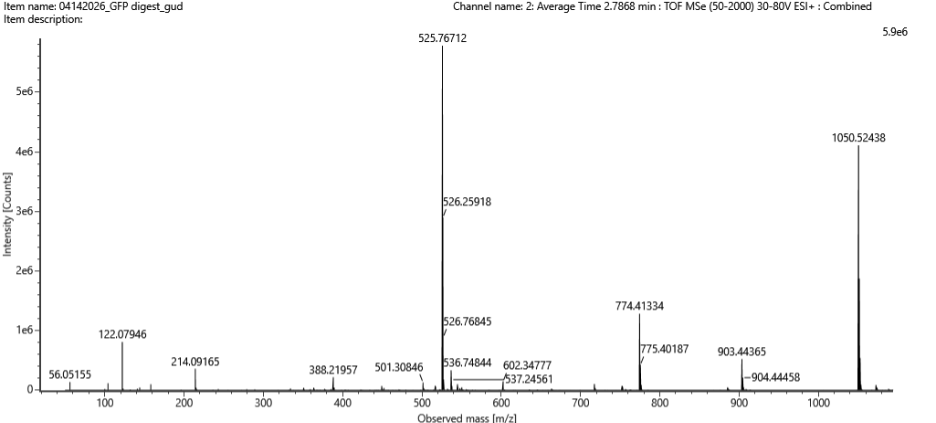
Figure 11. Fragmentation of the same eGFP tryptic peptide from Figure 10, showing the data used to reconstruct its amino acid sequence.
Report 1: Peptide Map Report of eGFP from the Waters BioAccord LC-MS System to show the LC-MS chromatogram, Coverage Map of the eGFP amino acid sequence, and predicted tryptic peptides matched to their MS/MS fragmentation patterns.
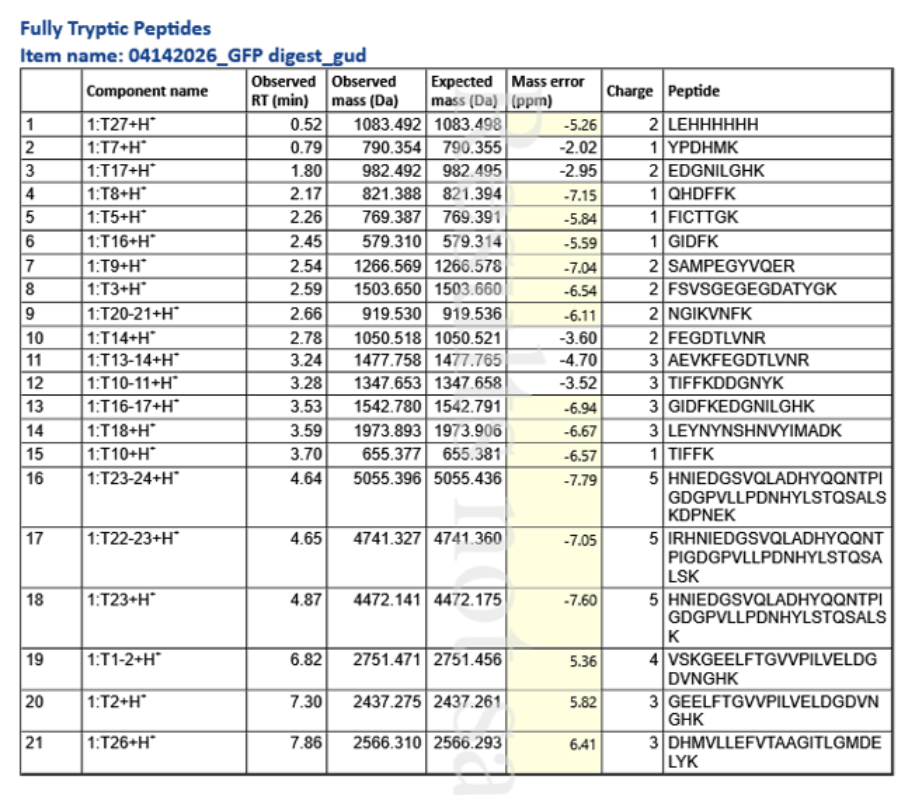
*Component name: T# refers to the K or R residue in eGFP (refer to homework or see sequence below); ie, T27 = the peptide resulting after trypsin cleaves the bond after the 27th cleavage site (the 27th K or R in the amino acid sequence). The Observed RT (min) refers to the chromatographic peak’s elution time (see Figure 4). The Observed mass, Expected Mass, and the Mass Error provide a good idea of how well the two values agree (we’re looking for +/- 10 ppm or smaller). The Charge column denotes the charge state at which the peak was observed in the mass spectrum; the Peptide column provides the best tryptic peptide sequence from eGFP as a match.
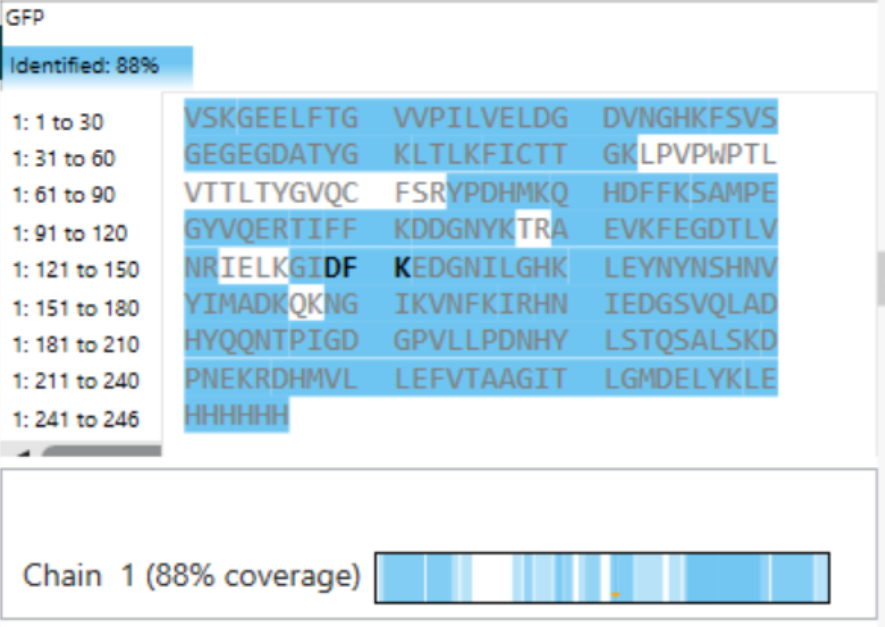
Figure 12. Amino acid coverage of the peptides detected from eGFP standard from the lab protocol.
Sequences shown in blue denote peptides that were detected by their molecular weight in the MS spectrum, alongside confirmatory fragmentation spectra to identify their amino acid sequence.
Peptides not highlighted were not detected or identified, for a number of potential reasons:
- The sequence is too small (<5 amino acids) or too large (>20 amino acids) to provide confident identification
- There may be too much “noise” (ie, signal from small molecule ion contaminants in the sample or solvents) to provide a strong signal from the MS data to detect and identify the peptide confidently.
- There may be a modification in the amino acid sequence provided by the eGFP protein manufacturer that does not align with the amino acid sequence that was provided in the documentation.
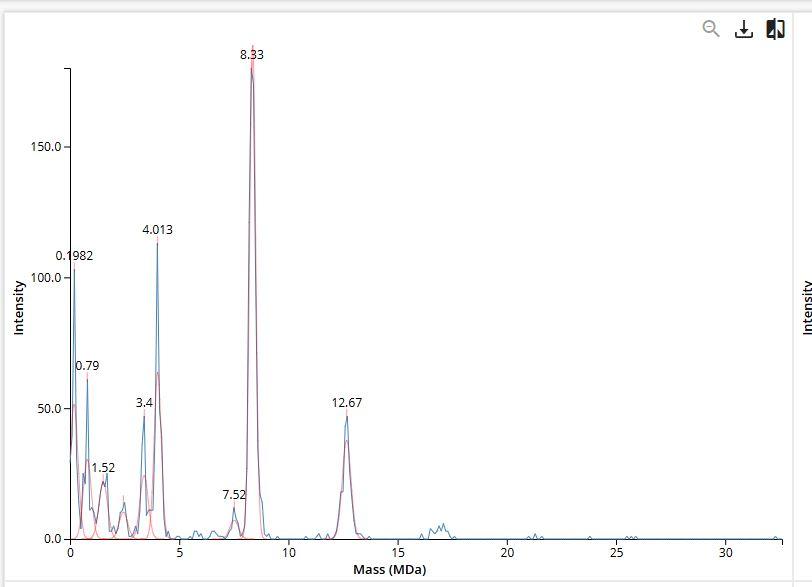
Figure 13. Mass spectrum of Keyhole Limpet Hemocyanin (KLH) acquired on the CDMS.