Week 2 Lab: DNA Gel Art
Overview
In this lab, I focus on the practical application of DNA restriction digestion and agarose gel electrophoresis. The goal is to design and create DNA gel art by using selected restriction enzymes to generate DNA fragments of specific lengths, then resolving those fragments on a gel to form an image. For this experiment, I aim to produce a “boring face” (—_—) pattern.
Part 1: In-silico Design
Before entering the lab, I iterated on the target pattern using Ronan’s Automation Art website and used Benchling to simulate how Lambda DNA (48,502 bp) would be cleaved by selected restriction enzymes. This digital preparation enabled me to anticipate the expected banding patterns on the agarose gel and provided a reference for later interpretation of the experimental results.
1.1 Artistic Mapping and Enzyme Selection
For this experiment, I assigned specific enzymes to represent different facial features based on the fragment sizes they produce:
- EcoRV and PvuII: forms the outer “ ( ) ” boundaries.
- SacI: creates the eye bands “ — ”.
- SalI: creates the mouth band “ _ ”.
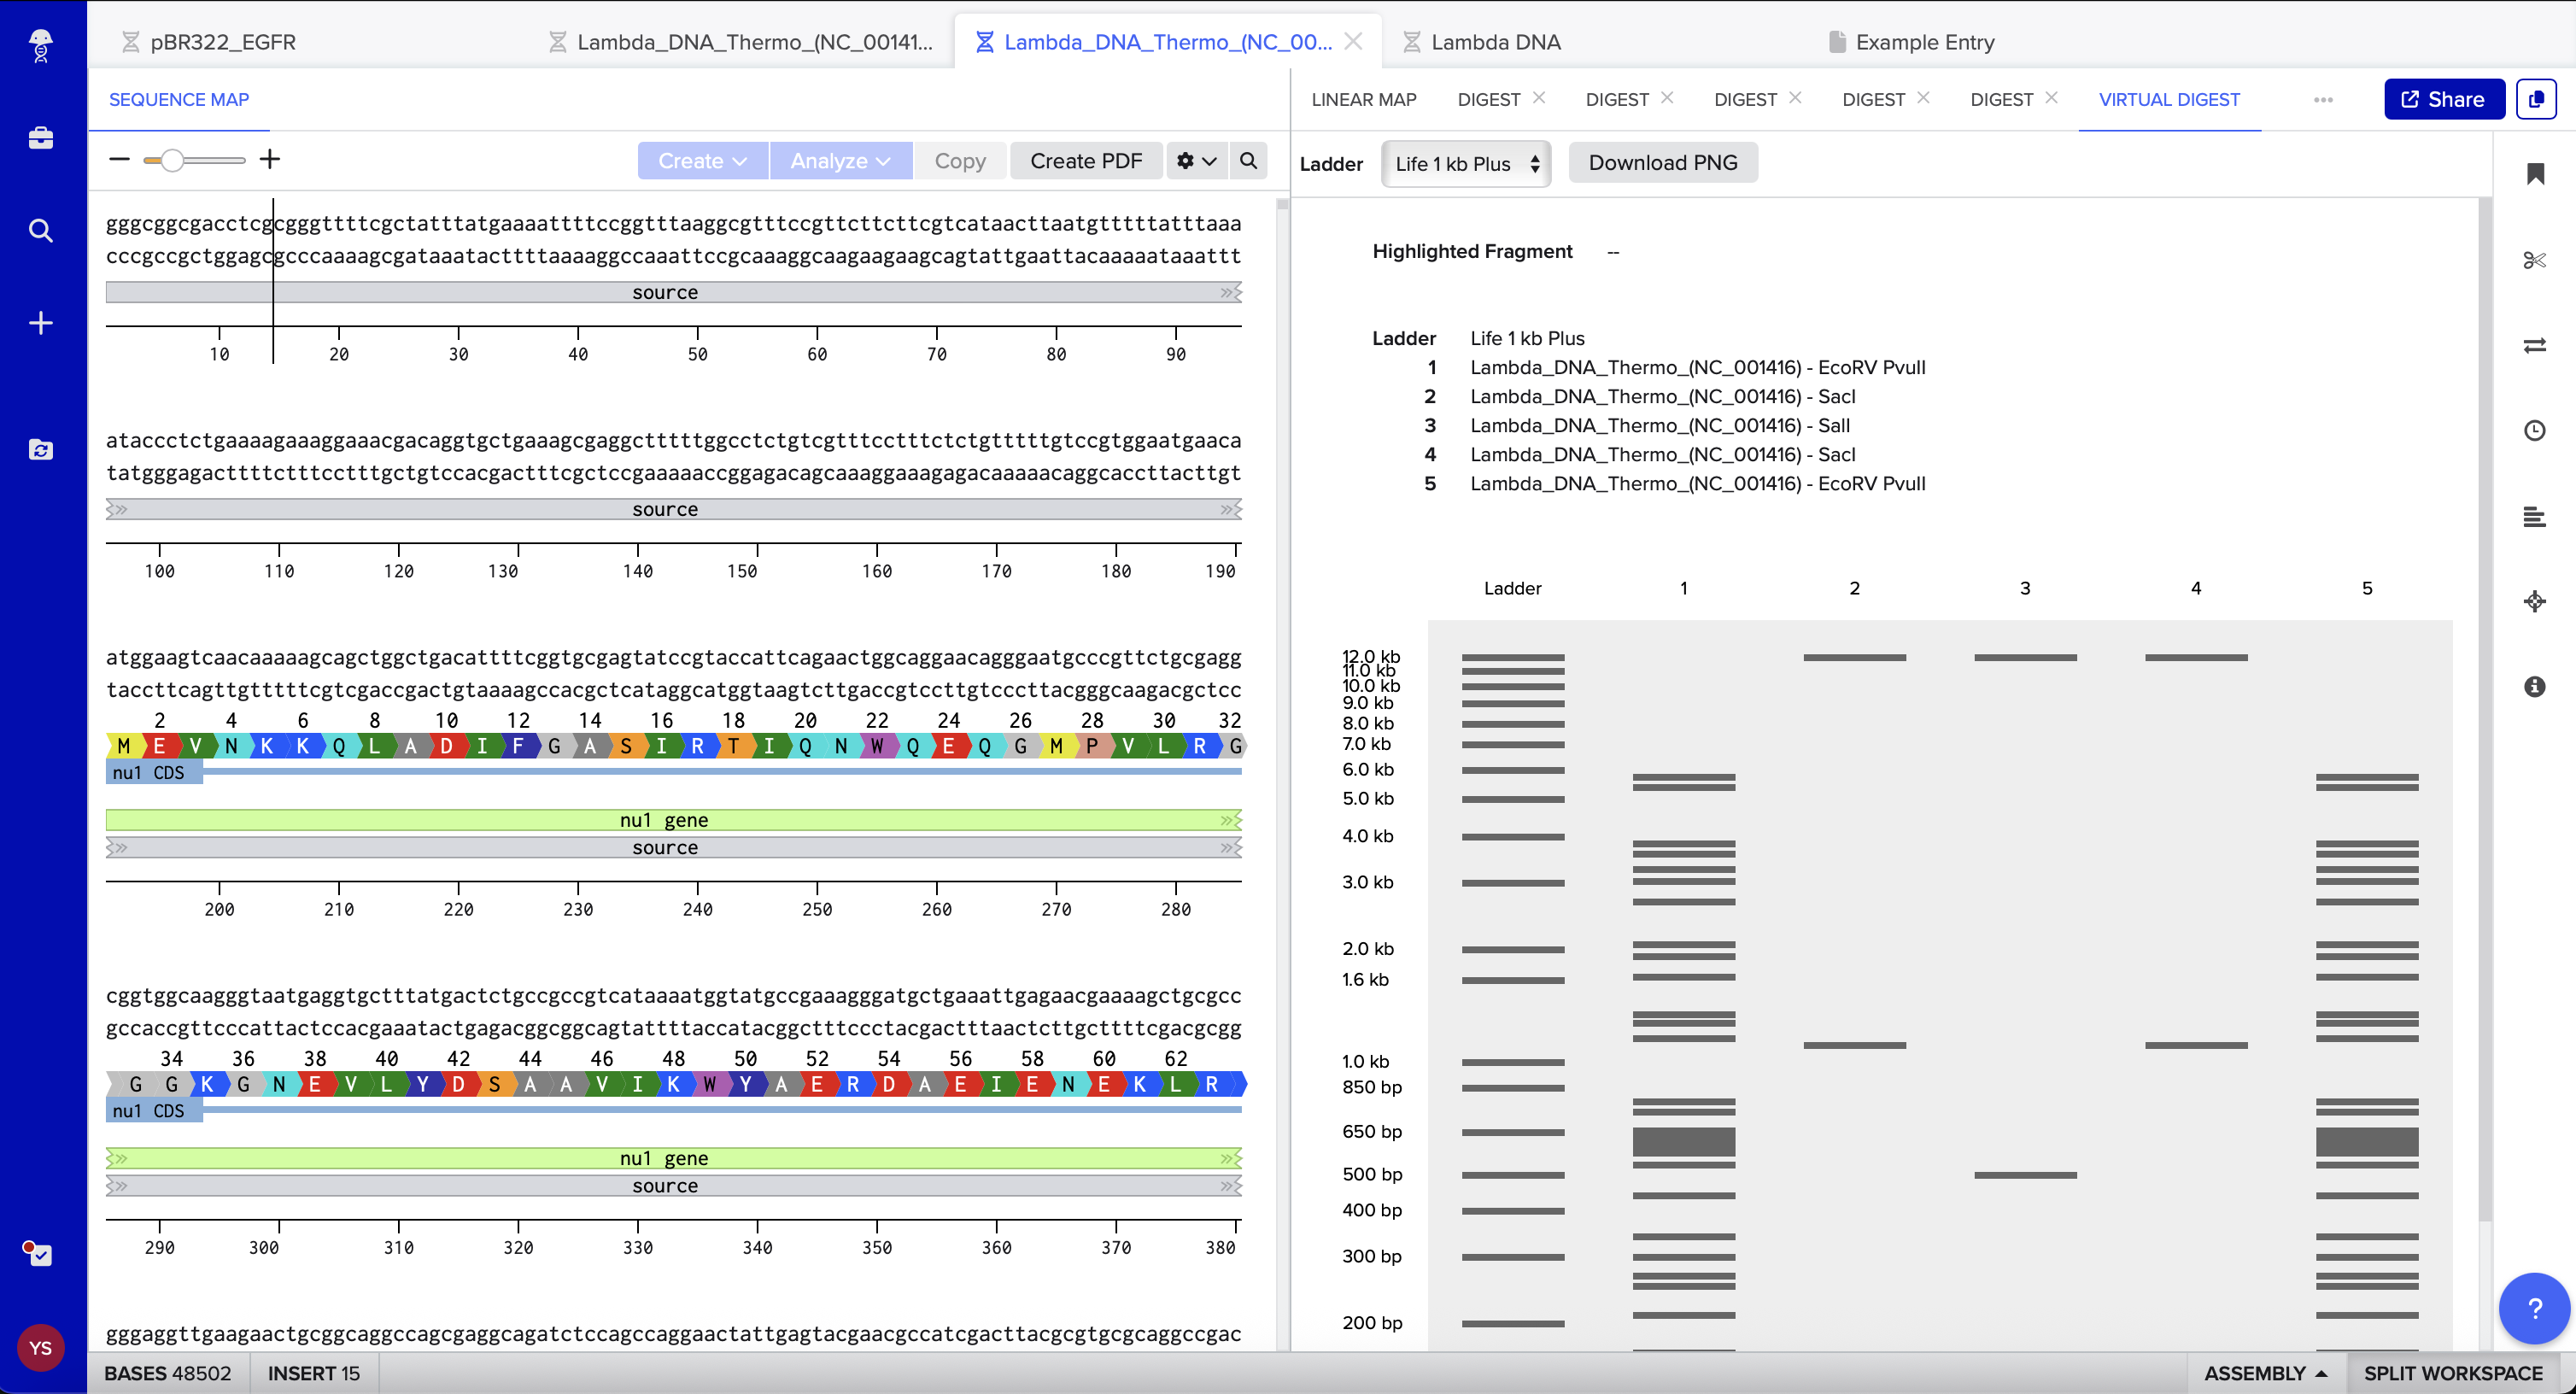
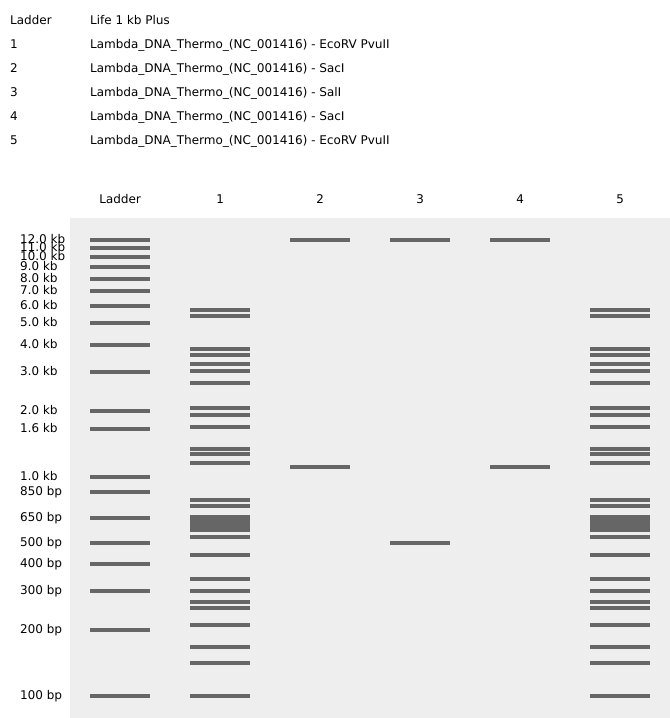
1.2 Virtual Gel Prediction
I used Benchling’s virtual gel tool to verify that the fragments for the eyes, mouth, and face boundaries would migrate to the intended relative positions. The simulation confirmed that the selected enzymes should produce a clear, distinguishable “boring face” pattern on the agarose gel. The required restriction-digest reagents and volumes were generated using the Automation Art website and used as the setup guide for the subsequent wet lab procedure.
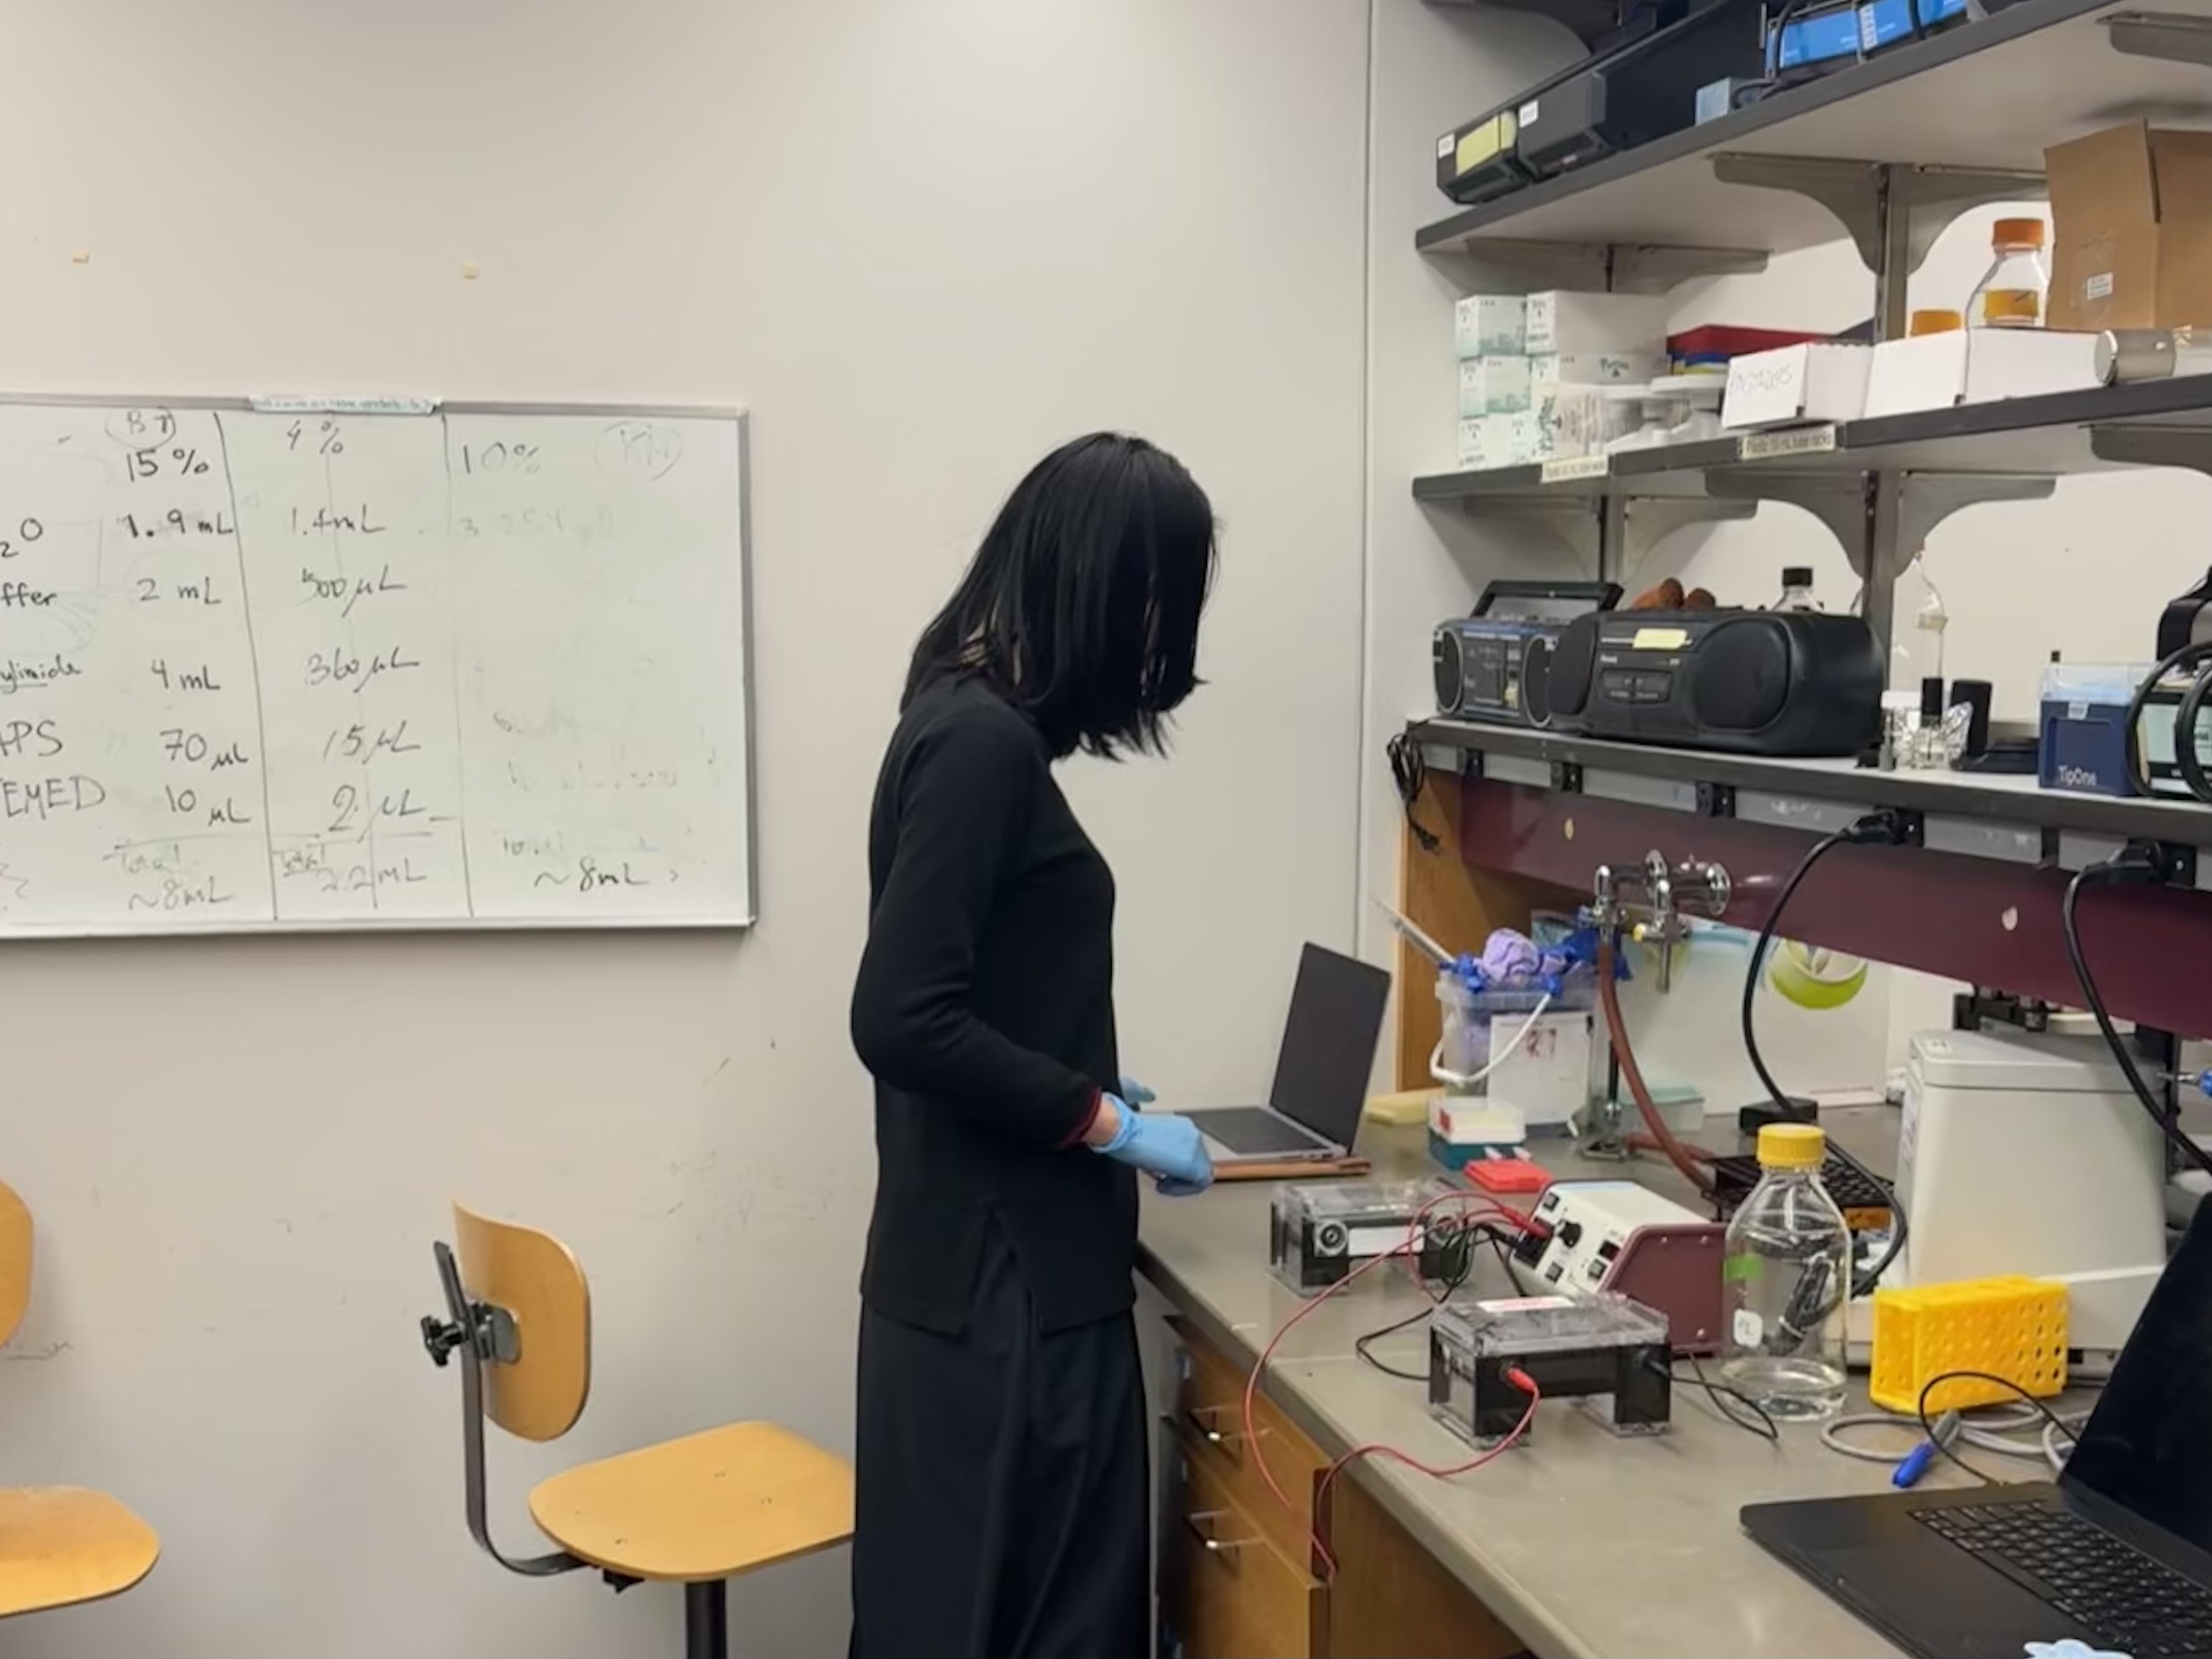
Part 2: Wet-lab Experiment
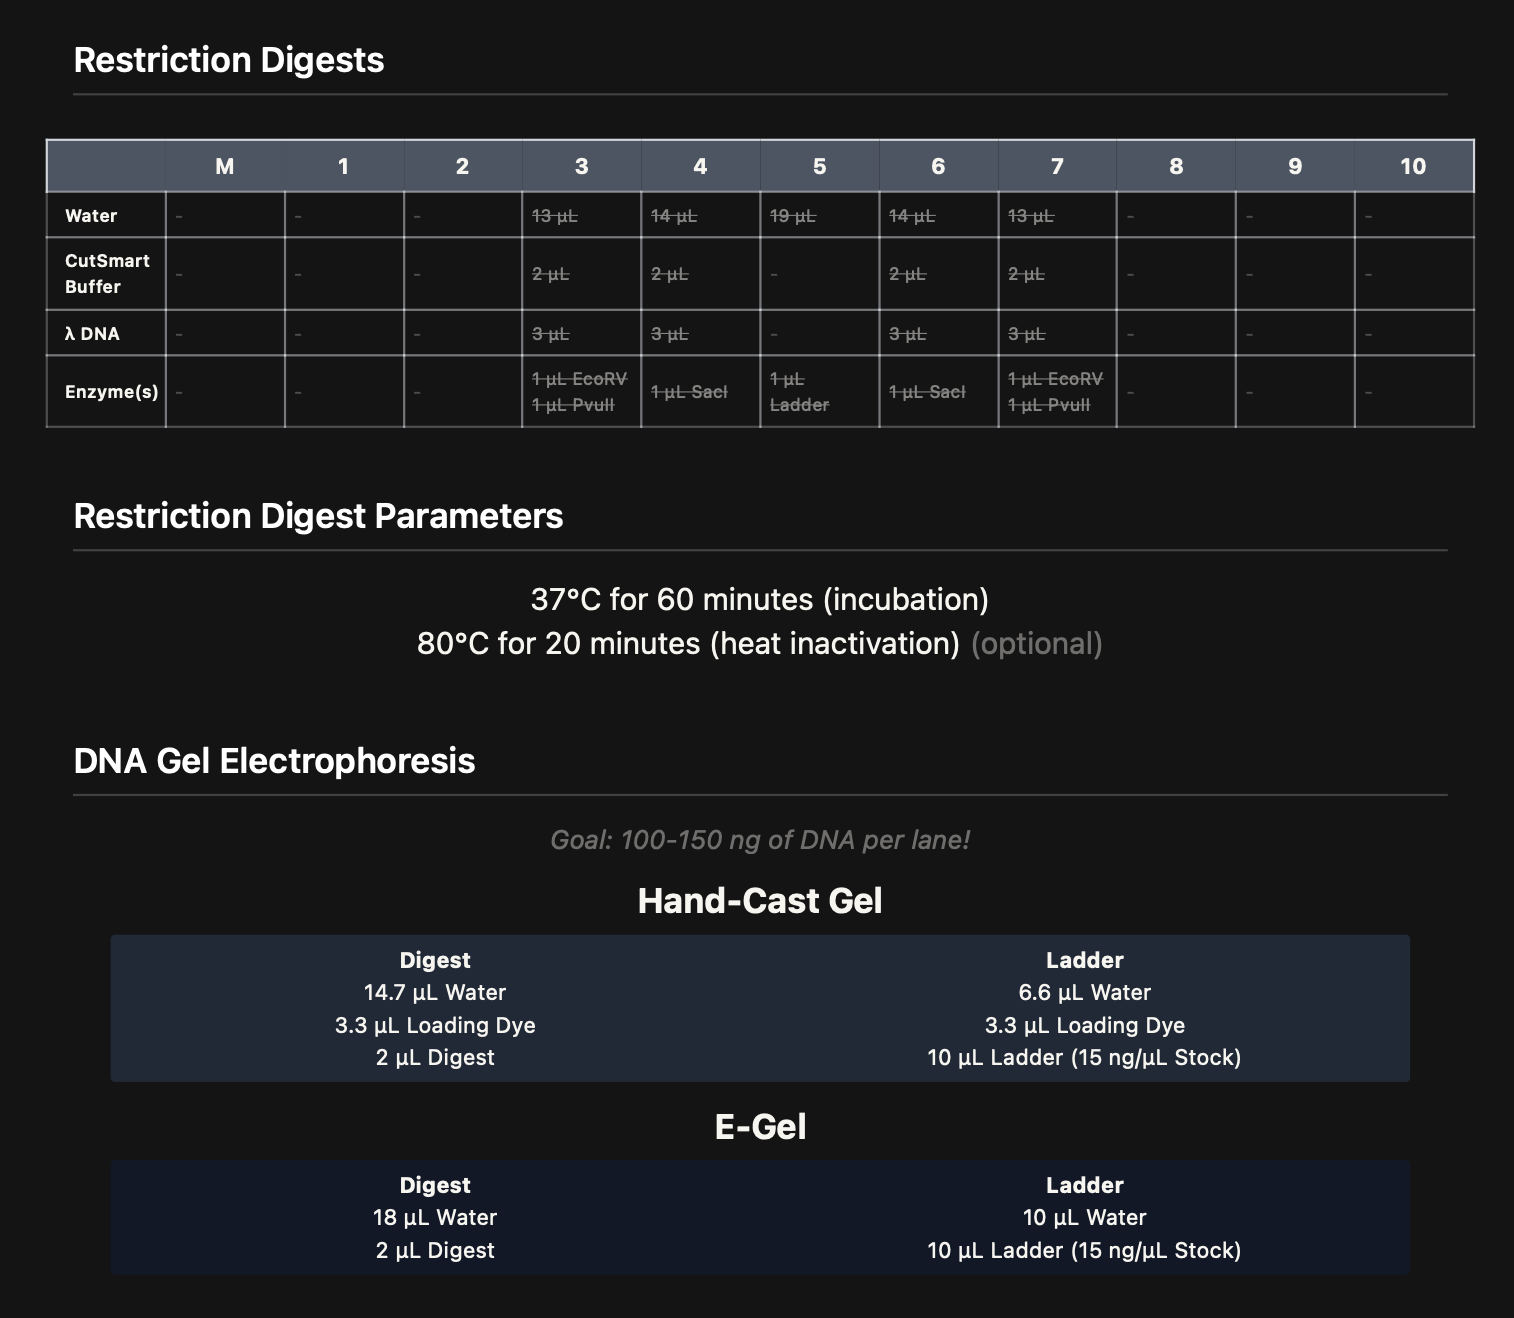
2.1 Restriction Digest
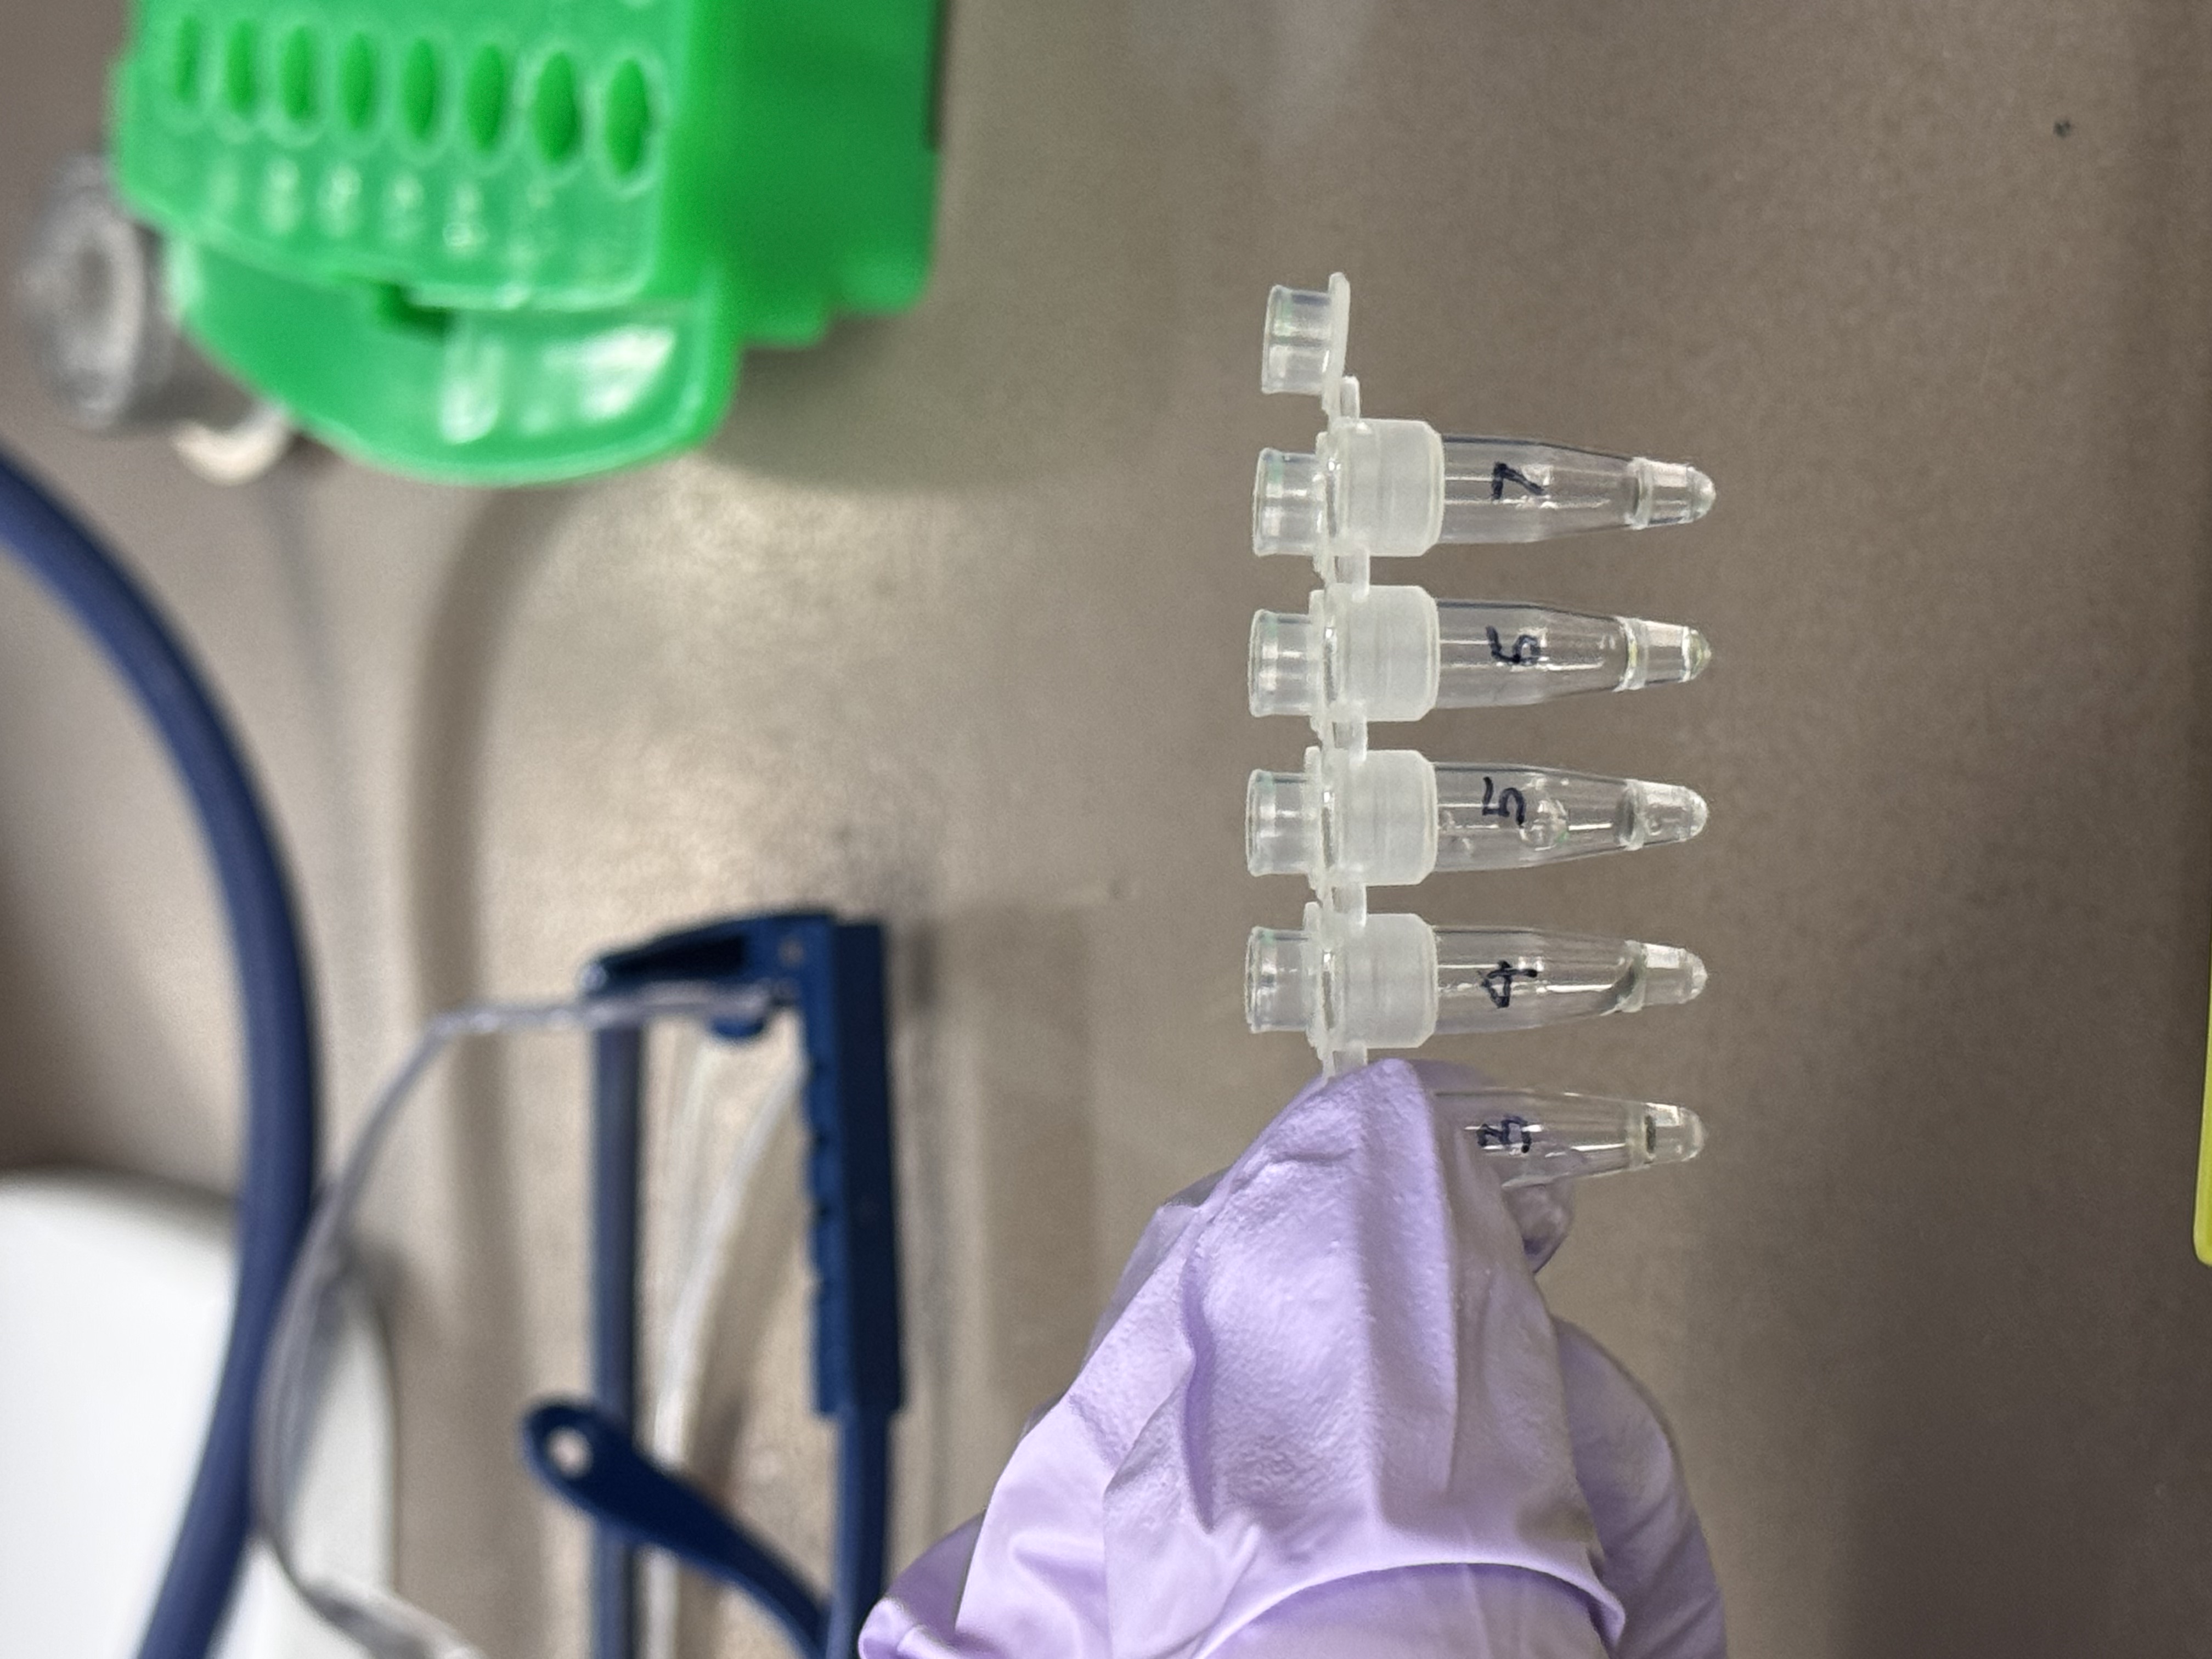
I prepared restriction digests using Lambda DNA and 10X CutSmart buffer for all reactions. Enzymes were added last.
- DNA: Lambda DNA
- Buffer: 10X CutSmart
- Enzymes: restriction enzymes
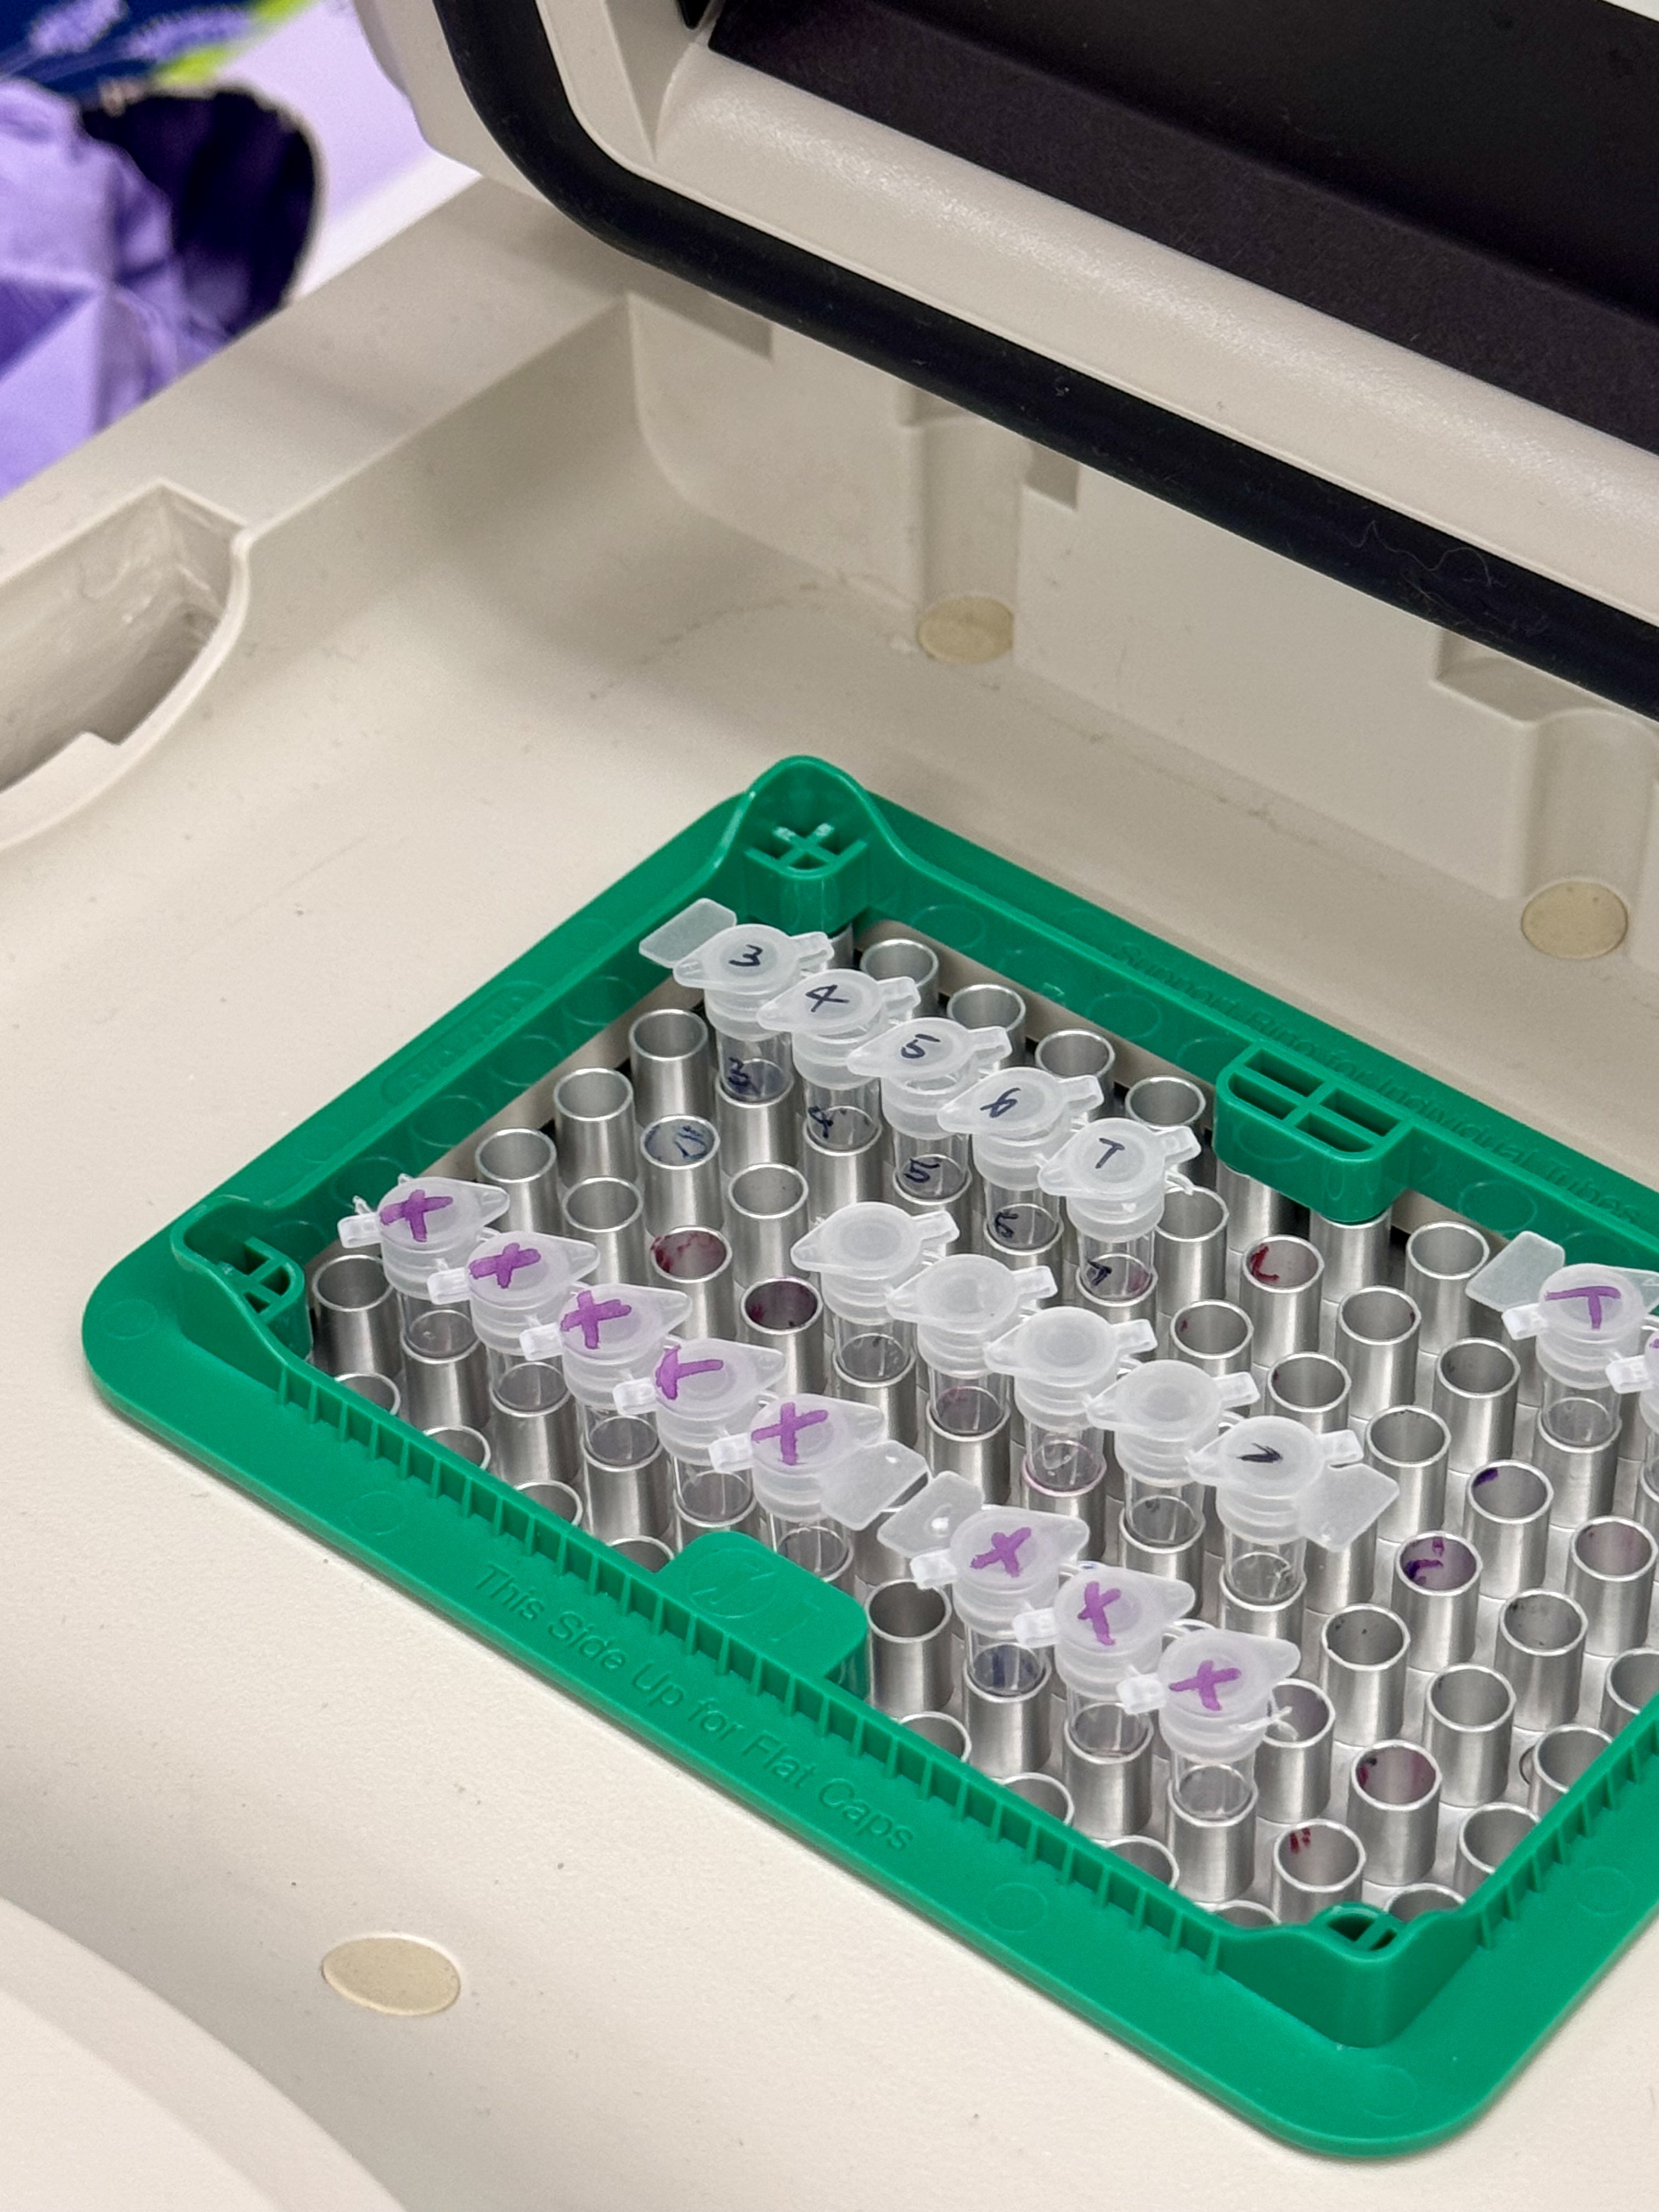
- Incubation: 37°C, 40 min
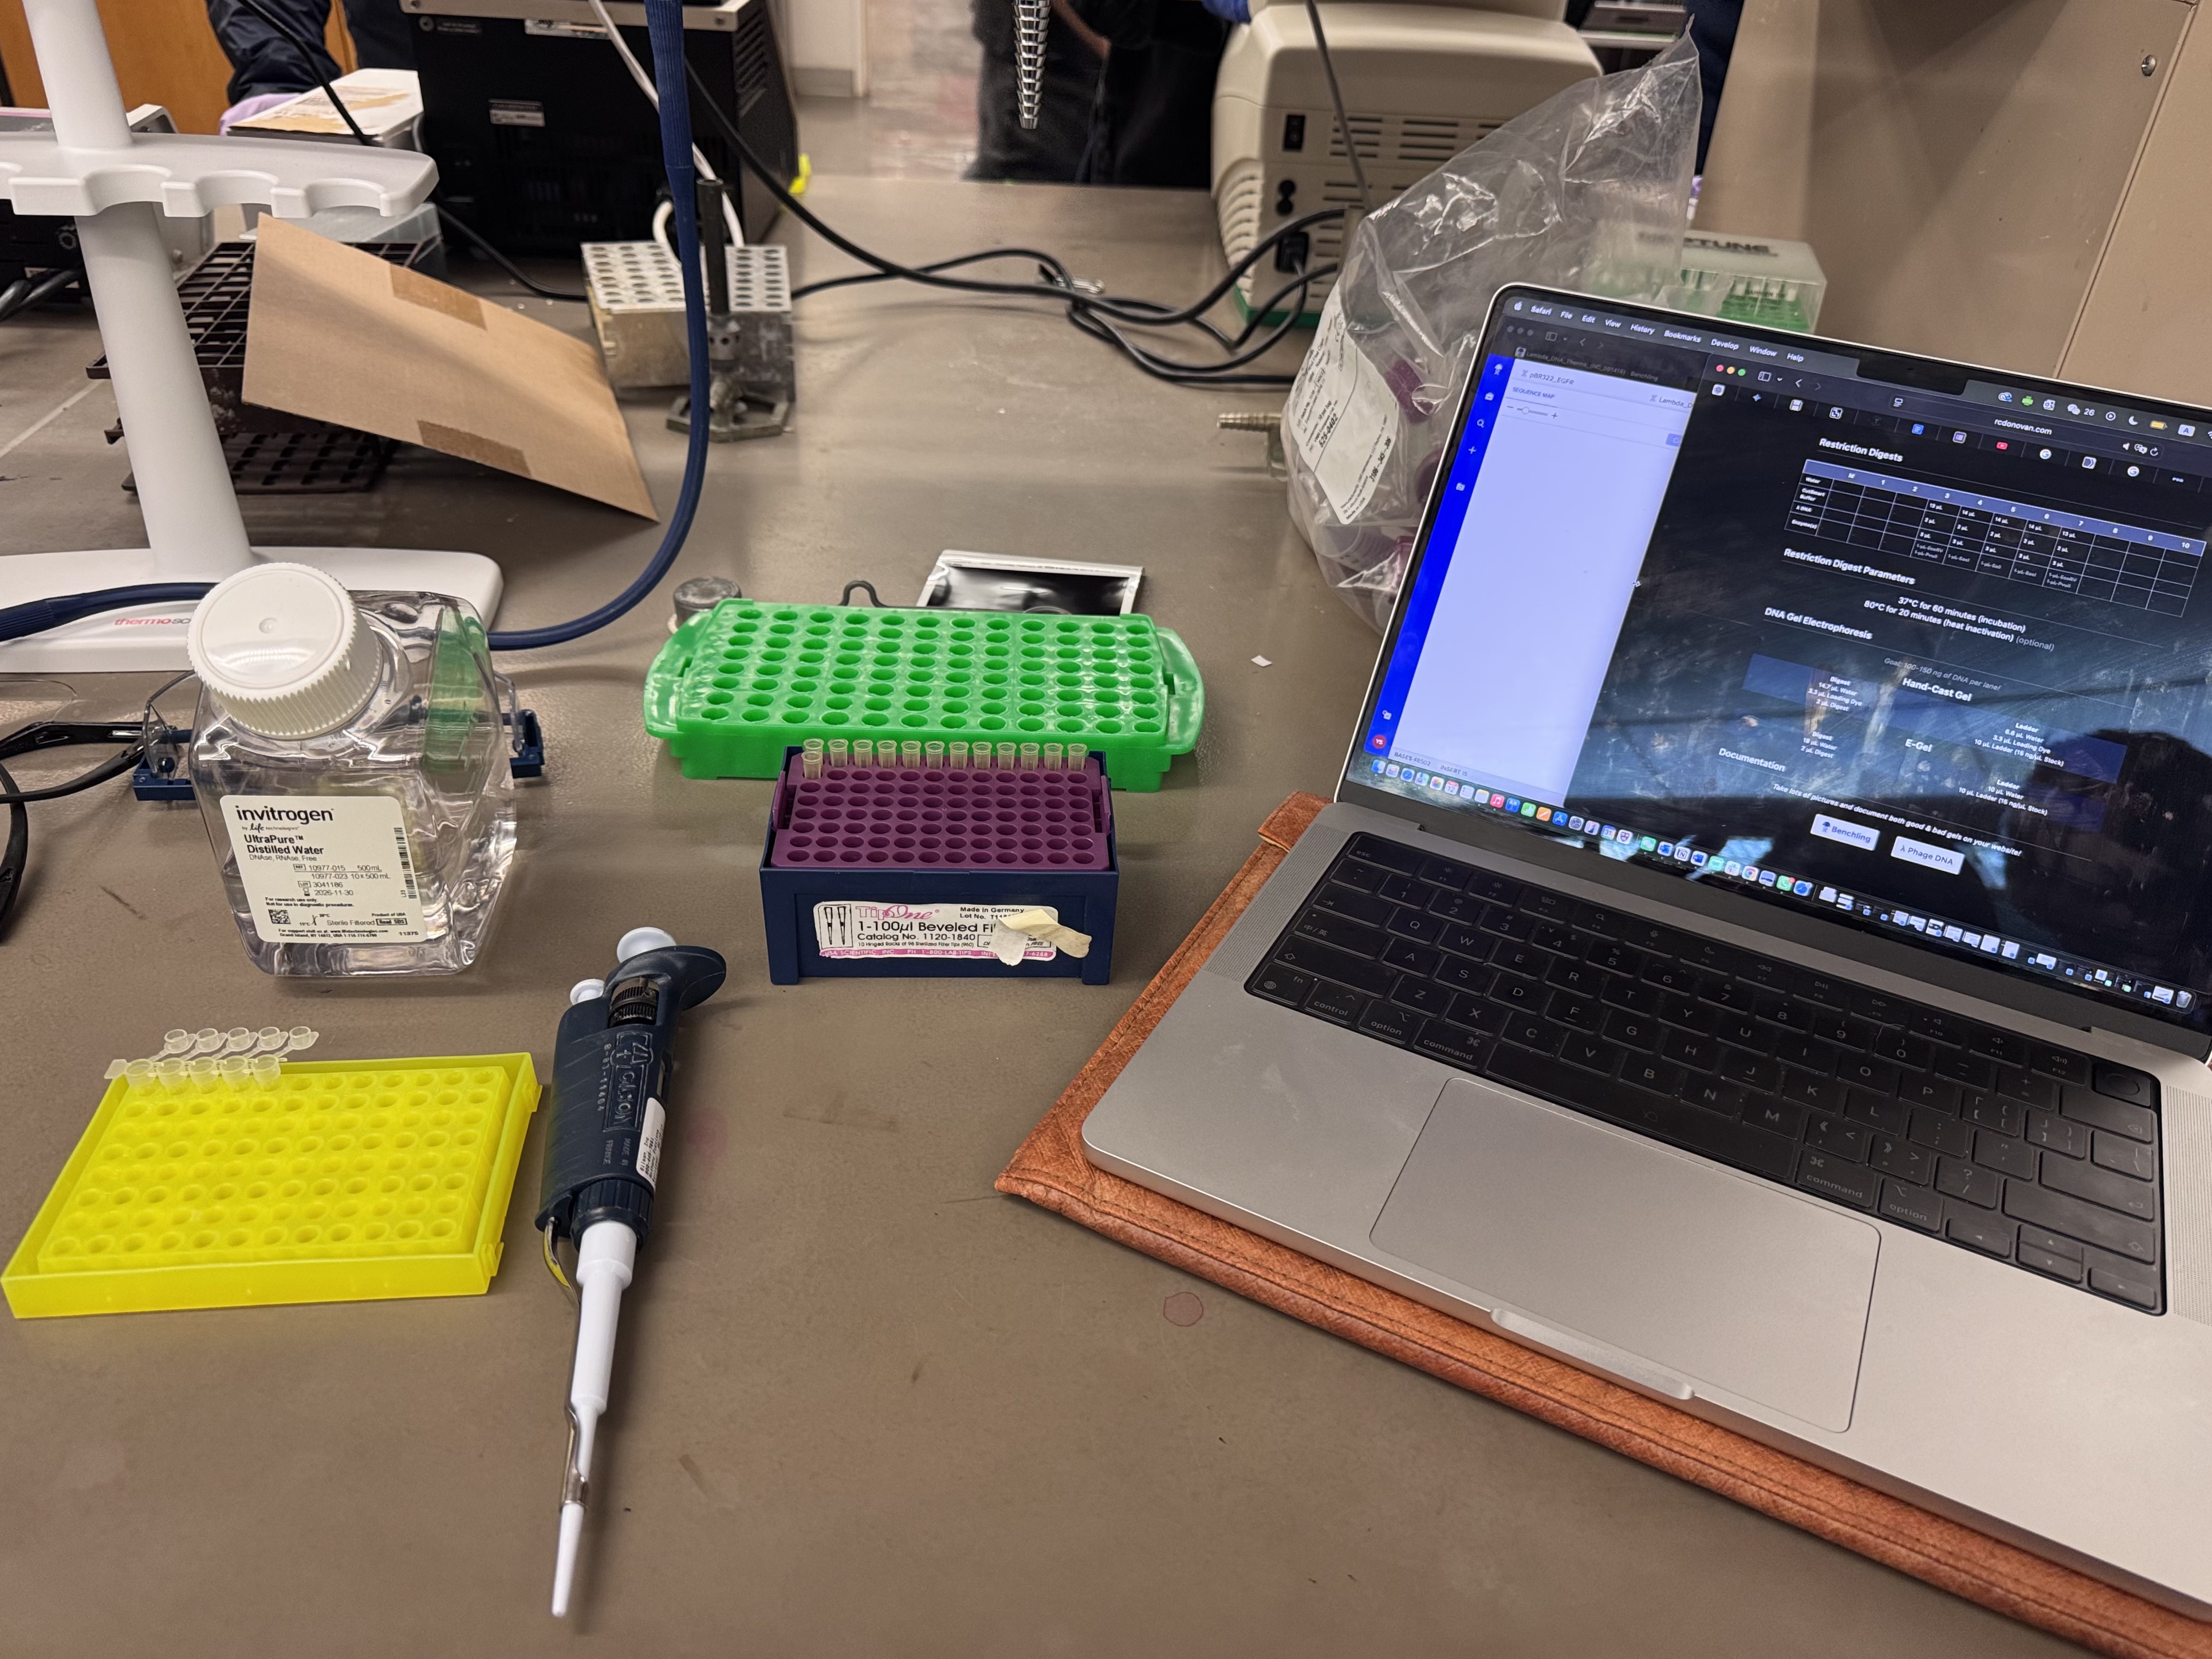
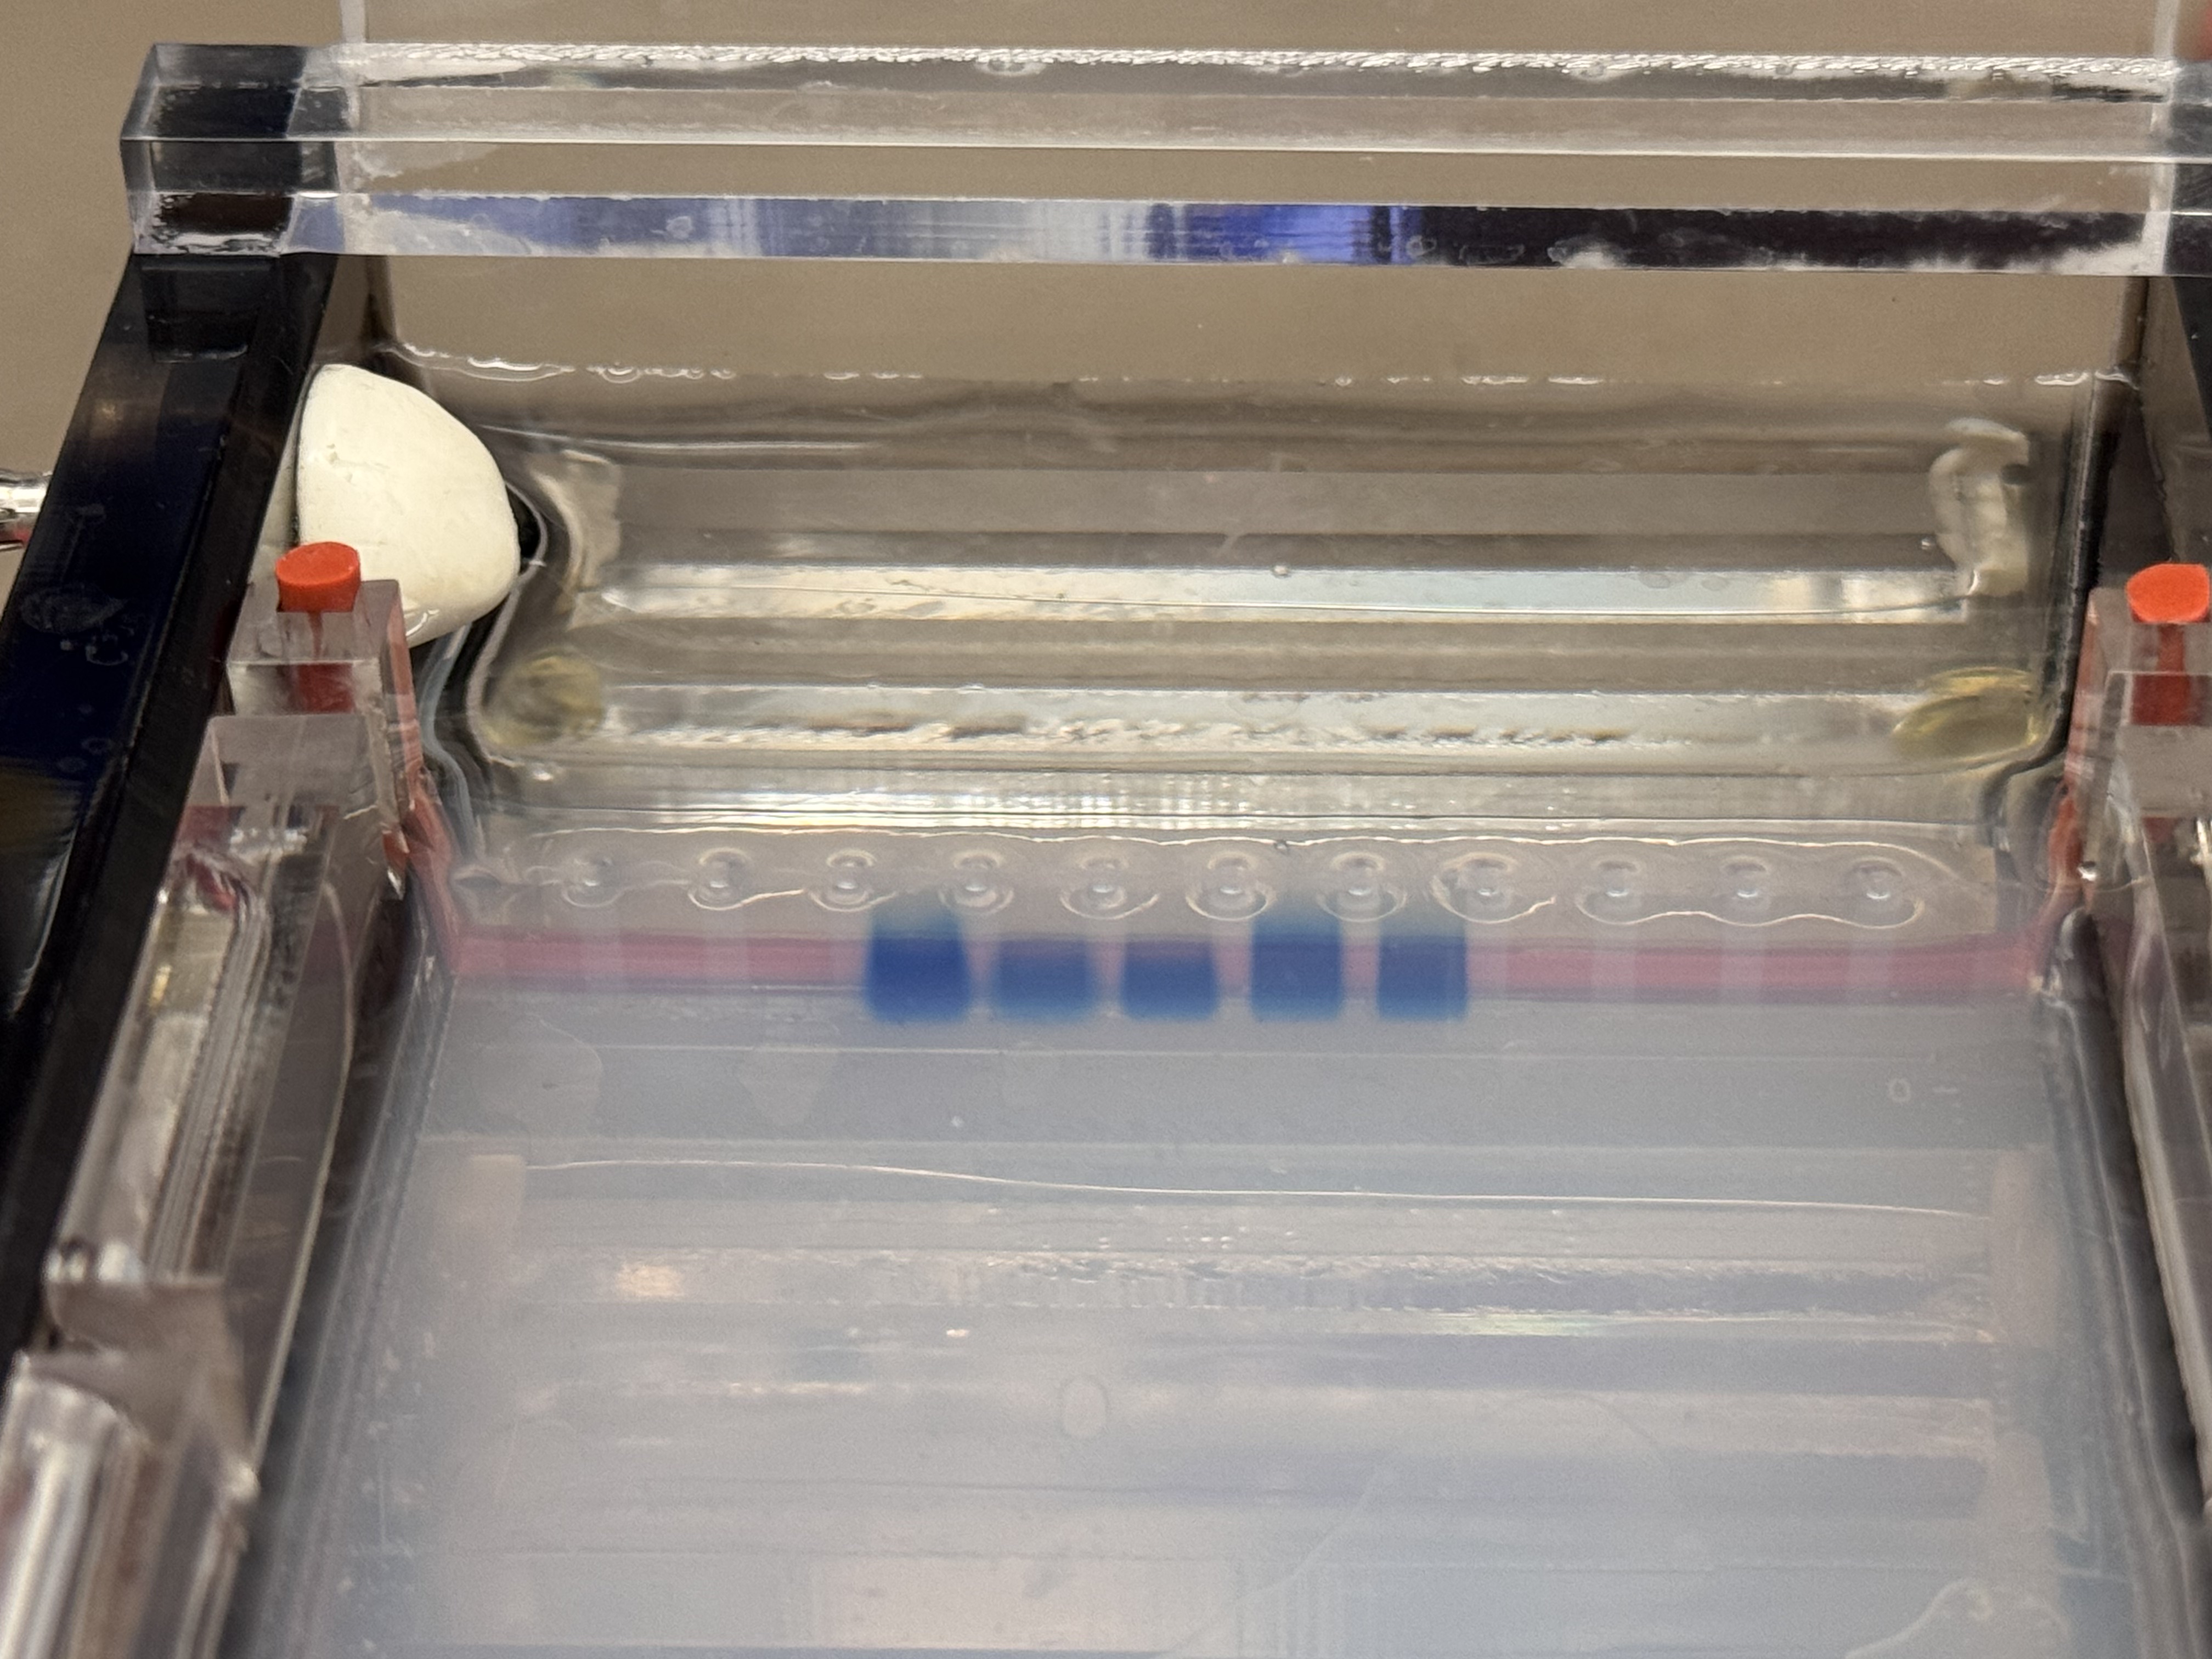
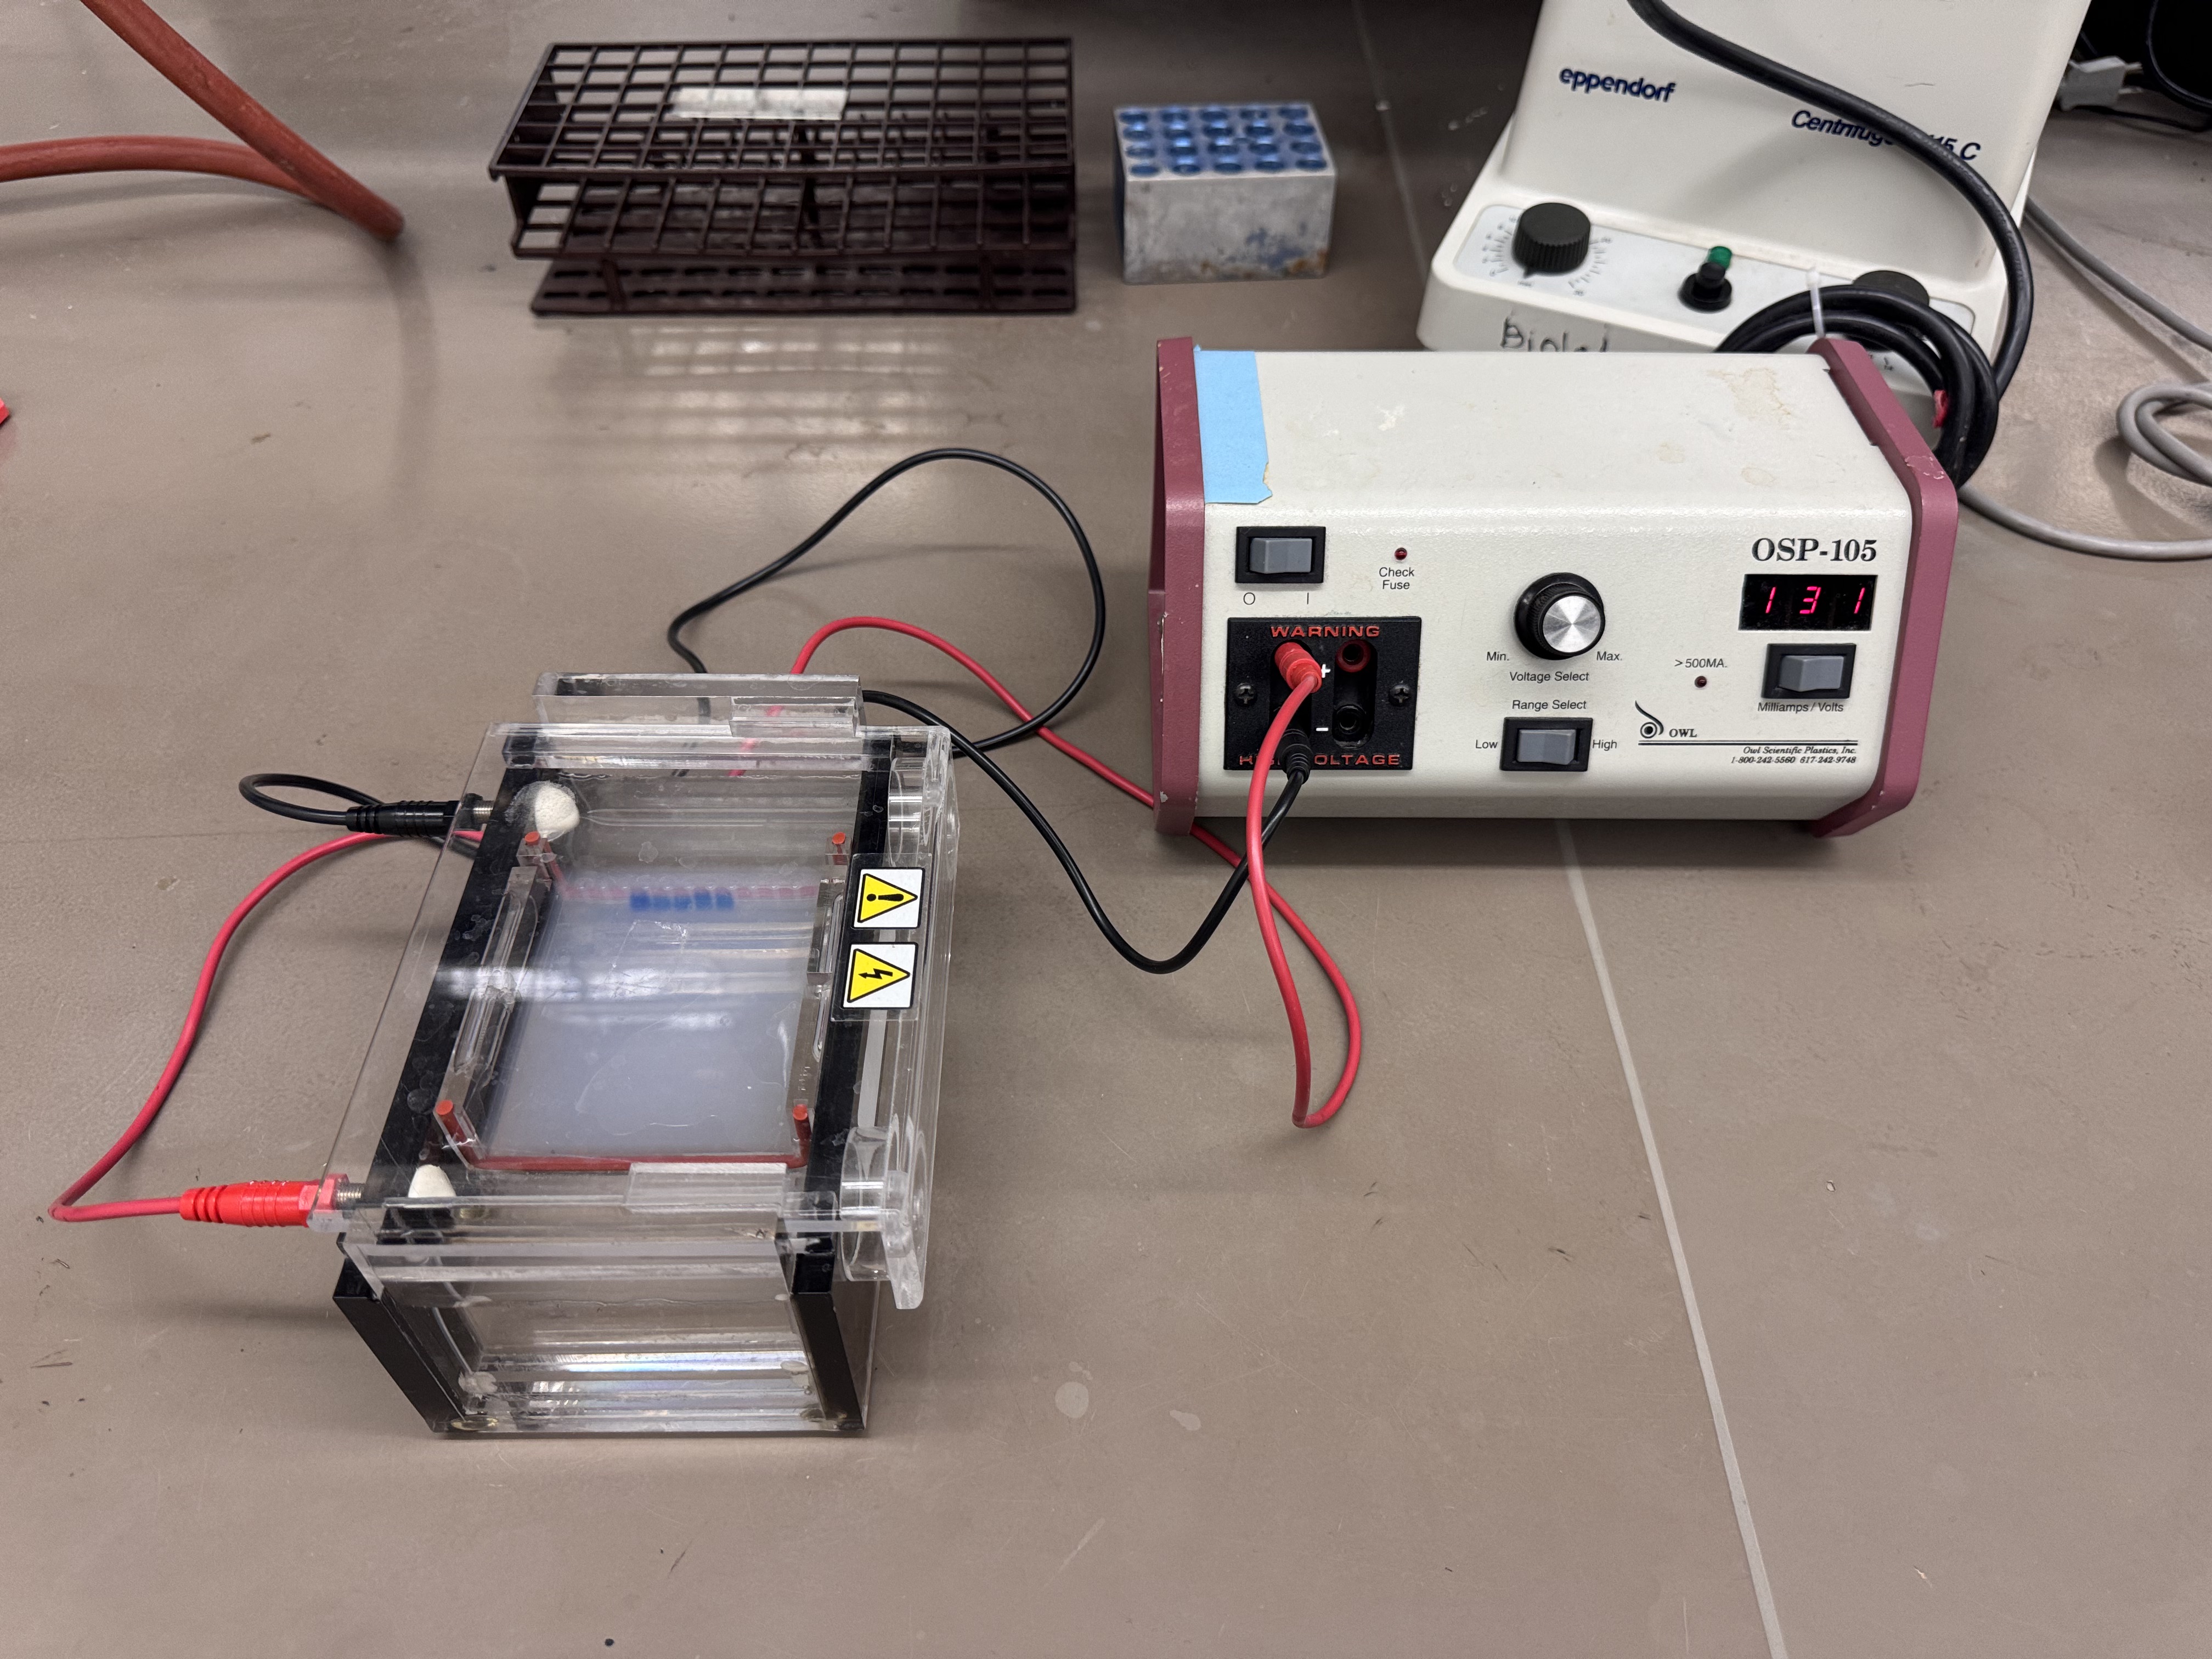
2.2 Gel Electrophoresis
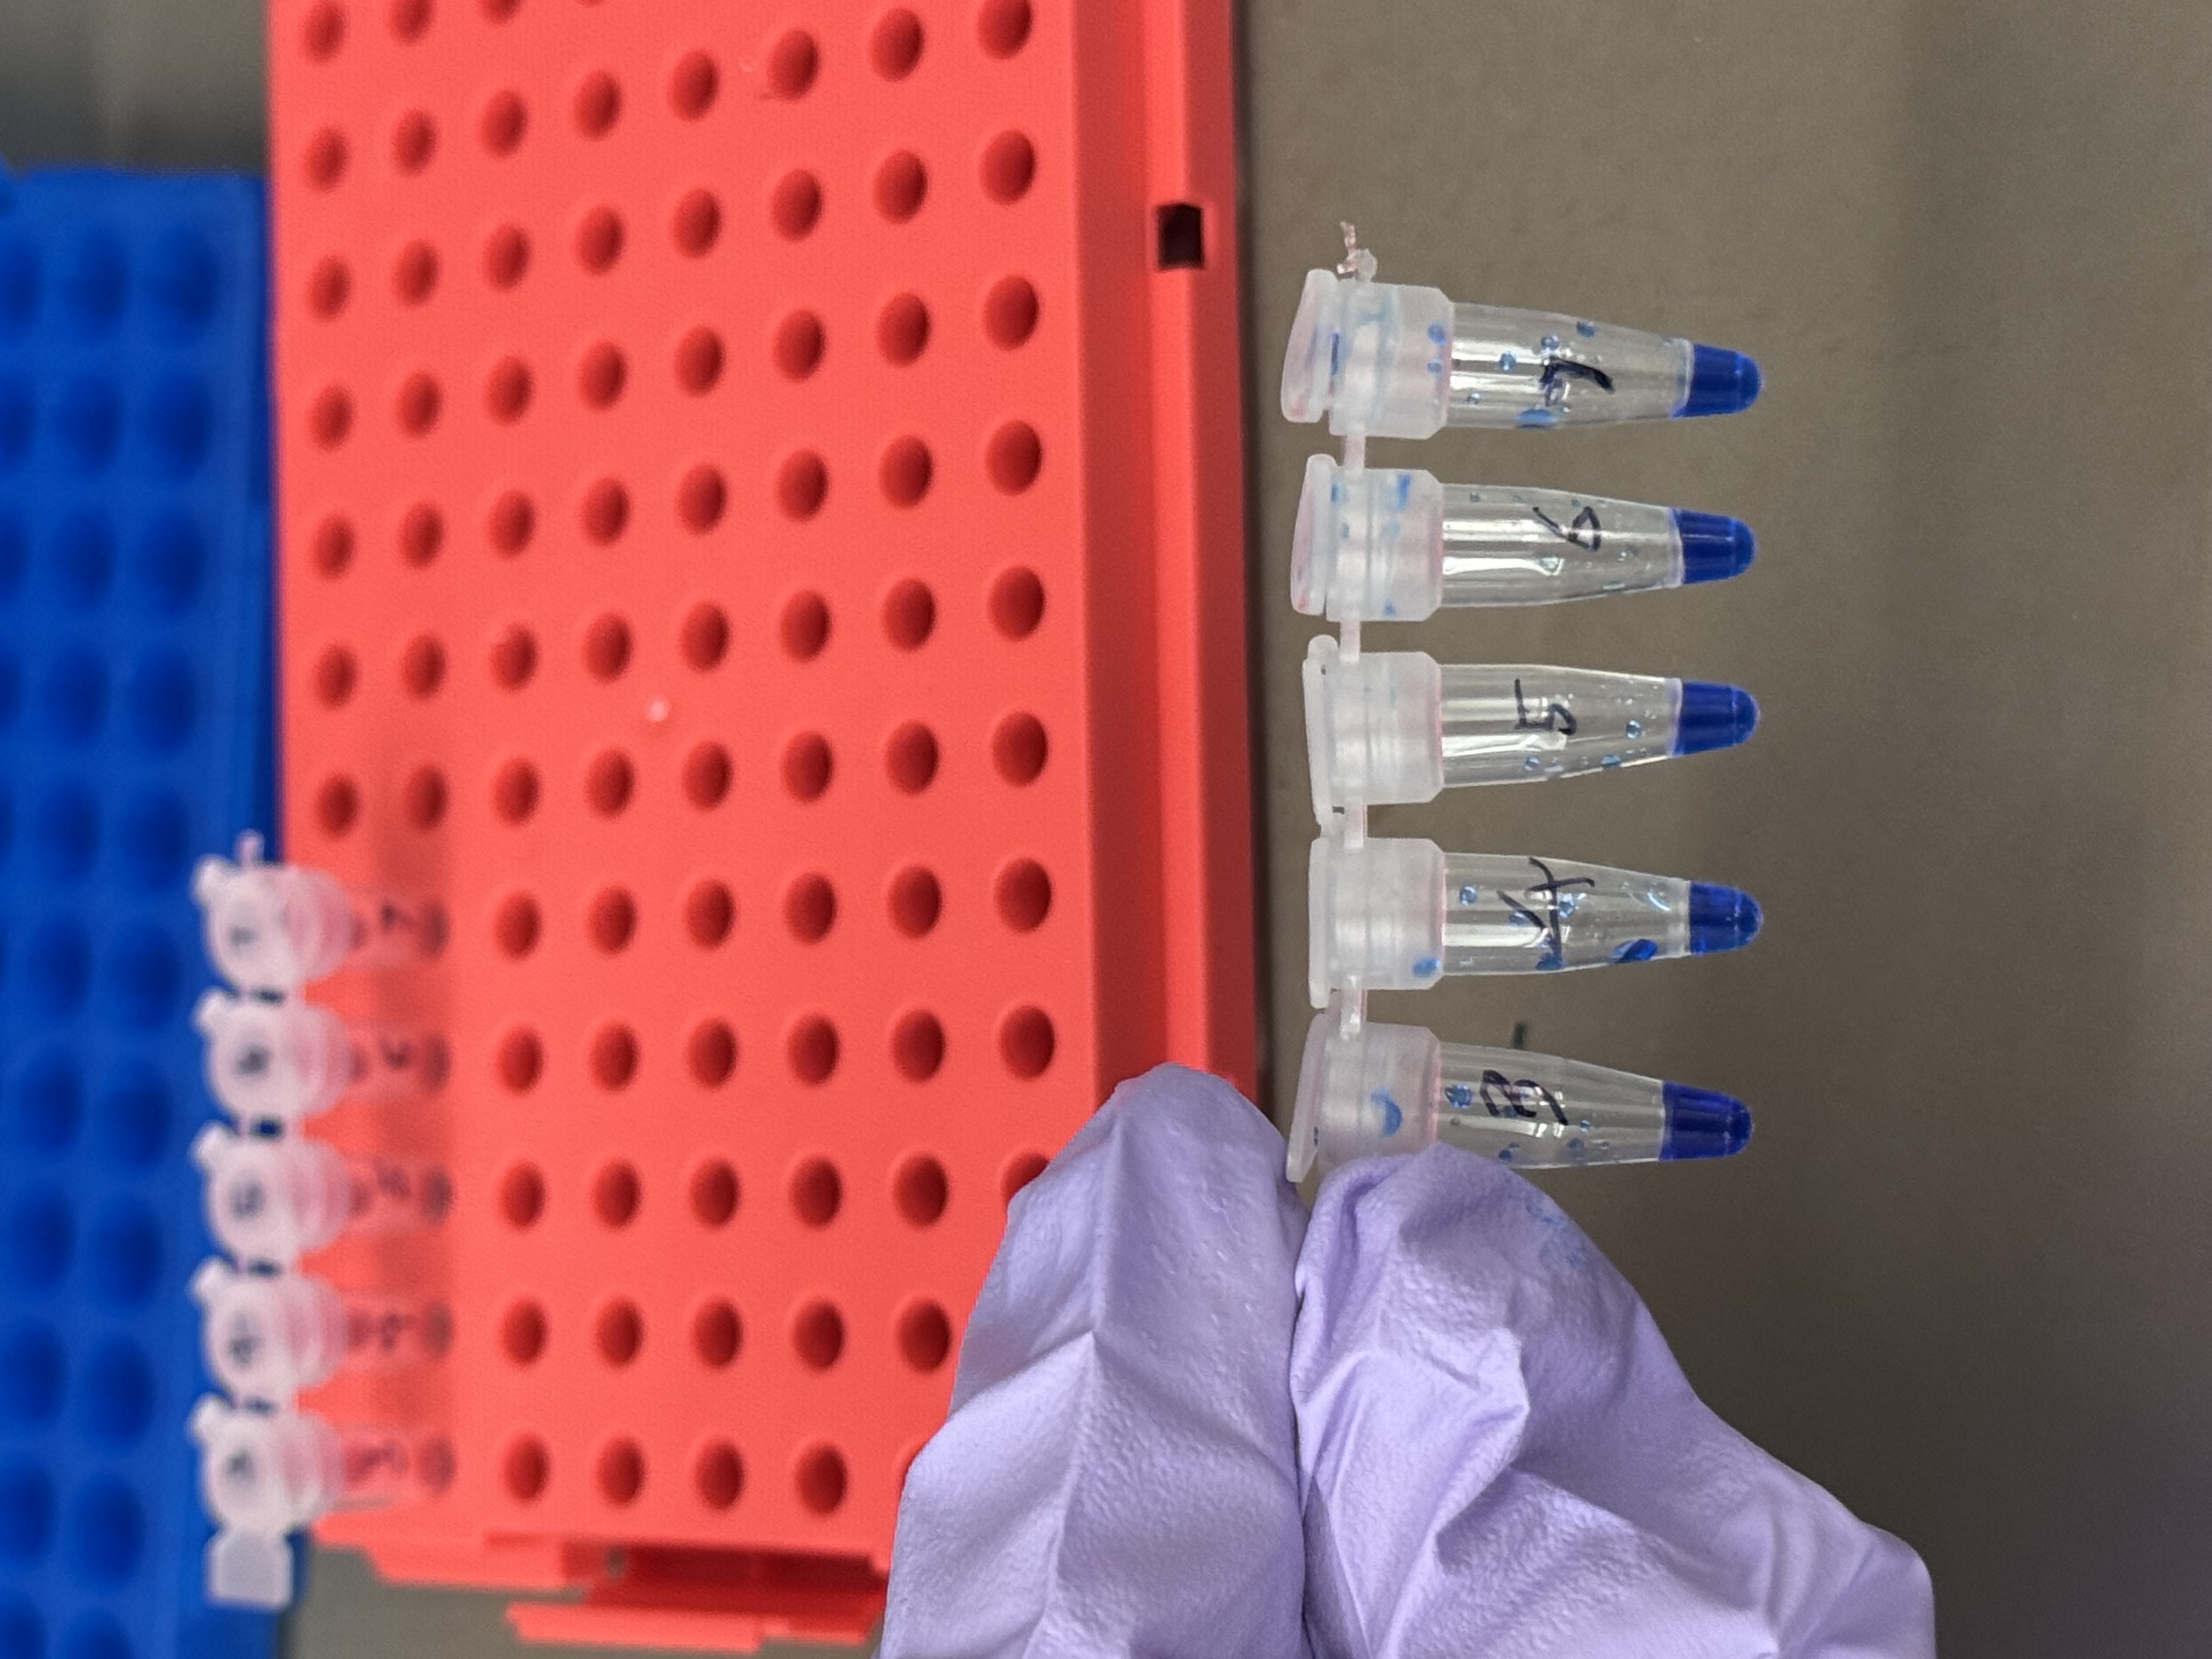
I used a 1% agarose gel and loaded the digested samples into the wells.
- Voltage: 130V
- Time: 40 mins
2.3 Deviation
The intended mouth lane (lane 5) in Benchling was Lambda_DNA_Thermo_(NC_001416) + SalI. Due to an Automation Art configuration error, the corresponding wet-lab reaction was prepared without SalI.
3. Results and Observations
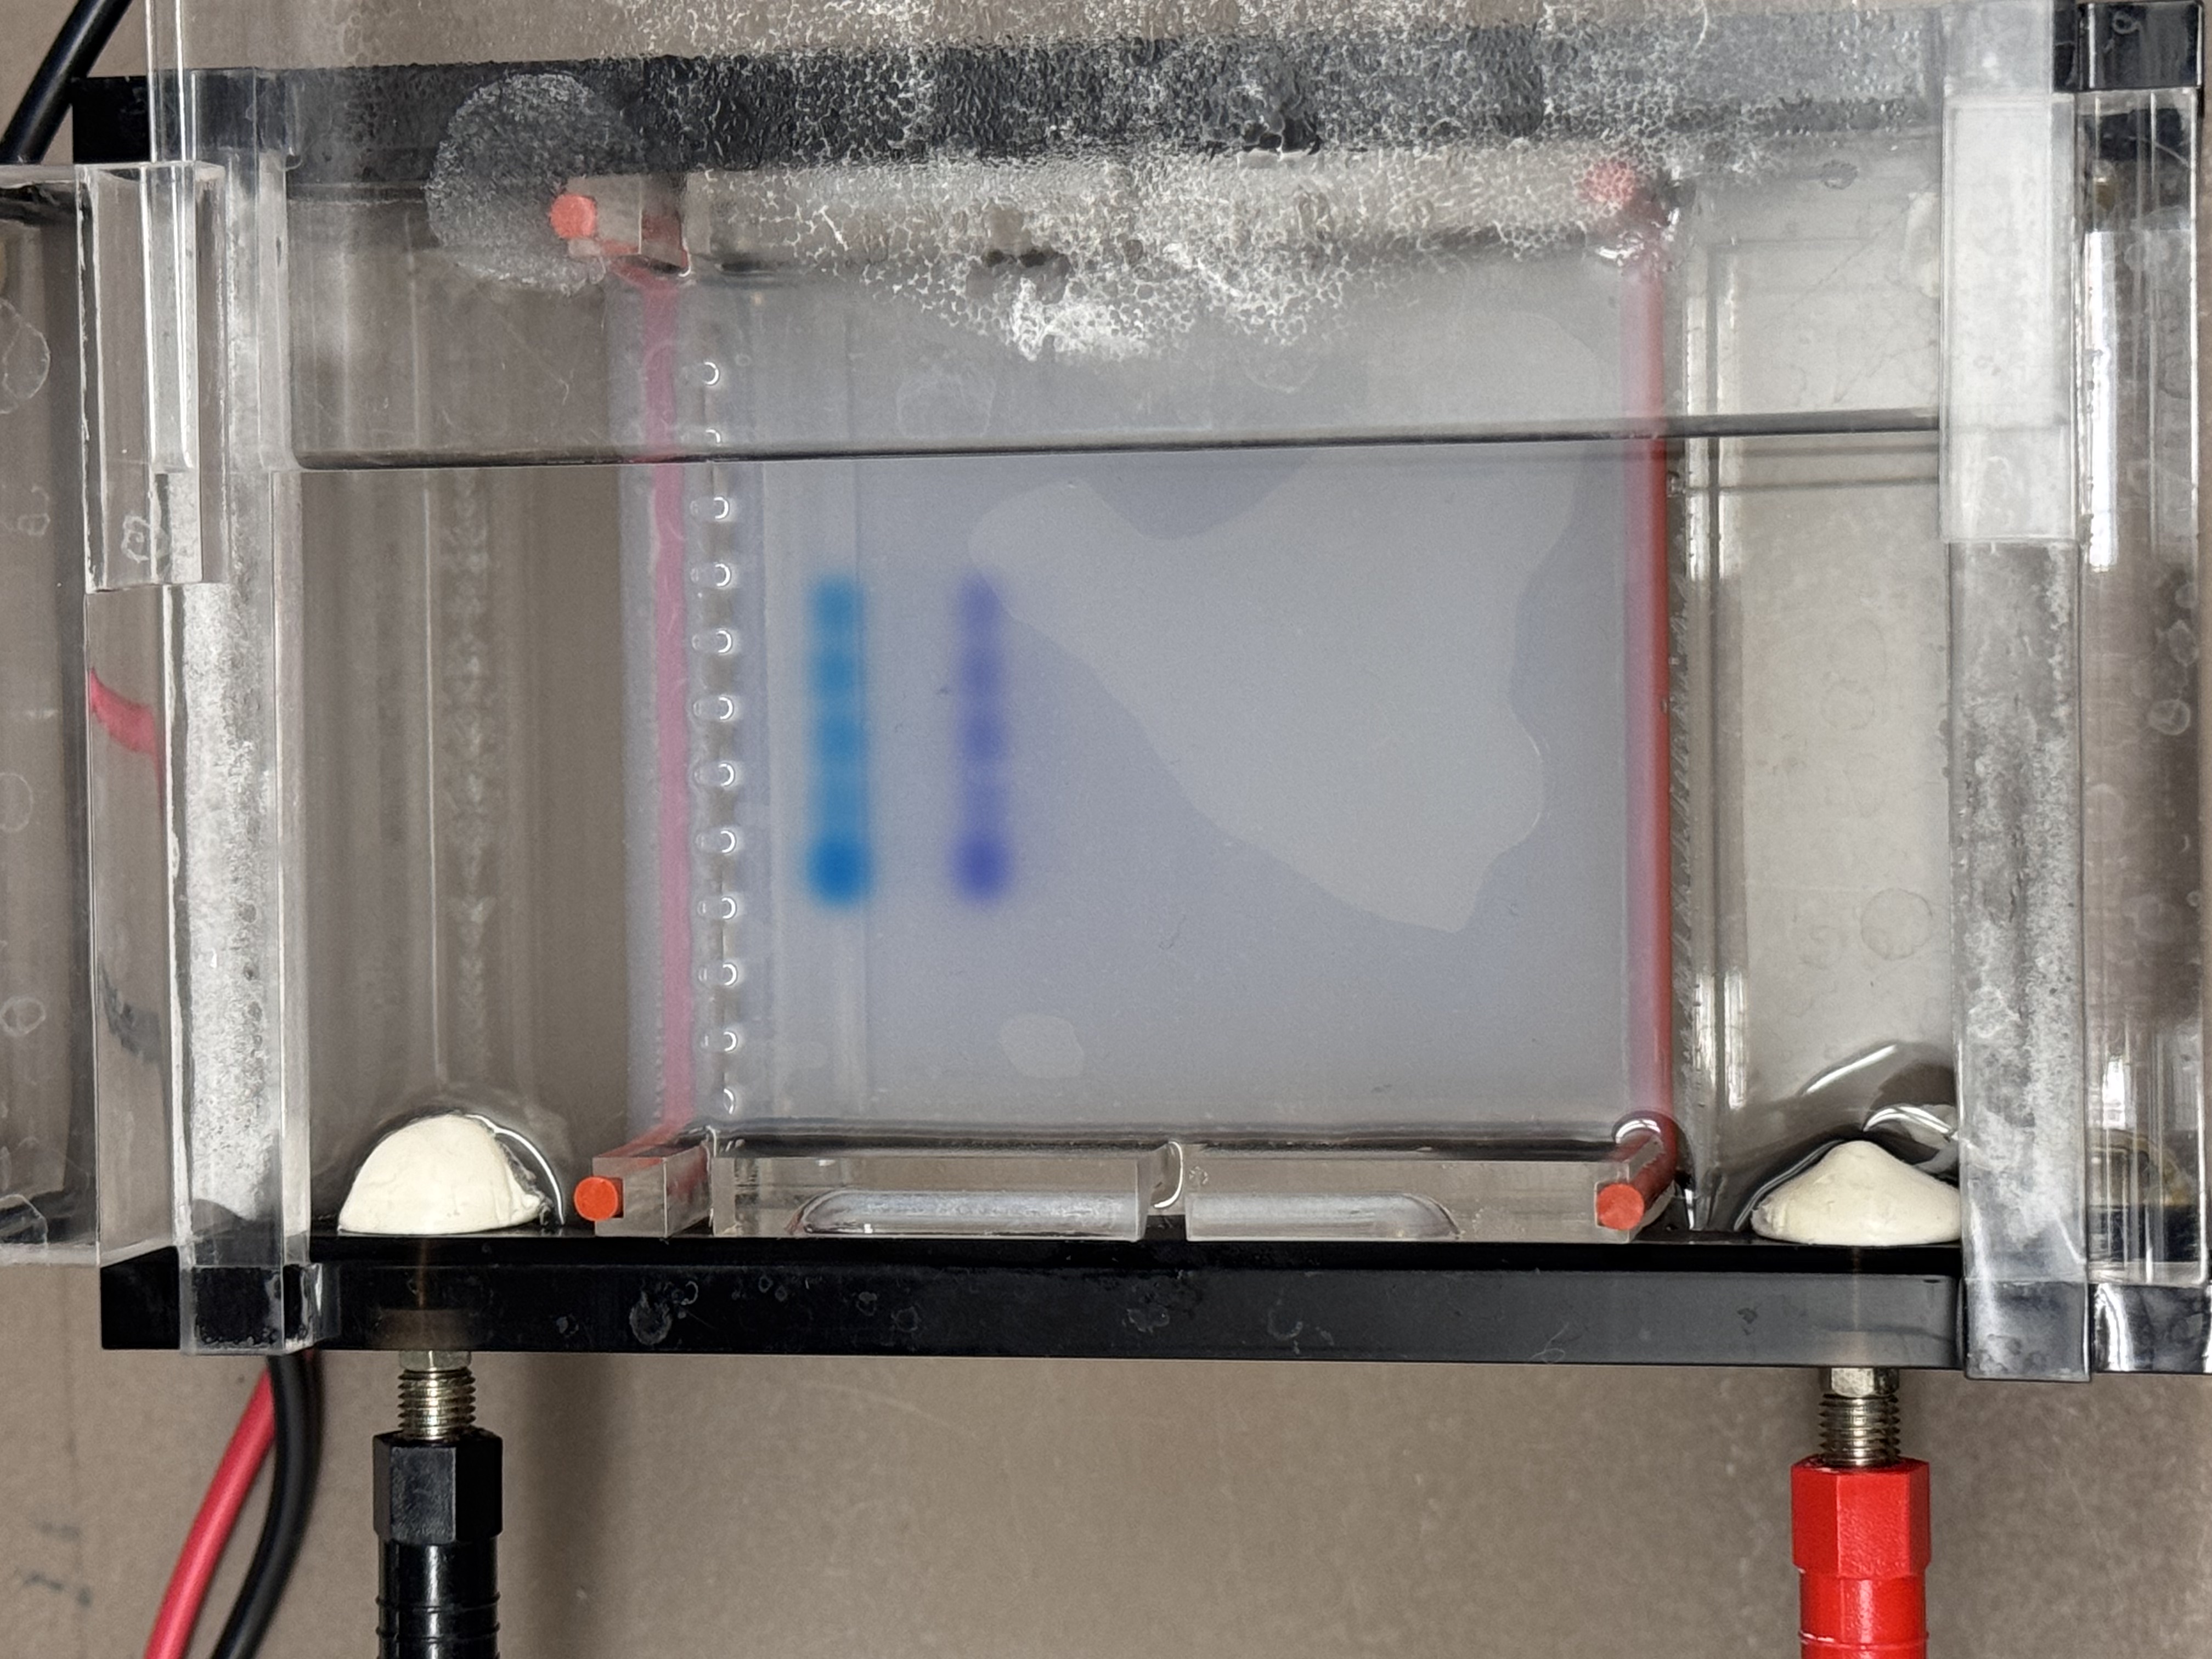
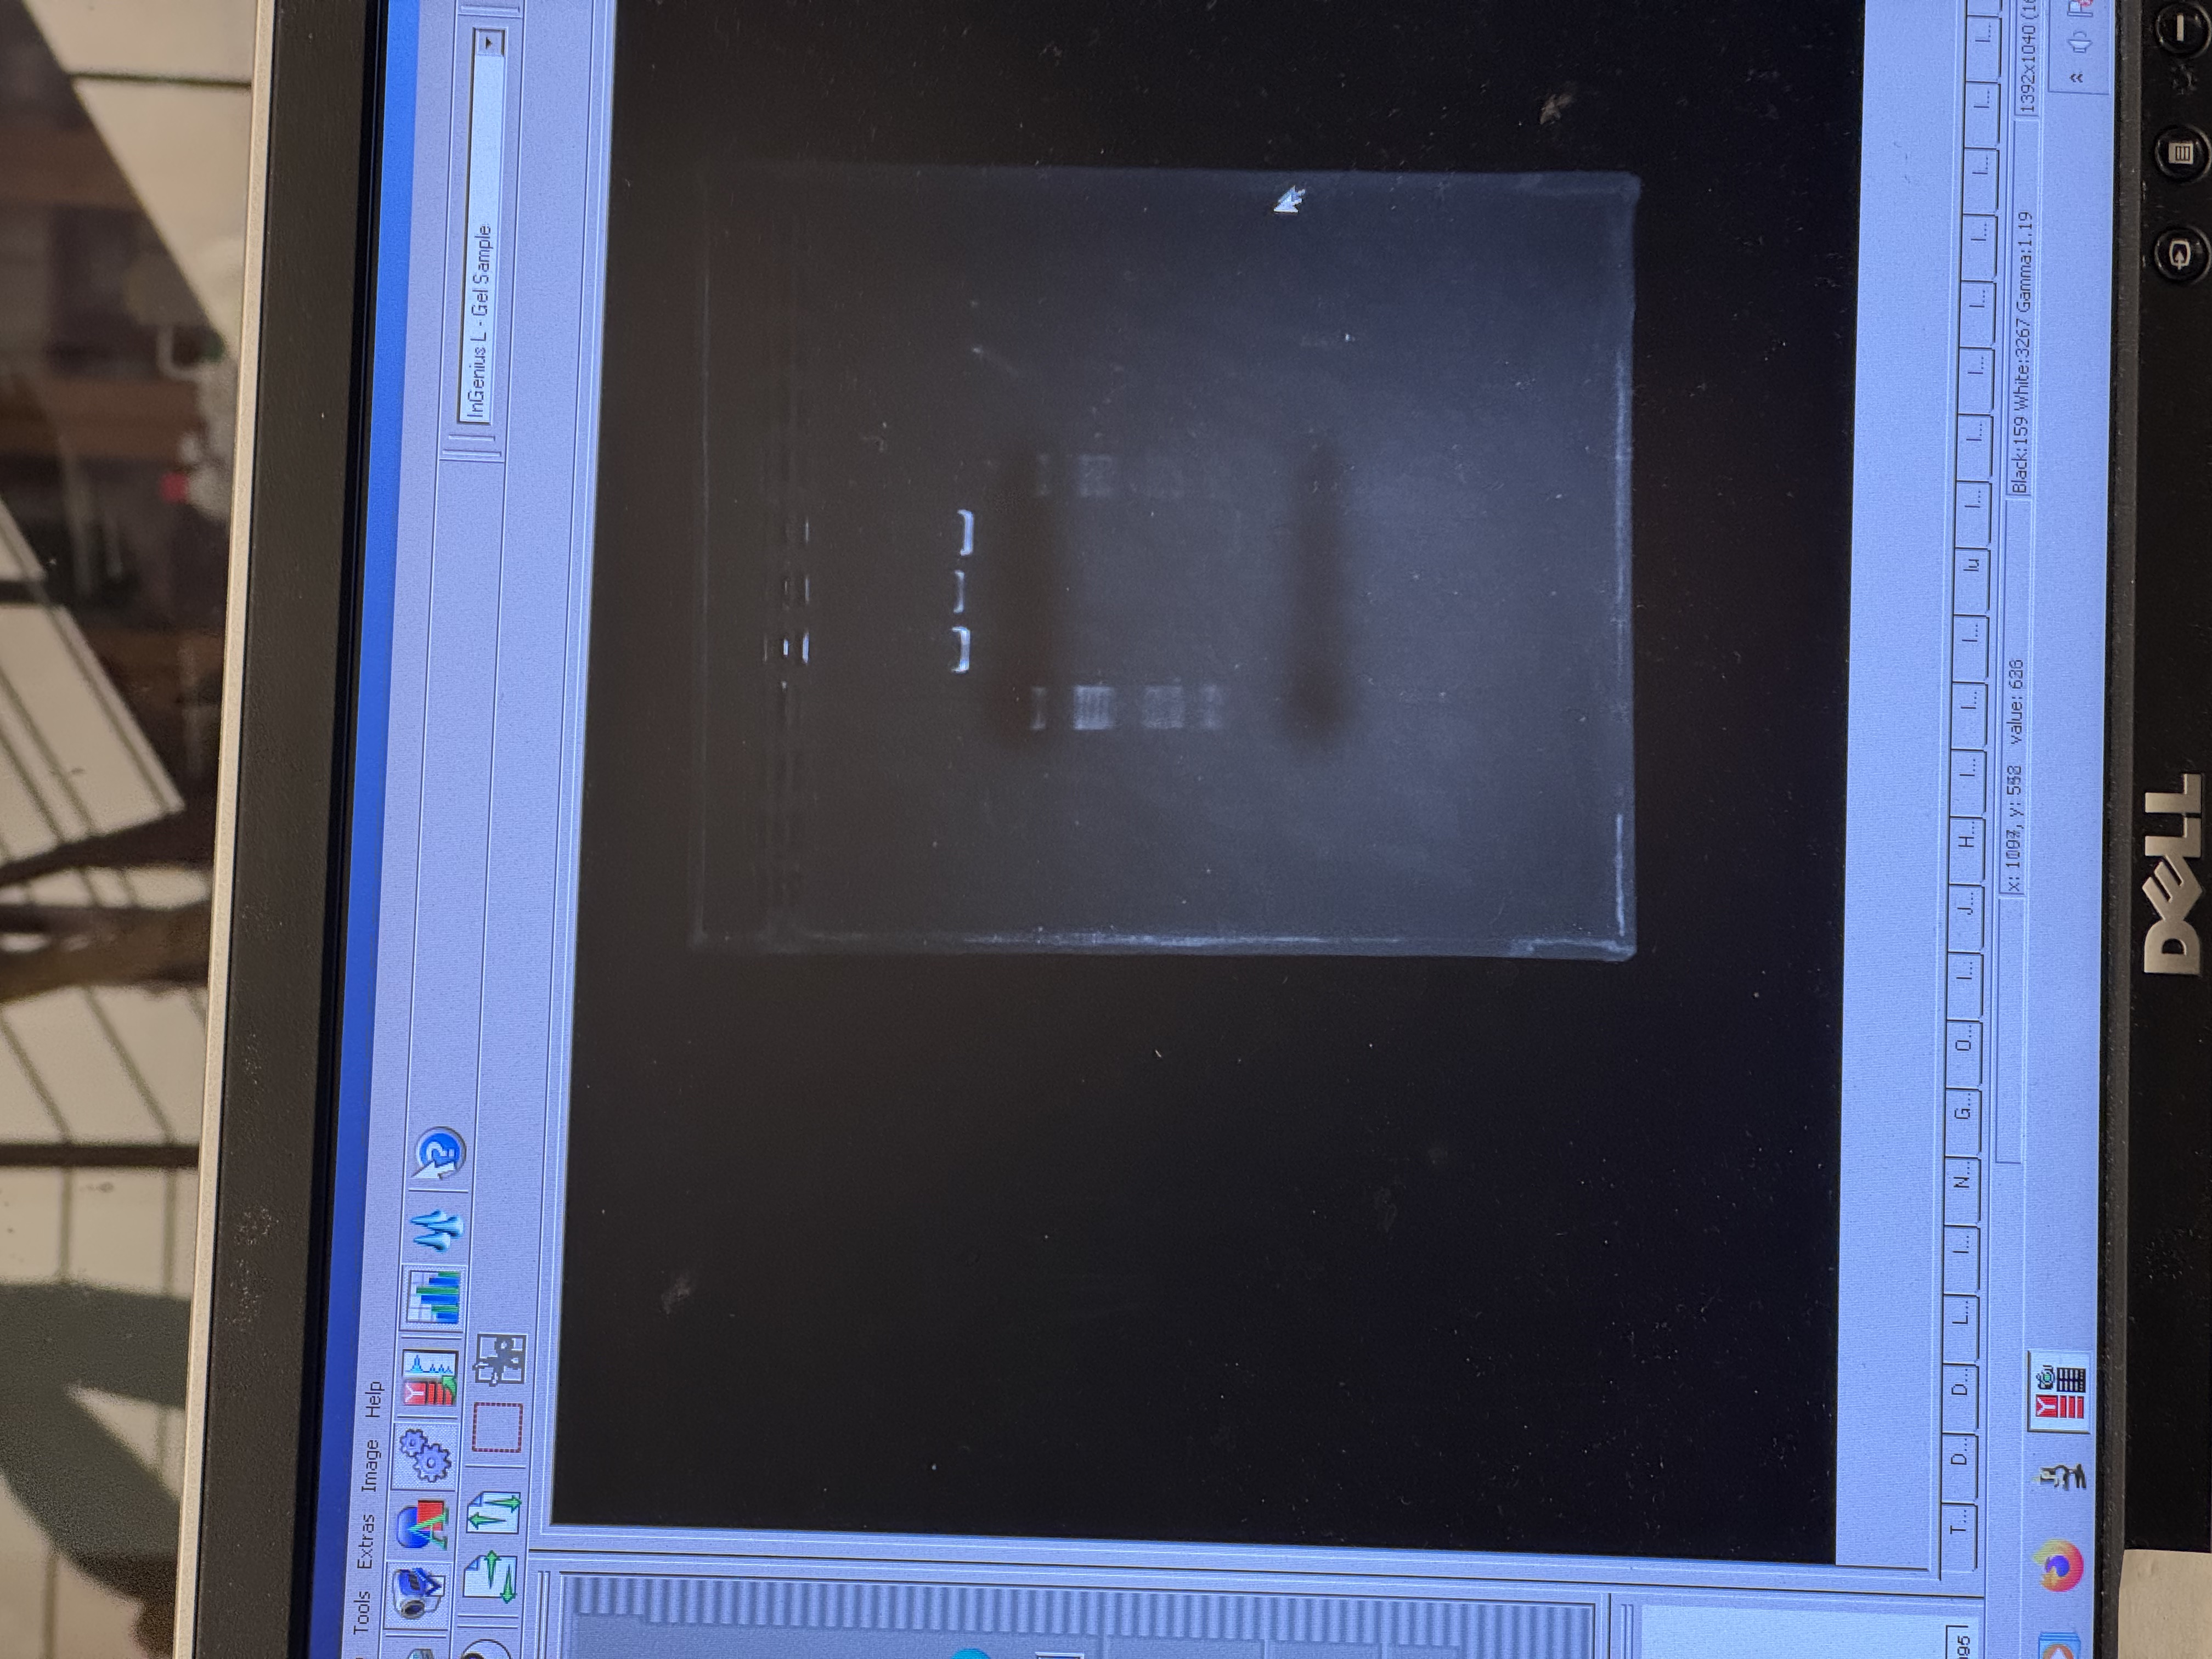
3.1 The Final Gel Art
3.2 Failures & Reflections
In the final gel, lanes 4 and 6 most closely matched the expected composite pattern in terms of band position and clarity. Lane 5 produced a visible band, but it likely reflects a setup error rather than the intended condition: in Benchling, the “mouth” lane was designed as Lambda_DNA_Thermo_(NC_001416) + SalI, but a mid-process misconfiguration in Automation Art propagated into the wet-lab setup, and the corresponding reaction was prepared without SalI (buffer + λ DNA added, SalI omitted). Lanes 3 and 7 did not yield a legible gel-art “image” in this run (lane 3 shows the ladder; lane 7 is faint).
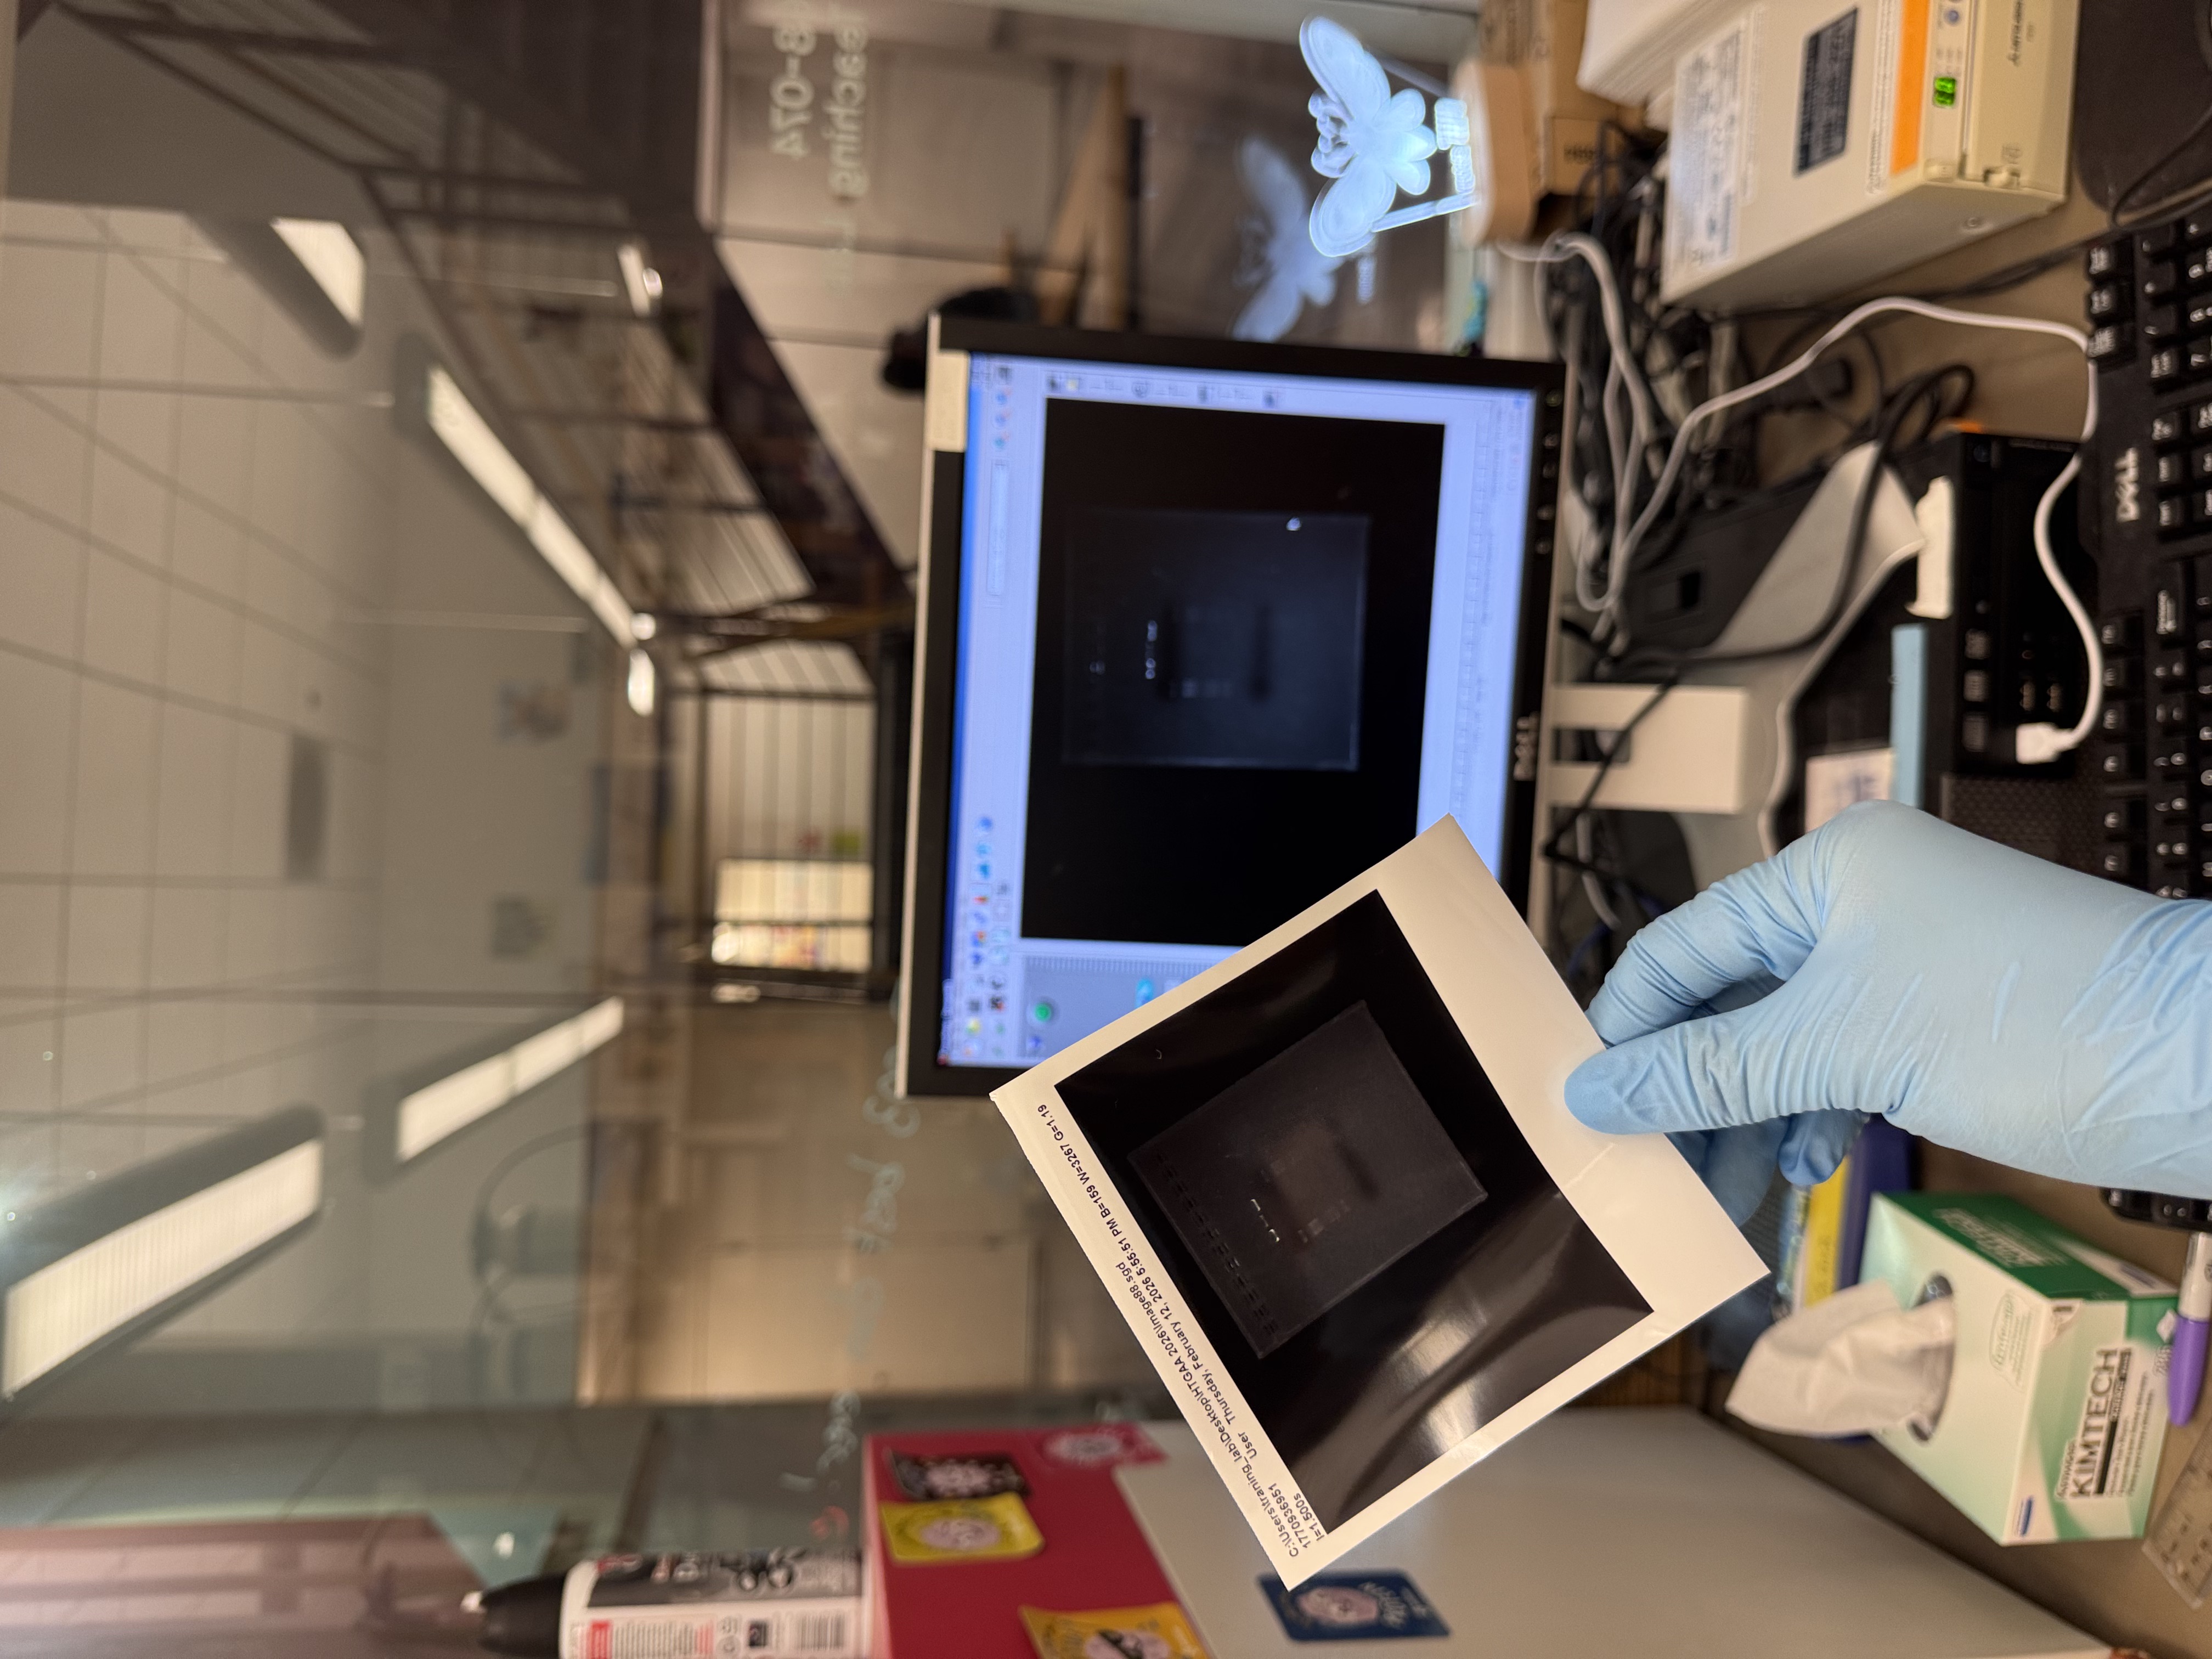
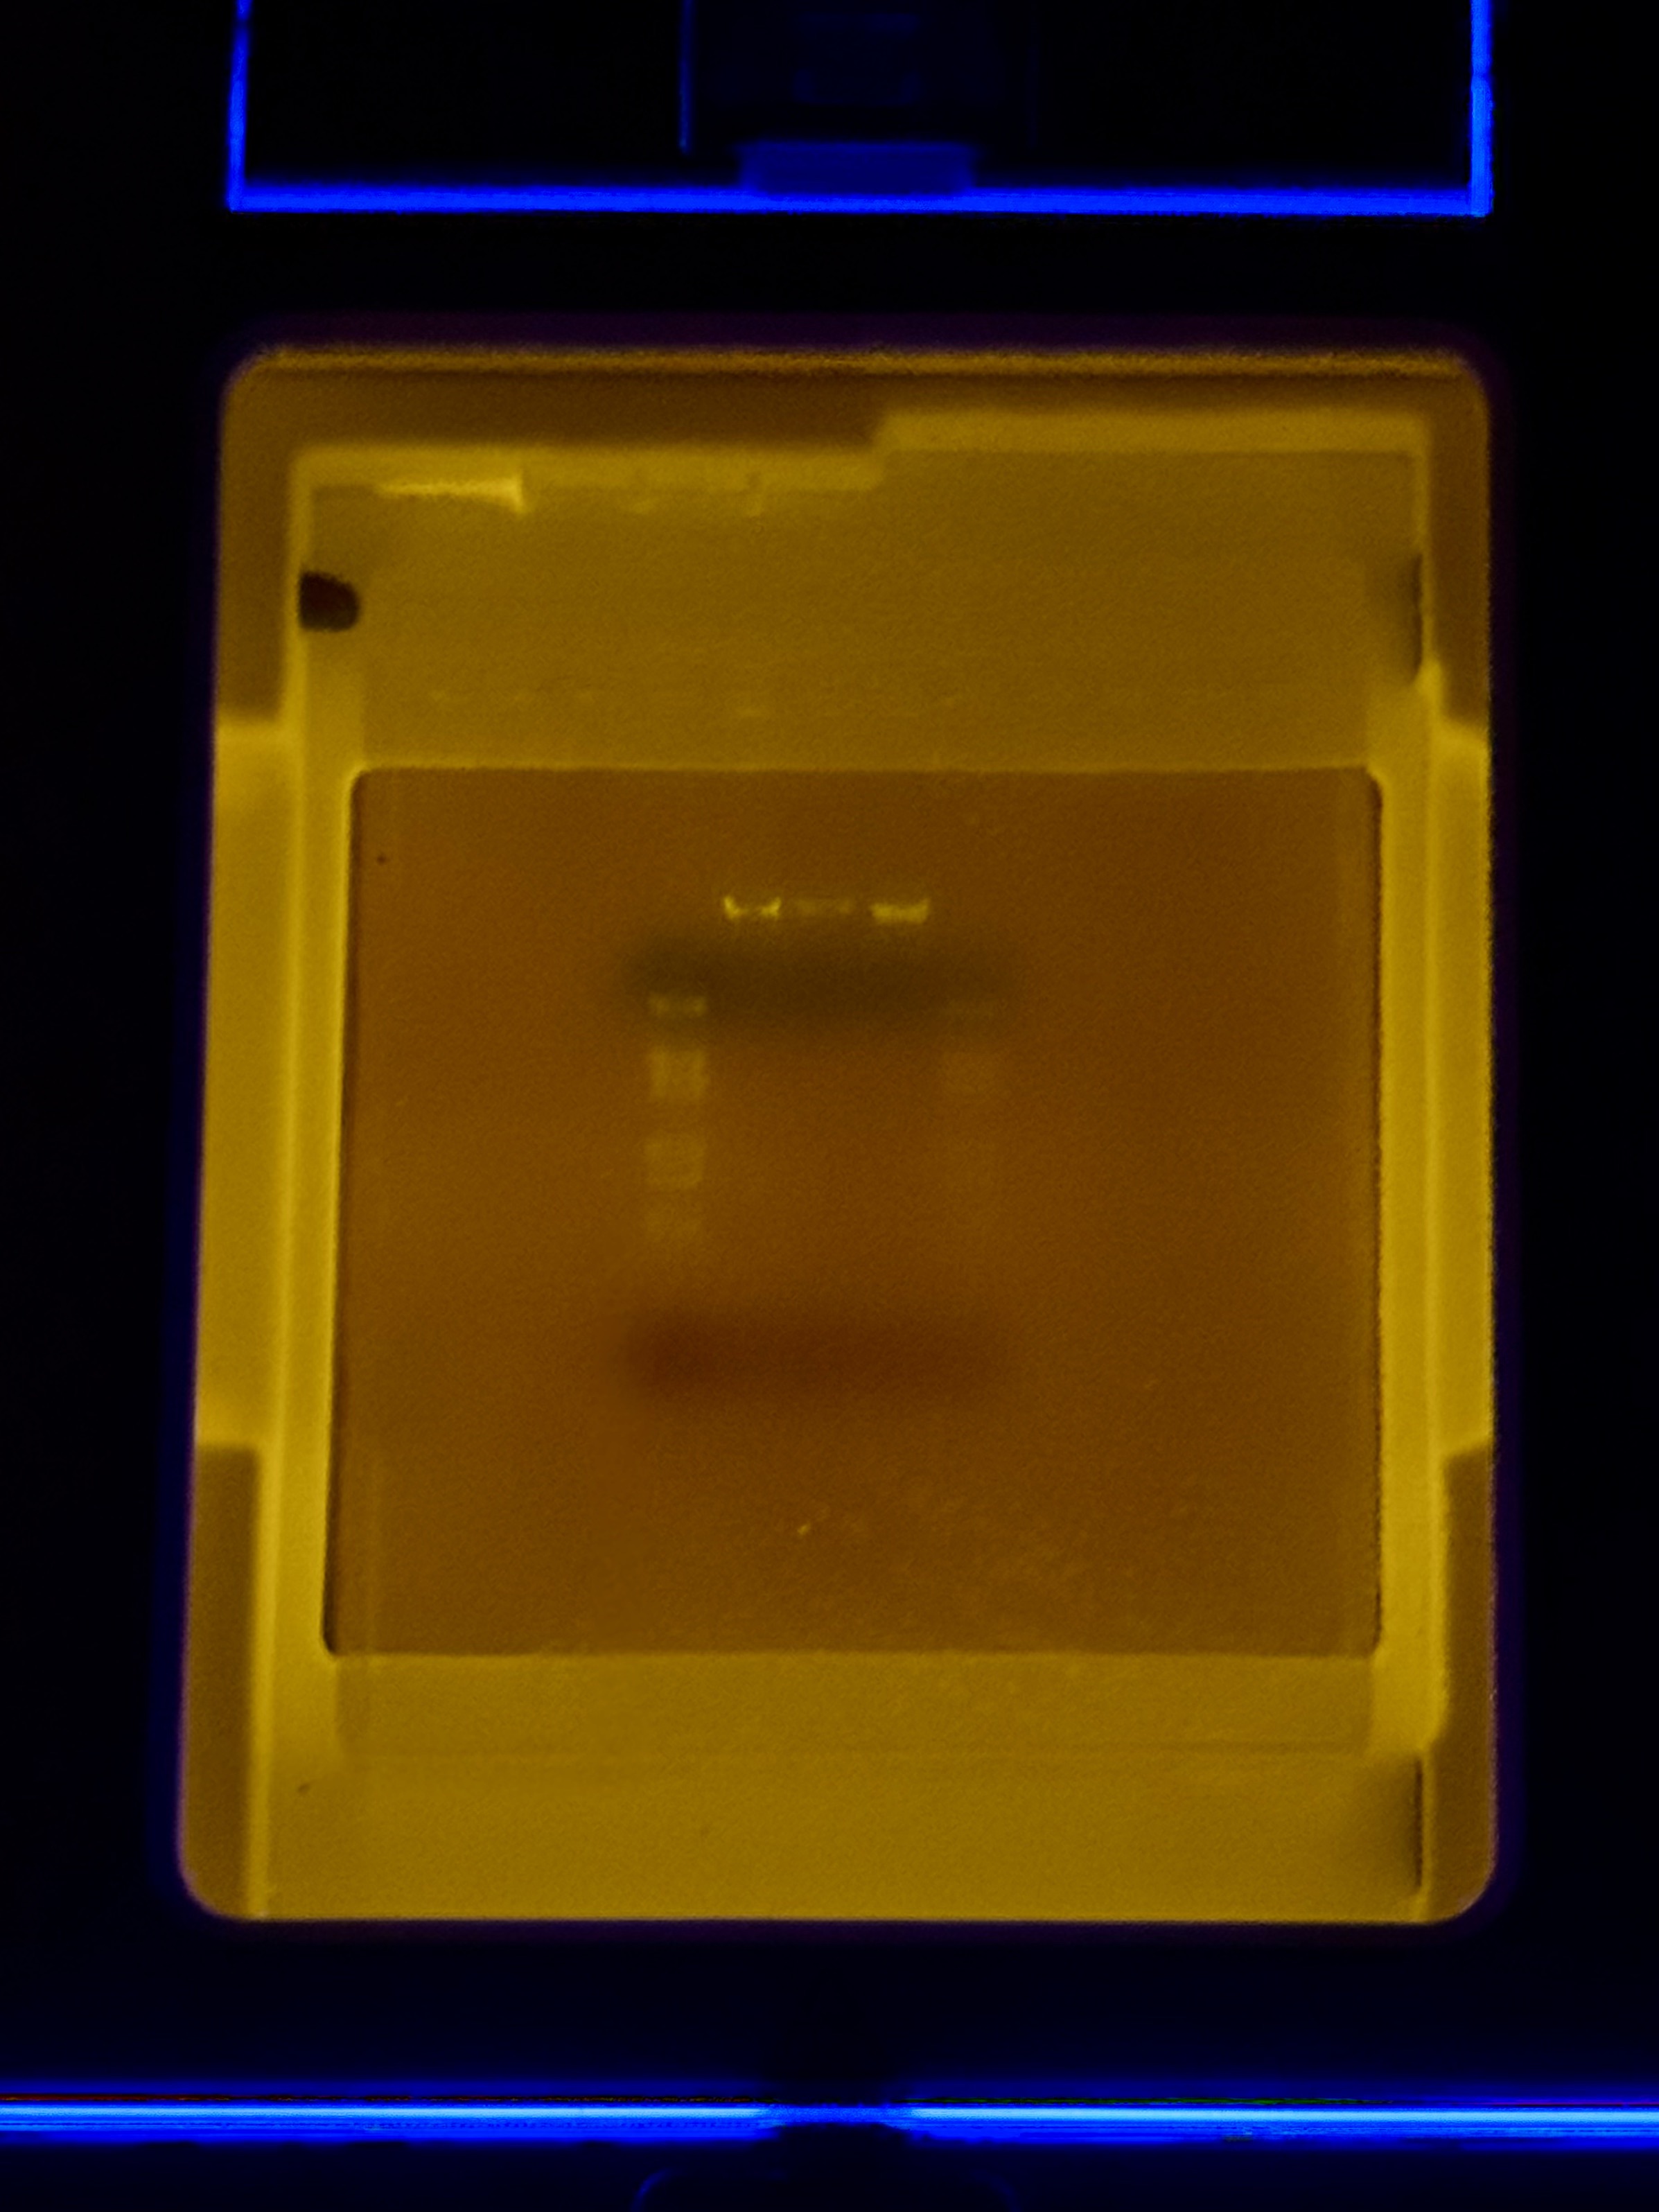
Compared with the exported gel image, the raw transilluminator photo shows weaker contrast: the ladder lane is faint but detectable, and only the central lanes show distinct bands near the wells; the rest of the gel has low signal with a visible dye front.
Issue 1: Low Overall Fluorescence and Weak Contrast
- Observation: The raw transilluminator photo displayed weaker contrast compared to the exported gel image. Overall band visibility was low across most lanes.
- Speculation: Shared Lambda DNA and enzymes were frequently handled and moved between storage and benches by multiple users. Repeated freeze thaw cycling likely reduced enzyme activity or DNA quality. Potential cross contamination during shared reagent handling may have also affected reaction performance.
Issue 2: Inconsistent Lane Clarity in Lanes 4 and 6
- Observation: Only lanes 4 and 6 produced clear bands that closely matched the expected composite pattern. Lane 7 appeared faint compared with lanes 4 and 6.
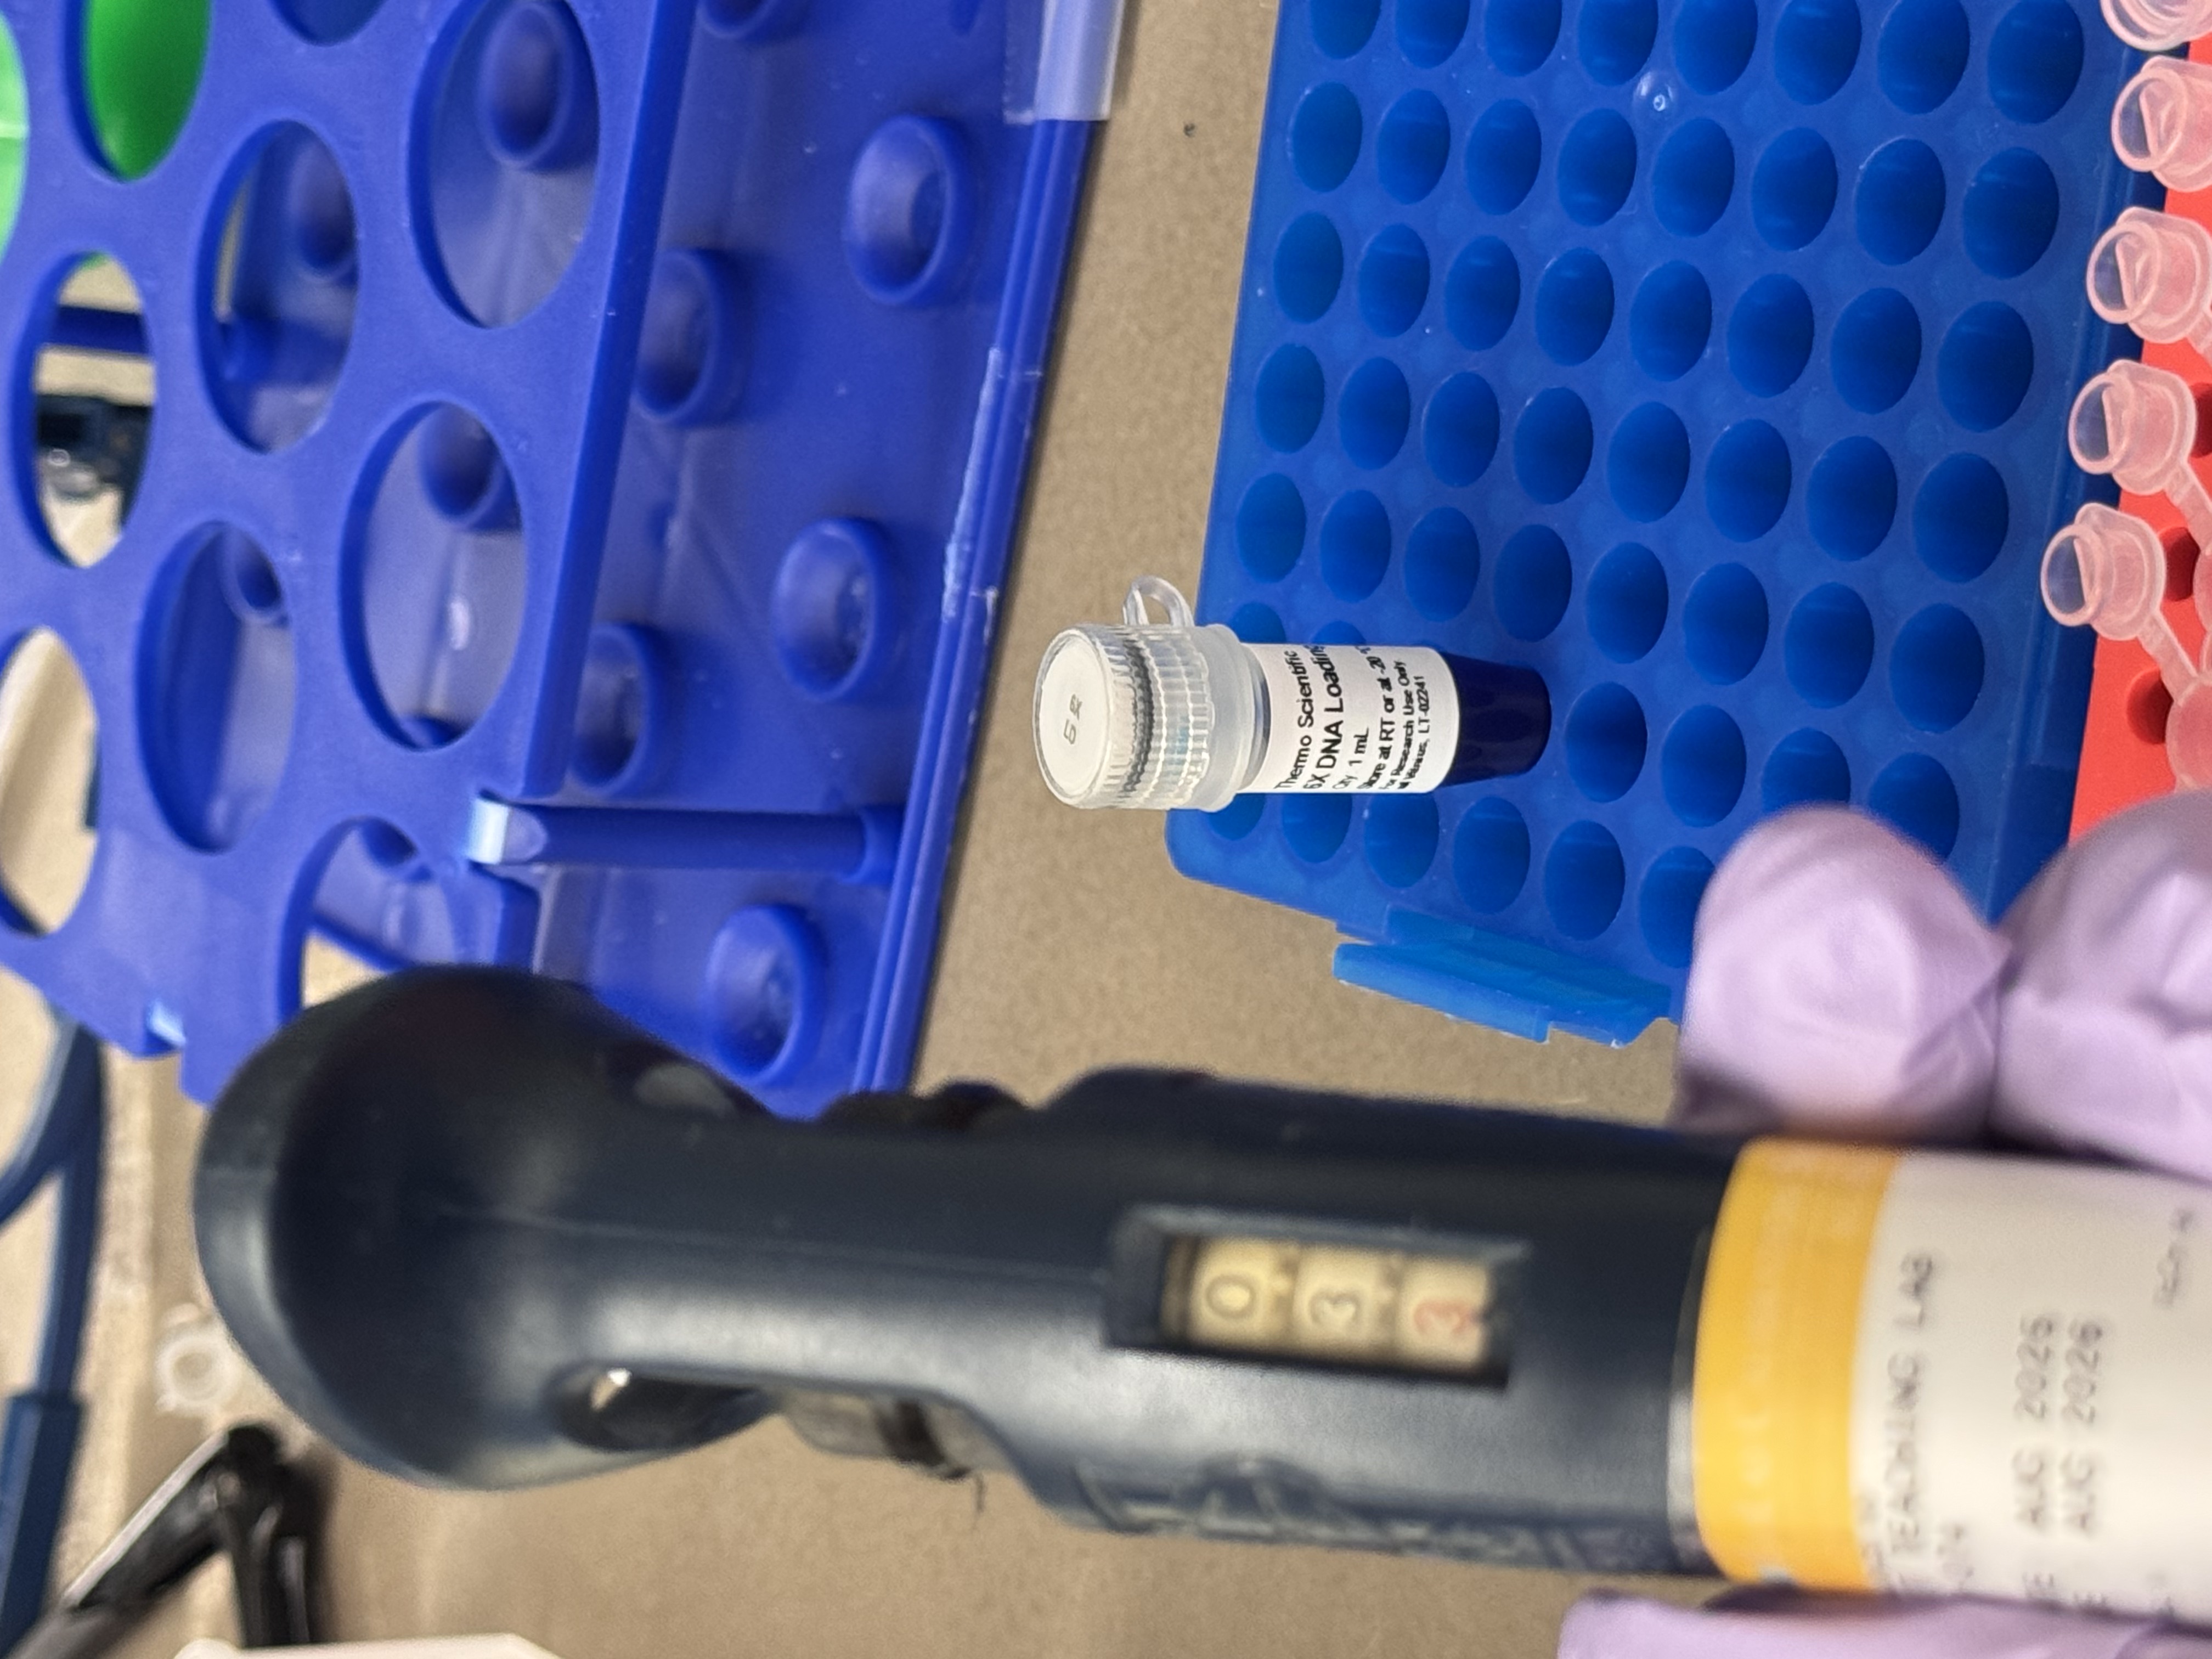
- Speculation: Lane 4 contained a higher volume of loading dye which likely improved sample density and helped it settle consistently in the well to increase visibility. In weaker lanes, small sample volumes between 2 to 5 microliters may have remained inside pipette tips during loading. Furthermore, differences in loading dye volume can change apparent intensity even when the digest chemistry is identical.
Issue 3: Design Mismatch in Lane 5
- Observation: Lane 5 produced a visible band but failed to represent the intended mouth pattern using SalI as specified in the Benchling design.
- Speculation: Lane 5 was prepared without SalI enzyme. This error likely originated from an initial configuration mistake in the Automation Art tool that propagated into the wet lab setup. Omitting the enzyme produced a band pattern that naturally does not match the prediction for the mouth feature.
Issue 4: Poor Resolution in the Lower Gel Half
- Observation: A prominent dye front was visible but the lower half of the gel contained limited resolved band information.
- Speculation: Running the electrophoresis at 130V for 40 minutes was likely too aggressive for smaller fragments. High voltage may have reduced the resolution of shorter DNA segments and pushed them toward or beyond the dye front before they could be clearly separated.
Issue 5: Buffer Limitations
- Observation: All digestion reactions were performed using a single CutSmart buffer.
- Speculation: While utilizing one universal buffer is convenient for all digests, it may have resulted in sub optimal cutting performance for specific enzymes or enzyme combinations that require different salt concentrations for maximum activity.