Week 6 Lab: Gibson Assemly
Week 6: Gibson Assembly
Group members: Louisa Zhu, Shitong, Jasmin
Part 1
1. PCR
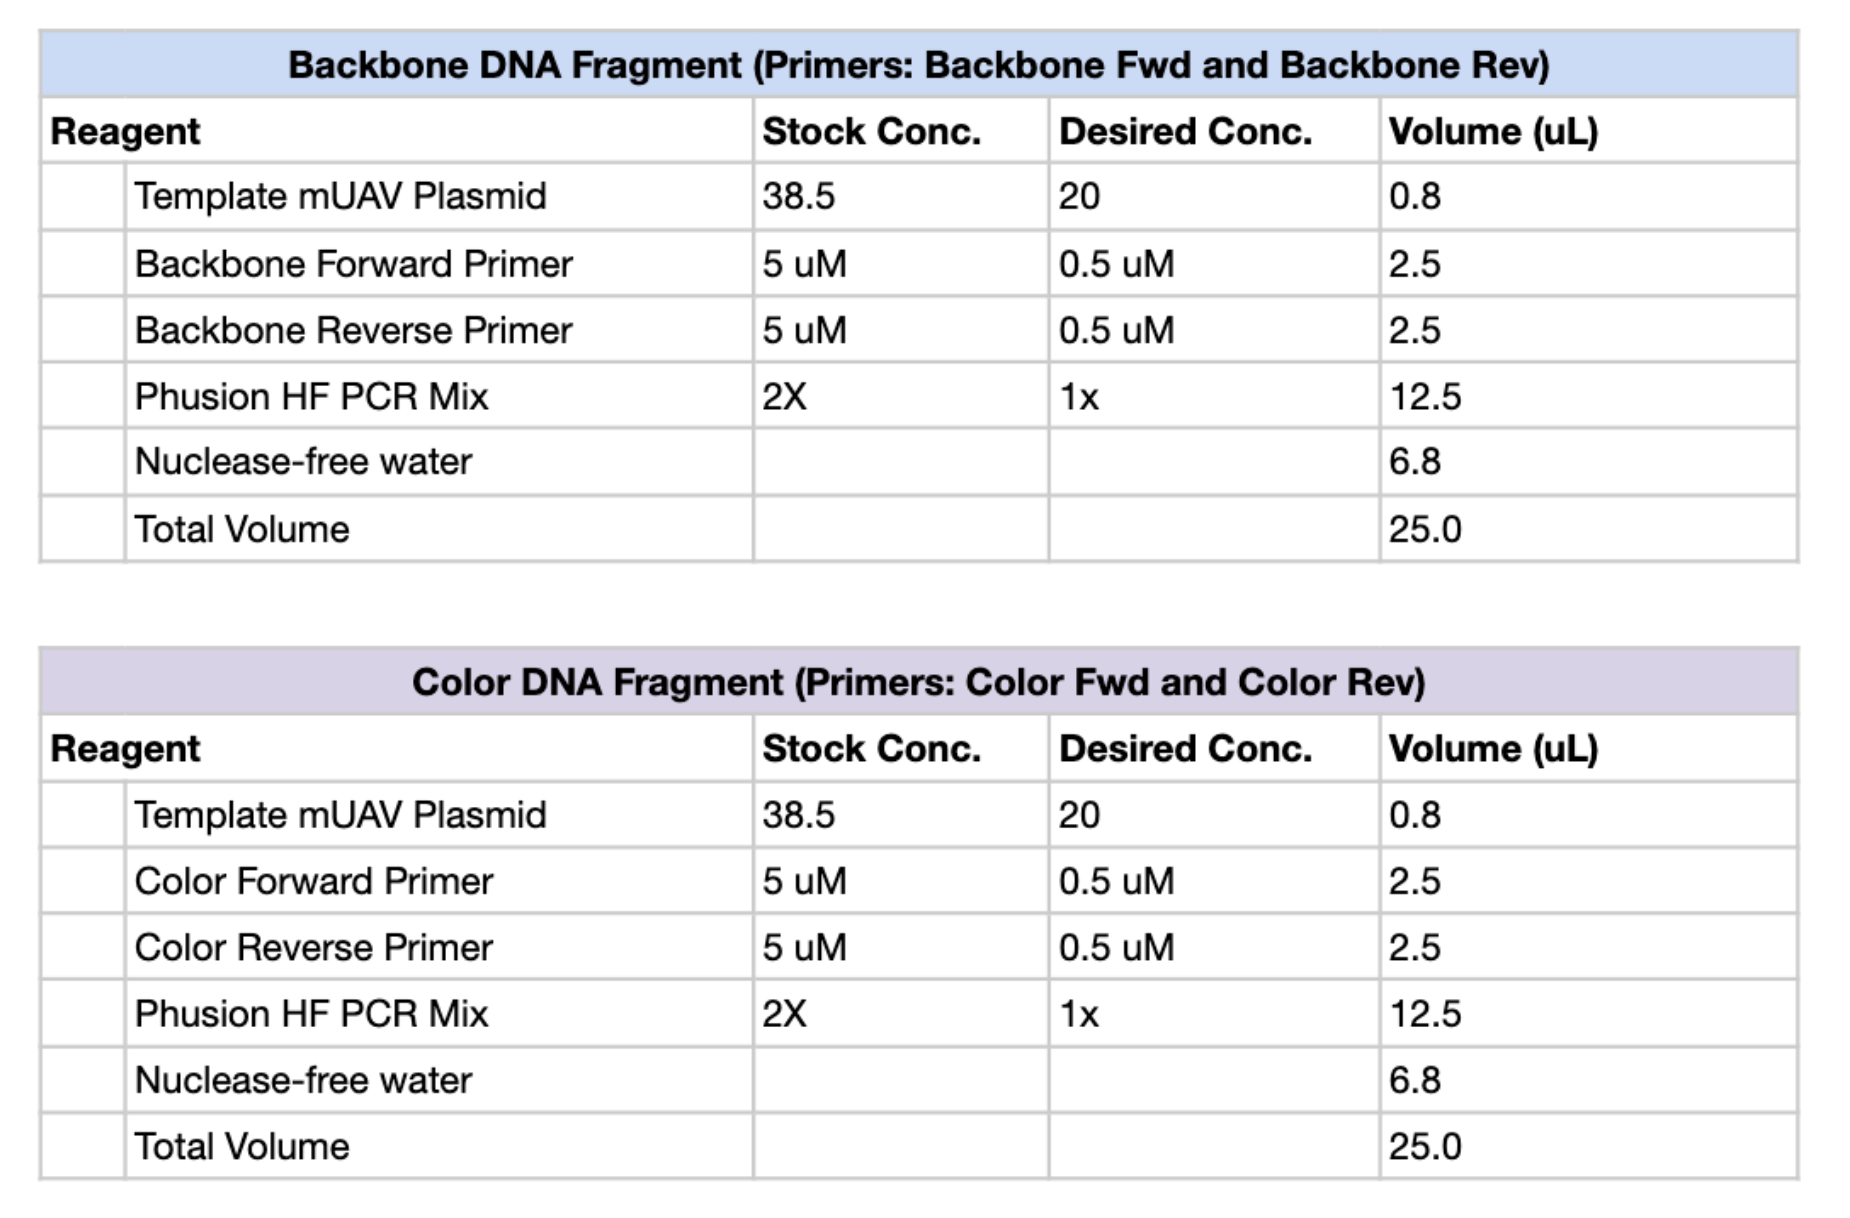
Figure 1. PCR reaction setup tables for the Backbone DNA Fragment (top) and Color DNA Fragment (bottom), including reagent volumes for a 25 µL total reaction.
We then ran the PCR reaction with the following thermocycler settings:
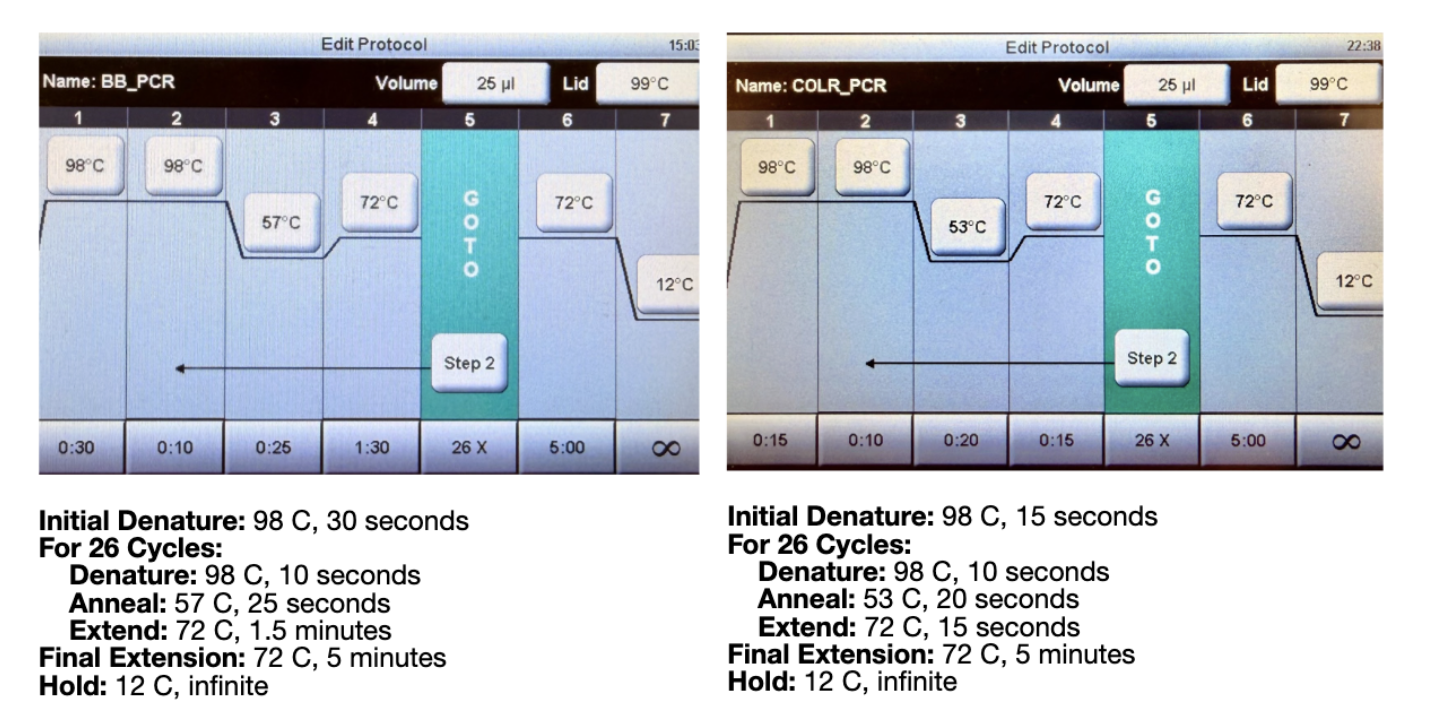
Figure 2. Thermocycler programs for the backbone PCR (BB_PCR, left) and color fragment PCR (COLR_PCR, right). Both protocols use 26 cycles with a final extension at 72°C for 5 minutes.
2. Gel Eletrophoresis
Protocol credit to Louisa:
- Take 2 µL of each mixture and transfer into new labeled PCR tubes
- Pipette 2 µL of mUAV into a new tube
- Add 20 µL of water to each PCR tube
- Unpack gel electrophoresis cassette and load into machine
- Pipette DNA Ladder into first well
- Pipette 20 µL of mixture from each new PCR tube into correct wells (6 full wells total)
- Use the automatic setting for 1%, wait 10 minutes
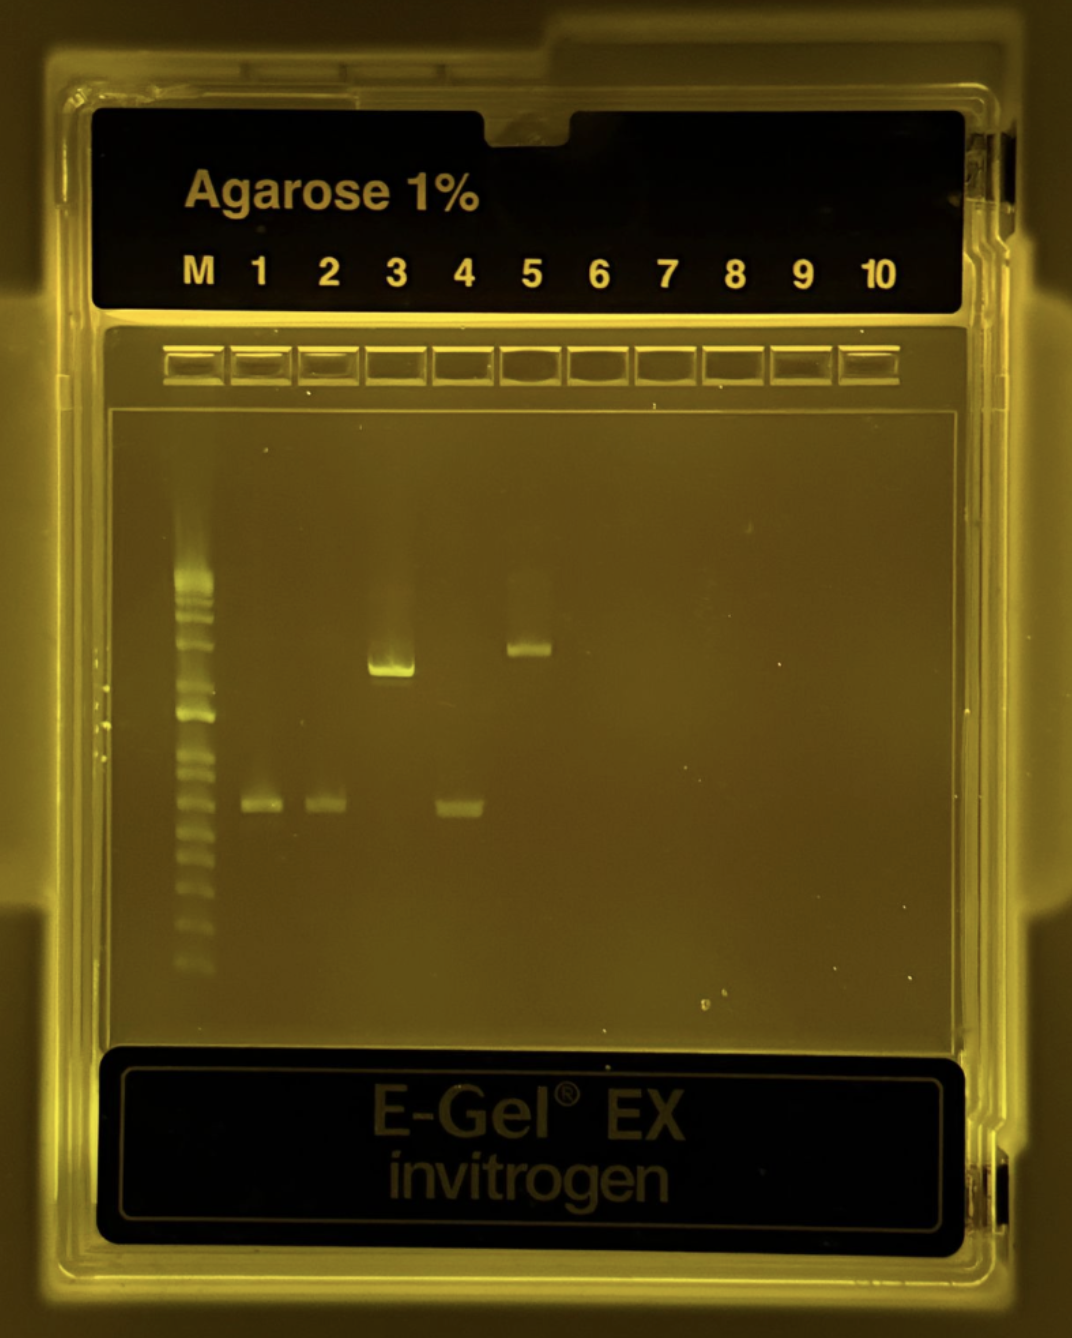
Figure 3. Agarose 1% gel electrophoresis result showing PCR products. The DNA ladder (M) is in the first lane. Bands are visible for the backbone and color fragments, confirming successful amplification.
After PCR amplification, a 1% agarose gel electrophoresis was performed to verify the size and quality of the amplified fragments. As shown in Figure 3, distinct bands were observed in the expected lanes, with the backbone fragment appearing at approximately 1.5 kb and the color fragments (Light Pink, Blue, and Purple) resolving at approximately 500–800 bp. All bands were sharp and well-defined with no visible smearing or non-specific secondary bands, indicating high-specificity amplification with minimal off-target products. The absence of bands in the negative control lane further confirms that there was no contamination during the PCR setup. The fragment sizes observed are consistent with the expected sizes based on the primer design and template mUAV plasmid, confirming that the correct regions were successfully amplified. These results demonstrate that both the backbone and color fragment PCR reactions performed as expected, and that the purified products were of sufficient quality to proceed to Gibson Assembly.
3. DNA Purification and Quantification
- Pipette 100 µL of DNA Binding Buffer into a centrifuge tube
- Add 20 µL of PCR product
- Mix briefly by vortexing
- Transfer 120 µL of the mixture into separate columns with a collection tube
- Centrifuge for 1 minute
- Discard the flowthrough
- Add 200 µL of DNA wash buffer to the column
- Centrifuge for 1 minute
- Repeat the last two steps
- Transfer the column to a new tube
- Discard flowthrough
- Add 6 µL of nuclease-free water to the column matrix
- Allow to sit for 2 minutes
- Centrifuge for 1 minute
- Store and save
Part Two
Materials (Credit to Lousia)
Items used:
- P1000 pipette with 1000 µL tips
- P20 pipette with 10 µL tips
- PCR Tubes
Biological materials:
- Purified Fragments
- Gibson Assembly Master Mix
- Nuclease-Free Water
- LB-Agar plates with Chloramphenicol
- SOC Growth Medium
- DH5α competent cells
Machines used:
- Thermal Cycler
- Shaking Incubator
- Waterbath set to 42°C
Part 1: Setting Up Gibson Assembly
We set up reactions in the proportions shown below for each color fragment, then incubated at 50°C for 30 minutes in a heat block, followed by adding 100 µL of nuclease-free water to dilute each sample.
| Reagent | Stock Conc. (ng/µL) | Desired Conc. (ng/µL) | Volume (µL) |
|---|---|---|---|
| Backbone Fragment | 50 | 25 | 0.5 |
| Color Fragment (Single) | 50 | 50 | 1.0 |
| Gibson Assembly Mix | 2X | 1X | 5 |
| Nuclease-free water | — | — | 3.5 |
| Total Volume | 10 |
Part 2: Transformation
- Transfer 20 µL of competent cells to each tube
- Transfer purified assembly products into each tube (8 total: 3 Light Pink, 3 Blue, 3 Purple)
- Incubate on ice for 30 minutes
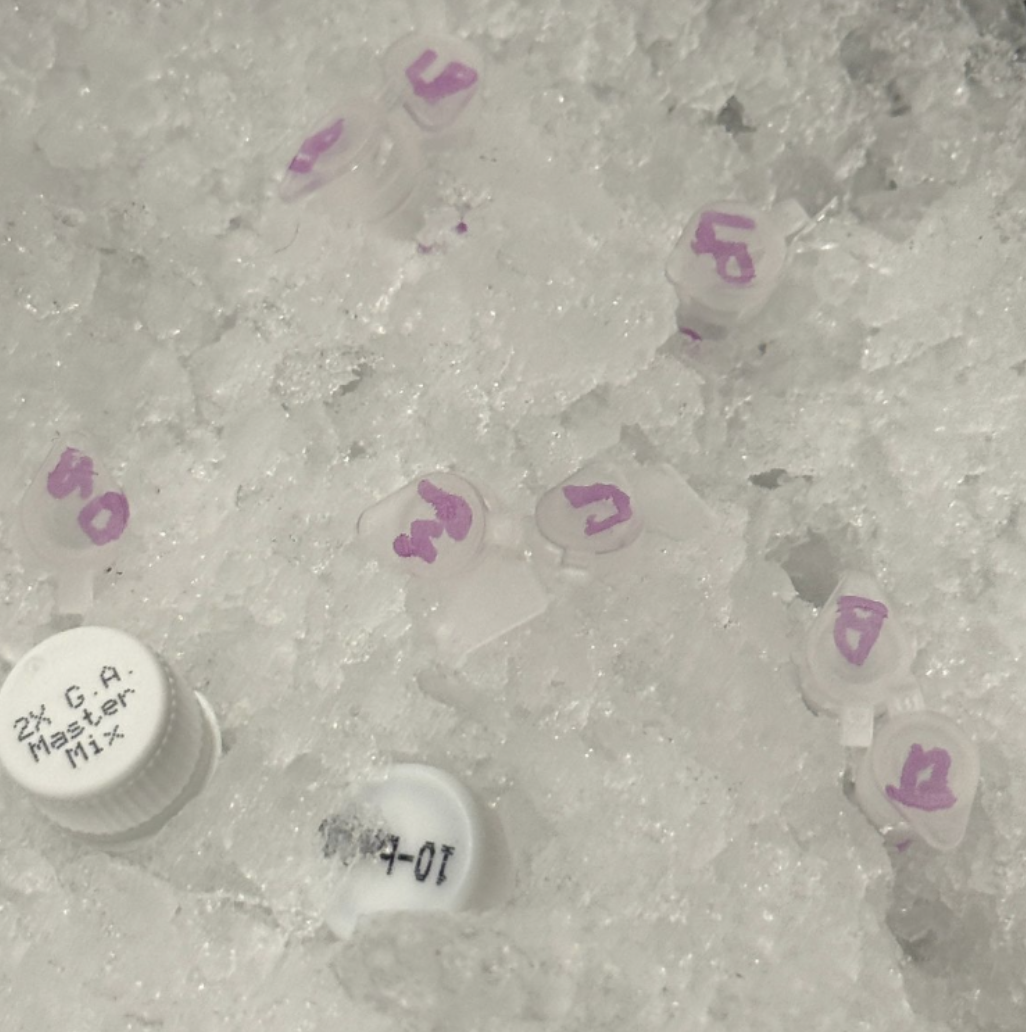
Figure 4. Tubes incubating on ice during the transformation step. Each tube is labeled by color and sample number.
- Heat shock the cells at 42°C for 45 seconds immediately after the ice bath
- Add 100 µL of SOC media to each tube
- Allow growth in a shaking incubator for 1 hour
- Transfer 100 µL from each tube to the appropriate plate and spread using plating beads or a plastic spreader
- Incubate plates at 37°C for 72 hours
Part 3. Results
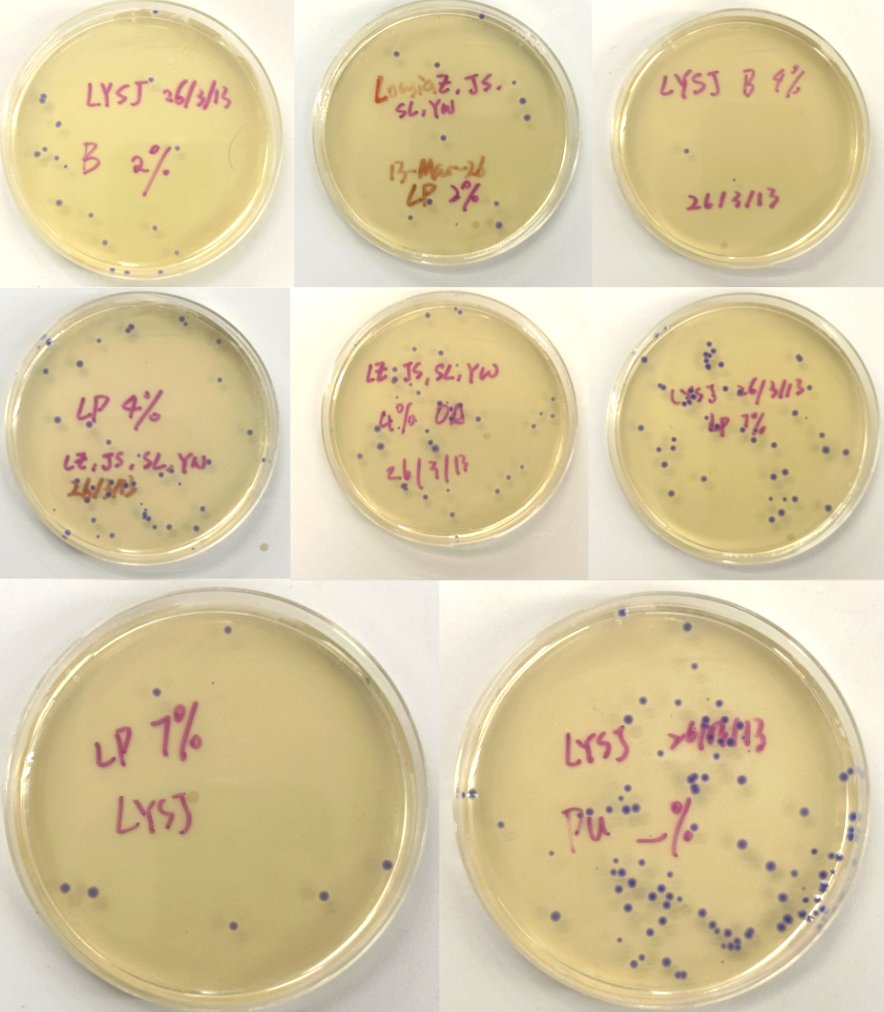
Figure 5 (A-H). LB-Agar plates with Chloramphenicol selection showing colony growth after transformation. Plates were labeled by color fragment condition Blue (B), Light Pink (LP), and Purple (Pu) at varying dilutions (Subject to correction with further observation). Interestingly, all colonies grew out purple-blue regardless of which color fragment was used. This may be because the insert DNA was not incorporated at the right ratio relative to the backbone, causing cells to express the backbone’s default color instead.