Week 7 Lab: Neuromorphic Circuits
Overview
In this lab, we designed two neuromorphic genetic circuits using the HTGAA 2026 Genetic Circuit Design Template and simulated their behavior using the Biocompiler-Predict tool. Both circuits are built from endoribonuclease-based sequestrons — the fundamental building blocks of intracellular artificial neural networks (IANNs) — and are intended for transfection into HEK293 cells via Lipofectamine 3000 and execution by an OT-2 liquid handling robot.
Key components used:
- Csy4 — a CRISPR endoribonuclease that cleaves mRNA at its recognition sequence
- CasE (EcoCas6e) — a second orthogonal endoribonuclease for independent mRNA cleavage
- PgU — a constitutive expression construct
- mNeonGreen, mKO2, eBFP2 — fluorescent protein reporters (green, orange, blue)
_rec_notation indicates a recognition site (e.g.,Csy4_rec_mNeonGreen= mNeonGreen mRNA with a Csy4 cleavage site)
Circuit 1: “MyCircuit” (L-shape response)
Design rationale
This circuit implements a single-layer perceptron where two inputs (X₁ and X₂) each produce an endoribonuclease that negatively regulates a shared fluorescent output. The goal was to achieve an L-shaped dose–response surface: the output (mNeonGreen) should be high only when both inputs are low.
Analogy: Think of it like two faucets draining a bathtub. If either faucet is open (high X₁ or high X₂), water drains out and the tub level drops. The tub is full only when both faucets are closed.
Circuit design table
| Circuit name | Transfection group | Contents | Concentration (ng/µL) | DNA wanted (ng) |
|---|---|---|---|---|
| MyCircuit | X1 | Csy4 | 40 | 150 |
| MyCircuit | X1 | mKO2 | 50 | 100 |
| MyCircuit | X2 | CasE | 50 | 150 |
| MyCircuit | X2 | eBFP2 | 50 | 100 |
| MyCircuit | bias_output_csy4 | Csy4_rec_mNeonGreen | 50 | 100 |
| MyCircuit | bias_output_case | CasE_rec_mNeonGreen | 50 | 100 |
Total DNA: 700 ng
How it works
- X₁ input delivers Csy4 endoribonuclease DNA (150 ng) along with mKO2 (orange fluorescent protein, 100 ng) as a transfection marker to verify X₁ delivery.
- X₂ input delivers CasE endoribonuclease DNA (150 ng) along with eBFP2 (blue fluorescent protein, 100 ng) as a transfection marker for X₂.
- Output layer consists of mNeonGreen mRNA with recognition sites for both Csy4 (
Csy4_rec_mNeonGreen, 100 ng) and CasE (CasE_rec_mNeonGreen, 100 ng). Both endoribonucleases independently cleave the output mRNA.
When X₁ is high → more Csy4 is produced → more mNeonGreen mRNA is cleaved → output decreases. When X₂ is high → more CasE is produced → more mNeonGreen mRNA is cleaved → output decreases. When both are low → minimal cleavage → mNeonGreen output is maximal.
Predicted behavior
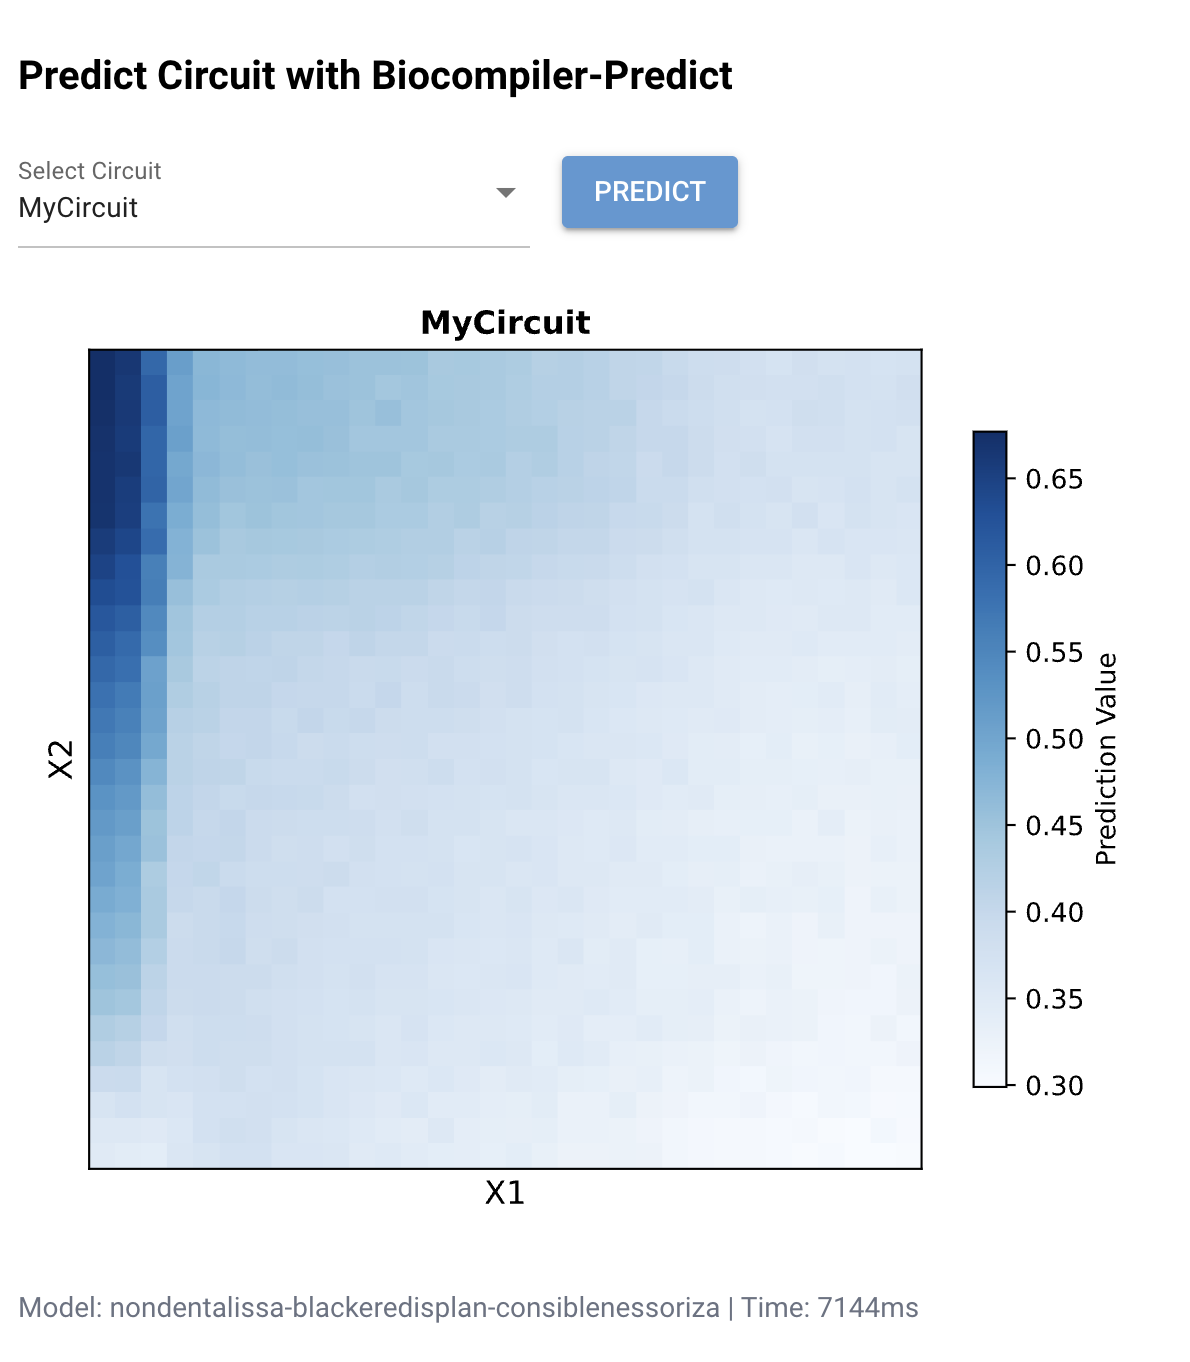
Figure 1: Biocompiler-Predict simulation of MyCircuit. The heatmap shows the predicted mNeonGreen output (Prediction Value) as a function of X₁ and X₂ concentrations. High output (dark blue, ~0.65–0.70) is concentrated along the left edge where X₁ is low. The L-shaped pattern confirms that the circuit acts as an approximate NOR-like function: output is highest when inputs are minimal.
Interpretation
The simulation reveals that X₁ (Csy4) has a stronger suppressive effect on the output than X₂ (CasE), as evidenced by the sharp drop-off along the X₁ axis compared to a more gradual decline along X₂. This asymmetry likely reflects differences in the catalytic efficiency and binding affinity of Csy4 versus CasE for their respective recognition sequences on the mNeonGreen mRNA. The L-shaped pattern is consistent with a weighted NOR gate where the X₁ weight is larger than the X₂ weight.
Circuit 2: “RF” (Rectified function)
Design rationale
This circuit implements a more complex multilayer architecture with cross-regulation between endoribonucleases. The goal was to achieve a rectified function — an output that increases monotonically with X₁ while remaining relatively insensitive to X₂, similar to a ReLU (rectified linear unit) activation function in machine learning.
Analogy: Imagine a volume knob (X₁) that smoothly turns up the music, while a second knob (X₂) has little effect because its signal gets cancelled out by internal feedback. The circuit “learns” to listen to one input and ignore the other.
Circuit design table
| Circuit name | Transfection group | Contents | Concentration (ng/µL) | DNA wanted (ng) |
|---|---|---|---|---|
| RF | X1 | CasE | 50 | 100 |
| RF | X2 | Csy4 | 50 | 100 |
| RF | Bias | PgU | 50 | 100 |
| RF | Bias | CasE_rec_Csy4 | 50 | 75 |
| RF | Bias | Csy4_rec_CasE | 50 | 75 |
| RF | Bias | PgU_rec_CasE | 50 | 75 |
| RF | Bias | PgU_rec_Csy4 | 50 | 75 |
| RF | X1 | CasE_rec_Csy4_rec_mKO2 | 50 | 50 |
| RF | X2 | Csy4_rec_mNeonGreen | 50 | 50 |
Total DNA: 700 ng
How it works
This is a multilayer circuit with cross-inhibition between the two endoribonucleases:
- X₁ input delivers CasE (100 ng) and a reporter
CasE_rec_Csy4_rec_mKO2(50 ng) — an mKO2 mRNA that can be cleaved by both CasE and Csy4, acting as a dual-regulated node. - X₂ input delivers Csy4 (100 ng) and
Csy4_rec_mNeonGreen(50 ng) — mNeonGreen output that is negatively regulated by Csy4. - Bias layer creates a rich cross-regulatory network:
PgU(100 ng) — constitutive expression baselineCasE_rec_Csy4(75 ng) — Csy4 mRNA with a CasE recognition site (CasE cleaves Csy4 mRNA)Csy4_rec_CasE(75 ng) — CasE mRNA with a Csy4 recognition site (Csy4 cleaves CasE mRNA)PgU_rec_CasE(75 ng) — constitutive mRNA regulated by CasEPgU_rec_Csy4(75 ng) — constitutive mRNA regulated by Csy4
The cross-inhibition (CasE_rec_Csy4 and Csy4_rec_CasE) creates a mutual negative feedback loop between the two endoribonucleases. This effectively implements a winner-take-all competition: when X₁ drives CasE production, CasE degrades Csy4 mRNA, further reducing Csy4 levels and amplifying the X₁ signal. The result is a rectified response that primarily follows X₁.
Predicted behavior
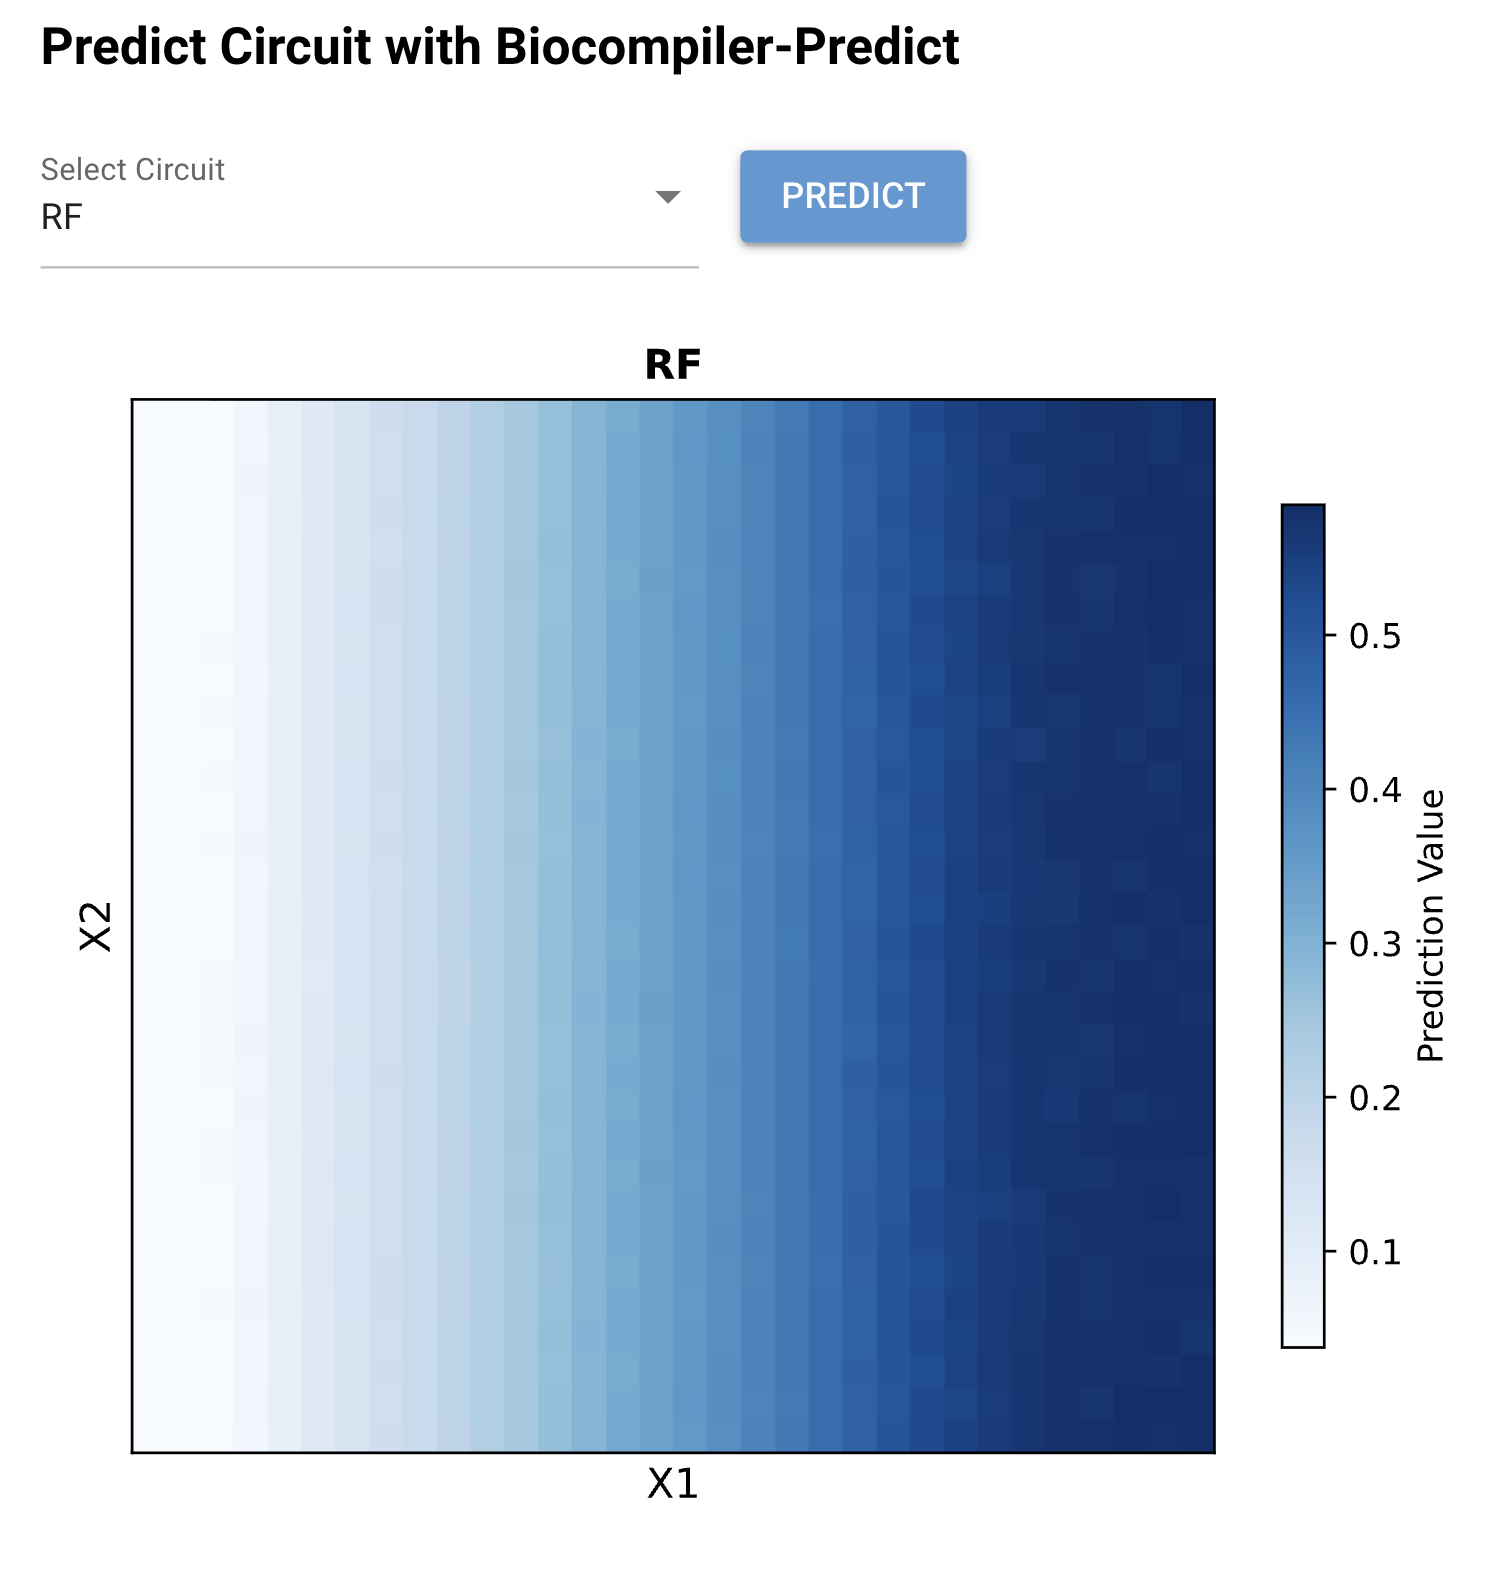
Figure 2: Biocompiler-Predict simulation of the RF circuit. The heatmap shows a smooth left-to-right gradient where output increases monotonically with X₁ (left axis = low, right axis = high). The output ranges from ~0.05 (white, low X₁) to ~0.55 (dark blue, high X₁). The response is largely independent of X₂, confirming the rectified function behavior.
Interpretation
The RF circuit successfully achieves a unidirectional dose–response: output scales with X₁ concentration while remaining approximately flat across X₂ values. This behavior arises from the mutual antagonism between Csy4 and CasE in the bias layer. When X₁ increases CasE levels, CasE degrades the Csy4_rec_CasE mRNA (reducing Csy4 production), which in turn reduces degradation of CasE mRNA — a positive feedback amplification of the X₁ signal. Meanwhile, X₂-driven Csy4 is counteracted by CasE from both the X₁ input and the bias layer, preventing X₂ from significantly influencing the output.
The smooth gradient (rather than a sharp threshold) reflects the analog nature of the IANN — the circuit computes a continuous function rather than a binary switch.
Comparison of the two circuits
| Feature | MyCircuit (L-shape) | RF (Rectified function) |
|---|---|---|
| Architecture | Single-layer, two independent inhibitors | Multilayer with cross-inhibition |
| Number of parts | 6 | 9 |
| Total DNA | 700 ng | 700 ng |
| Output reporter | mNeonGreen | mKO2 / mNeonGreen |
| Input-output behavior | NOR-like: high when both inputs low | ReLU-like: scales with X₁, ignores X₂ |
| Key design feature | Independent cleavage of shared output | Mutual antagonism creates winner-take-all |
| Predicted dynamic range | ~0.30 – 0.70 | ~0.05 – 0.55 |
Methods
Circuit design (Day 1)
- Circuits were designed using the HTGAA 2026 Genetic Circuit Design Template (Google Sheet).
- Part names followed the conventions in the HTGAA 2026 Genetic Circuit Part Names list.
- All concentrations were set to 50 ng/µL (with one exception: Csy4 in MyCircuit at 40 ng/µL).
- Circuit behavior was simulated using the Biocompiler-Predict tool, which generates heatmaps of predicted output across the X₁–X₂ input space.
- Completed spreadsheets were uploaded via the Google Form submission.
Transfection and imaging (Day 2)
- HEK293 cells were transfected using Lipofectamine 3000 with the designed plasmid mixes.
- An OT-2 liquid handling robot in the Weiss Lab (NE-47, MIT campus) executed the transfection protocol based on our uploaded spreadsheet.
- Fluorescence readout of mNeonGreen, mKO2, and eBFP2 will be measured after 24–48 hours of incubation.
Key takeaways
- Analog beats digital: Both circuits produce continuous, graded outputs rather than binary on/off responses — demonstrating the fundamental advantage of IANNs over traditional Boolean genetic circuits.
- Weight tuning via DNA dosage: The behavior of each circuit was tuned entirely by adjusting the nanogram amounts of each plasmid. No new genetic parts were needed — only different ratios of the same library components.
- Cross-inhibition enables complex functions: The RF circuit shows that mutual antagonism between endoribonucleases can create winner-take-all dynamics, allowing one input to dominate. This is a biological implementation of competitive inhibition analogous to lateral inhibition in neural circuits.
- Simulation before wet lab: The Biocompiler-Predict tool allowed us to iterate on circuit designs computationally before committing to expensive and time-consuming wet lab experiments.