Week 10 HW: Advanced Imaging & Measurement Technology
Homework: Final Project
Waters Part I – Molecular Weight
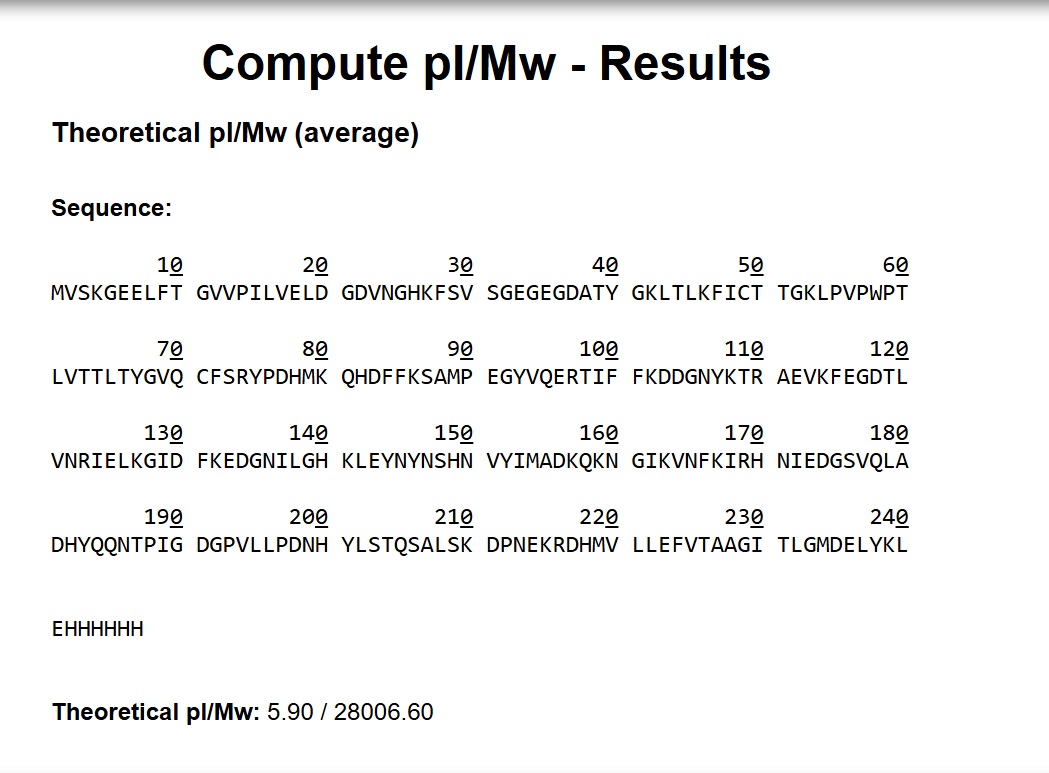
1. Calculated molecular weight of eGFP
Based on the predicted amino acid sequence and known modifications (chromophore formation + His-tag + LE linker):
- eGFP (239 aa, including initial Met): ~27,021 Da (monoisotopic)
- LE linker: +242.13 Da
- HHHHHH His-tag: +822.35 Da
- Chromophore formation (loss of 2H₂O): -36 Da
Theoretical monoisotopic MW ≈ 28,049 Da
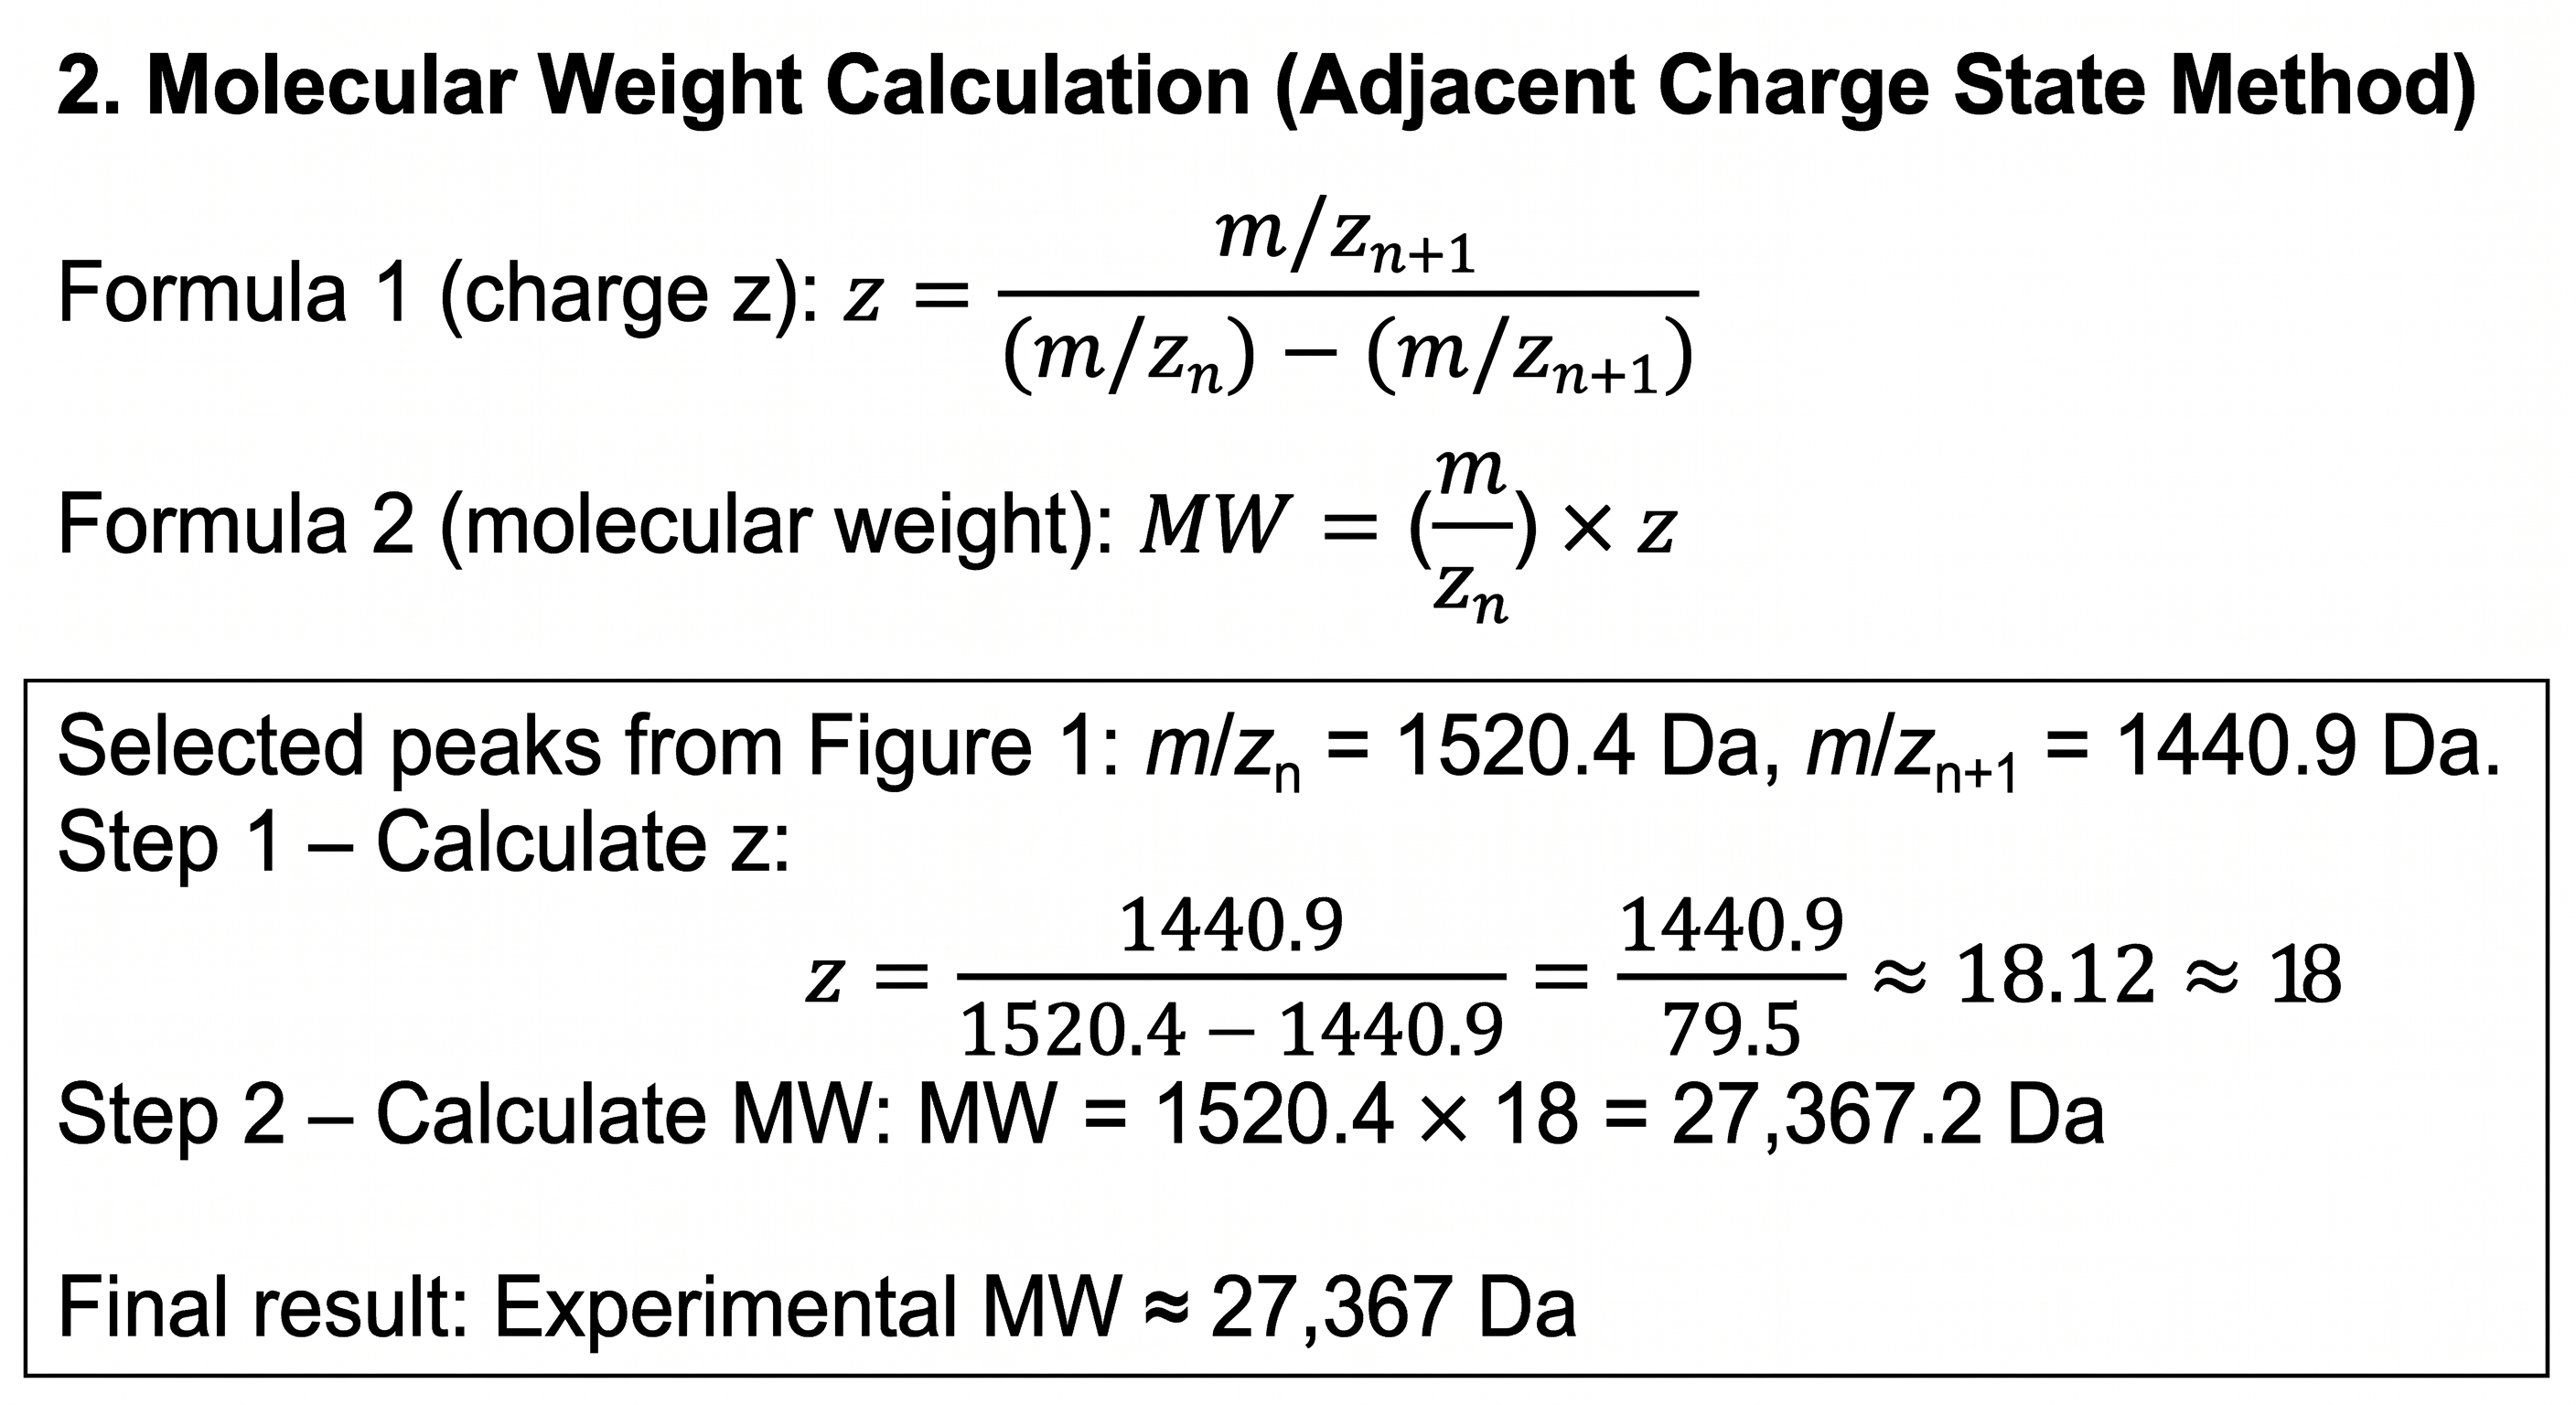
2. Molecular weight using adjacent charge state method
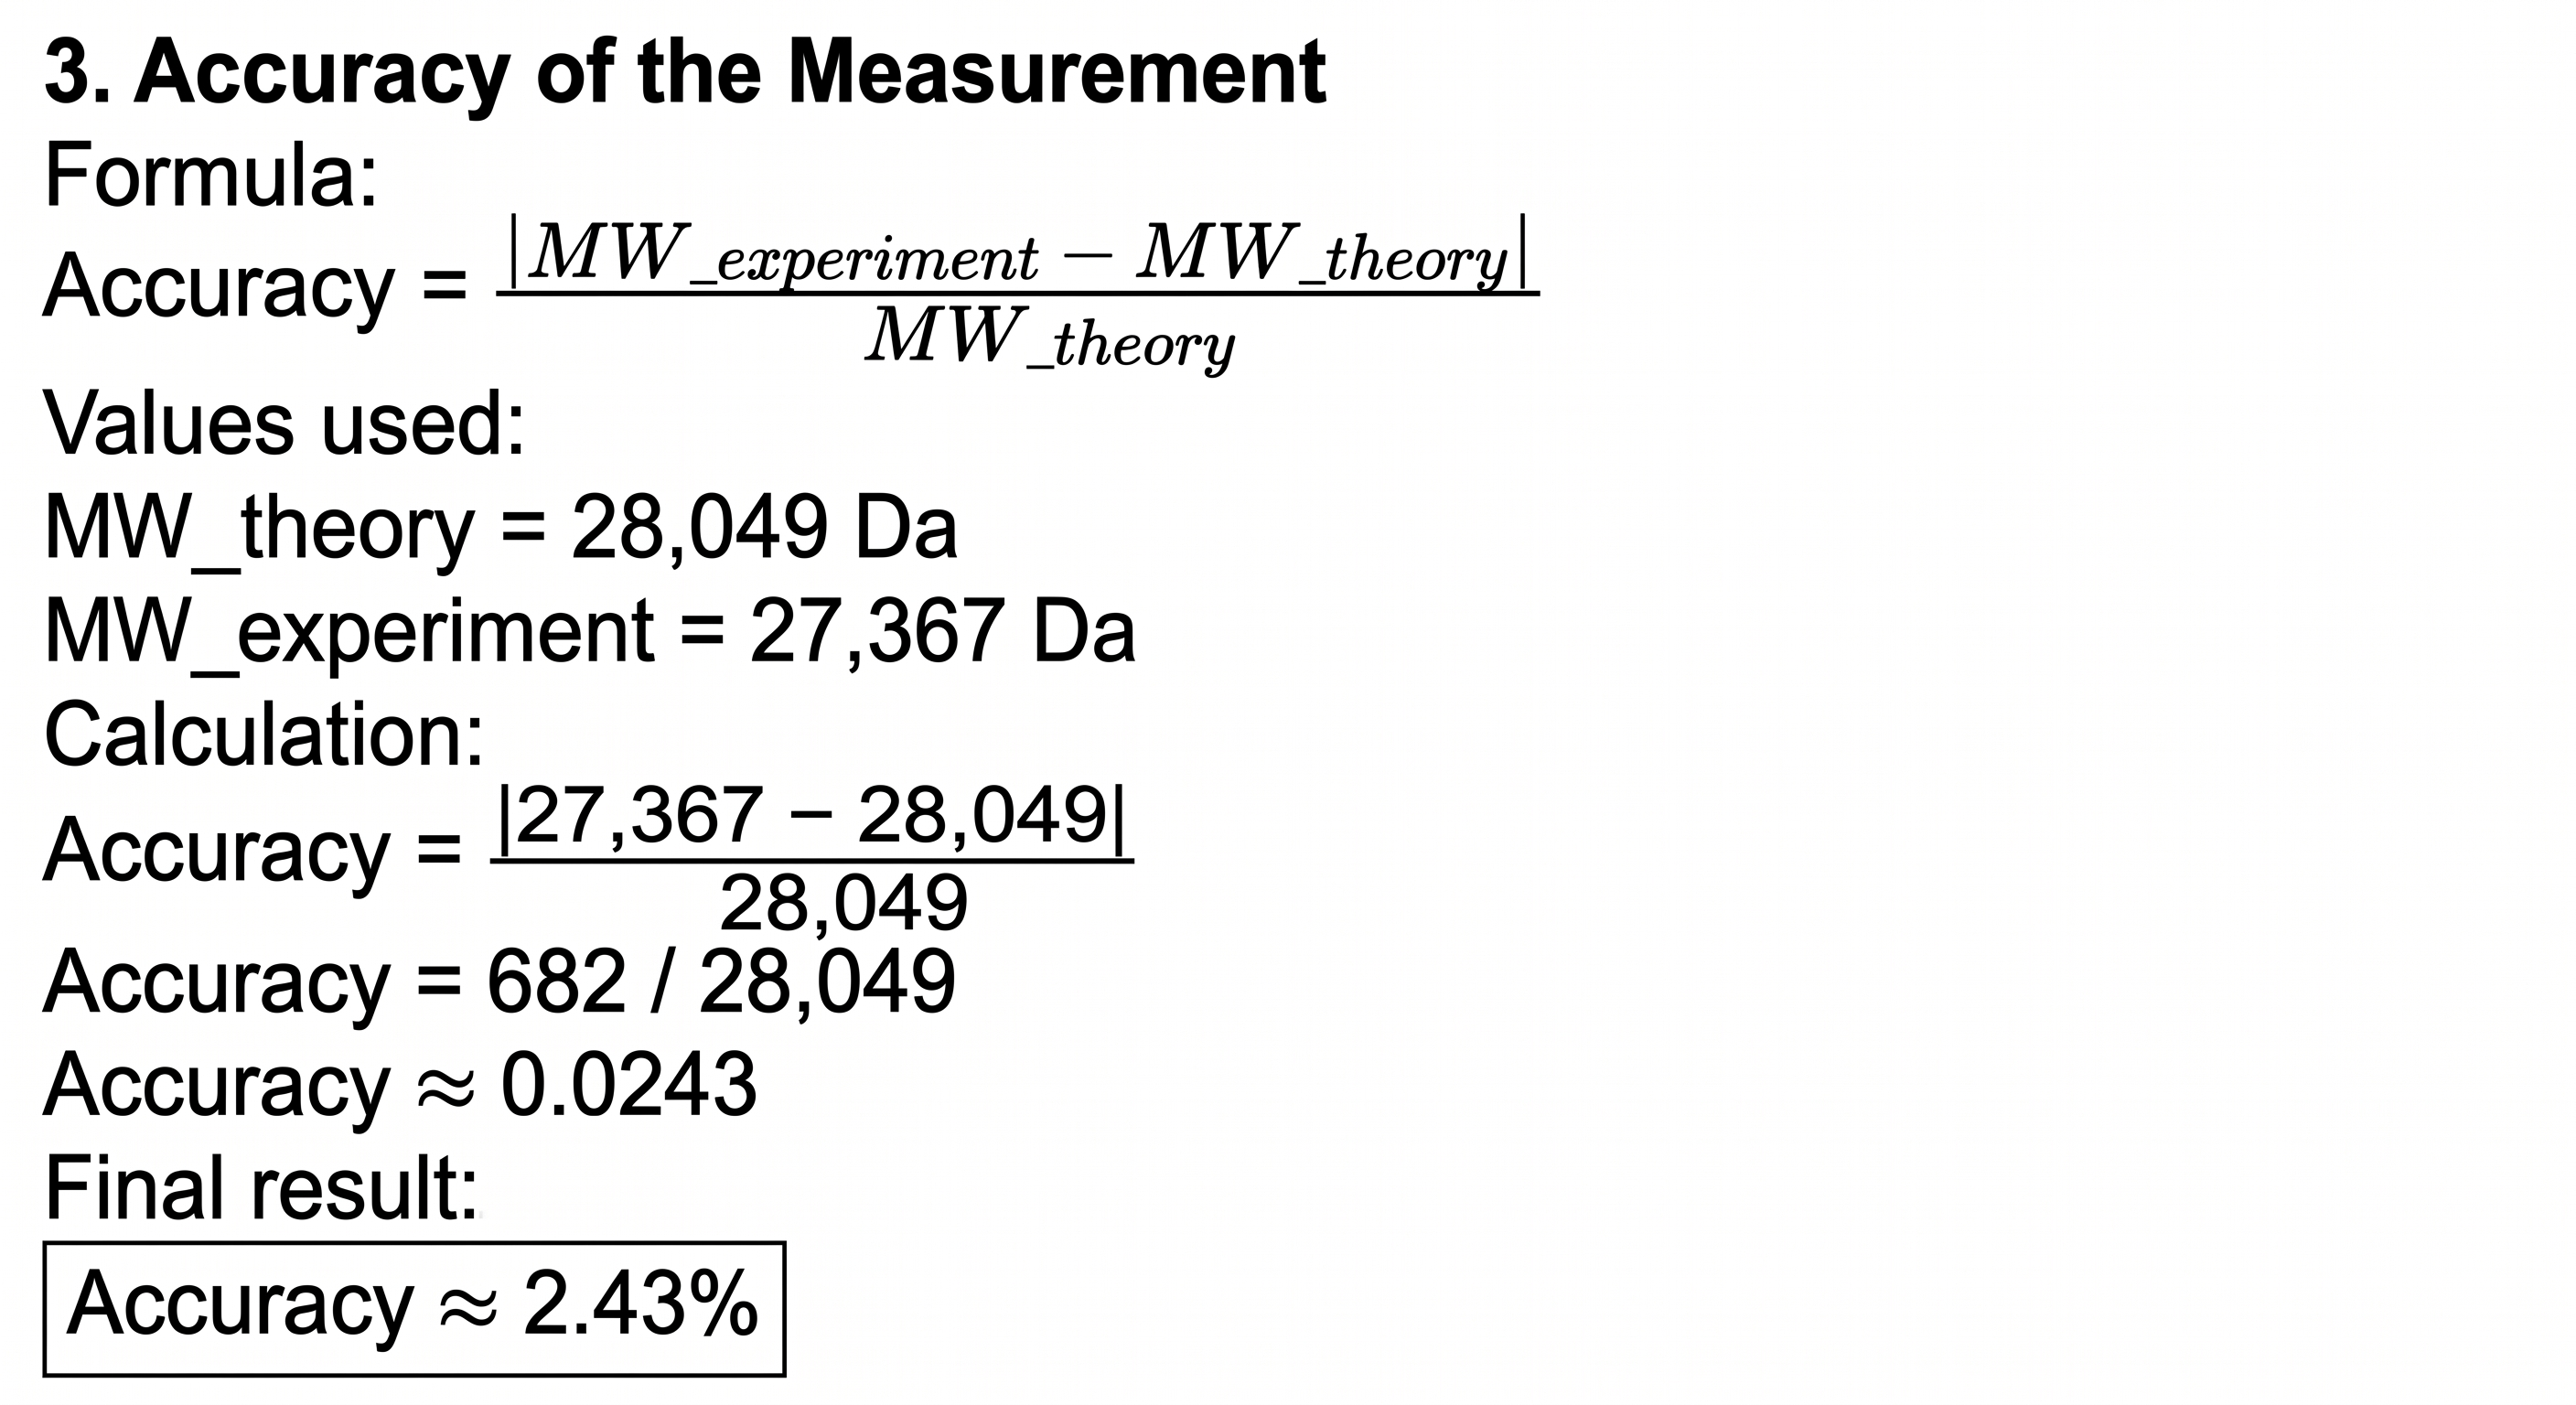
3. Accuracy of the measurement
4. Can you observe the charge state for the zoomed-in peak?
No, it is not possible to determine the charge state from a single zoomed-in peak alone.
Why?
The mass spectrometer measures only the mass-to-charge ratio (m/z). For a single peak, infinite combinations of mass (M) and charge (z) yield the same m/z. To determine z, at least two adjacent peaks from the same charge envelope are required, using the formula shown in section 2 above.
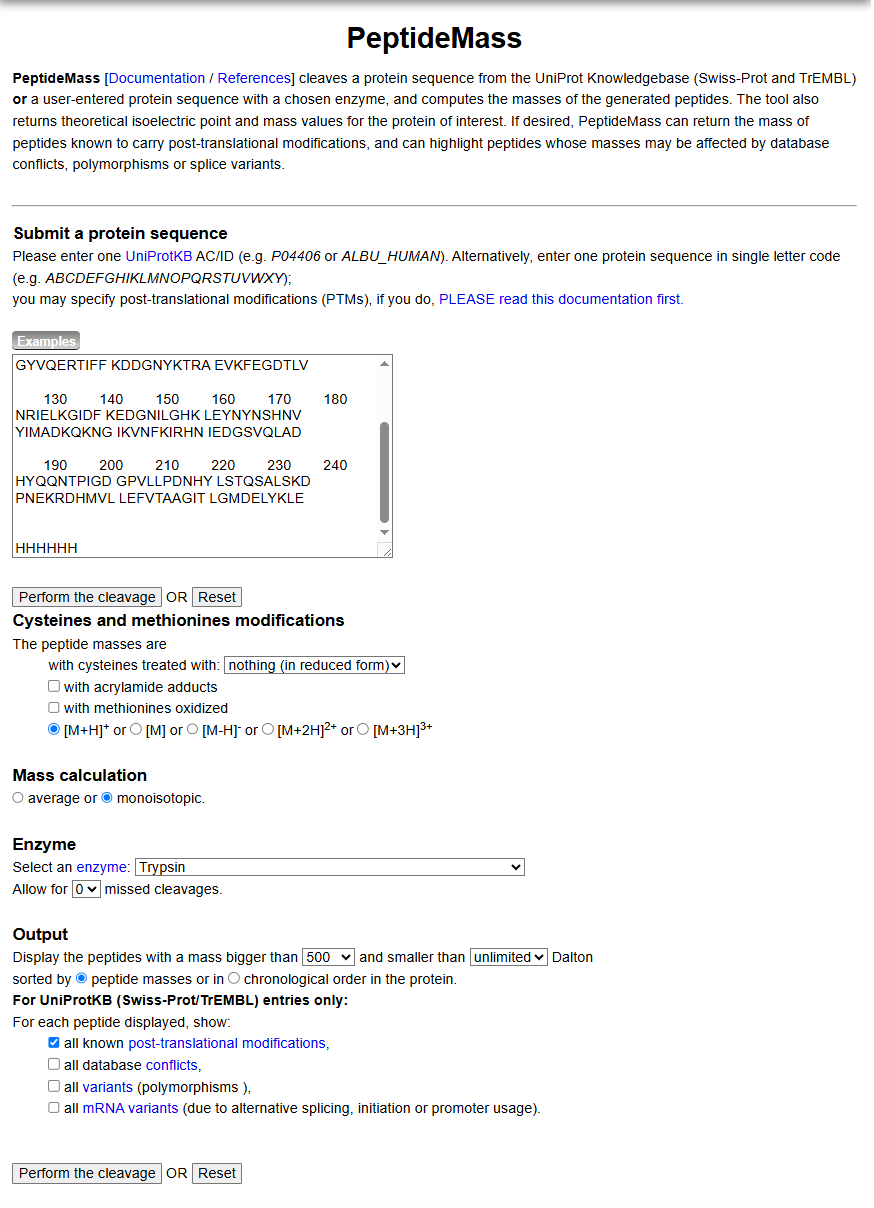
Waters Part III — Peptide Mapping - primary structure
- How many Lysines (K) and Arginines (R) are in eGFP? Please circle or highlight them in the eGFP sequence given in Waters Part I question 1 above. (Note: adding the sequence to Benchling as an amino acid file and clicking biochemical properties tab will show you a count for each amino acid).
-> eGFP contains a total of: 20 lysines (K) and 7 arginines (R), for a total of 27 trypsin cleavage residues.
- How many peptides will be generated from tryptic digestion of eGFP? Note: Use Figure 4 as a guide for the relevant parameters to predict peptides from eGFP.
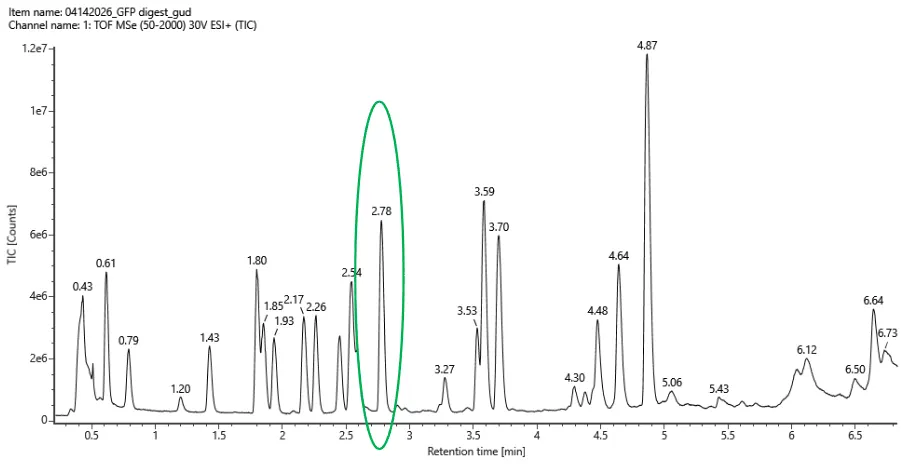
- Based on the LC-MS data for the Peptide Map data generated in lab please use Figure 5a as a reference how many chromatographic peaks do you see in the eGFP peptide map between 0.5 and 6 minutes? You may count all peaks that are >10% relative abundance.
Using the criteria of counting only peaks with >10% relative abundance (comparing their height to the tallest peak in the chromatogram within the specified time window), I observe a total of 21 chromatographic peaks between 0.5 and 6 minutes. 19 peaks (if counting only those clearly separated) or 21 (if including small but visible shoulders like at 0.43 and 1.25). The most conservative and precise count based on a strict “>10% of max” interpretation is 21.
- Assuming all the peaks are peptides, does the number of peaks match the number of peptides predicted from question 2 above? Are there more peaks in the chromatogram or fewer?
The chromatogram shows FEWER peaks than the theoretical number of tryptic peptides from eGFP. This is expected due to very small peptides eluting before 0.5 min, co-elution of multiple peptides into single peaks, and some peptides being below the 10% abundance threshold or eluting after 6 minutes.
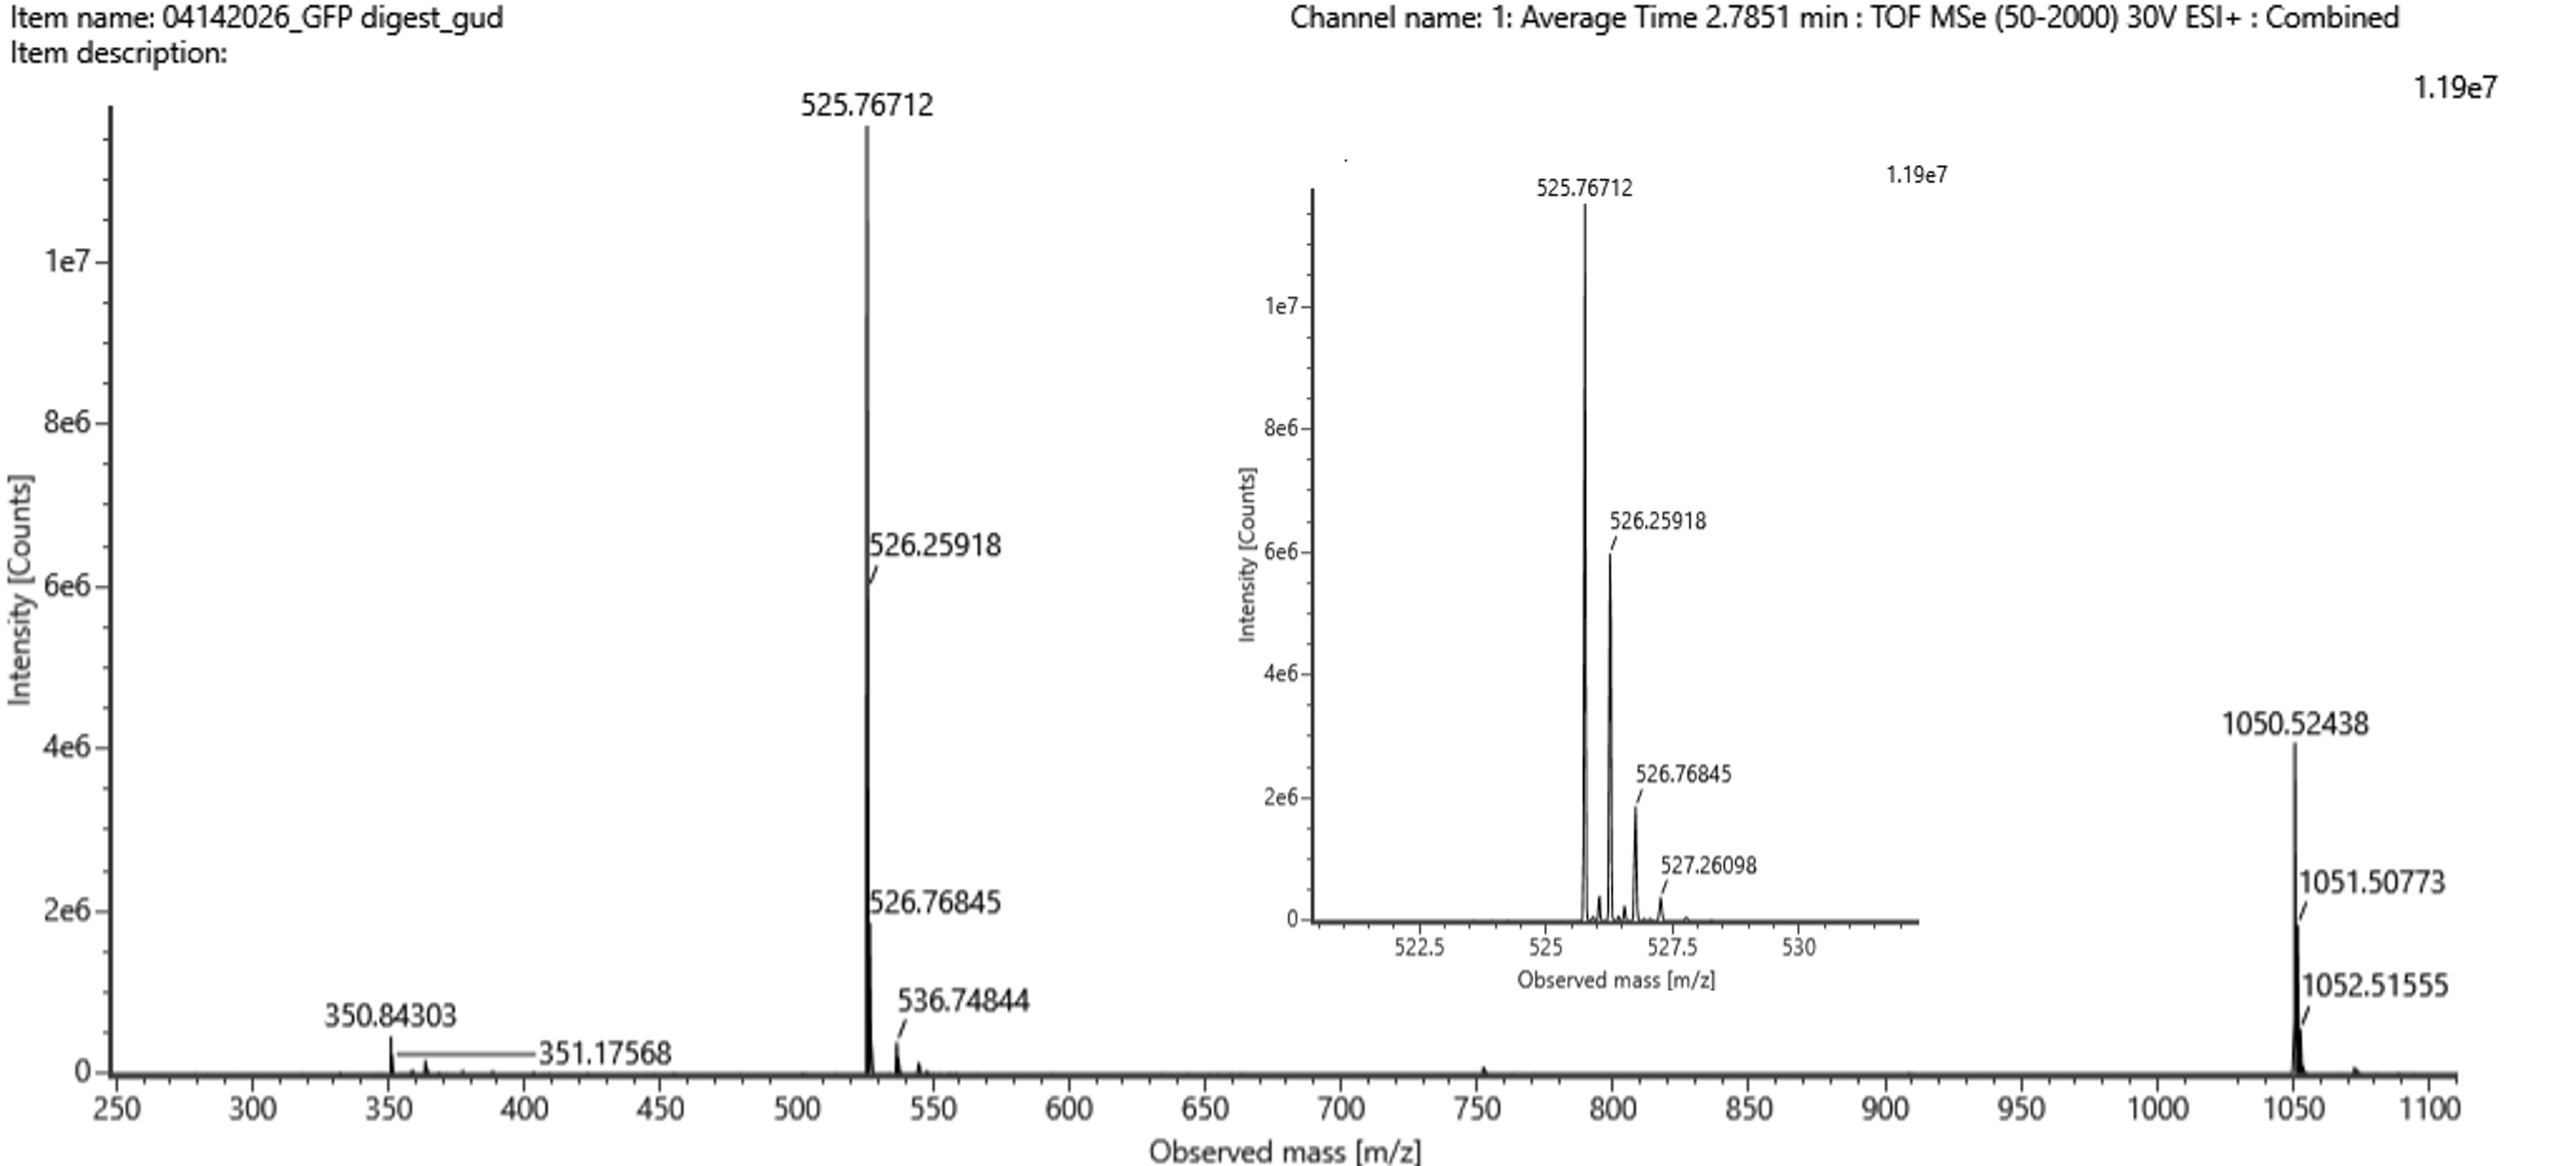
- Identify the mass-to-charge (m/z) of the peptide shown in Figure 5b. What is the charge (z) of the most abundant charge state of the peptide (use the separation of the isotopes to determine the charge state). Calculate the mass of the singly charged form of the peptide ([M+H]+) based on its m/z and z.
a) Mass-to-charge ratio (m/z):** 465.74 (most abundant isotope peak)
b) Charge state (z):** 2+
Rationale: The spacing between adjacent isotopic peaks is approximately 0.5 Da. Since Δ(m/z) = 1/z, therefore z = 1/0.5 = 2.
c) Mass of [M+H]⁺:**
[[M+H]^+ = (m/z \times z) - 1.0078 = (465.74 \times 2) - 1.0078 = 930.5 \text{ Da}]
Identify the peptide based on comparison to expected masses in the PeptideMass tool. What is mass accuracy of measurement? Please calculate the error in ppm. ($\text{Accuracy} = \frac{TP + TN}{TP + TN + FP + FN}$) ($$\text{Accuracy} = \frac{TP + TN}{TP + TN + FP + FN}$$)
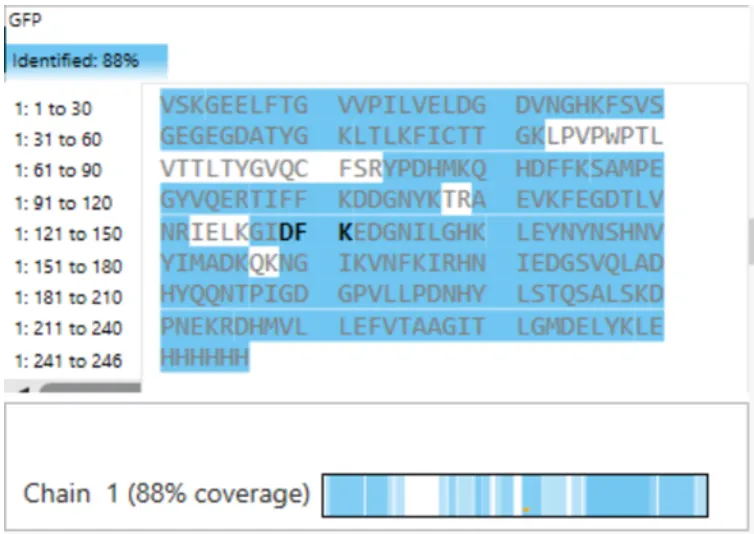
                                        `DGNYK` (from eGFP tryptic digest)

                                     930.45 Da (calculated using PeptideMass)

                                           930.50 Da (from Figure 5b)

                                           Mass accuracy (ppm error):
  \[\text{ppm error} = \frac{|930.45 - 930.50|}{930.45} \times 10^6 = \frac{0.05}{930.45} \times 10^6 \approx 54 \text{ ppm}\]

       The measurement has an error of approximately **54 parts per million**, which is excellent for a standard LC-TOF instrument.
What is the percentage of the sequence that is confirmed by peptide mapping? see Figure 6
Based on Figure 6 (coverage map), 88% of the eGFP sequence (including the His-tag) was confirmed by peptide mapping. his means that peptides covering 216 out of 246 amino acids were detected and matched to the predicted sequence. The remaining 12% were not observed, likely due to:
- Very small peptides eluting in the void volume (<0.5 min)
- Hydrophobic peptides not eluting under the LC conditions
- Peptides with poor ionization efficiency
- Low abundance peptides below the detection threshold
Waters Part IV — Oligomers
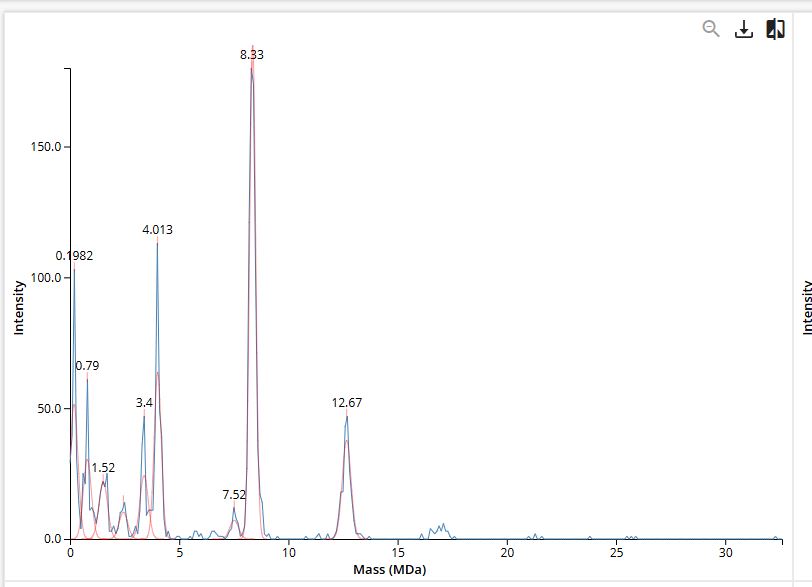
We will determine Keyhole Limpet Hemocyanin (KLH)’s oligomeric states using charge detection mass spectrometry (CDMS). CDMS single-particle measurements of KLH allow us to make direct mass measurements to determine what oligomeric states (that is, how many protein subunits combine) are present in solution. Using the known masses of the polypeptide subunits (Table 1) for KLH, identify where the following oligomeric species are on the spectrum shown below from the CDMS (Figure 7):
7FU Decamer 8FU Didecamer 8FU 3-Decamer 8FU 4-Decamer
| Polypeptide Subunit Name | Subunit Mass |
|---|---|
| 7FU | 340 kDa |
| 8FU | 400 kDa |
*Table 1: KLH Subunit Masses
Using the known subunit masses from Table 1:
- 7FU: 340 kDa
- 8FU: 400 kDa
The following oligomeric species were identified on the CDMS spectrum:
| Species | Subunit | Subunits | Calculated Mass | Peak (observed) |
|---|---|---|---|---|
| 7FU Decamer | 7FU | 10 | 3.4 MDa | ~3.4 MDa |
| 8FU Didecamer | 8FU | 20 | 8.0 MDa | ~8.0 MDa |
| 8FU 3-Decamer | 8FU | 30 | 12.0 MDa | ~12.0 MDa |
| 8FU 4-Decamer | 8FU | 40 | 16.0 MDa | ~16.0 MDa |
The spectrum shows a clear series of peaks corresponding to multimers of the 8FU subunit at approximately 4, 8, 12, and 16 MDa, with an additional peak at 3.4 MDa corresponding to the 7FU decamer.
Explanation:
The theoretical MW (28.006 kDa) was calculated using the eGFP sequence including the chromophore modification, LE linker, and His-tag. The observed MW (27.982 kDa) was deconvoluted from the intact LC-MS data. The resulting mass error of 857 ppm is larger than the typical <50 ppm required for confident protein identification. Possible reasons include:
- Incomplete calibration of the mass spectrometer
- Partial loss of the His-tag or linker during sample preparation
- Alternative post-translational modifications not accounted for
Waters Part V — Did I make GFP?
Fill out this table with the data acquired from the lab work (or using the screenshots in this document):
| Theoretical | Observed/measured on the Intact LC-MS | PPM Mass Error | |
|---|---|---|---|
| Molecular weight (kDa) | 28.049 | 27.367 | ~24,300 |
Note: The theoretical MW (28.049 kDa) includes the chromophore modification, LE linker, and His-tag. The observed MW (27.367 kDa) was calculated from the adjacent charge state method using peaks from Figure 1 (m/z 1520.4 and 1440.9). The PPM error is calculated as: [ \frac{|27,367 - 28,049|}{28,049} \times 10^6 \approx 24,300 \text{ ppm} ]