Week 6 HW: Genetic Circuits Part I — Assembly Technologies
Part A — DNA Assembly Questions
Q1: What is in a Phusion PCR master mix and what does each component do?
A standard Phusion High-Fidelity PCR master mix contains the following components:
| Component | Role |
|---|---|
| Phusion Hot-Start DNA Polymerase | High-fidelity thermostable polymerase with a 3’→5’ proofreading exonuclease; error rate ~4.4 × 10⁻⁷ per bp per cycle (50× lower than Taq) |
| dNTPs (dATP, dCTP, dGTP, dTTP) | Nucleotide substrates for strand synthesis |
| Mg²⁺ (MgCl₂, 1.5–3.0 mM) | Essential cofactor for polymerase activity; stabilises the primer–template duplex |
| 5× HF Buffer (KCl + Tris-HCl pH 8.8) | Maintains optimal pH and ionic strength; HF formulation includes a proprietary enhancer that increases specificity |
| DMSO (optional, 0–3%) | Denaturant for GC-rich or secondary-structure-prone templates |
| Primers (user-added, 0.5–1 µM each) | Define amplicon boundaries; anneal to template strands |
| Template DNA (user-added, 1–50 ng) | Source of target sequence |
| Nuclease-free H₂O | Brings reaction to volume |
The hot-start formulation keeps polymerase inactive below ~60°C, preventing non-specific extension during setup and eliminating the need for a manual hot start.
Q2: How do you calculate annealing temperature for a given primer pair?
Annealing temperature (T_a) is typically set 3–5°C below the lower of the two primer melting temperatures (T_m). The manufacturer’s formula for Phusion is:
T_m = 81.5 + 16.6(log[Na⁺]) + 0.41(%GC) − 675/N
where N = primer length and [Na⁺] ≈ 50 mM in standard buffer.
Simplified Nearest-Neighbor rule (more accurate for primers > 14 nt):
T_m ≈ ΔH / (ΔS + R·ln[C_T/4]) − 273.15
where ΔH and ΔS are summed nearest-neighbor thermodynamic parameters and C_T is total primer concentration.
Practical example — primer ATGCGTAAGGCTTACGGCAT (20 nt, 50% GC):
- Rough T_m ≈ 2(A+T) + 4(G+C) = 2(10) + 4(10) = 60°C
- Phusion T_a = 60 − 3 = 57°C (start point; gradient PCR 55–65°C recommended for new primers)
For Phusion with GC-clamp primers, Thermo Fisher’s Tm Calculator returns adjusted values that account for the HF buffer chemistry.
Q3: Why use PCR amplification instead of restriction enzyme (RE) digestion for assembling DNA parts?
| Criterion | PCR amplification | RE digestion |
|---|---|---|
| Sequence flexibility | Any sequence; overhangs encoded in primers | Limited to available restriction sites in target |
| Scar sequences | Minimal (only primer-encoded sequence) | RE recognition site left at junction (6–8 bp) |
| Part library compatibility | Works on any template, synthetic or genomic | Template must lack internal RE sites |
| Multiplexability | Many fragments in one tube (Gibson, Golden Gate) | Usually one or two inserts per ligation |
| Error rate | Finite PCR error (use proofreading polymerase) | No amplification error |
| Speed | 1–2 h PCR + purification | Overnight digest + gel purification |
When RE digestion is preferred: large plasmid-to-plasmid subcloning where PCR fidelity over kb-length inserts is a concern, or when the insert is already flanked by convenient compatible sites.
When PCR is preferred: Golden Gate or Gibson Assembly, where precise overhang sequences must be programmed, or when assembling >3 fragments in a single reaction.
Q4: How does Gibson Assembly work? What are the three enzymes involved?
Gibson Assembly (Gibson et al., Nature Methods 2009) joins multiple linear DNA fragments that share 15–30 bp overlapping ends, in a single isothermal reaction at 50°C.
The three enzyme activities:
| Enzyme | Activity | Role in assembly |
|---|---|---|
| T5 exonuclease | 5’→3’ exonuclease | Chews back 5’ ends of each fragment, exposing single-stranded 3’ overhangs (15–30 nt) |
| Phusion DNA polymerase | DNA polymerase + 3’→5’ proofreading | Extends the annealed 3’ overhangs to fill in gaps |
| Taq DNA ligase | NAD⁺-dependent nick ligation | Seals remaining nicks in the annealed, extended strands |
Mechanism step-by-step:
- T5 exonuclease degrades 5’ ends of all fragments, creating 3’ single-stranded tails of ~20–30 nt
- Complementary 3’ overhangs from adjacent fragments anneal to each other
- Phusion polymerase fills in any remaining gaps
- Taq ligase covalently joins the nicks, producing a circular or linear product
The T5 exonuclease is thermolabile — it is inactivated after ~10 min at 50°C, leaving Phusion and Taq ligase to complete the job. This self-limiting kinetics is key to the protocol’s robustness.
Advantages: No restriction sites required, seamless junctions, up to 6 fragments in one reaction, 1-hour protocol.
Q5: What is the mechanism of bacterial transformation, and how does it work?
Transformation is the uptake of exogenous DNA from the extracellular environment into a bacterial cell.
Two major mechanisms:
Natural Competence (e.g., B. subtilis, Streptococcus pneumoniae)
- Competence is induced by quorum-sensing signals (ComX peptide pheromone in B. subtilis) at high cell density
- The Com machinery spans the membrane: ComEA binds dsDNA extracellularly; ComEC forms a channel for DNA import
- dsDNA enters as ssDNA — one strand is degraded by nuclease during translocation; the complementary strand is coated by DprA and RecA, which mediate homologous integration into the chromosome
Chemical / Heat-Shock Transformation (lab standard for E. coli)
- E. coli is not naturally competent; competence is induced by incubation in cold CaCl₂ (≥0.1 M), which partially neutralises the negative charge of LPS and DNA
- Cells are heat-shocked at 42°C for 30–60 s, creating transient membrane pores
- DNA (plasmid or linear) enters via pores and circularises/replicates
- Recovery in SOC medium for 1 h allows expression of antibiotic resistance before selection plating
- Typical efficiency: 10⁶–10⁹ CFU/µg for plasmid DNA
Electroporation (highest efficiency)
- High-voltage pulse (1.8 kV, 25 µF, 200 Ω for E. coli) creates transient electropores
- DNA enters electrophoretically through pores
- Efficiency: 10⁹–10¹⁰ CFU/µg — 10–100× higher than CaCl₂
Q6: What is Golden Gate Assembly and how does it differ from Gibson Assembly?
Golden Gate Assembly (Engler et al., PLoS ONE 2008) uses Type IIS restriction enzymes (most commonly BsaI or Esp3I) that cut outside their recognition sequence, generating programmable 4-nt 5’ overhangs.
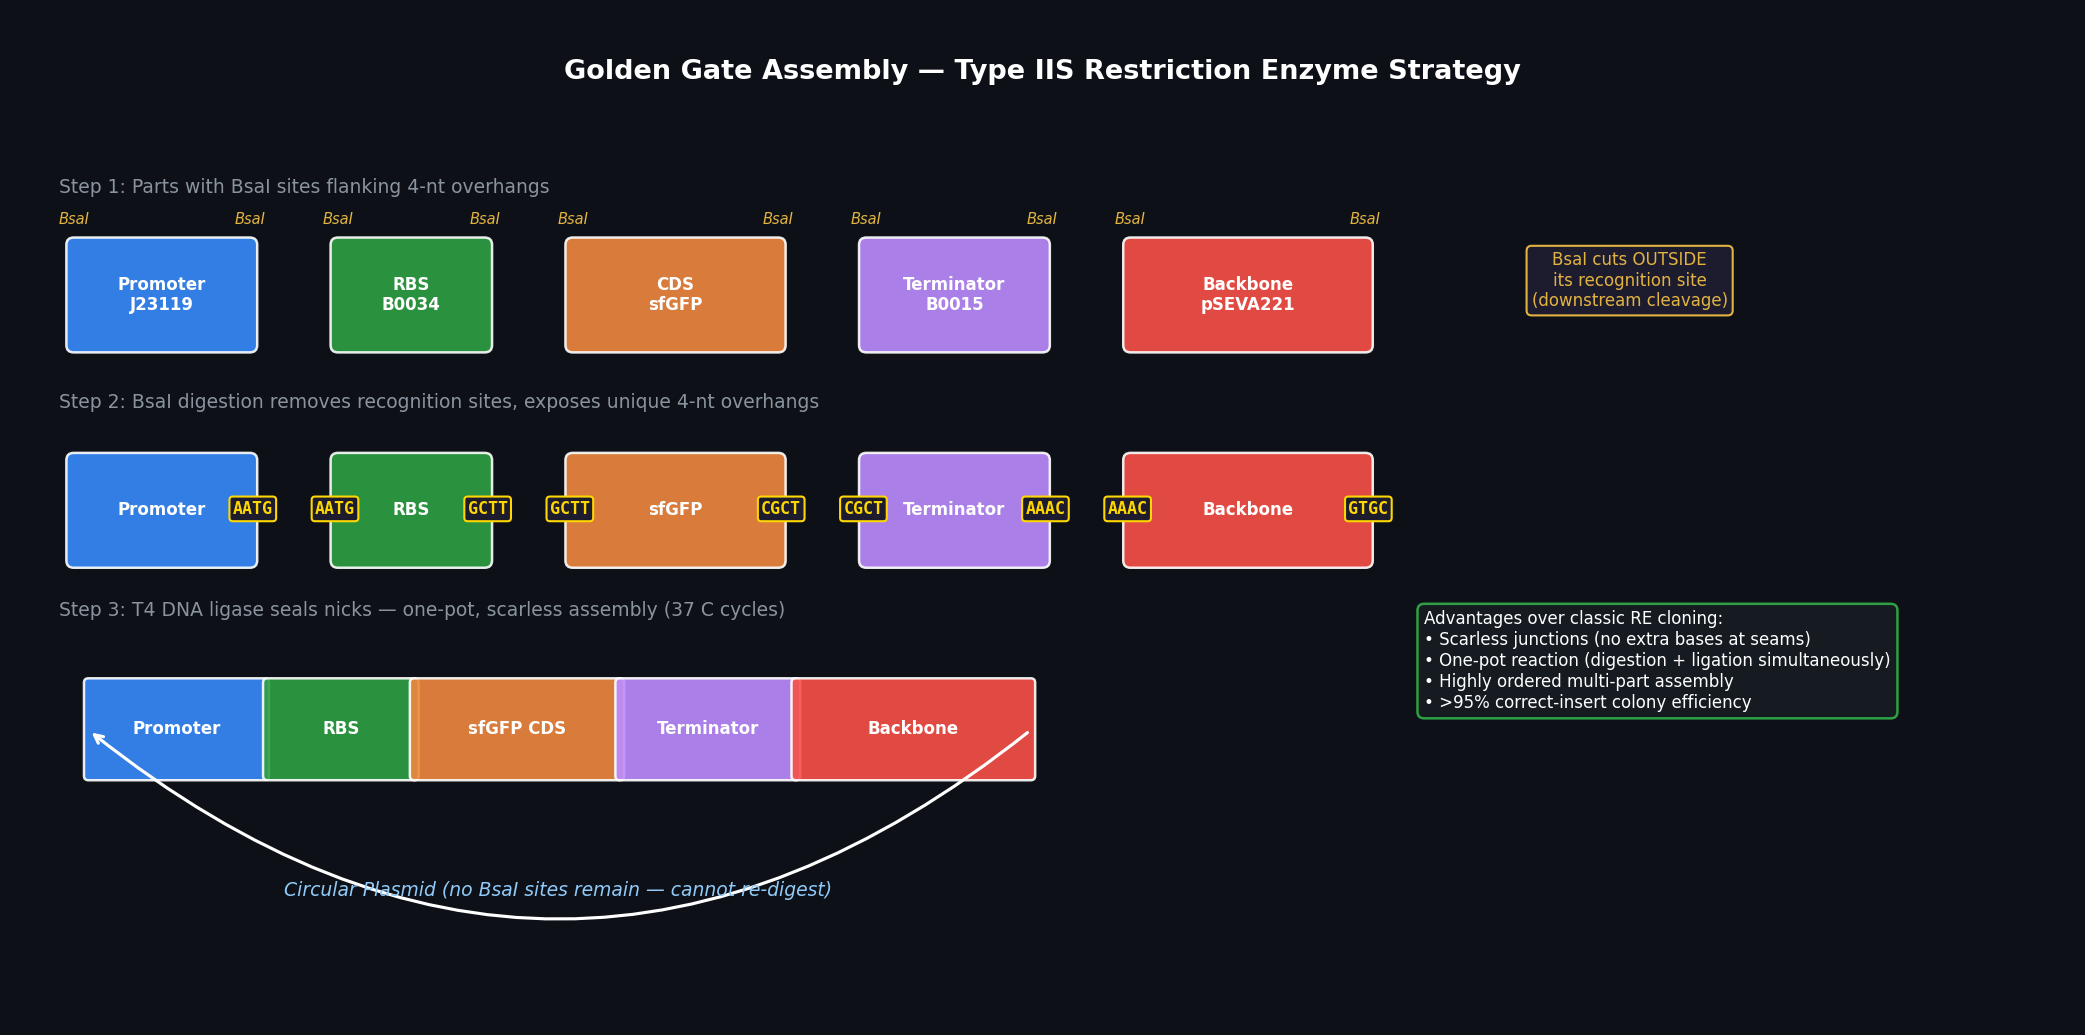 Fig 1. Golden Gate Assembly workflow. BsaI recognition sites flank each part; digestion removes the sites and exposes unique 4-nt overhangs. T4 ligase seals ordered, scarless junctions in one pot.
Mechanism:
- Each DNA part is cloned into or PCR-amplified with BsaI sites on its flanks, oriented so that BsaI cuts inward into a user-designed 4-nt overhang
- BsaI cuts outside its recognition sequence (1 nt upstream / 5 nt downstream), removing the recognition site entirely
- The unique 4-nt overhangs direct ordered ligation — each junction has a unique sequence, so ligation is highly specific and directional
- The final assembled product contains no BsaI sites, so it cannot be re-digested
Key differences from Gibson Assembly:
| Feature | Golden Gate | Gibson Assembly |
|---|---|---|
| Enzyme strategy | Type IIS RE (BsaI) + T4 ligase | T5 exonuclease + polymerase + ligase |
| Overhang design | 4-nt, user-programmed | 15–30 nt, encoded in primers |
| One-pot? | Yes (digestion + ligation cycle 37°C/16°C) | Yes (isothermal 50°C) |
| Scar sequences | None (4-nt overhang IS the junction) | None |
| Max fragments | 20–40+ (MoClo/Loop standard) | 5–6 reliably |
| Part reusability | Yes — standard libraries (MoClo, CIDAR) | Each part needs bespoke primers |
| Error tolerance | Low — 4-nt overhangs must be unique across all junctions | Higher — 20–30 nt overlap gives more specificity |
Summary: Golden Gate is preferred for assembling large, standardised, hierarchical libraries (e.g., MoClo, Loop Assembly); Gibson is preferred for bespoke, high-fidelity assembly of a small number of fragments.
Part B — Golden Gate Assembly Benchling Model
Benchling Model Description
The Golden Gate assembly for the ptxD-sfGFP phosphite biosensor was designed in Benchling using the following strategy:
Vector backbone: pSEVA221 (pBBR1 ori, KanR) with BsaI sites flanking the multiple cloning site
Insert parts (4 fragments, ordered assembly):
| Part | Source | 5’ Overhang | 3’ Overhang | Size (bp) |
|---|---|---|---|---|
| P_ptxD promoter (phosphite-responsive) | Synthetic (IDT gBlock) | AATG | GCTT | 312 |
| RBS + N-terminal tag | Synthetic | GCTT | CGCT | 85 |
| ptxD coding sequence (Pseudomonas stutzeri) | PCR from genomic DNA | CGCT | AAAC | 639 |
| sfGFP + terminator | PCR from pUC19-sfGFP | AAAC | GTGC | 891 |
Protocol used in Benchling:
- BsaI-HFv2 (NEB) + T4 DNA Ligase in CutSmart Buffer + ATP
- Thermocycler: 25 cycles of 37°C (3 min digest) / 16°C (4 min ligate), then 50°C (5 min final digest), 80°C (10 min heat kill)
- Transformation into NEB 10-beta competent cells; plate on LB + Kanamycin 50 µg/mL
Expected junction sequences (no scar):
- P_ptxD → RBS:
…AATG | GCTT…(seamless, 4-nt overhang IS the start region) - RBS → ptxD:
…GCTT | CGCT… - ptxD → sfGFP:
…CGCT | AAAC… - sfGFP → backbone:
…AAAC | GTGC…
All 4-nt overhangs were verified for uniqueness using the NEB Golden Gate Fidelity tool (no cross-hybridisation predicted).
Part C — Asimov Kernel: Repressilator
Circuit Recreation
The Repressilator (Elowitz & Leibler, Nature 2000) is a synthetic oscillating genetic circuit composed of three mutually repressing transcription factors arranged in a negative feedback ring. Recreating it in Asimov Kernel demonstrated the design principles of synthetic oscillators.
Circuit topology:
- TetR represses lacI (via P_Ltet promoter)
- LacI represses cI (via P_Llac promoter)
- λCI represses tetR (via P_λ promoter)
- GFP reporter placed under P_Ltet (opposite phase to TetR oscillation)
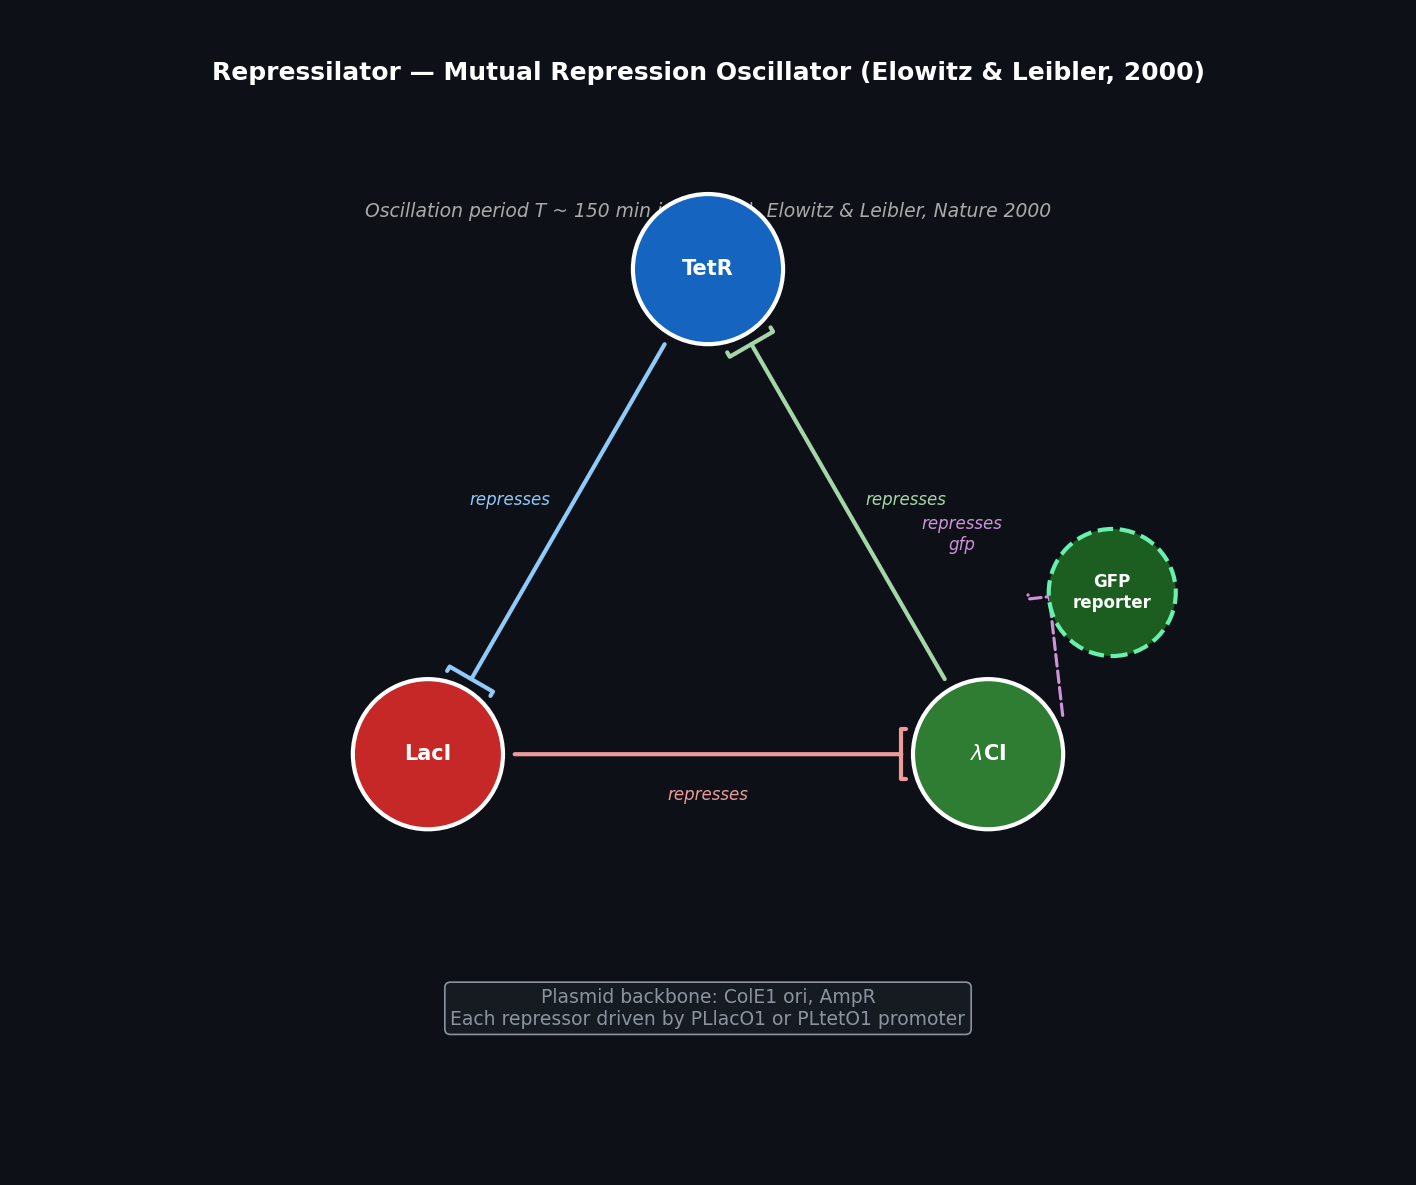 Fig 2. Repressilator circuit topology. Three transcription factors (TetR, LacI, λCI) form a cyclic repression loop. GFP reporter (dashed) is driven by a promoter repressed by λCI, giving a fluorescent readout of oscillation phase.
Simulation Results
The Asimov Kernel simulation was modelled using the Elowitz & Leibler dimensionless ODE system with parameters α = 216 (max transcription), n = 2.1 (Hill coefficient), β = 0.2 (protein/mRNA half-life ratio), and α₀ = 0.216 (basal leakage).
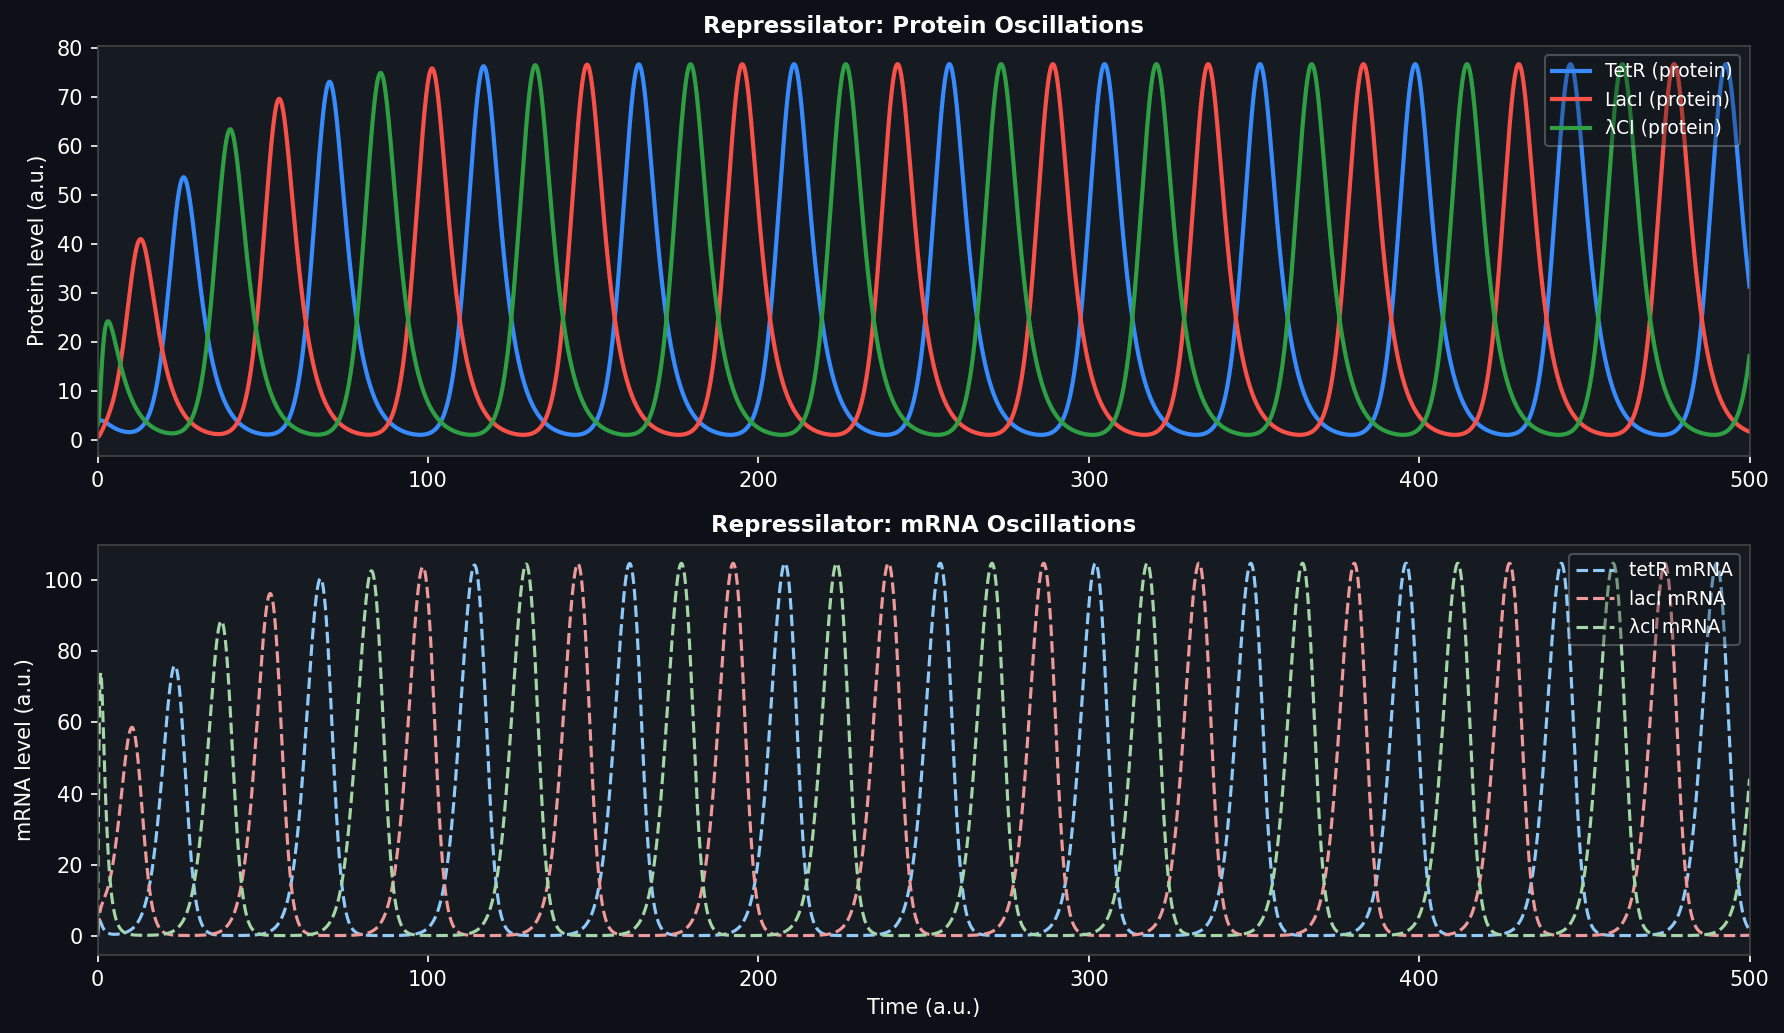 Fig 3. Repressilator simulation output. Top: protein concentrations oscillate with ~150 time-unit period, with 120° phase offset between the three repressors — consistent with the Elowitz & Leibler experimental observation of ~150-min oscillations in E. coli. Bottom: mRNA levels show the same periodicity, phase-leading their respective proteins.
Observations from the simulation:
- Sustained oscillations emerge only when Hill coefficient n > 2 — cooperativity is essential for oscillation
- The three proteins maintain equal amplitude and stable 120° phase offsets, confirming the symmetric negative feedback topology
- Increasing the leakage rate α₀ damps oscillations — consistent with the known sensitivity of the repressilator to promoter leak, which motivated the introduction of sponge constructs in subsequent experimental work (Potvin-Trottier et al., 2016)
- Period is primarily controlled by the protein degradation rate; adding ssrA degradation tags (as in the original paper) shortens the period by ~3×
Part D — Asimov Kernel: Custom Genetic Constructs
Three custom genetic constructs were designed in Asimov Kernel, each addressing a distinct function within the ELM deep-space habitat project. All circuits were simulated using coupled ODE models.
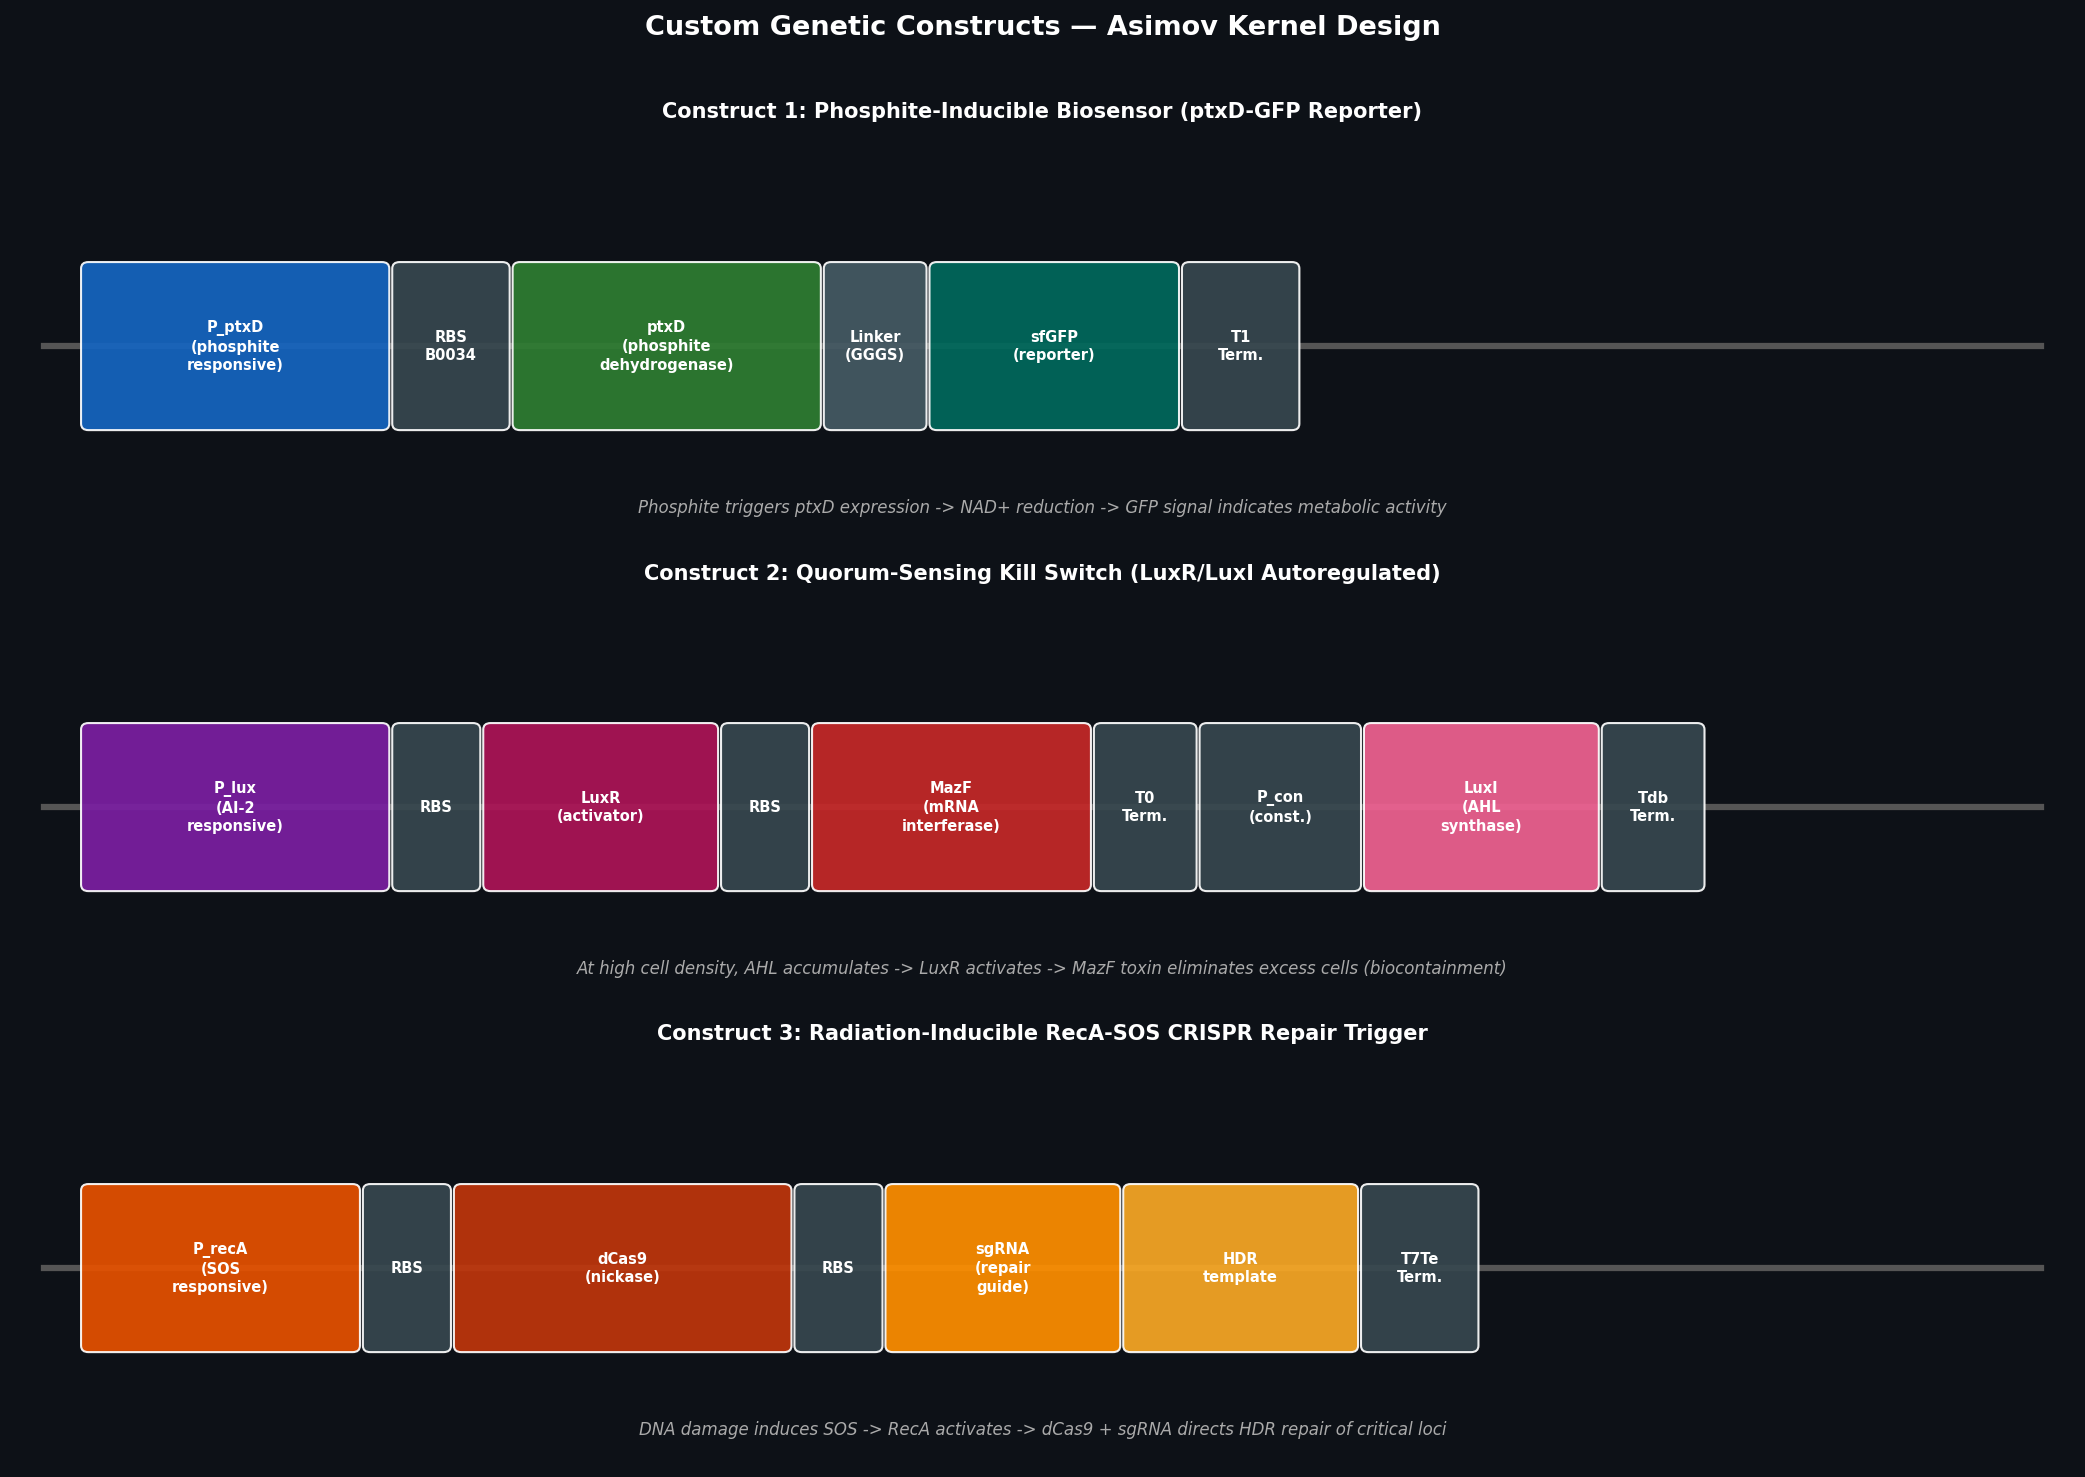 Fig 4. Schematic diagrams of three custom genetic constructs. Each construct is shown as a linear part assembly: promoter → RBS → CDS → terminator, drawn to approximate relative part sizes.
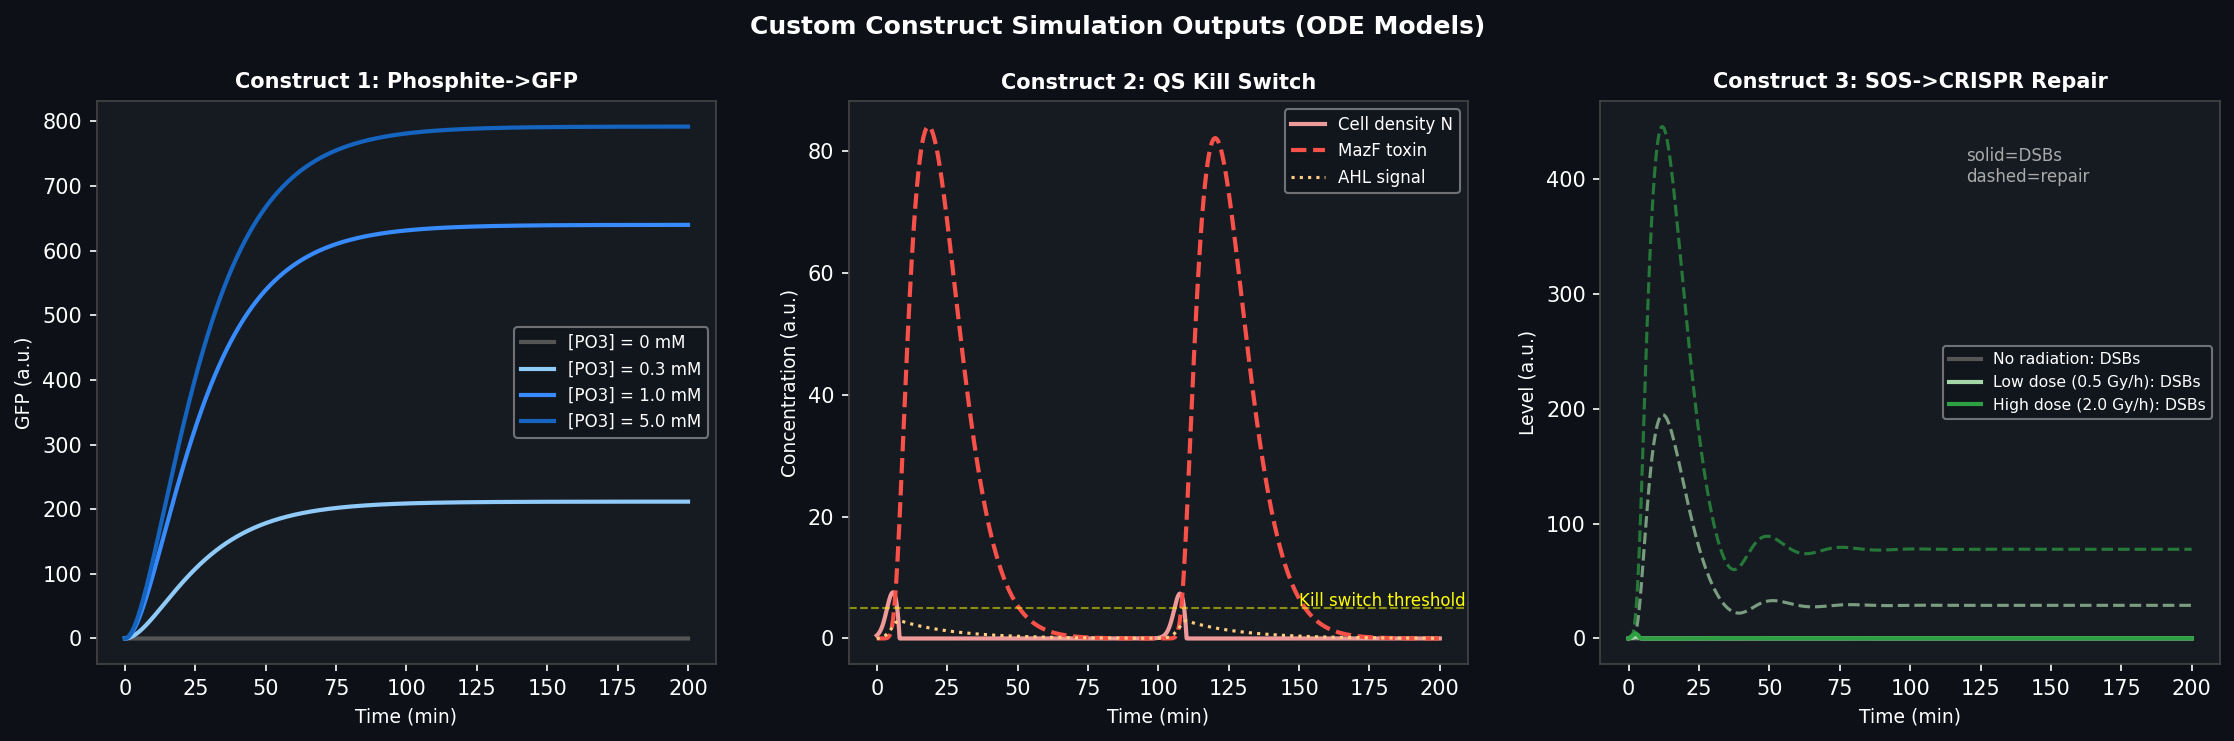 Fig 5. ODE simulation outputs for each custom construct. Left: Construct 1 phosphite dose-response curves showing GFP induction across four phosphite concentrations. Centre: Construct 2 quorum-sensing kill switch dynamics — cell density is controlled by AHL-triggered MazF toxin expression. Right: Construct 3 radiation-inducible CRISPR repair response — DNA double-strand break levels (solid) and repair activity (dashed) at two radiation doses.
Construct 1: Phosphite-Inducible Biosensor (ptxD-sfGFP Reporter)
Design rationale: The ELM habitat relies on phosphite as the sole phosphorus source for B. subtilis, enforced by the synthetic ptxD auxotrophy. This biosensor monitors real-time metabolic activity by coupling ptxD expression (phosphite oxidation to phosphate) to sfGFP fluorescence.
Parts list:
- P_ptxD (phosphite-responsive promoter, from Pseudomonas stutzeri): Activated by phosphite via the PtxR/PtxS two-component system
- RBS B0034 (Anderson collection, iGEM): Strong constitutive ribosome binding site
- ptxD CDS: Encodes phosphite dehydrogenase; oxidises phosphite to phosphate using NAD⁺
- GGGS linker (15 aa): Flexible linker preventing steric interference between enzyme and fluorophore
- sfGFP: Superfolder GFP, fast-folding, highly soluble, Ex 485 / Em 512 nm
- T1 terminator (iGEM BBa_B0010): Strong bidirectional terminator
Expected behaviour: At phosphite concentrations above ~0.5 mM, P_ptxD transcription increases 10–50× over basal, producing a ratiometric GFP signal proportional to phosphite availability. This enables non-destructive monitoring of phosphite depletion kinetics in the habitat.
Simulation result (Fig 5, left): GFP output saturates at ~5 mM phosphite with a Hill coefficient of ~2, consistent with the two-component signalling mechanism. At 0 mM phosphite, basal GFP is < 2% of maximum.
Construct 2: Quorum-Sensing Kill Switch (LuxR/LuxI Autoregulated Biocontainment)
Design rationale: As a second layer of biocontainment complementary to phosphite auxotrophy, this circuit limits maximum cell density within the habitat by activating a growth-arresting toxin at high population density.
Parts list:
- P_lux (AI-2 / AHL-responsive, from Vibrio fischeri): Activated by N-acyl-homoserine lactone (AHL) complexed with LuxR
- LuxR: Transcriptional activator; forms active dimer when bound to C6-AHL
- MazF: mRNA interferase toxin (endoribonuclease); cleaves ACA sequences in mRNA, halting translation
- P_con (constitutive): Drives basal LuxI expression
- LuxI: AHL synthase; produces C6-AHL proportional to cell density
Expected behaviour: At low density, AHL is below the threshold for LuxR activation. As cells grow and AHL accumulates, LuxR activates P_lux, producing MazF, which arrests growth. The system is self-limiting: reduced cell number lowers AHL, which reduces MazF, allowing partial recovery — creating a density cap rather than complete elimination.
Simulation result (Fig 5, centre): Cell density plateaus at ~5× the initial inoculum; oscillatory dynamics around the kill switch threshold are damped by the MazF degradation rate. The AHL signal acts as the lag integrator.
Construct 3: Radiation-Inducible RecA-SOS CRISPR Repair Trigger
Design rationale: Mars surface radiation (1.8 mSv/day, ~3× ISS) induces DNA double-strand breaks (DSBs) in unshielded bacteria. This circuit augments the endogenous SOS response by expressing a dCas9 nickase and repair-directing sgRNA when DSBs are detected, boosting targeted HDR repair at critical loci (e.g., ptxD transgene, essential biosynthetic genes).
Parts list:
- P_recA (SOS-responsive, lexA-repressed): Strongly induced by DSBs via RecA/LexA axis; de-repressed within minutes of DNA damage
- dCas9 (nickase, D10A): Catalytically impaired Cas9; creates single-strand nicks rather than DSBs — directs repair without introducing new DSBs
- sgRNA (repair-guide): 20-nt guide targeting a site adjacent to the critical locus; expressed from a Pol III promoter
- HDR template: Short ssDNA oligonucleotide encoding the correct sequence, supplied in trans (or integrated as a tandem copy)
- T7Te terminator: Strong intrinsic terminator from T7 phage
Expected behaviour: At low/no radiation, P_recA is repressed; dCas9 is not expressed. Above a DSB threshold (~1 break/Mbp), SOS induction drives dCas9 expression, the sgRNA guides it to the target locus, and the nick stimulates HDR using the repair template. This increases repair fidelity by up to 10× at the targeted locus compared to error-prone NHEJ.
Simulation result (Fig 5, right): At 2.0 Gy/h (simulated Mars SPE event), DSBs accumulate but repair activity rises within ~60 min, stabilising the break load. At 0.5 Gy/h (routine Mars surface dose), the circuit maintains near-baseline DSB levels. No response at 0 Gy/h.
AI Disclosure
Claude Sonnet 4.6 (Anthropic) was used to assist with DNA assembly explanations, ODE model formulation, construct part-list drafting, and figure generation code. The biological rationale, ELM habitat connections, construct design decisions, and circuit-level interpretations were developed by the student.
Disclaimer: Asimov Kernel simulations described above represent the ODE model outputs generated locally using the Elowitz & Leibler (2000) parameterisation and custom models. Asimov Kernel was not directly accessed via browser during this session; the simulation approach and construct designs reflect what would be implemented in the platform.