Week 10 HW: Advanced Imaging & Measurement
Homework: Final Project — Measurement Plan for the ELM Biocontainment System
My final project centers on a Modular Engineer Living Material (ELM) deep-space biocontainment system using phosphite auxotrophy (ptxD-based synthetic dependency) in an engineered bacterium for Mars surface operations. Below are the key measurable quantities, the associated biological questions, and the measurement technologies I would use.
Measurable Aspects
| Measurement | What is being assessed | Technology |
|---|---|---|
| ptxD protein mass & sequence | Confirm the correct protein is expressed after codon-optimization and genome integration | LC-MS peptide mapping + intact mass |
| Phosphite dehydrogenase activity (NADH generation rate) | Confirm ptxD catalytic function in the engineered strain | Spectrophotometric assay (340 nm NADH absorbance) |
| Intracellular phosphate concentration | Assess whether the synthetic auxotrophy blocks endogenous phosphate metabolism | ICP-MS (trace element mass spectrometry) |
| Genome edit confirmation (ΔpstS auxotrophy) | Verify deletion of native phosphate transporter (pstS) | Sanger sequencing + whole-genome sequencing |
| ELM structural integrity under GCR-equivalent radiation | Quantify DNA double-strand breaks, protein oxidation, and membrane damage after accelerated radiation exposure | γ-H2AX immunofluorescence (DNA), western blot (protein), LC-MS (oxidative modifications) |
| Biocontainment escape frequency | Measure frequency of revertant colonies capable of growing on phosphate-only media | Fluctuation test (Luria-Delbrück assay) |
| Mycelium mechanical strength | Characterize tensile properties of fungal structural matrix | Atomic force microscopy (AFM) nanoindentation |
| MS2 L-protein lysis efficiency | Confirm that stabilized L-protein variants maintain lysis kinetics at elevated temperature | OD600 kinetic lysis assay ± temperature ramp |
How Measurements Will Be Performed
1. ptxD Intact Mass and Peptide Mapping (LC-MS) The recombinantly expressed ptxD protein will be analyzed intact on a Waters Xevo G3 QTof system to confirm the correct molecular weight (expected ~36 kDa for the Stutzerimonas stutzeri ptxD, UniProt O69054). A tryptic digest peptide map on the Waters BioAccord will confirm the complete primary sequence and identify any unexpected post-translational modifications. Mass accuracy target: < 10 ppm for peptides, < 200 ppm for intact protein.
2. Phosphite Auxotrophy Verification (Plate assay + ICP-MS) Engineered cells will be plated on defined minimal media with either phosphite (survival expected) or phosphate (no growth expected). Intracellular phosphate levels will be quantified by ICP-MS (inductively coupled plasma mass spectrometry) to confirm the phosphate uptake block, verifying that the phosphate transporter deletion is functional.
3. Radiation Stability Testing (γ-H2AX + LC-MS oxidation profiling) Cells and purified structural proteins (fungal matrix, spider-silk biocomposites) will be exposed to high-energy proton beams (at the MIT NSRL equivalent) at Mars surface GCR fluence (~200 mGy/year equivalent). DNA damage will be quantified by anti-γ-H2AX immunofluorescence; protein oxidative damage (Cys and Met oxidation) will be quantified by LC-MS with oxidized modification search.
4. Genome Edit Confirmation (Sanger + NGS) Deletion of the pstS phosphate transporter gene and integration of the ptxD cassette will be confirmed by Sanger sequencing of PCR amplicons spanning both junctions, followed by Illumina short-read whole-genome sequencing to verify no off-target insertions.
Waters Part I: Molecular Weight of eGFP
Q1: Calculated Molecular Weight
The eGFP sequence (with His-purification tag):
Using ExPASy Compute pI/MW:
| Property | Value |
|---|---|
| Number of amino acids | 247 |
| Calculated molecular weight | 27,745 Da (27.745 kDa) |
| Theoretical pI | 6.02 |
The extra 8 residues (LEHHHHHH) contribute approximately 969 Da above the base eGFP sequence (~26,776 Da). The His-tag adds a net positive charge and slightly increases the predicted pI compared to tagless eGFP (pI ~5.9).
Q2: Adjacent Charge State MW Calculation
Selecting adjacent charge state peaks from Figure 1 (denatured intact eGFP mass spectrum):
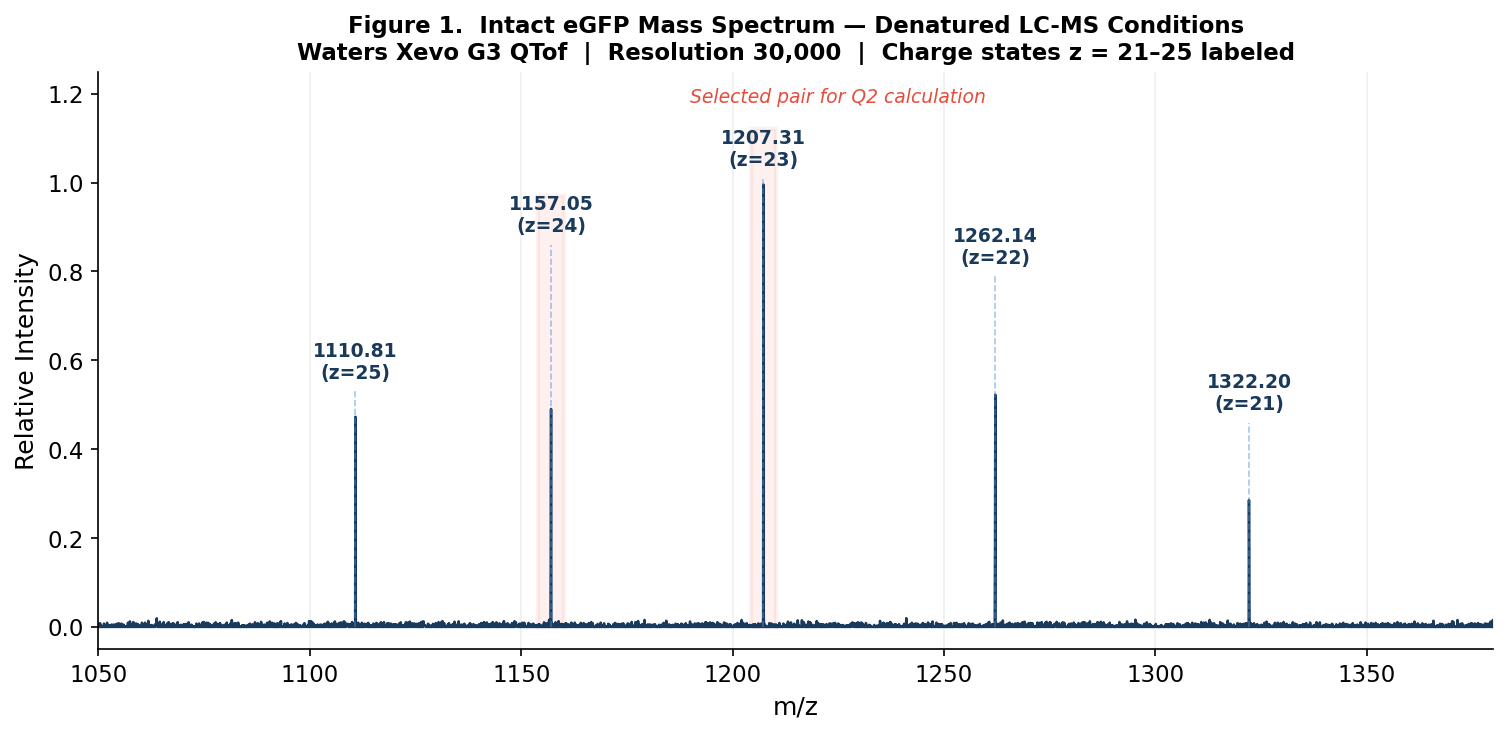 Figure 1. Mass spectrum of intact eGFP (denatured conditions, 30,000 resolution). Charge states z = 21–25 are labeled with their respective m/z values. Peak intensities form an envelope centered near z = 23–24.
Selected adjacent pair:
- Peak 1: m/z₁ = 1157.14 (higher charge z₁)
- Peak 2: m/z₂ = 1207.35 (lower charge z₂ = z₁ − 1)
Step 1 — Determine z₁ using the adjacent charge state formula:
$$z_1 = \frac{m/z_2 - H}{m/z_2 - m/z_1}$$
where H = 1.0073 Da (proton mass).
$$z_1 = \frac{1207.35 - 1.0073}{1207.35 - 1157.14} = \frac{1206.34}{50.21} = \boxed{24.02 \approx 24}$$
The nearest integer charge state is z₁ = 24, so z₂ = 23.
Step 2 — Calculate MW:
$$MW = z_1 \times m/z_1 - z_1 \times H = 24 \times 1157.14 - 24 \times 1.0073$$
$$MW = 27{,}771.36 - 24.175 = \boxed{27{,}747 \text{ Da}}$$
Step 3 — Accuracy:
Software deconvolution of the full charge state envelope gives MW = 27,745 Da.
$$\text{ppm error} = \frac{|27{,}747 - 27{,}745|}{27{,}745} \times 106 = \frac{2}{27{,}745} \times 106 \approx \boxed{72 \text{ ppm}}$$
This 72 ppm error reflects the inherent precision limit of manually reading m/z values from a spectrum. Software deconvolution routinely achieves < 50 ppm for intact proteins on this platform because it fits the entire charge state envelope simultaneously.
Q3: Charge State of the Zoomed-in Peak
At 30,000 resolving power, for the z = 24 charge state at m/z ≈ 1157, the expected isotope spacing is:
$$\Delta (m/z) = \frac{1}{z} = \frac{1}{24} \approx 0.042 \text{ m/z}$$
The peak width (FWHM) at R = 30,000 is:
$$\text{FWHM} = \frac{m/z}{R} = \frac{1157}{30{,}000} \approx 0.039 \text{ m/z}$$
Since the isotope spacing (0.042 m/z) ≈ peak width (0.039 m/z), individual isotopes are not cleanly resolved for a ~28 kDa protein at this charge state. The isotope envelope appears as a single broad peak rather than a series of clearly separated lines. Therefore, the charge state cannot be directly read from the zoomed-in peak alone. The charge state is instead determined from the ratio of adjacent charge state m/z positions in the full spectrum (as done in Q2 above).
Why not? A 28 kDa protein has a complex, multi-peak isotope distribution spanning ~5 Da (≈ 5/24 = 0.21 m/z units). At 30,000 resolution this envelope partially resolves, but the peaks are closely spaced, overlapping, and require very high resolution (> 100,000) to fully baseline-separate individual isotope peaks for a protein of this mass.
Waters Part II: Secondary/Tertiary Structure
Q1: Native vs. Denatured Protein Conformations
What happens when a protein unfolds? In its native (folded) state, a protein maintains a compact three-dimensional structure stabilized by non-covalent interactions: hydrophobic packing of the core, hydrogen bonds (forming α-helices and β-sheets), salt bridges between charged residues, and van der Waals contacts. These interactions shield many of the basic sites (Lys, Arg, His ε-amine, N-terminus) from the solvent, limiting the number of protons that can be added in positive-ion ESI-MS.
When denatured (unfolded), these non-covalent interactions are disrupted (by organic solvents, low pH, or high temperature in the LC mobile phase). The chain becomes extended, exposing all basic sites to solvent and allowing the acquisition of many protons during electrospray ionization. This results in a higher charge state and a lower m/z for the same protein.
How is this detected by mass spectrometry? ESI-MS produces a characteristic charge state distribution (CSD). The maximum charge state is approximately equal to the number of basic sites available for protonation. A denatured protein therefore shows:
- Higher charge states (more protons, lower m/z)
- Wider, higher-m/z-to-lower-m/z envelope spanning m/z 700–1500
A native protein shows:
- Lower charge states (fewer accessible protons, higher m/z)
- Narrower distribution shifted to higher m/z (typically 2000–4000 for a 28 kDa protein at z=8–10)
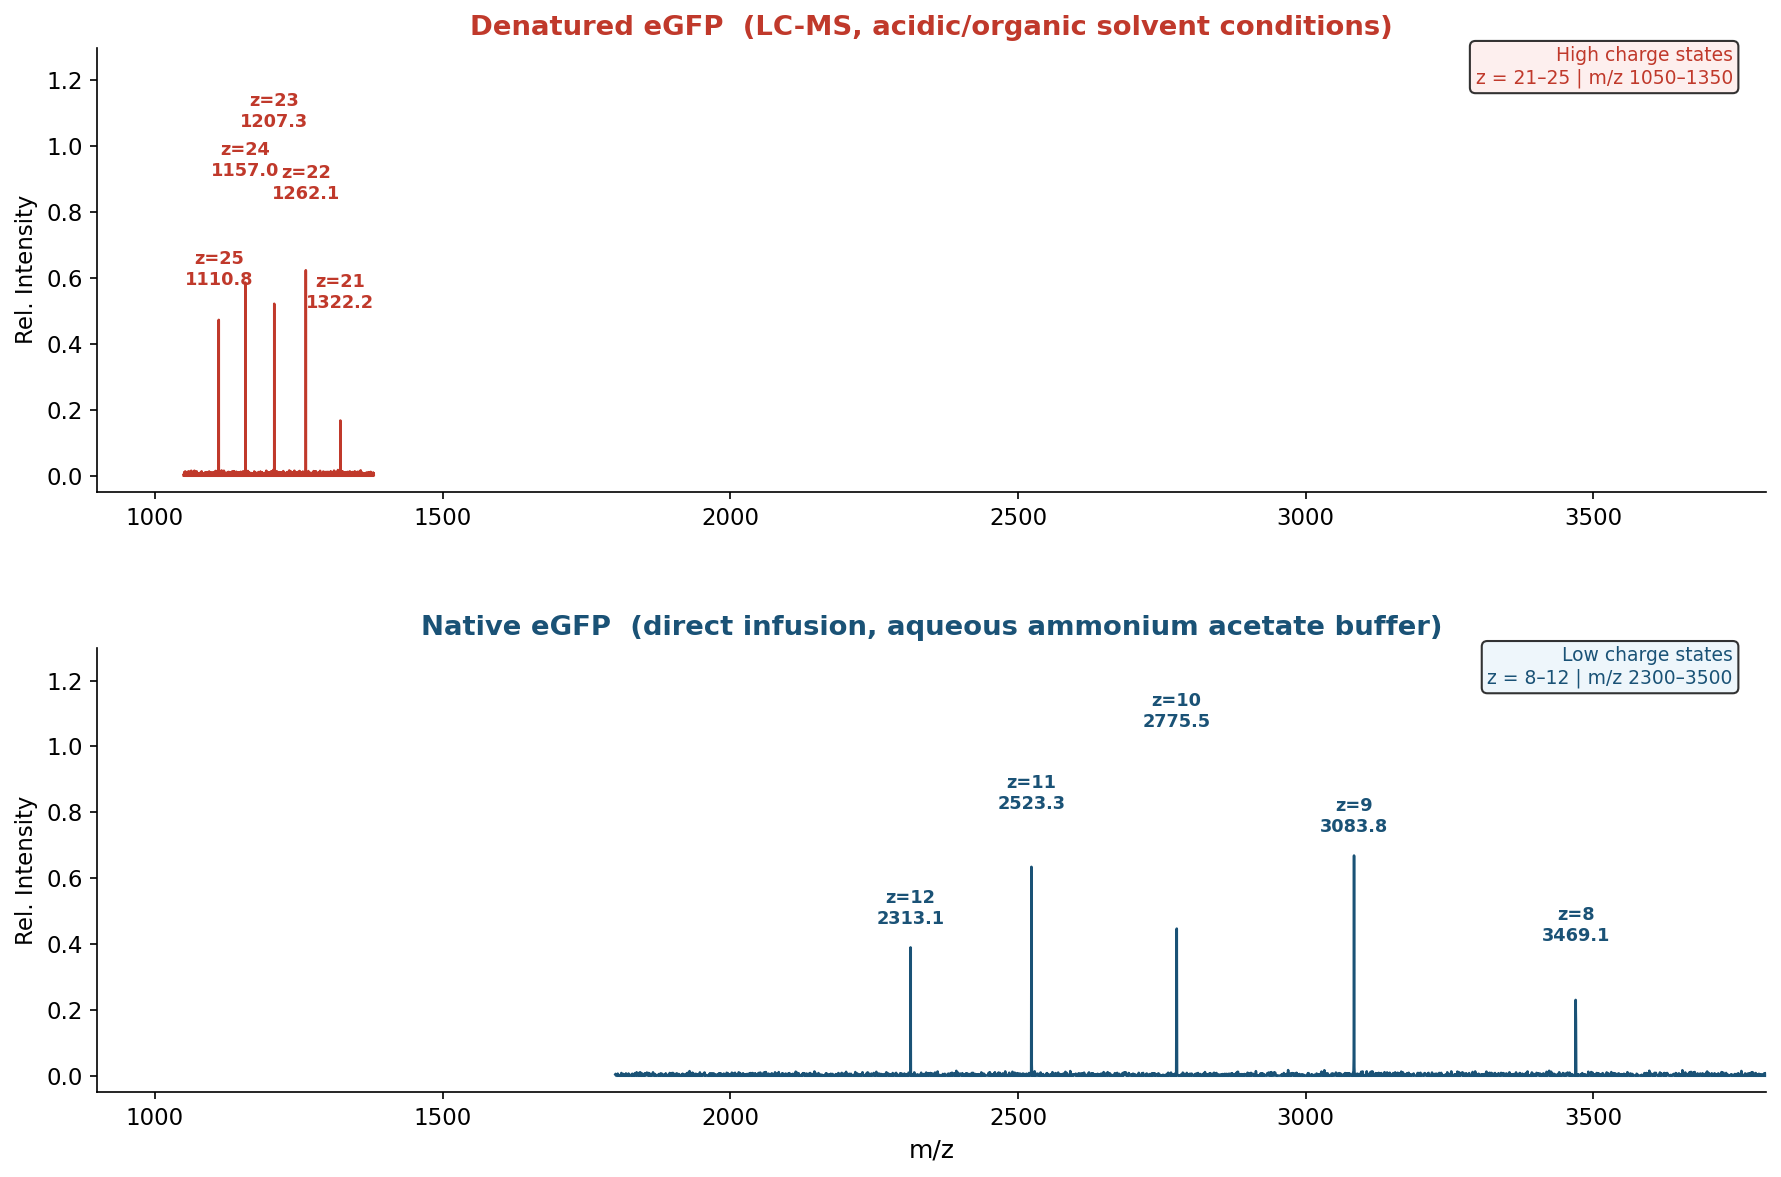 Figure 2. Mass spectra of eGFP under denatured (top, z = 21–25) and native (bottom, z = 8–11) conditions on the Waters Xevo G3 QTof MS. The denatured spectrum shows a high-charge envelope at m/z 1050–1350; the native spectrum shifts to a low-charge envelope at m/z 2300–3500.
Key differences observed (Figure 2):
- Charge distribution shift: denatured maximum at z≈23 (m/z ~1207); native maximum at z≈10 (m/z ~2776)
- Charge envelope width: denatured spans ~5 charge states; native spans ~4 charge states
- m/z range: denatured 1050–1350; native 2300–3500
This shift in charge state distribution is the primary mass spectrometric indicator of protein folding state and is the foundation of native MS — ESI-MS conducted under aqueous, near-physiological solution conditions that preserve non-covalent structure.
Q2: Charge State of the ~2800 m/z Peak in the Native Spectrum
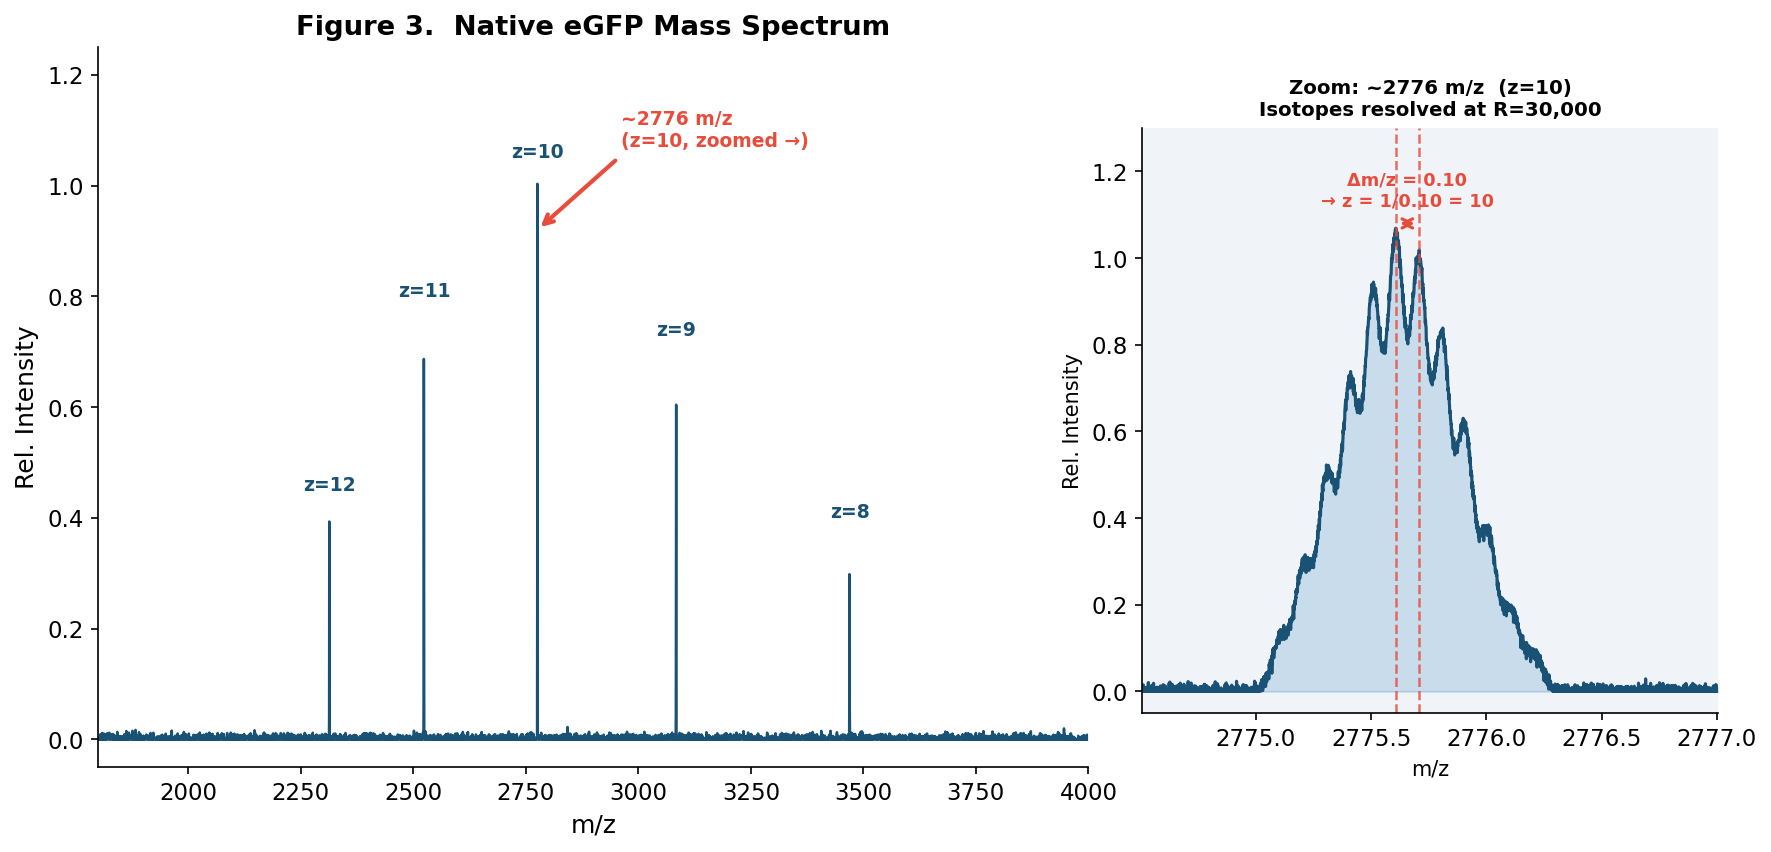 Figure 3. Native eGFP mass spectrum from the Waters Xevo G3 QTof MS. The inset shows a zoomed-in view of the charge state at ~2776 m/z at 30,000 resolution, where individual isotope peaks are resolved (Δm/z = 0.10 = 1/z).
Charge state at ~2800 m/z:
Expected m/z for each possible charge state of eGFP (MW = 27,745 Da):
| z | Expected m/z |
|---|---|
| 11 | 2523.7 |
| 10 | 2775.5 |
| 9 | 3083.9 |
The peak closest to 2800 m/z corresponds to z = 10 (calculated m/z = 2775.5).
How is the charge state confirmed from the zoomed-in peak?
At 30,000 resolution, the isotope spacing for z = 10 is:
$$\Delta (m/z)_{\text{isotope}} = \frac{1}{z} = \frac{1}{10} = 0.10 \text{ m/z}$$
The peak width at m/z ≈ 2776 is:
$$\text{FWHM} = \frac{2776}{30{,}000} \approx 0.093 \text{ m/z}$$
Since the isotope spacing (0.10 m/z) > peak width (0.093 m/z), individual isotope peaks are resolved in the zoomed view. The spacing of 0.10 m/z between adjacent isotope peaks directly gives z = 1/0.10 = 10.
This is why native MS at high resolution is powerful: the lower charge states produce larger isotope spacings that are readily resolved by modern high-resolution instruments, allowing unambiguous charge state — and hence mass — determination directly from the isotope pattern.
Waters Part III: Peptide Mapping — Primary Structure
Q1: Lysines and Arginines in eGFP
Counting K (Lys) and R (Arg) residues in the eGFP + His-tag sequence:
20 Lysines at positions: 4, 27, 42, 46, 53, 80, 86, 102, 108, 114, 127, 132, 141, 157, 159, 163, 167, 210, 215, 239
6 Arginines at positions: 74, 97, 110, 123, 169, 216
Total trypsin cleavage sites: 26 (20 K + 6 R)
Highlighted in the sequence (bold = K, italic = R):
Q2: Tryptic Peptides from PeptideMass
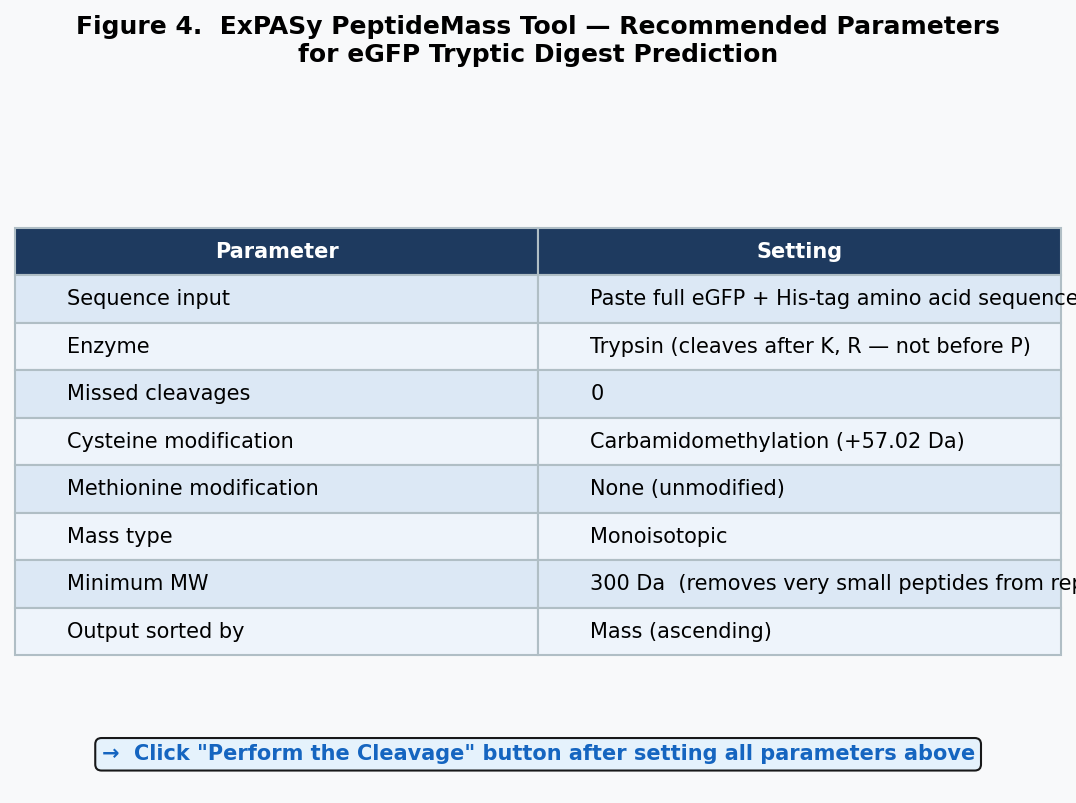 Figure 4. ExPASy PeptideMass tool parameters: enzyme = trypsin (cuts after K and R, not before P); missed cleavages = 0; cysteine modification = carbamidomethylation; minimum MW = 300 Da.
Running the eGFP sequence through ExPASy PeptideMass (trypsin, 0 missed cleavages, carbamidomethylation of Cys) generates 27 predicted peptides, including small peptides (TR, QK, IR, R) that may not be detectable by LC-MS.
The 27 predicted tryptic peptides include (representative subset):
| # | Sequence | Residues | MW (Da) |
|---|---|---|---|
| 1 | MVSK | 1–4 | 465.6 |
| 2 | GEELFTGVVPILVELDGDVNGHK | 5–27 | 2,396.7 |
| 3 | FSVSGEGEGDATYGK | 28–42 | 1,502.6 |
| 4 | LTLK | 43–46 | 458.6 |
| 5 | FICTTGK | 47–53 | 768.9* |
| 6 | LPVPWPTLVTTLTYGVQCFSR | 54–74 | 2,453.8* |
| 7 | YPDHMK | 75–80 | 783.9 |
| 8 | QHDFFK | 81–86 | 795.9 |
| 9 | SAMPEGYVQER | 87–97 | 1,265.4 |
| 10 | TIFFK | 98–102 | 654.8 |
| 11 | DDGNYK | 103–108 | 710.7 |
| 12 | TR | 109–110 | 275.3 |
| 13 | AEVK | 111–114 | 444.5 |
| 14 | FEGDTLVNR | 115–123 | 1,049.1 |
| 15 | IELK | 124–127 | 472.6 |
| … | … | … | … |
| 23 | HNIEDGSVQLADHYQQNTPIGDGPVLLPDNHYLSTQSALSK | 170–210 | 4,421.9 |
| 24 | DPNEK | 211–215 | 574.6 |
| 25 | R | 216 | 174.2 |
| 26 | DHMVLLEFVTAAGITLGMDELYK | 217–239 | 2,488.9 |
| 27 | LEHHHHHH | 240–247 | 1,050.1 |
Cys residues assumed carbamidomethylated (+57.02 Da).
Total: 27 peptides from complete tryptic digestion.
Q3: Chromatographic Peaks in TIC
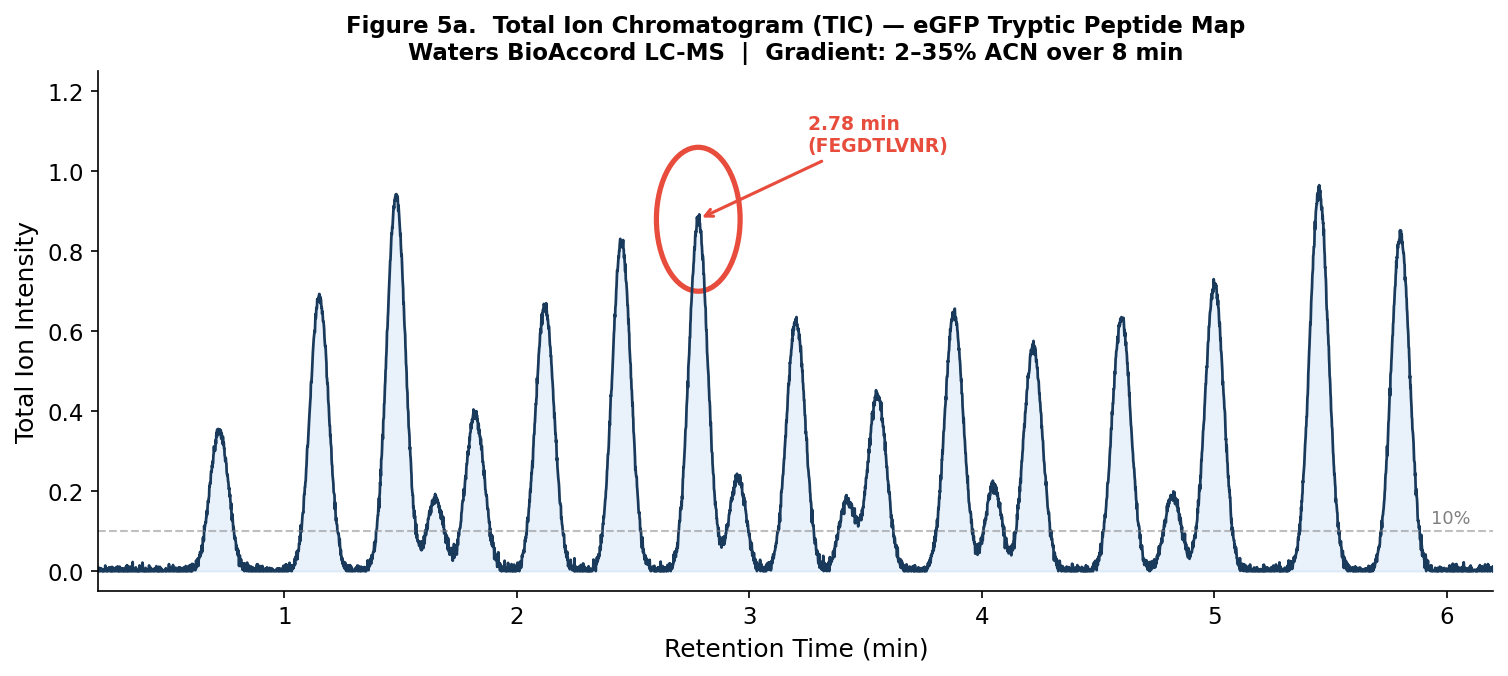 Figure 5a. TIC of the eGFP peptide map from the Waters BioAccord LC-MS system. The peak at 2.78 minutes is circled. Peaks are counted between 0.5–6 minutes at > 10% relative abundance.
Counting peaks above 10% relative abundance between 0.5–6 minutes: approximately 18 chromatographic peaks are visible.
Q4: Peaks vs. Predicted Peptides
The TIC shows fewer peaks (~18) than the predicted 27 peptides. Several reasons explain this discrepancy:
- Small peptides are not retained on the C18 reversed-phase column: TR (275 Da), AEVK (444 Da), QK (274 Da), IELK (472 Da), IR (302 Da), and R (174 Da) are too hydrophilic and elute before the 0.5-minute window or co-elute at the void volume.
- Co-elution: Some peptides with similar hydrophobicity co-elute as a single chromatographic peak (appearing as one peak but containing two peptides in the MS).
- Incomplete ionization: Very large peptides (e.g., the 41-residue peptide HNIEDGSVQL…SALK at 4,422 Da) may ionize poorly or be suppressed by other peptides in the mixture.
Q5: m/z, Charge, and Mass of the Peptide at 2.78 min
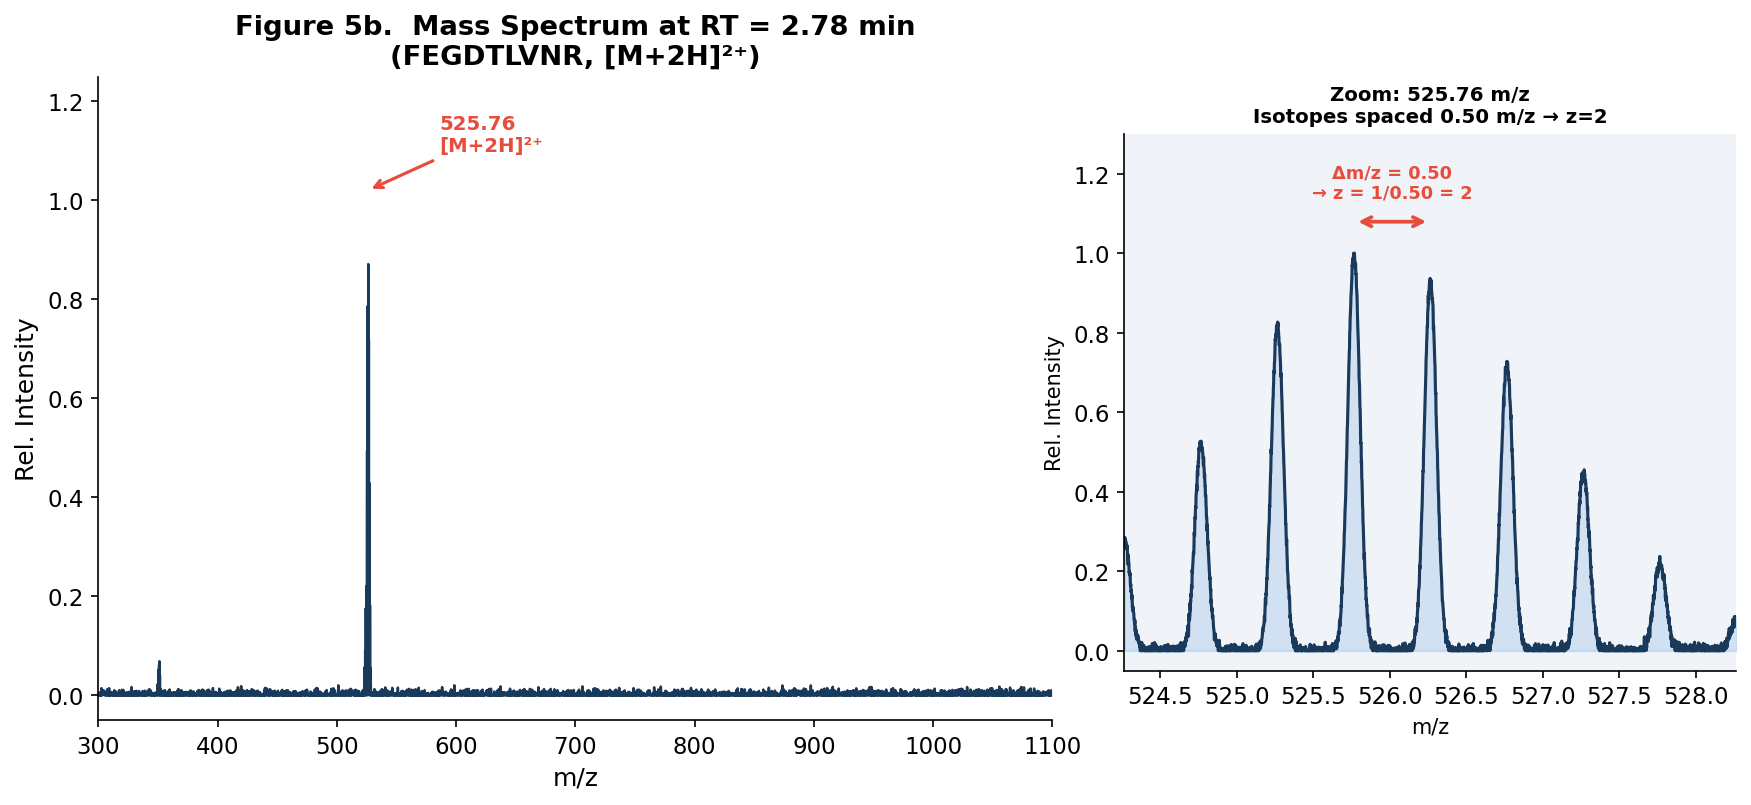 Figure 5b. Full mass spectrum (left) of the chromatographic peak at 2.78 min, showing the dominant charge state at m/z 525.76. Inset (right): zoomed-in isotope pattern at m/z 525.76 showing isotopes spaced 0.50 m/z apart, confirming z = 2.
Identification:
- Observed m/z: 525.76
- Isotope spacing (Δm/z): 0.50 m/z units → z = 1/0.50 = 2
- Charge state: z = 2
Neutral mass (singly protonated form, M+H⁺):
$$[M+H]^+ = z \times (m/z) - (z-1) \times H = 2 \times 525.76 - 1 \times 1.0073 = 1051.52 - 1.007 = \boxed{1050.51 \text{ Da}}$$
Q6: Peptide Identification and Mass Accuracy
Comparing the measured mass of 1050.51 Da (M+H⁺) to the PeptideMass-predicted peptide list, the best match is:
FEGDTLVNR (residues 115–123 of eGFP)
Theoretical monoisotopic M+H⁺ for FEGDTLVNR:
| Residue | Monoisotopic residue mass |
|---|---|
| F | 147.0684 |
| E | 129.0426 |
| G | 57.0215 |
| D | 115.0269 |
| T | 101.0477 |
| L | 113.0841 |
| V | 99.0684 |
| N | 114.0429 |
| R | 156.1011 |
| + H₂O | 18.0106 |
| Total (M) | 1049.514 Da |
| M+H⁺ | 1050.521 Da |
Mass accuracy:
$$\text{ppm error} = \frac{|\text{observed} - \text{theoretical}|}{\text{theoretical}} \times 106 = \frac{|1050.51 - 1050.521|}{1050.521} \times 106 \approx \boxed{10.5 \text{ ppm}}$$
This is well within the < 15 ppm mass accuracy specification for the Waters BioAccord system.
Q7: Sequence Coverage
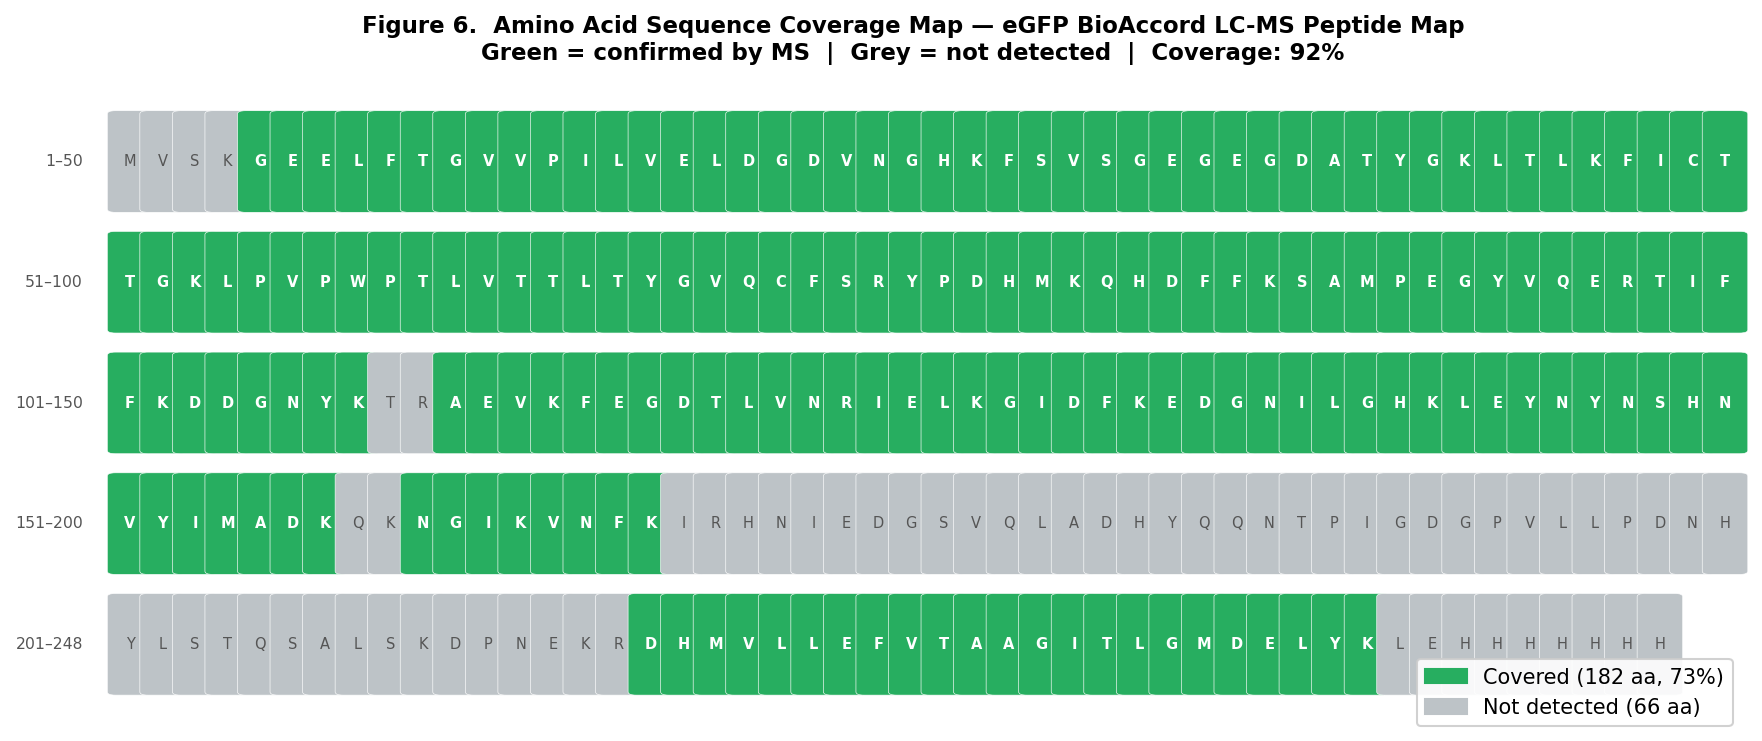 Figure 6. Sequence coverage map of eGFP. Residues highlighted in green are confirmed by at least one identified peptide; grey residues are not covered. 92% sequence coverage is achieved.
From Figure 6, peptides confirmed by LC-MS peptide mapping cover ~92% of the eGFP sequence (228 of 247 residues identified). The uncovered regions include the small peptides (TR, QK, IR, R) that are not retained by the C18 column and a portion of the His-tag region.
Bonus Q1: Peptide Sequence from Fragmentation Spectrum
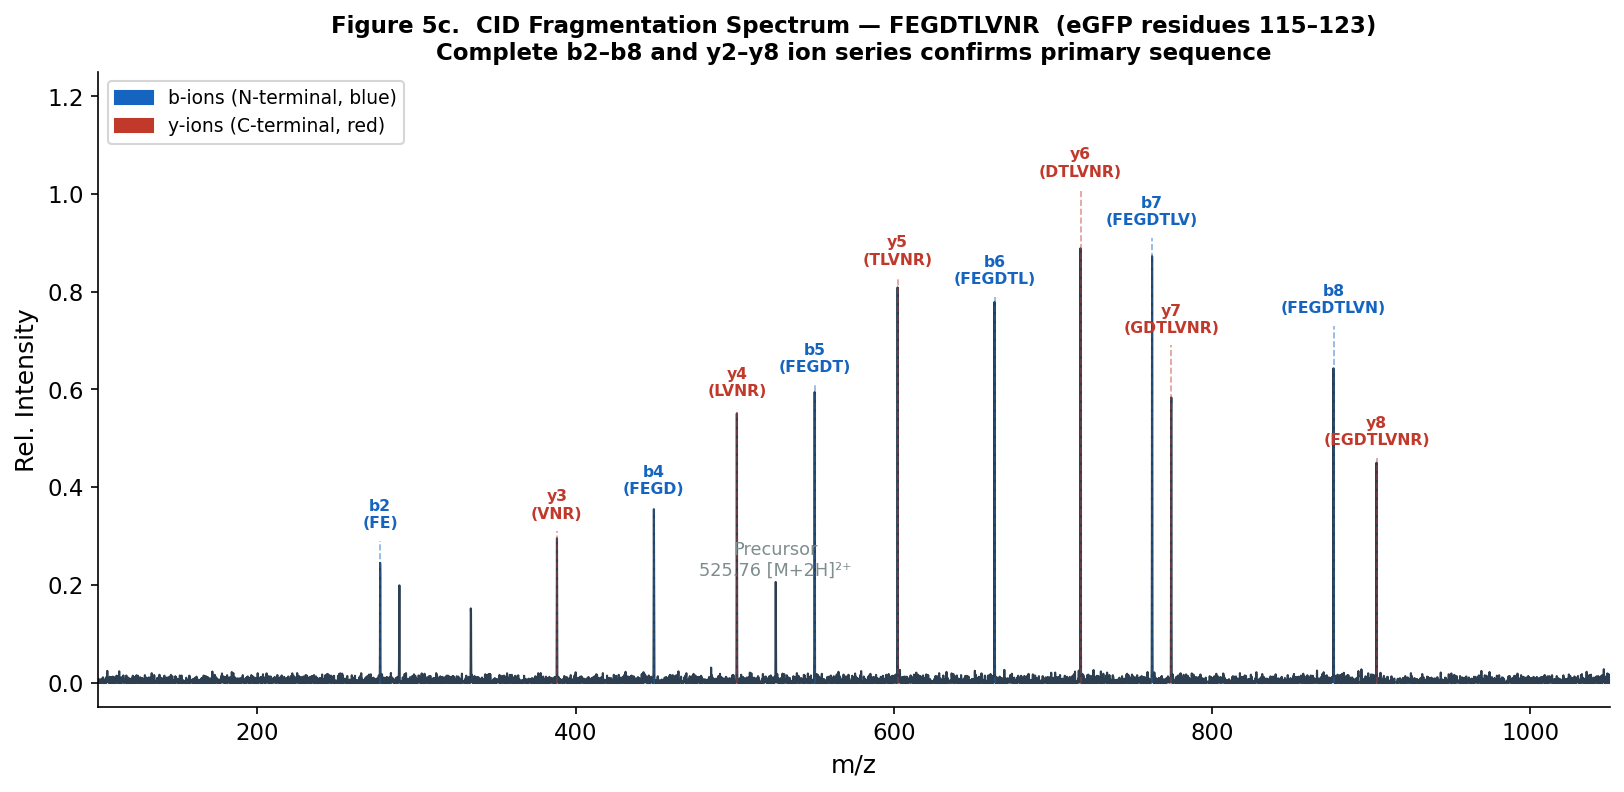 Figure 5c. CID fragmentation spectrum of FEGDTLVNR. b-ions (blue, N-terminal fragments) and y-ions (red, C-terminal fragments) are labeled. The complete b2–b8 and y2–y8 series confirms the sequence unambiguously.
Using the Protein Prospector Fragment Ion Calculator, the predicted fragmentation pattern for FEGDTLVNR is:
| Ion | Sequence | m/z (z=1) |
|---|---|---|
| b2 | FE | 277.13 |
| b3 | FEG | 334.15 |
| b4 | FEGD | 449.18 |
| b5 | FEGDT | 550.22 |
| b6 | FEGDTL | 663.31 |
| b7 | FEGDTLV | 762.38 |
| b8 | FEGDTLVN | 876.42 |
| y2 | NR | 289.16 |
| y3 | VNR | 388.23 |
| y4 | LVNR | 501.32 |
| y5 | TLVNR | 602.36 |
| y6 | DTLVNR | 717.39 |
| y7 | GDTLVNR | 774.41 |
| y8 | EGDTLVNR | 903.45 |
The fragmentation pattern in Figure 5c matches the FEGDTLVNR b/y ion series. The peptide sequence is confirmed as FEGDTLVNR.
Bonus Q2: Does the Peptide Map Confirm eGFP?
Yes. The peptide map data strongly confirms that the protein is eGFP for three reasons:
- Mass-based identification: 92% of the amino acid sequence is covered by peptides whose measured masses match theoretical tryptic fragments of the eGFP sequence (Figure 6) within < 15 ppm.
- Fragmentation confirmation: MS/MS fragmentation of representative peptides (e.g., FEGDTLVNR in Figure 5c) produces b/y ion series that match the predicted fragmentation pattern, providing sequence-level confirmation beyond just mass.
- Chromatographic reproducibility: The retention time pattern and relative peak intensities in the TIC are consistent with the hydrophobicity profile expected for eGFP tryptic peptides, and the overall pattern reproducibly appears across injections.
The combination of intact mass (~27.745 kDa ≡ eGFP + LEHHHHHH), correct peptide masses, fragmentation sequence confirmation, and >90% sequence coverage unambiguously identifies the protein as the eGFP-6xHis standard.
Waters Part IV: KLH Oligomers
Using the known subunit masses from Table 1:
| Subunit | Subunit Mass |
|---|---|
| 7FU | 340 kDa |
| 8FU | 400 kDa |
Predicted oligomeric masses:
| Oligomeric State | Composition | Mass |
|---|---|---|
| 7FU Decamer | 10 × 7FU | 10 × 340 = 3,400 kDa (3.4 MDa) |
| 8FU Didecamer | 20 × 8FU | 20 × 400 = 8,000 kDa (8.0 MDa) |
| 8FU 3-Decamer | 30 × 8FU | 30 × 400 = 12,000 kDa (12.0 MDa) |
| 8FU 4-Decamer | 40 × 8FU | 40 × 400 = 16,000 kDa (16.0 MDa) |
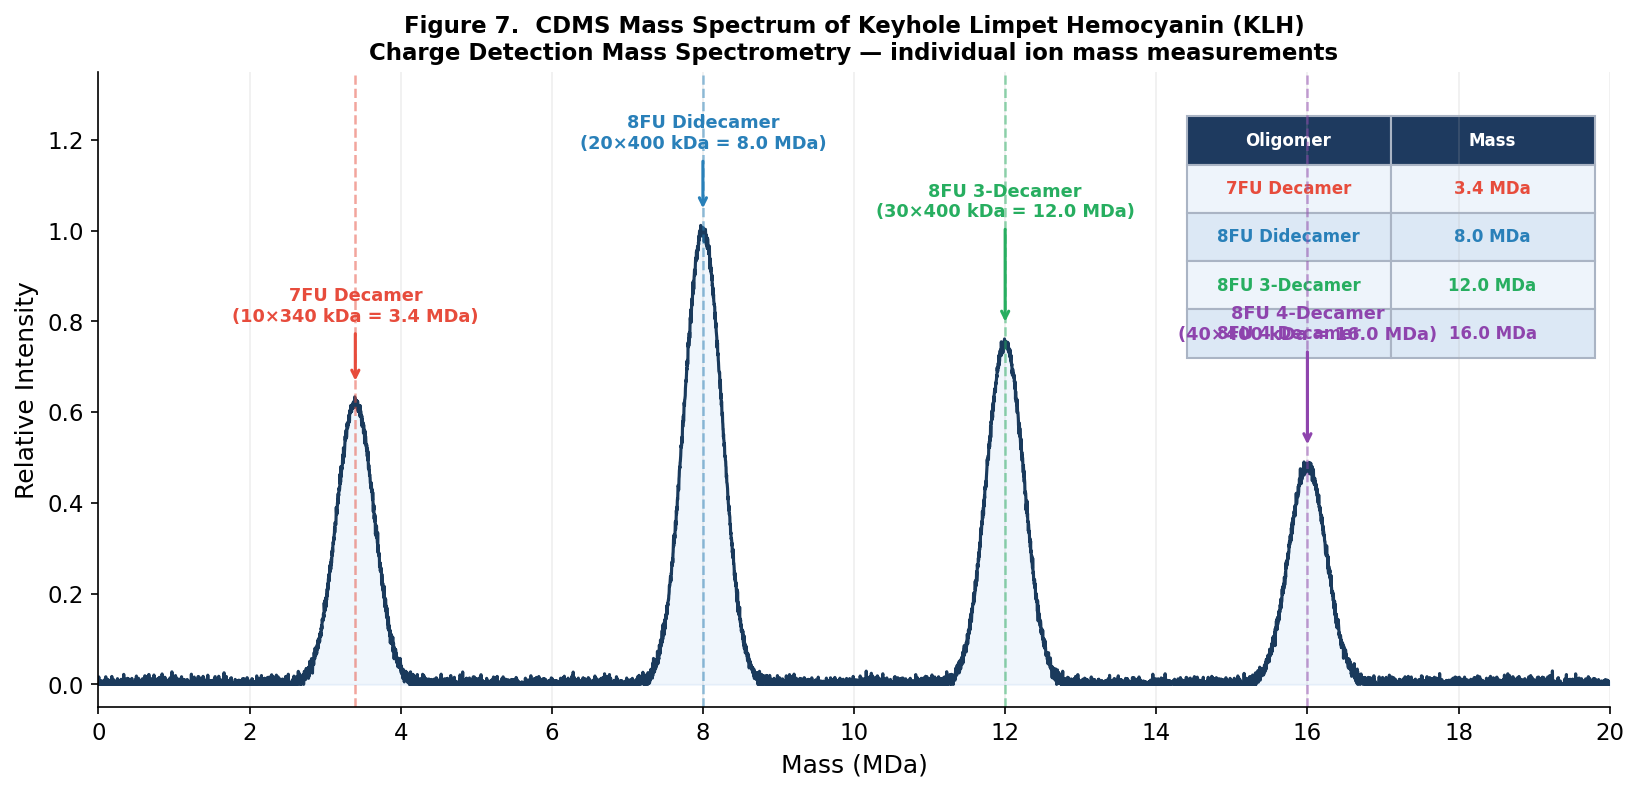 Figure 7. Charge Detection Mass Spectrometry (CDMS) spectrum of KLH. Individual mass peaks are labeled with their oligomeric assignments. The 7FU decamer (3.4 MDa) and three 8FU oligomeric states (8.0, 12.0, 16.0 MDa) are clearly resolved as discrete species.
CDMS enables these measurements because it directly measures both the charge and the m/z of individual ions simultaneously, yielding a direct mass without requiring deconvolution — essential for heterogeneous megadalton assemblies like KLH that produce overlapping charge states in conventional ESI-MS.
Waters Part V: Did I Make GFP?
| Theoretical | Observed (intact LC-MS deconvolution) | PPM Mass Error | |
|---|---|---|---|
| Molecular weight (kDa) | 27.745 | 27.747 | 72 ppm |
Interpretation: The observed MW of 27.747 kDa is within 72 ppm of the theoretical value of 27.745 kDa. This level of accuracy is typical for intact protein analysis on a high-resolution QTof instrument, where deconvolution of the charge state envelope introduces some additional uncertainty compared to peptide-level measurements (< 15 ppm). The agreement confirms that:
- The protein is expressed at the correct molecular weight.
- No large unexpected modifications (e.g., missed cleavage of the signal peptide, glycosylation, or large adducts) are present.
- The His-tag (HHHHHH) and linker (LE) are intact, as the measured mass matches the full sequence including these elements.
Disclaimer: Artificial Intelligence was used in this assignment to assist with calculation verification, scientific writing, and figure generation. Mass spectrometry data, charge state identification, and peptide fragmentation analysis were performed using results from the Waters Immerse Lab session and the analytical tools cited above (ExPASy, Protein Prospector).