Week 10: Imaging and Measurement
Final Project
Aspects of measurement
My final project, “Visible Emotion,” is a cell-free cortisol biosensor that outputs a spatial fluorescence gradient on filter paper. A constitutive T7-LuxI sender produces AHL, which diffuses outward and activates a dual-color receiver array: mVenus (low threshold, yellow) and mScarlet3 (high threshold, red). In Aim 2, the constitutive sender is replaced by a cortisol-responsive circuit: sweat cortisol binds a DNA aptamer, releasing a trigger strand that activates a toehold switch driving LuxI, linking stress level to the color gradient.
1. Spatial fluorescence gradient: Fluorescence intensity of mVenus and mScarlet3 as a function of distance from the AHL source. I will image the substrate with a fluorescence microscope or gel documentation system using YFP and RFP filter sets, then extract radial fluorescence intensity profiles in ImageJ (plot intensity vs. distance to sender spot curve for each channel). This follows the same imaging approach as Basu et al. 2005 (Nature 434, 1130), adapted from living cells on agar to cell-free on paper.
2. AHL diffusion: The diffusion distance determines the spatial extent of the fluorescence gradient. How far detectable fluorescence extends from the sender over time. Time-lapse fluorescence imaging at 1-2 hour intervals over 6-12 hours, measuring the radius of mVenus signal (extends further, low threshold) vs. mScarlet3 signal (confined closer, high threshold) using ImageJ.
3. pLux dose-response curve: Fluorescence output vs. AHL concentration for each receiver construct in 96-well plate format. Serial dilutions of synthetic AHL with known concentration (0 to 10 uM) added to cell-free reactions, measured by plate reader (mVenus: Ex 515/Em 528 nm; mScarlet3: Ex 569/Em 593 nm). This establishes the transfer function to understand at what AHL concentration does each reporter turn on and confirms the two constructs have different activation thresholds and dynamic range.
4. Cortisol cascade activation: Whether cortisol triggers the full aptamer → toehold → LuxI → AHL → receiver cascade. Two-stage plate reader assay: incubate hydrocortisone at varying concentrations with aptamer-toehold-LuxI cell-free reaction, then transfer to a pLux-mVenus receiver reaction. Cortisol dose-dependent mVenus fluorescence confirms the cascade is functional.
5. Protein expression verification: Gel electrophoresis of cell-free reaction products to confirm bands at expected molecular weights compared to a ladder (LuxR ~29 kDa, mVenus ~27 kDa, mScarlet3 ~26 kDa, LuxI ~25 kDa). Fluorescent proteins can also be visualized directly on unstained gels under blue light excitation.
Technologies summary: fluorescence microscopy, ImageJ, fluorescence plate reader, gel electrophoresis, gel documentation system.
Waters Part I — Molecular Weight
1. What is the calculated molecular weight of eGFP?
Unmodified MW: ~28,006.60 Da. With GFP chromophore maturation: the chromophore forms by cyclization of Ser65-Tyr66-Gly67, which loses one water molecule (-18.015 Da) and undergoes oxidation (-2.016 Da), for a net change of -20.031 Da. Predicted MW with chromophore: ~27,986.57 Da.
2. Calculate the molecular weight using the adjacent charge state approach.
I select from the intact LC-MS data:
- $\frac{m}{z_n}$ = 966.0390
- $\frac{m}{z_{n+1}}$ = 933.8391
Determine z for each adjacent pair of peaks (n, n+1):
$$z = \frac{\frac{m}{z_{n+1}}}{\frac{m}{z_n} - \frac{m}{z_{n+1}}}$$
$$z = \frac{933.8391}{966.0390 - 933.8391} = \frac{933.8391}{32.1999} = \textbf{29}$$
The peak at 966.0390 has charge state 29+ and the peak at 933.8391 has charge state 30+.
Calculate MW:
$$MW = z \times \frac{m}{z_n} - z \times 1.008$$
$$MW = 29 \times 966.0390 - 29 \times 1.008 = 28{,}015.13 - 29.23 = \textbf{27,985.9 Da}$$
Calculate the accuracy of the measurement:
$$Accuracy = \frac{|MW_{experiment} - MW_{theory}|}{MW_{theory}}$$
$$Accuracy = \frac{|27985.9 - 27986.6|}{27986.6} = \mathbf{4.29 \times 10^{-5}}$$
In ppm: $4.29 \times 10^{-5} \times 10^{6}$ = ~43 ppm.
3. Can you observe the charge state for the zoomed-in peak?
Yes, the charge state can be determined: 19+ charge state. This can be found by counting from the charge states already determined in Q2, and assigning each successive peak one fewer charge moving to the right, which places the peak at m/z ≈ 1474 at 19+. In the zoomed view, isotope peaks are partially visible but it’s difficult to count the number of peaks and the signal is somewhat noisy at this m/z spacing (1/19 = 0.053 m/z). The instrument’s 30,000 resolution is just sufficient to begin resolving isotope peaks at this charge state (required resolution: 1474/0.053 ≈ 27,800).
Waters Part II — Secondary/Tertiary Structure
1. Explain the difference between native and denatured protein conformations.
When a protein unfolds (denatures), its compact 3D structure opens up into an extended, disordered chain. For eGFP, this means the beta-barrel collapses, the chromophore environment is disrupted, and the protein loses its fluorescence.
In the mass spectrometer, this is detected through the charge state distribution.
- Native (folded): the protein is compact, so fewer surface-accessible sites are available for protonation. It picks up fewer charges per molecule, shifting the charge state envelope to higher m/z values (right side of spectrum). You see fewer, tighter peaks.
- Denatured (unfolded): the protein is extended, exposing more basic residues to protonation. This produces more charges per molecule, shifting the envelope to lower m/z values (left side of spectrum). You see more peaks spread across a broader range.
2. Can you discern the charge state of the peak at ~2800 m/z?
Looking at the zoomed view, the spacing between isotope peaks = $1/z$.
$$z = \frac{1}{2545.2222 - 2545.1304} = \frac{1}{0.0918} \approx \textbf{11}$$
Waters Part III — Peptide Mapping
1. How many Lysines (K) and Arginines (R) are in eGFP?
K = Lysine (20 residues) R = Arginine (6 residues) Total K + R = 26
MVSKGEELFTGVVPILVELDGDVNGHKFSVSGEGEGDATYGKLTLKFICTTGKLPVPWPTLVTTLTYGVQCFSRYPDHMKQHDFFKSAMPEGYVQERTIFFKDDGNYKTRAEVKFEGDTLVNRIELKGIDFKEDGNILGHKLEYNYNSHNVYIMADKQKNGIKVNFKIRHNIEDGSVQLADHYQQNTPIGDGPVLLPDNHYLSTQSALSKDPNEKRDHMVLLEFVTAAGITLGMDELYKLEHHHHHHLysine (K): 20 residues. Arginine (R): 6 residues. Total K + R: 26.
2. How many peptides will be generated from tryptic digestion?
Using the ExPASy PeptideMass tool (https://web.expasy.org/peptide_mass/) with the parameters in Figure 4: 19 peptides
3. How many chromatographic peaks in the eGFP peptide map (Figure 5a)?
Between 0.5 and 6 minutes with >10% relative abundance, approximately 22 peaks
Q4. Does the number of peaks match the predicted peptide count?
There are more peaks (22) than predicted peptides (19). Reasons: missed cleavages produce additional longer peptide species (the expected fragments and the uncut fragment as separate peaks), the chromophore modification creates a mass variant of the peptide containing residues 65-67, and trypsin autolysis fragments contribute additional peaks.
5. Identify the peptide at 2.78 minutes (Figure 5b).
The most abundant peak is at $\frac{m}{z}$ = 525.76712. Looking at the isotope peak spacing in the inset: 526.25918 − 525.76712 = 0.492, so charge $z = 1/0.492$ = 2+.
Calculate the singly charged mass $[M+H]^+$:
$$[M+H]^+ = \frac{m}{z} \times z - 1 \times 1.008$$
$$[M+H]^+ = 525.767 \times 2 - 1 \times 1.008 = 1051.534 - 1.008 = \mathbf{1050.526\ Da}$$
6. Identify the peptide and calculate mass accuracy.
Comparing 1050.526 Da to the predicted tryptic peptide list from the PeptideMass tool, this matches FEGDTLVNR (predicted $[M+H]^+$ = 1050.5214 Da).
$$PPM\ error = \frac{|1050.526 - 1050.521|}{1050.521} \times 10^{6} \approx \mathbf{4.6\ ppm}$$
7. What is the percentage of sequence confirmed by peptide mapping?
88% sequence confirmed by peptide mapping.
Waters Part IV — KLH Oligomers
Identify the oligomeric species on the CDMS spectrum.
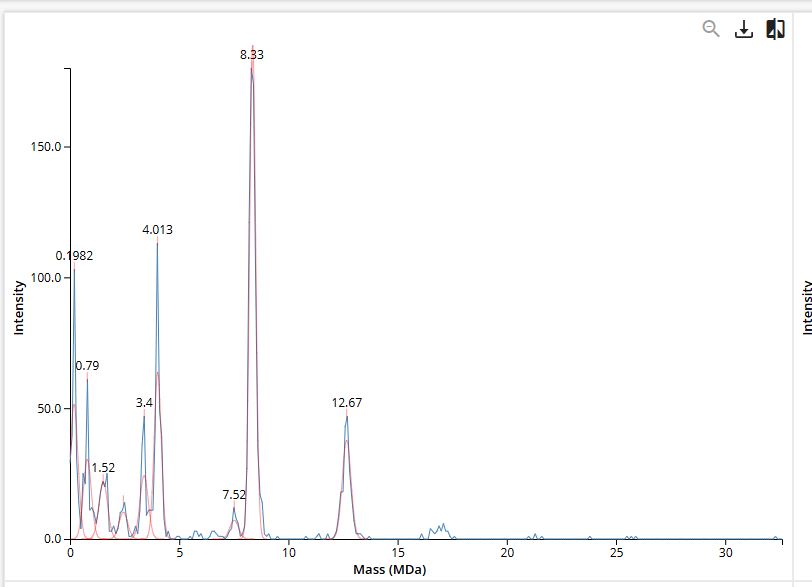
| Oligomeric species | Calculation | Expected mass | Peak on Figure 7 |
|---|---|---|---|
| 7FU Decamer | 10 × 340 kDa | 3,400 kDa (3.4 MDa) | 3.4 MDa |
| 8FU Didecamer | 20 × 400 kDa | 8,000 kDa (8.0 MDa) | 8.33 MDa |
| 8FU 3-Decamer | 30 × 400 kDa | 12,000 kDa (12.0 MDa) | 12.67 MDa |
| 8FU 4-Decamer | 40 × 400 kDa | 16,000 kDa (16.0 MDa) | ~16 MDa |
Waters Part V — Did I Make GFP?
| Theoretical | Observed (intact LC-MS) | PPM Mass Error | |
|---|---|---|---|
| Molecular weight (Da) | 27,986.6 | 27,985.9 | ~43 ppm |