Week 7: Neuromorphic Circuits
IANN Circuit Design
Our group wanted to design a dual region neuromorphic circuit using all three ERNs. The circuit takes two inputs (X1 and X2) and produces mNeonGreen as the fluorescent output, with a bias providing a baseline level of output fluorescent mRNA.
The plasmid composition for each transfection group was as follows:
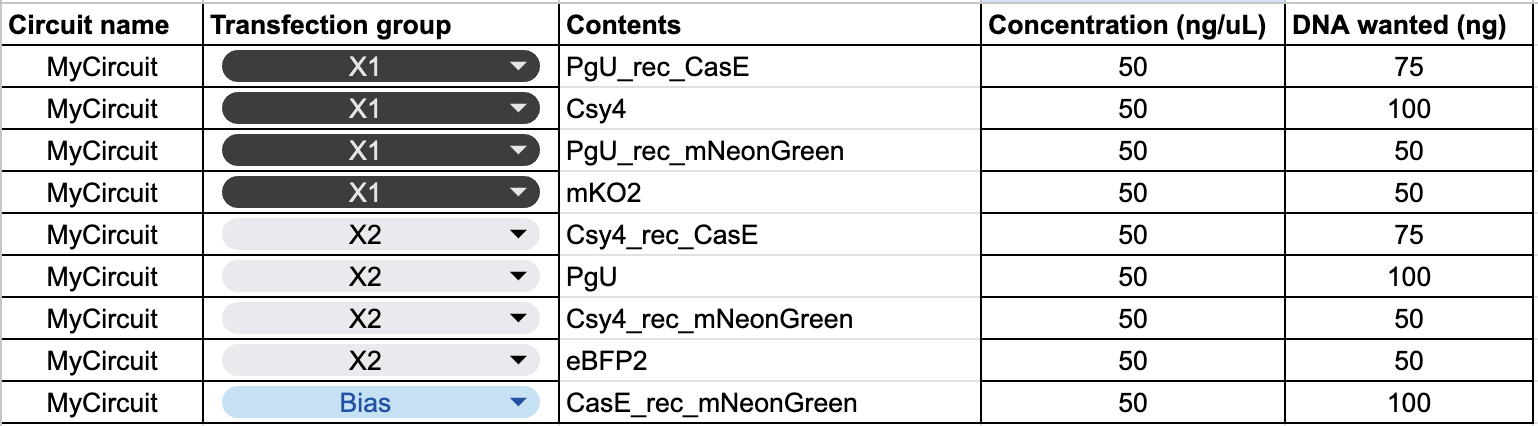
The circuit has three mNeonGreen mRNA sources with different survival conditions:
- PgU_rec_mNeonGreen (from X1) survives when PgU (X2) is low
- Csy4_rec_mNeonGreen (from X2) survives when Csy4 (X1) is low
- CasE_rec_mNeonGreen (Bias) survives when CasE is low, which happens when both X1 and X2 are high and mutually cancel each other’s CasE production
The behavior predicted under different input conditions:
X1 HIGH, X2 LOW: Csy4(from X1) destroys X2’s Csy4_rec_mNeonGreen. PgU is low, so PgU_rec_mNeonGreen from X1 survives. Result: high output.
X2 HIGH, X1 LOW: PgU(from X2) destroys X1’s PgU_rec_mNeonGreen. Csy4 is low, so Csy4_rec_mNeonGreen from X2 survives. Result: high output.
BOTH HIGH: Both direct mNeonGreen sources are destroyed. However, both ERNs also suppress each other’s CasE mRNAs, so CasE levels drop and the bias mRNA survives. Result: moderate output from bias only(will depend on bias level).
BOTH LOW: Little DNA overall, low expression across all components, and no ERN suppression means some CasE still gets made and cleaves the bias. Result: lowest output.
The circuit is therefore behaving as a Dual Region (Top-Left, Bottom-Right) circuit. Output is high when the two inputs are mismatched (one high, one low) and low when they are matched in either direction.
Predicted Output
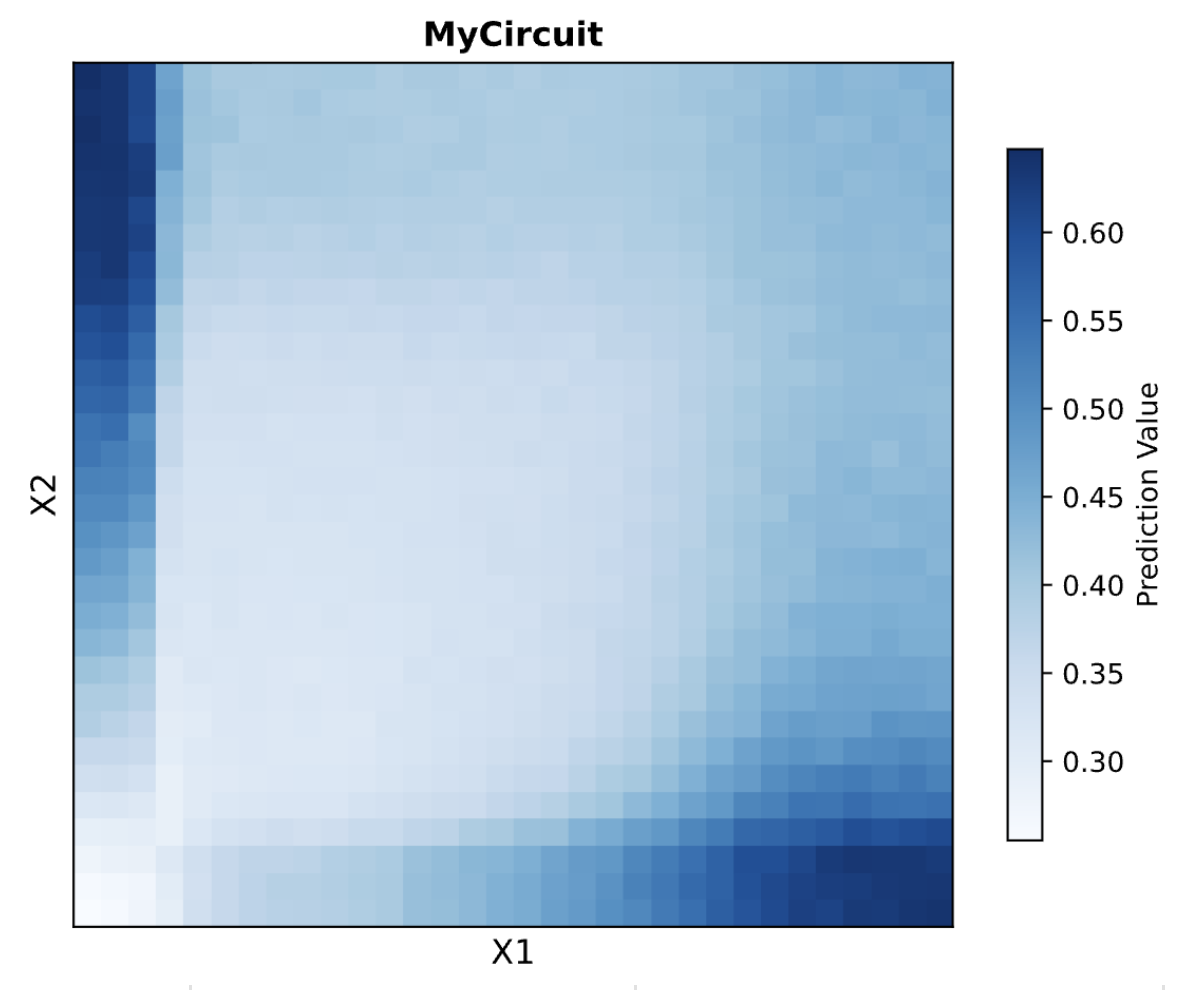
The prediction heatmap shows Dual Region behavior. High output appears in the top-left (X1 low, X2 high) and bottom-right (X1 high, X2 low) corners. The bottom-left (both low) is the minimum, and the top-right (both high) is moderate rather than high, reflecting the partial bias contribution when both ERNs cancel each other.
Experiment Results
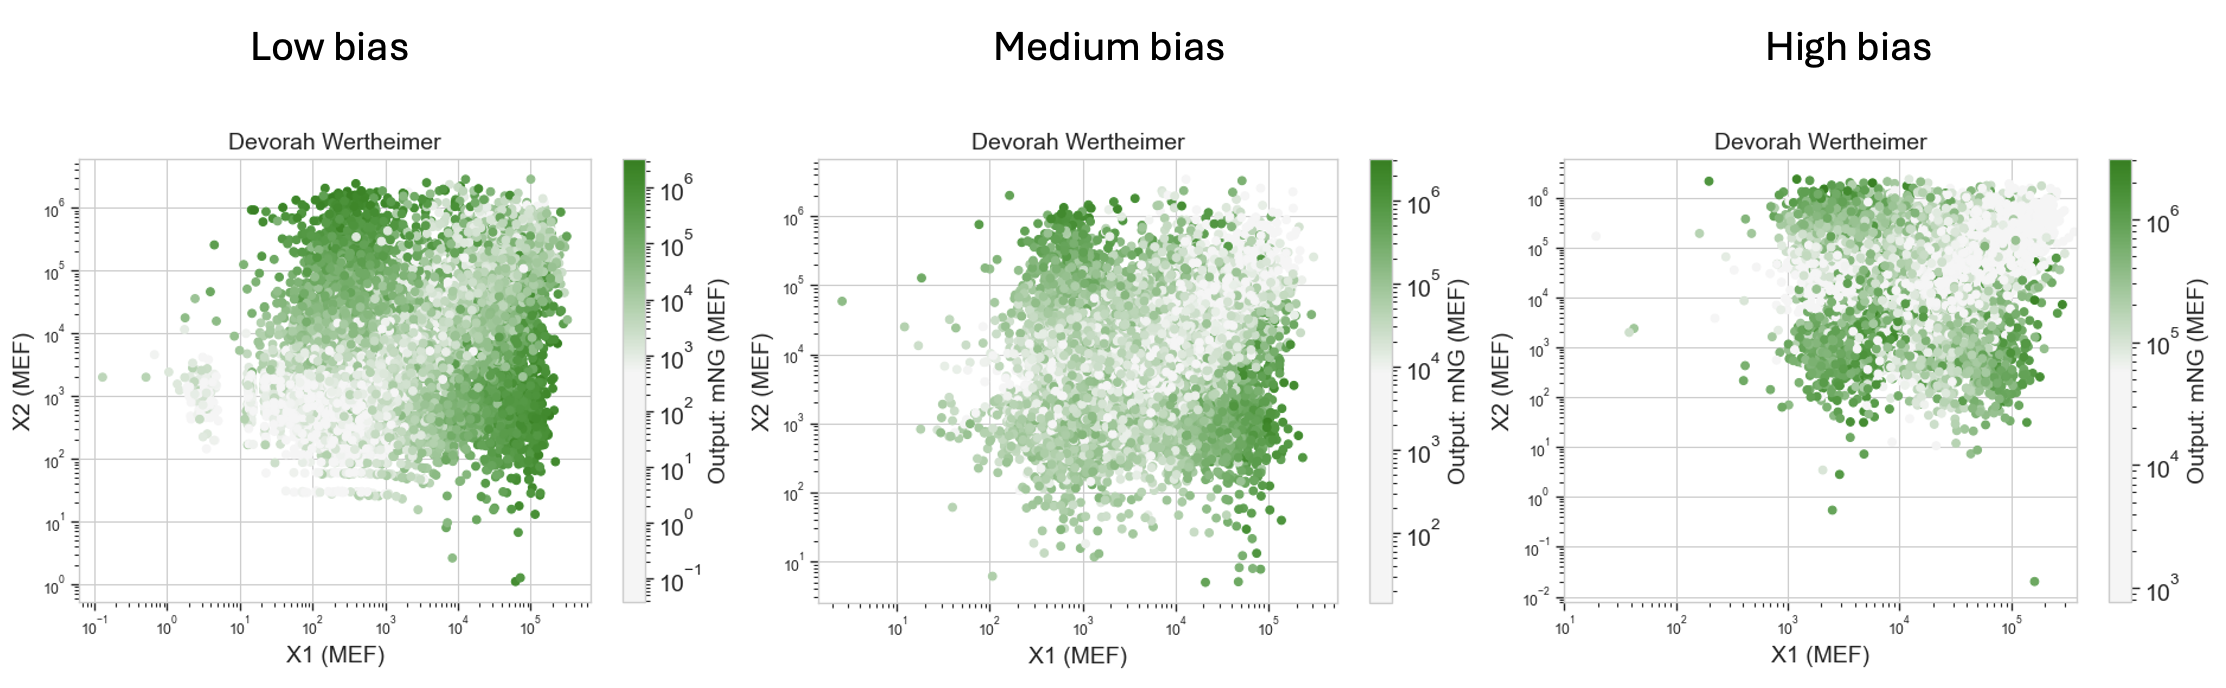
Each dot in the class scatterplots represents a single HEK293 cell. X-axis is X1 input (via mKO2), Y-axis is X2 input (via eBFP2), and dot color is mNeonGreen output intensity. The three panels show results at low, medium, and high bias DNA concentrations.
Low bias: Bright cells concentrate in the mismatched input regions (high X2 + low X1, or high X1 + low X2), consistent with the direct mNeonGreen mRNAs dominating. The pattern is clearly dual-region.
Medium bias: Output spreads more uniformly across the input space and dims overall. The bias is now competing with the direct mNeonGreen sources but not yet dominating, producing a flatter, less structured response.
High bias: The brightest cells shift toward the both-high region (top-right). With so much CasE_rec_mNeonGreen available, the dominant output source is now the bias when both ERNs are high and mutually suppress CasE production.