Individual Final Project
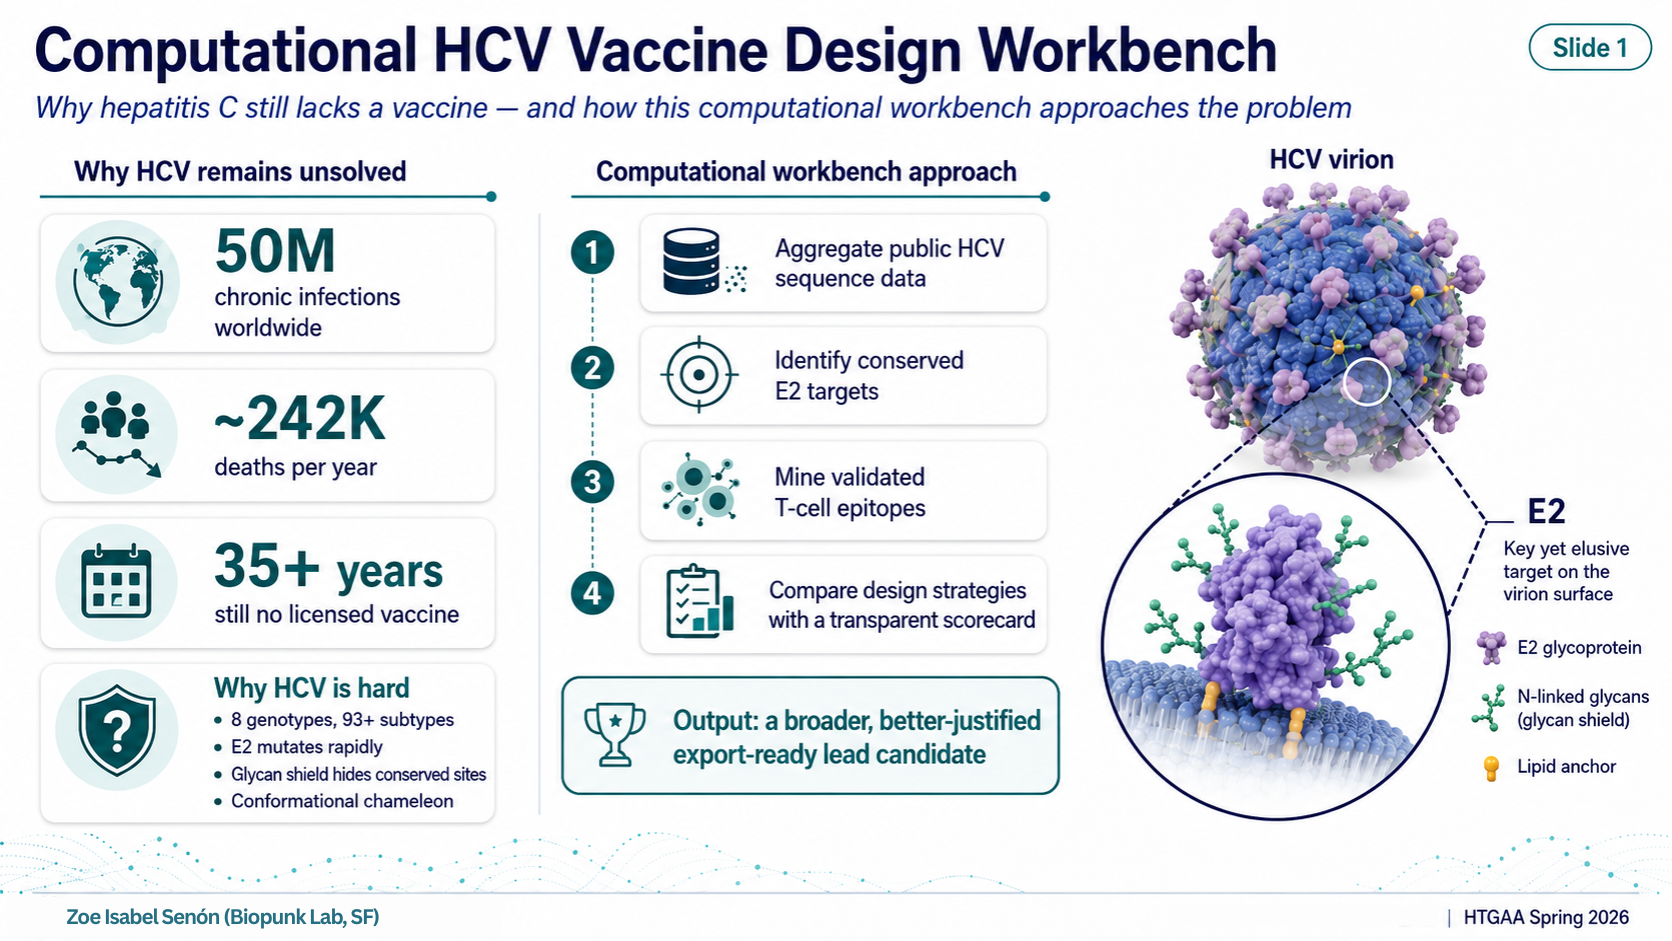
Computational HCV Vaccine Design Workbench
HTGAA Spring 2026 — Final Project
What Is This Project?
In one line: a reproducible workbench that nominates an annotated HCV immunogen construct for future experimental validation.
A fully computational pipeline that collects public hepatitis C virus (HCV) sequence data, identifies the most conserved and immunologically validated regions of the viral envelope, designs a family of candidate immunogens using different strategies, scores each candidate against a transparent multi-criterion rubric, and exports the top-ranked construct as an annotated, codon-optimized DNA and protein sequence ready for experimental testing.
The Problem It Addresses
Hepatitis C virus (HCV) has infected roughly 50 million people worldwide and kills around 242,000 per year (WHO 2024). Despite more than 35 years of research, there is no licensed vaccine.
The core obstacle is the E2 envelope protein — the part of the virus that binds host cells and is the primary antibody target. E2 is a difficult target for three reasons:
Extreme genetic diversity. HCV has 8 confirmed genotypes and 93+ subtypes (ICTV 2026). A vaccine designed against a single reference strain trains the immune system on one variant of a constantly shifting target.
The glycan shield. E2 carries 9–11 N-linked glycosylation sites that act as a molecular camouflage, physically blocking antibody access to the conserved surfaces that would actually be worth targeting.
Conformational instability. E2 adopts different shapes depending on context. Linear sequence-level approaches cannot fully capture the neutralizing epitopes that only exist as three-dimensional structures.
Computational approaches can help by aggregating diversity data, identifying what is conserved despite the variability, and systematically comparing design strategies before committing to synthesis or animal studies.
The Pipeline — 7 Stages
Stage 1 — Sequence Collection
Public HCV E2 protein sequences downloaded from NCBI Virus. A curated panel spanning four genotypes (1a, 1b, 2a, 3a) was assembled, covering an estimated 65–75% of global HCV infections. All sequences are logged in sequence-manifest.tsv with accession numbers and source metadata.
Stage 2 — Multiple Sequence Alignment
All sequences aligned using MAFFT v7, producing a column-level alignment. Alignment quality was verified manually. Output: aligned FASTA, 434 columns.
Stage 3 — Conservation Analysis
Per-position Shannon entropy calculated in Python across all alignment columns. A 15-amino-acid sliding window was used to identify contiguous conserved regions. The most conserved window (positions 297–311, overlapping the CD81 binding loop) reached 99.15% conservation. Mean conservation across all positions: 87.2%.
Stage 4 — Epitope Mining
The Immune Epitope Database (IEDB) was queried for positive T-cell assay results from HCV NS3 and NS5B proteins in human hosts. Results were ranked by a composite score weighting assay count, number of independent publications (PMIDs), HLA type count, and population coverage. Top hits: KLVALGINAV (NS3, 90 assays, 18 PMIDs, HLA-A*02:01), CINGVCWTV (NS3, 57 assays, 17 PMIDs), ALYDVVTKL (NS5B, 4 assays), IMAKNEVFCV (NS5B, 4 assays).
Stage 5 — Construct Design
Five candidate immunogens were designed:
| Design | Strategy | Length |
|---|---|---|
| A — Natural Baseline | Single genotype 1a reference (strain H77) | 420 aa |
| B — Consensus E2 | Statistical consensus of all curated sequences | 434 aa |
| C — Hybrid E2 + T-cell | Consensus E2 fused to 4 validated NS3/NS5B T-cell epitopes | 492 aa |
| D — E2-Ferritin Nanoparticle | Consensus E2 displayed on H. pylori ferritin 24-mer scaffold | 640 aa monomer / ~1.69 MDa particle |
| D-2 — Focused Conserved Mosaic | Only the top conserved E2 windows + T-cell cassette | 97 aa |
Stage 6 — Multi-Criterion Scoring
Each design scored on a 100-point, 6-axis rubric:
| Criterion | Weight | What It Measures |
|---|---|---|
| Genotype Coverage | 25 | Breadth of genotype representation |
| Epitope Conservation | 20 | Per-position amino acid identity at functional sites |
| HLA Coverage | 15 | Population coverage of T-cell epitopes |
| Developability | 15 | Expression feasibility, folding confidence |
| Manufacturability | 15 | Construct length, GC content, synthesis cost |
| Interpretability | 10 | Clarity and communicability of design rationale |
Final scores: A = 45, B = 66, C = 76, D = 68, D-2 = 89.
Stage 7 — Export
Top candidates exported as: codon-optimized DNA FASTA, protein FASTA, construct map, annotations TSV. Design C codon optimization: GC content reduced from 68.6% → 47.6% (into the mRNA synthesis sweet spot of 40–60%).
Tools Used
| Tool | Purpose |
|---|---|
| NCBI Virus | Public HCV E2 sequence retrieval |
| MAFFT v7 | Multiple sequence alignment |
| Python (Biopython, NumPy) | Shannon entropy, sliding window conservation, FASTA handling |
| IEDB (Immune Epitope Database) | T-cell epitope mining and ranking |
| ESMFold | Protein structure confidence prediction (pLDDT scoring) |
| Python codon optimization script | Human codon-usage optimization, GC content balancing |
| Custom scoring framework | 6-axis, 100-point scorecard (documented in design-scorecard.draft.tsv) |
All tools are public and free. The pipeline is fully scripted in Python and re-runnable.
The Lead Nomination — Design D: E2-Ferritin Nanoparticle
Architecture: Consensus E2 (the full 434-residue sequence representing the statistical average across all curated sequences) genetically fused via a flexible (G4S)₃ linker to H. pylori ferritin (UniProt P52093, 167 aa). The monomer is 640 aa and self-assembles into a 24-subunit octahedral nanoparticle of approximately 1.69 MDa.
Why ferritin display matters: Presenting 24 copies of the same antigen on a symmetric scaffold drives B-cell receptor cross-linking — the same signal a real virus surface sends. This mechanism has empirical precedent: Kanekiyo et al. 2013 (Nature 499:102–106) demonstrated approximately a 10-fold increase in neutralizing antibody titers when the influenza HA-stem antigen was displayed on the same H. pylori ferritin scaffold compared to soluble antigen. The scaffold itself is well-characterized and the particle size (~1.69 MDa, ~10–15 nm) is in the range optimal for lymph node trafficking and B-cell engagement.
The scorecard paradox: D-2 scores 89/100 because it is small (97 aa), easy to synthesize, and carries a full T-cell epitope cassette. Design D scores lower because size (640 aa) reduces manufacturability points and the scorecard has no axis for multivalent avidity — that biological multiplier is invisible to sequence-level scoring. The scorecard is a decision-support tool, not an efficacy oracle. It captures what can be computed from sequence. The Kanekiyo precedent captures what biology does with geometry.
The Scorecard Runner-Up — Design D-2: Focused Conserved Mosaic
Design D-2 wins the raw scorecard at 89/100. It is a 97-amino-acid linear construct made entirely of: the two most conserved E2 windows (99.15% and 97.73% conservation respectively) connected by GGGGS linkers, plus the same four-epitope T-cell cassette.
It scores so high because it maximizes conservation efficiency (only top-1% positions included), retains full HLA coverage from the T-cell cassette, and is dramatically cheaper to synthesize than any of the full-length designs.
It does not lead because linear peptides stripped of their structural context rarely elicit neutralizing antibodies. The surfaces that broadly neutralizing antibodies recognize on E2 are conformational — they require the native fold. D-2 is the right candidate for T-cell peptide assays, for cost-limited settings, or for display ON the ferritin scaffold (a combined D+D-2 construct is the highest-priority future design).
Validation — What Was Done Computationally
Sequence-Level Validation
- All accession numbers logged and traceable
- Conservation calculated by Shannon entropy (standard method)
- Top conserved windows cross-referenced against known structural data: positions 297–311 overlap the CD81 binding loop, the target of broadly neutralizing antibodies HEPC3, AR3C, and AR5A (Kong et al. 2013 Science; Flyak et al. 2018 Cell)
Epitope Validation
- All T-cell epitopes sourced from IEDB positive human assays only
- Top epitope KLVALGINAV: 90 independent assays, 18 peer-reviewed publications
- HLA coverage estimated at A02 supertype (~44% US phenotypic coverage per Sidney et al. 2008)
Structure Prediction
- Ferritin scaffold (Design D): ESMFold mean pLDDT 0.937, 91% of residues above 0.9 — high-confidence autonomous folding
- Full E2 consensus: ESMFold pLDDT ~0.3 — low confidence, expected for a disulfide-rich glycoprotein (8+ disulfide bonds and N-linked glycans cannot be modeled by ESMFold). Crystal structures of related strains exist (PDB: 4MWF, 4WEB, 6MEJ) but our consensus sequence has not been structurally characterized
Codon Optimization
- Design C DNA sequence codon-optimized for human expression using human codon frequency tables
- GC content reduced from 68.6% to 47.6%, within the 40–60% mRNA synthesis sweet spot
- Verified for absence of common restriction sites
Limitations — What Was Not Done
- No experimental expression, purification, or binding assay
- No immunization data, no efficacy claim
- E2 structural context not validated for the consensus sequence — conformational epitopes may differ from reference structures
- Genotype 2a is represented by a single sequence; genotypes 4–7 are absent (genotype 4 alone accounts for ~8–17% of global infections, dominant in Egypt and North Africa)
- HLA coverage limited to the A02 supertype; other HLA supertypes not analyzed
- CINGVCWTV Class II MHC presentation not confirmed (9-mer is Class I-typical; IEDB reports 4 HLA types but Class II binding is unverified)
Future Validation Plan
Phase 1 — Expression and Binding (3–6 months)
- Gene-synthesize Design C codon-optimized DNA; express in HEK293 or CHO cells
- Confirm protein by Western blot and size-exclusion chromatography
- Test binding against broadly neutralizing antibody panel: HEPC3 (Flyak et al. 2018), AR3C (Kong et al. 2013), AR5A (Giang et al. 2012), AP33 (Owsianka et al. 2005)
- T-cell ELISpot with HLA-A*02:01 donor PBMCs using D-2 peptides
Phase 2 — Computational Refinement (parallel)
- ColabFold / AlphaFold2 with disulfide constraints for consensus E2 structural prediction
- NetMHCpan 4.1 and NetMHCIIpan 4.1 for HLA coverage beyond the A02 supertype
- Expand genotype panel to include genotypes 4–7
- Design the combined candidate: conserved E2 windows (D-2) displayed on the ferritin nanoparticle (D) with T-cell cassette in the SpyTag/(G4S)₃ linker
Phase 3 — In Vivo Testing (aspirational)
- Head-to-head mouse immunization: Designs C, D, and the combined candidate
- HCVcc / HCVpp neutralization assays, epitope mapping, durability assessment