I am a Biomedical Engineer from Lima, Peru, which means I grew up eating ceviche, watching the Pacific Ocean, and somehow ended up spending my days extracting polymers from shrimp shells and squid ink sacks. Full circle.
Currently, I conduct most of my research in the Polymer and Bionanomaterials Laboratory of my university, where I helped establish protocols for the synthesis of a plethora of biomaterials, specifically those of local origin and specially the ones that come from the sea, which lends itself perfectly with the high biodiversity of my own country. These polymers are then applied to the fabrication of composite films, hydrogels, triboelectric nanogenerators and much more.
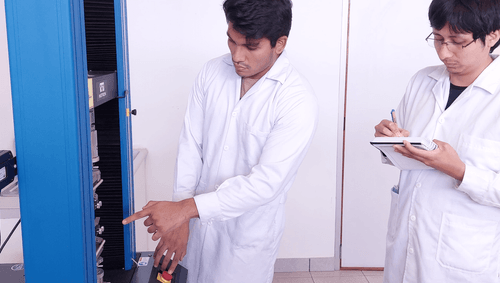
At the POLYCOM lab, PUCP/UPCH, Lima 🇵🇪
I am drawn to biomanufacturing because I believe the most interesting materials on Earth are already being made, just not by us; by fungi, molluscs, and organisms that have had a 500-million-year head start on us. I believe our job is to catch up, borrow their ideas, and scale them up responsibly.
Outside the lab I am learning German, looking up Master’s and PhD programs, and trying to get my 10000 steps in everyday. I joined HTBAA because I want to understand how biological manufacturing actually works at scale, not just in theory, but in an applied sense.
I look forward to finding out more about the world of biomanufacturing and carrying over that knowledge to my own research!
See the nav bar on the left to look through my work for How To
Biomanufacture Almost Anything (Fall 2026)!
Subsections of ARMANDO FLÓREZ TRONCOS — HTBAA Fall 2026
Week 1 HW: Final Project Ideas
A Dosidicus gigas (Humboldt squid / “pota”) ejecting ink into the Pacific Ocean. The ink's primary pigment, eumelanin, is the raw material characterized in my undergraduate thesis, and the starting point of this biomanufacturing project.
HOMEWORK #1
1. What do you want to make, and why?
I am looking to find the most efficient way to biomanufacture melanin nanoparticles (MNPs), specifically eumelanin, and use them as a functional UV-absorbing ingredient for a more natural and effective sunscreen that reutilizes a form of biomatter that is not only very common but often overlooked in the Peruvian context.
Peru has been in the middle of a public health crisis that has, ironically, been overshadowed by the current political climate. The UV index values have been reaching higher and higher levels each year, up to 18 in highland cities like Marcapomacocha, Junin [1]. Essentially, most major Peruvian cities sit in “extremely high” UV levels year-round [2]. The consequences are very real and are not met with a proportionally prepared healthcare system. Between 2021 and 2023, Peru’s Ministry of Health registered more than 3,500 cases of skin cancer [3]. Affordable, effective photoprotection is not a luxury product here, it is a public health need.
Global Solar UV Index world map — daily maximum UV under clear skies.
Melanin is our own way to combat the power of the sun, one that has been developed through years of evolution. This biopolymer is a broadband UV absorber, a free radical scavenger, an antimicrobial, anti-oxidant and more importantly, has shown to be an effective repellent of skin cancer [4][5]. My undergraduate thesis characterized melanin nanoparticles extracted from the ink of Dosidicus gigas (Peruvian giant squid, Humbolt squid also locally called “pota”) and confirmed its UV-absorbing and antioxidant properties. However, the next step is to find a way to manufacture these particles into an efficient and convenient product that is affordable and easy to use for the population. My approach, even if it’s a low-cost option, would be difficult to translate to a high scale production, however I found that there are other ways to produce a high yield of eumelanin. The one I want to focus on here is the engineering of a microbial cell factory that gives us a reliable amount of high-quality eumelanin.
2. What living system could make it?
Escherichia coli is going to be the choice for this project. It is probably the most well-known bacteria for research and has a fully annotated aromatic amino acid biosynthesis pathway. It also is able to be used to reach a well-established industrial fermentation system with high cell density exceeding 100 g/ L dry cell weight. Specifically for the melanin synthesis system, the annotation of its aromatic amino acid biosynthesis pathways facilitates targeted engineering, and its mechanism of feedback inhibition release is well established and applied [6].
Melanogenesis pathway from glucose to eumelanin in recombinant E. coli, showing the two-phase fermentation strategy and key enzymatic steps.
The main component for this process would be tyrosinase, an enzyme that catalyzes the oxidative conversion of L-tyrosine to dopaquinone and onward through the melanogenesis cascade to eumelanin. Chávez-Béjar et al. (2013) reported the most important early benchmark for this project: by expressing the MutmelA tyrosinase from Rhizobium etli and overexpressing feedback-resistant aroGfbr to boost L-tyrosine flux, their strain VH33MGTR reached 3.22 g/L eumelanin in a 120 h fed-batch bioreactor using glucose as the sole carbon source [7]. Their two-phase production strategy, growing cells at 32 °C first, then triggering melanogenesis at stationary phase by adding CuSO₄ (Cu²⁺ is an essential tyrosinase cofactor) and reducing temperature to 30 °C, decouples biomass accumulation from pigment production and is directly relevant to our process design.
An alternative enzymatic strategy uses 4-hydroxyphenylpyruvate dioxygenase (HPPD), which routes homogentisate toward pyomelanin rather than eumelanin. Lee et al. (2022) achieved 3.76 g/L in recombinant E. coli expressing HPPD from Flavobacterium kingsejongi, and the wild-type F. kingsejongi itself reached 6.07 g/L — the highest reported titer from a natural melanogen [8]. For our sunscreen application the tyrosinase/eumelanin route is preferable because eumelanin has the broader UV-absorption spectrum [4][5], but the HPPD yields demonstrate that titer space above 3 g/L is accessible in E. coli.
A further advance directly relevant to downstream processing comes from Kong et al. (2024), who engineered E. coli MG1655 to not only synthesize melanin but to secrete it as exosomes (~191 nm nanoparticles) upon Cu²⁺/tyrosine induction [9]. This extracellular secretion eliminates one of the more laborious steps in classical melanin production, cell lysis and pigment extraction, and the particle size of ~191 nm falls within the nanoparticle range already associated with good skin penetration and UV-scattering performance in sunscreen formulations [4][5].
3. How would you automate its production?
I would focus in applying a two-way process including combinatorial strain screening and manufacturing-scale fermentation.
Automation strategy: combinatorial 96-well screening with the Opentrons OT-2 (left) feeding optimized parameters into industrial fed-batch bioreactor production (right).
At the strain-development stage, the Opentrons OT-2 liquid-handling robot can run 96-well plate assays in parallel, varying parameters like CuSO₄ concentration (Zou et al. 2025 showed 30 mg/L is as effective as 50 mg/L, with less copper toxicity to the host [10]), induction timing, carbon source concentration (optimal at 5 g/L glucose in flask conditions [10]), and aroGfbr expression level. Melanin output from each well is quantifiable by absorbance at 400 nm, making high-throughput screening straightforward without specialized equipment. This mirrors how the HTBAA course has used OT-2 for combinatorial biology tasks [11].
At manufacturing scale, the process maps directly onto standard fed-batch bioreactor operation. The two-phase strategy described by Chávez-Béjar et al. [7], automated pH control, dissolved oxygen monitoring, glucose feed control, and a programmed CuSO₄ injection trigger at the onset of stationary phase, is implementable in any instrumented bioreactor with a programmable logic controller. Cloud laboratory platforms such as Strateos or Ginkgo Bioworks provide robotic bioreactor execution with remote protocol deployment, enabling iterative design-build-test-learn cycles without requiring hands-on fermentation time at each iteration [11].
Downstream, melanin is recovered from the broth by acid precipitation (lowering pH to approximately 2 using a HCl solution), centrifugation, washing, and drying, a process compatible with continuous centrifuge systems at scale. If the Kong et al. secretion strain [9] is used, the melanin-laden exosomes are already in the supernatant, and cell removal by centrifugation or cross-flow filtration becomes the primary separation step, skipping lysis entirely.
4. How much do you need, and how long will it take?
I would say that given that the main target population, at least currently, are around 35 million people that live in Peru and are constantly exposed to the highly dangerous UV levels. As a first viable proof-of-concept deployment, I will estimate serving 1,000 people, a pilot group small enough to run as a controlled study, large enough to generate statistically meaningful SPF performance and skin tolerance data before scaling further.
A clinically meaningful sunscreen requires an active ingredient with real UV-absorbing mass. Using the formulation parameters from Alcalá-Alcalá et al. (2023), who demonstrated SPF > 30 protection with 1% w/w melanin nanoparticle inclusion in a cream base, and assuming a standard 30 mL daily application of a cream at ~200 mg/mL density, each person uses approximately 60 mg of MNPs per day [12].
Scaling to 1,000 users over one year:
graph LR
    A["1,000 persons × 0.060 g/day × 365 days"] --> B["21.9 kg eumelanin / year"]
Using the 3.22 g/L titer established by Chávez-Béjar et al. in their optimized bioreactor [7], a single 10,000 L production fermentor yields around 32.2 kg per batch, meaning the entire annual supply for the pilot group is covered by less than one batch. Even at the 100 L pilot-bioreactor scale typical of university or startup facilities, one batch yields 322 g, so roughly 68 pilot-scale runs would cover the year’s demand.
This makes the pilot entirely feasible without industrial infrastructure. If strain engineering pushes titers toward the 5.58–7.57 g/L range reported in flask conditions by Zou et al. (2025) using autonomous tyrosine biosynthesis [10], cost per gram drops by 70–73% [10], making the economics of a pilot study even more accessible. Regulatory testing for SPF performance, by in vitro testing with the Mansur equation or the ISO 24444 human testing standard, and a DIGEMID (General Directorate of Medicines, Supplies, and Drugs) review in Peru would add from 12 to 24 months to the timeline before a commercial launch [13][14]. A realistic timeline from strain finalization to pilot deployment is around 2 years, with the first 12 months dedicated to strain optimization and formulation characterization.
5. What don’t you know yet?
There are a few concerns that I would like to address beforehand. First off, in a biological sense, the relationship between fermentation conditions and nanoparticle size distribution is not that predictable. Kong et al. showed that E. coli can secrete melanin particles averaging ~191 nm [9], but particle size in a sunscreen formulation affects both SPF performance and skin penetration depth and the size of the MNP obtained by a glucose-fed fermentation have not been extensively mapped. There are some ways I could find some referential results, like using a skin-like replacement, pig skin for example, and testing the amount of UV absorption both before and after the application of the cream. The test could also be used to evaluate both the tyrosinase route and the HPPD route and determine which one has a superior SPF.
Another issue I am not particularly familiar with is the legal and regulatory pathway in Peru. DIGEMID doesn’t have that much experience with genetically modified organisms so while the required testing can be achieved in a university laboratory setting, the approval timeline and the question of whether GMO-derived melanin needs a different dossier from chemically identical melanin extracted from squid ink are genuinely open questions that will determine the commercial feasibility of the whole project.
[4] Narayanan, S., Kurian, N. K., & Bhat, S. G. (2020). Ultra-small pyomelanin nanogranules abiotically derived from bacteria-secreted homogentisic acid show potential applications in inflammation and cancer. BioNanoScience, 10(1), 191–203.
[5] Mavridi-Printezi, A., Guernelli, M., Menichetti, A., & Montalti, M. (2020). Bio-applications of multifunctional melanin nanoparticles: From nanomedicine to nanocosmetics. Nanomaterials, 10(11), 2276.
[6] Zou, L., Liu, J., Hu, Y., Zhao, Y., & Liu, X. (2025). Cost-effective melanin production using engineered Escherichia coli with autonomous tyrosine biosynthesis. Journal of Biotechnology, 408, 151–157. https://doi.org/10.1016/j.jbiotec.2025.09.009
[7] Chávez-Béjar, M. I., Lara, A. R., López, H., Hernández-Chávez, G., Rahman, A., Martínez, A., Bolívar, F., & Gosset, G. (2013). Metabolic engineering of Escherichia coli to optimize melanin synthesis from glucose. Microbial Cell Factories, 12, 108. https://doi.org/10.1186/1475-2859-12-108
[8] Lee, H. S., Choi, J. Y., Kwon, S. J., Park, E. S., Oh, B. M., Kim, J. H., & Lee, P. C. (2022). Melanin biopolymer synthesis using a new melanogenic strain of Flavobacterium kingsejongi and a recombinant strain of Escherichia coli expressing 4-hydroxyphenylpyruvate dioxygenase from F. kingsejongi. Microbial Cell Factories, 21, 75. https://doi.org/10.1186/s12934-022-01800-w
[9] Kong, X., Zhang, J., Li, Y., Liu, Y., Zhang, Y., Ye, C., & Wang, H. (2024). Genetically modified E. coli secreting melanin (E.melanin) activates the astrocytic PSAP-GPR37L1 pathway and mitigates the pathogenesis of Parkinson’s disease. Journal of Nanobiotechnology, 22, 690. https://doi.org/10.1186/s12951-024-02955-x
[10] Zou, L., Liu, J., Hu, Y., Zhao, Y., & Liu, X. (2025). Cost-effective melanin production using engineered Escherichia coli with autonomous tyrosine biosynthesis. Journal of Biotechnology, 408, 151–157. https://doi.org/10.1016/j.jbiotec.2025.09.009
[11] Thieme, A., Renwick, S., Marschmann, M., Guimaraes, P. I., Weissenborn, S., & Clifton, J. (2024). Deep integration of low-cost liquid handling robots in an industrial pharmaceutical development environment. SLAS Technology, 29(5), 100180. https://doi.org/10.1016/j.slast.2024.100180
[12] Alcalá-Alcalá, S., Llánes-Bernabe, A., Figueroa-González, G., Fabila-Bustos, D. A., Villegas-Álvarez, F., Borbolla-Jiménez, F. V., Leyva-Gómez, G., & Del Prado-Audelo, M. L. (2023). Recombinant melanin nanoparticles as potential ingredients of photoprotective formulations. Polymers, 15(10), 2381. https://doi.org/10.3390/polym15102381
[13] Sayre, R. M., Agin, P. P., LeVee, G. J., & Marlowe, E. (1979). A comparison of in vivo and in vitro testing of sunscreening formulas. Photochemistry and Photobiology, 29(3), 559–566. https://doi.org/10.1111/j.1751-1097.1979.tb07098.x
*AI assistance: Used Claude Sonnet 4.6 (Anthropic) to aid in the arragement. Prompt: " Rearrange the citations, including those I have used in my thesis bibliography and the new sources I recently found”.
Week 2 HW: DNA Design
HOMEWORK #2
In Homework #1 I proposed biomanufacturing eumelanin in engineered E. coli as the active ingredient for an affordable sunscreen, and I argued from a published benchmark that reached 3.22 g/L of eumelanin from glucose [7]. That was a proposal at the level of strategy. This assignment takes it down to the level of bases.
What follows is a complete expression module: two enzymes, seven parts, one plasmid of 6963 bp. Building it turned up three things that a purely literature-level reading had hidden — the record strain carries more genes than I credited it with, the mutation the paper names does not exist at the residue it names, and the tyrosinase carries a targeting signal I had claimed it did not have. Each of those is documented below where it arises, because they changed the design rather than merely decorating it.
Part 1: Define your expression target
What molecule am I expressing? Not one protein but two enzymes, forming the minimal module of the melanogenesis pathway from central metabolism:
Enzyme
Role in the pathway
1
Feedback-resistant DAHP synthase (AroGfbr)
Catalyses the first committed step of the common aromatic pathway, condensing PEP and E4P. Relieving its feedback inhibition is what pushes carbon toward L-tyrosine.
2
Tyrosinase MutMelA (EC 1.14.18.1)
Hydroxylates L-tyrosine to L-DOPA and oxidises it to dopaquinone. Polymerisation to eumelanin from there is non-enzymatic.
The tyrosinase: what “MutmelA” actually is
melA comes from Rhizobium etli CFN42, carried on the symbiotic plasmid p42d (protein_id AAM54973.1, plasmid NC_004041) [15].
Chávez-Béjar et al. used a variant they call MutmelA, described as MelA carrying a single nucleotide change replacing Asp535 by Gly [7]. When I retrieved the deposited sequence and translated it, the open reading frame turned out to be 1512 nt encoding 503 amino acids. There is no residue 535.
The most probable explanation, and one that is internally consistent, is that the paper numbers from the start of the cloned fragment rather than from the start codon. The database record carries 318 nt upstream of the ATG, in frame and without stop codons; read from nucleotide 1, that frame gives a 609-residue reading in which position 535 is indeed an aspartate, and it maps to Asp429 of the real protein. The surrounding context is identical in both readings (ADTPVTDPHYVGS), and the change is a single base, GAT→GGT, exactly as described.
That is an inference, not a confirmation. A randomly placed offset would land on an aspartate about 7 % of the time, so the coincidence is meaningful but not proof. I therefore use wild-type melA, which the source itself justifies: the authors state that melanin production begins earlier with the mutant, but that the rate of synthesis is the same with either version [7]. For a first expression module, an unverifiable one-base change that alters only onset timing is not worth carrying.
The tyrosinase carries a Tat signal peptide
Translating the CDS also contradicted something I asserted in my own plan. The protein begins:
MSITRRHVIVQGGVIAAGLLASGLPGTKAFAQ | IPSIPWRR...
This is a textbook twin-arginine (Tat) signal peptide: the arginine pair at positions 5–6, a hydrophobic core, and an AxA cleavage site at A29–F30–A31.
Signal peptide
residues 1–31 · CDS nt 1–93
Mature protein
residues 32–503 (472 aa) · CDS from nt 94
I had written that no signal peptide was included. Cloning the full CDS includes one. Cabrera-Valladares et al. report that the recombinant tyrosinase was expressed intracellularly in E. coli and purified from cell extract [15], which suggests E. coli’s Tat machinery does not efficiently recognise the rhizobial signal — but “I did not include one” and “I included one that appears not to be used” are different claims, and only the second is true.
I keep the native signal peptide, for two reasons. It is what the reference work expressed, so it is the version behind the published titres. And it converts an open question in Part 6 into a testable hypothesis: a functional Tat signal would export folded tyrosinase to the periplasm, which is a concrete candidate answer to where melanin precursors polymerise.
The DAHP synthase
aroGfbr derives from E. coli K-12 aroG, locus b0754 (UniProt P0AB91, protein_id AAC73841.1, RefSeq NP_415275.1). The CDS is 1053 nt encoding 350 aa.
The feedback-resistant allele I selected is D146N. I verified against the deposited sequence that residue 146 is indeed aspartate and that nucleotides 436–438 are GAT, in exact frame with codon 146, so the substitution is a single G→A at nucleotide 436.
This is my choice rather than an inherited one, and worth flagging as such: Chávez-Béjar et al. carried aroGfbr on plasmid pRW300 and never state which mutation it bears [7]. D146N is the best-documented variant for tyrosine overproduction [16]; S180F, P150L and L175D are alternatives I did not pursue.
Host and localisation
Host:E. coli, as proposed in HW1. One host constraint propagates into the whole process design: MelA is rapidly inactivated at 37 °C, so melanin-producing cultures must run at 30–32 °C, a temperature that is not optimal for E. coli growth [7].
Localisation: cytoplasmic expression, with the caveat above that the native CDS carries a Tat signal whose behaviour in E. coli is unresolved. How melanin precursors leave the cell, and whether they polymerise in the periplasm, the medium, or both, is not established in the literature [7]; Part 6 returns to it, because it decides the downstream recovery strategy.
Part 2: Design your genetic parts
Seven parts. Every sequence below is the one actually registered in Kernel.
The seven parts in 5'→3' order: one promoter, two ribosome binding sites, two coding sequences, one terminator, one backbone. A single Ptrc drives both cistrons, so the two coding sequences are transcribed onto one mRNA and the terminator closes the operon.
IPTG-inducible hybrid trp/lac promoter from pTrc99A [17]; the same promoter that drove the tyrosinase in the reference process, induced at 0.1 mM IPTG [7].
I verified its internal structure rather than trusting the label, and two of the checks mattered:
Element
Position
Result
−35 TTGACA
14–19
✅
Spacer between −35 and −10
20–36
17 bp — confirms trc, not tac (which has 16)
−10 TATAAT
37–42
✅
lac operator (lacO1)
47–69
✅ — IPTG induction is real
Shine-Dalgarno
—
absent
The last row is the consequential one: this promoter part carries no ribosome binding site. The final 22 bp after the operator are 5′ UTR containing a SalI site, not an RBS. Each cistron therefore has to supply its own.
2. RBS1 — ribosome binding site (17 bp)
AAAGAGGAGAAATACTA
Built on the BBa_B0034 Shine-Dalgarno core (AAAGAGGAGAAA, the Elowitz RBS, defined as relative efficiency 1.0 in the iGEM Registry) [22], extended with a TACTA spacer.
This substitutes for the native pTrc99A RBS, because the promoter part carries none. The substitution is an improvement rather than a compromise: both cistrons now initiate from characterised parts with published relative strengths, which is exactly what the variant series proposed in Part 6 requires.
B0034 alone would not have worked. Its SD (AGGAG) sits at positions 5–9, leaving only AAA — a 3 nt spacer — before the start codon. The added TACTA brings the spacing to 8 nt, within the 6–8 nt window, and I verified that no spurious ATG is created and that the first ATG in the junction is aroG’s own.
Derived from Registry part BBa_K1060000, which I confirmed base-for-base to be wild-type E. coli aroG, by a single G→A substitution at nucleotide 436. Codon 146 changes from GAT (Asp) to AAT (Asn), and the protein region reads AAGEFLNMITPQY instead of AAGEFLDMITPQY.
Placed as the first cistron deliberately: flux has to exist before the tyrosinase has anything to consume.
This edit is easy to skip, and skipping it is invisible. My first assembled construct still carried wild-type aroG — Kernel had matched my pasted sequence to BBa_K1060000, which is itself the signal that the substitution had never been applied. Without it, AroG remains phenylalanine-inhibited and the entire flux argument collapses while the plasmid map looks perfectly correct.
4. RBS2 — ribosome binding site (17 bp)
AAAGAGGAGAAATACTA
Same construction as RBS1, placed 8 nt upstream of the melA start codon.
This is the primary tuning parameter of the design, for the reason given in Part 6: the downstream cistron carries the catalytic enzyme, and the known bottleneck is tyrosinase capacity rather than tyrosine supply.
Wild-type tyrosinase from R. etli CFN42 (AAM54973.1), for the reasons set out in Part 1. Requires Cu²⁺ as cofactor — which is what makes cofactor-level control of the production phase possible. Residues 1–31 are the Tat signal peptide.
One practical note for anyone reproducing this: the ENA record for AAM54973.1 returns 1830 nt, including 318 nt upstream of the start codon. The sequence above is trimmed to the CDS. Pasting the raw record would register 318 nt of non-coding sequence as part of a CDS.
6. Terminator — BBa_K3763043 (28 bp)
AGAAGGCCATCCTGACGGATGGCCTTTT
I checked that it is a real intrinsic terminator rather than a label: AGGCCATCC is the exact reverse complement of GGATGGCCT, so the sequence folds into a stem-loop, and it ends in a T-rich tail. Both features of a Rho-independent terminator are present.
7. pACYC184 — backbone (4245 bp)
GenBank X06403. Sequence not reproduced here for length; import the GenBank record rather than pasting raw sequence, so the origin and resistance genes arrive annotated.
p15A origin, low-to-medium copy number, chloramphenicol marker. Used as the tyrosinase backbone in the reference work, and its p15A origin is compatible with ColE1 plasmids, so tyrC and pheACM can be added later on a second plasmid without redesigning this one — which is precisely the upgrade path from this module to the record strain. I verified after assembly that both the tetracycline and chloramphenicol resistance genes are present and intact.
Architecture
A single Ptrc driving a bicistronic operon, rather than two independent cassettes. The original authors set this precedent themselves, transcribing tyrC and pheACM as an operon from one trc promoter [7].
The reason one promoter suffices is the most interesting design point here: the two-phase production strategy is not transcriptional control, it is cofactor control. Both genes are induced together with IPTG, but tyrosinase is synthesised as an inactive apoenzyme because Cu²⁺ is absent from the medium. Adding CuSO₄ (20 µg/mL) at mid-exponential phase activates the enzyme already present and permits de novo synthesis of active enzyme [7].
This matters because tyrosinase activity during growth depletes intracellular L-tyrosine and cripples the cell: strain W3110MG failed to grow at all in minimal medium lacking supplemented tyrosine when copper was present from the start [7]. Decoupling growth from production therefore requires no second inducible promoter — only withholding a metal ion.
Verification performed on the assembled sequence. I checked these computationally rather than by eye:
Reading frame intact across both CDSs, each with its own start and stop codon — they are independent cistrons, not a translational fusion. aroG: 1053 nt → 350 aa, stop TAA. melA: 1512 nt → 503 aa, stop TAA.
No accidental internal stop codons in either cistron.
Shine-Dalgarno to start-codon spacing of 8 nt on both ribosome binding sites.
No premature terminator between the cistrons.
Residue 146 of AroG reads N, confirming the feedback-resistance substitution survived assembly.
Backbone length exactly 4245 bp with both resistance genes intact, confirming the vector imported without truncation.
The insert (everything but the backbone) is 2718 bp, or about 2.7 kb.
The assembled construct, 6963 bp. The expression cassette occupies the first 2718 bp and the pACYC184 backbone the remaining 4245 bp — a length I used as a check that the vector imported without truncation.
Part 4: Optimize and quality-check
Codon optimization
The two coding sequences call for opposite decisions, and that contrast is itself the useful result.
aroGfbr is already an E. coli gene expressed in E. coli, so optimization has essentially nothing to act on. Re-coding it would also make it harder to distinguish from the chromosomal copy in the sequence search below. I left it native. Measured GC: 52.1 %.
melA is the gene that genuinely needs it. R. etli is a GC-rich alphaproteobacterium, and the measured GC content of the native CDS is 59.5 % — already at the top of the 40–60 % window, and higher locally.
Constraints applied: GC held within 40–60 %, avoidance of long GC runs and of predicted secondary structure near the ribosome binding site, and removal of restriction sites that clash with the assembly junctions. On that last point I had to correct my own plan: I had intended to remove BamHI, SspI and EcoRV sites, but neither CDS contains any. The sites that actually exist are PstI at nt 124 and 1426 of melA, and SalI at nt 826 of melA — the latter mattering because the Ptrc part carries a SalI site of its own at position 76.
Sequence search (BLAST)
Expected and observed: aroGfbr returns a near-identical match to native E. coli aroG differing at a single codon, which independently confirms the D146N substitution landed where intended. After codon optimization, melA diverges substantially from the R. etli gene at the nucleotide level while the translated protein remains identical — so the meaningful check here is protein-level rather than nucleotide-level identity. The CDS is a re-coded natural gene, not a novel sequence.
Safety screen
I expected a clean report, and the expectation is worth justifying rather than assuming. Neither enzyme is toxin-related: tyrosinase is a pigment-forming monophenol oxidase, and DAHP synthase is a primary-metabolism enzyme present in E. coli’s own genome. R. etli is a nitrogen-fixing plant symbiont, not a pathogen. The most plausible flag would be a generic hit on the antibiotic resistance markers in the backbone, which is expected of any cloning vector and is not a hazard of the design.
Simulation
Worth stating what a simulation of this construct can and cannot settle. A genetic-circuit simulator models transcription and translation from promoter and RBS strengths, so it can speak to the relative expression of the two cistrons — which is exactly the Part 6 question about RBS2. It does not model allosteric feedback inhibition, aromatic amino acid flux, copper-dependent apoenzyme activation, or non-enzymatic polymerisation. It would therefore show no difference between aroGfbr and wild-type aroG, which is precisely why the sequence-level verification in Part 3 was the check that mattered.
Transcription. RNAP flux holds constant at ~0.4 from Ptrc across both coding sequences and drops to zero at the terminator, and only a single transcript species is produced. Both results confirm the operon is wired as intended: one promoter, one polycistronic mRNA, a terminator that actually terminates, and no transcription into the backbone.Translation. Ribosome flux is zero on the promoter, terminator and backbone and non-zero only on the two ribosome binding sites and their coding sequences, and both proteins reach steady state within ~2–3 h and hold through 72 h. Flux is identical on both cistrons (~0.233), giving a 1:1 protein ratio — but since both ribosome binding sites carry the same sequence, that equality may follow by construction rather than by prediction if the model assigns initiation rate from RBS strength alone, without accounting for position within the operon.
Part 5: From design to build
How would I build it? The insert is ~2.7 kb with two coding sequences plus regulatory parts — a natural fit for Gibson assembly from three or four synthetic fragments carrying 20–40 bp overlaps, assembled into linearised pACYC184 in a single isothermal reaction [19]. This is a real improvement over the route the original authors had to take, which chained SspI, BamHI, BstZ17I and EcoRV digestions across several subcloning steps to reach the equivalent plasmid [7]. Collapsing that serial restriction-and-ligation process into one reaction is precisely what the method was developed for.
What does synthesis constrain? The difficult fragment is melA, for the same measured reason it needed codon optimization: 59.5 % GC, originating from a GC-rich genome, and GC-rich structured sequences are where de novo synthesis errors concentrate. Error correction is therefore not optional here. Protein-mediated mismatch error correction, using mismatch-binding proteins to remove erroneous duplexes from synthesized pools, substantially reduces error frequency and is what makes it realistic to order a difficult fragment as synthetic DNA rather than screening clone by clone for a correct one [20]. Codon optimization helps twice over, since breaking up GC runs makes the fragment easier to synthesize as well as easier to translate.
Prototype vs. scale. These diverge sharply, mirroring the two-scale automation argument from HW1. To build one construct and test whether it works, column-synthesized fragments plus Gibson assembly is cheapest and fastest. But the automation plan I proposed in HW1 is a combinatorial screen across RBS strength, induction timing and CuSO₄ concentration on the OT-2, and that is a library, not a construct. Producing hundreds of RBS and promoter variants by individual column synthesis is economically absurd; synthesizing them as oligo pools on high-fidelity microchips and recovering subsets by selective amplification is what brings per-sequence cost down to where a combinatorial screen is affordable [21]. So: one construct by Gibson, the variant library by chip-synthesized pools.
Part 6: What don’t you know yet?
1. Is the ribosome binding site on the second cistron strong enough? In a bicistronic operon the downstream gene is typically expressed at a lower level, and here the downstream gene is the catalytic one. The reference data indicate this is the wrong direction in which to err: strain VH33MGTR accumulated roughly 4 g/L of L-tyrosine alongside its 3.22 g/L of melanin, meaning tyrosine synthesis was outrunning tyrosinase capacity, and the authors identify increasing tyrosinase activity as the route to improvement [7]. An underpowered RBS2 would deepen a bottleneck that already exists.
How I would find out: build a variant series on the same B0034 SD core, varying only the spacer length, and screen in 96-well plates reading absorbance at 400 nm (one OD400 unit corresponds to 0.066 g/L eumelanin [7]). Select for the highest ratio of melanin to residual extracellular tyrosine. Swapping gene order is a variant worth including.
Variant
Sequence
Spacer
v2
AAAGAGGAGAAATA
5 nt
v3
AAAGAGGAGAAATAC
6 nt
v4
AAAGAGGAGAAATACT
7 nt
v5
AAAGAGGAGAAATACTA
8 nt (current)
v6
AAAGAGGAGAAATACTAG
9 nt
v7
AAAGAGGAGAAATACTAGA
10 nt
I verified for all six that no spurious ATG is introduced and that the first start codon in each junction remains melA’s own.
2. Will MelA fold and stay active in E. coli at production temperature? It is a copper-dependent enzyme from a mesophilic alphaproteobacterium, already known to inactivate rapidly at 37 °C [7]. Expression level and folding are separate questions from catalytic activity, and a 59.5 % GC heterologous CDS is a plausible candidate for misfolding. How I would find out: a Cu-supplemented plate assay for visible pigment as the functional readout, paired with soluble-versus-insoluble fractionation on SDS-PAGE to check whether the protein partitions into inclusion bodies. If it does, the design variants to try are a weaker RBS2, lower cultivation temperature, or a solubility tag.
3. Does the Tat signal peptide actually export the tyrosinase, and does that determine where the melanin ends up? This question did not exist in my plan until I translated the CDS and found the twin-arginine signal described in Part 1. Whether precursors polymerise in the periplasm, the extracellular medium, or both is unresolved in the literature [7], and a functional Tat signal is a concrete mechanistic candidate: Tat exports folded proteins, so a periplasmic tyrosinase would make the periplasm the site of conversion. Against that, Cabrera-Valladares et al. purified the recombinant enzyme from cell extract [15], suggesting the rhizobial signal is poorly recognised by E. coli.
This is not an academic question for this project. It determines whether recovery is acid precipitation from clarified supernatant or something requiring cell lysis, and it connects directly to the secretion-route question I raised in HW1 [9] — including the LPS problem, since anything recovered as membrane vesicles carries endotoxin on its surface by construction.
How I would find out: fractionate a production culture into supernatant, periplasmic wash and cell pellet, and quantify A400 in each across a time course. Run it in parallel against a signal-peptide-deleted variant (CDS starting at nt 94 with an added ATG) — if the fractionation profiles are identical, the signal is not being used, and that is a clean answer either way.
References
[7] Chávez-Béjar, M. I., Balderas-Hernandez, V. E., Gutiérrez-Alejandre, A., Martinez, A., Bolívar, F., & Gosset, G. (2013). Metabolic engineering of Escherichia coli to optimize melanin synthesis from glucose. Microbial Cell Factories, 12, 108. https://doi.org/10.1186/1475-2859-12-108
[9] Kong, X., Zhang, J., Li, Y., Liu, Y., Zhang, Y., Ye, C., & Wang, H. (2024). Genetically modified E. coli secreting melanin (E.melanin) activates the astrocytic PSAP-GPR37L1 pathway and mitigates the pathogenesis of Parkinson’s disease. Journal of Nanobiotechnology, 22, 690. https://doi.org/10.1186/s12951-024-02955-x
[15] Cabrera-Valladares, N., Martinez, A., Piñero, S., Lagunas-Muñoz, V. H., Tinoco, R., de Anda, R., Vázquez-Duhalt, R., Bolívar, F., & Gosset, G. (2006). Expression of the melA gene from Rhizobium etli CFN42 in Escherichia coli and characterization of the encoded tyrosinase. Enzyme and Microbial Technology, 38(6), 772–779. https://doi.org/10.1016/j.enzmictec.2005.08.004
[16] Lütke-Eversloh, T., & Stephanopoulos, G. (2007). L-tyrosine production by deregulated strains of Escherichia coli. Applied Microbiology and Biotechnology, 75, 103–110. https://doi.org/10.1007/s00253-006-0792-9
[17] Amann, E., Ochs, B., & Abel, K. J. (1988). Tightly regulated tac promoter vectors useful for the expression of unfused and fused proteins in Escherichia coli. Gene, 69(2), 301–315. https://doi.org/10.1016/0378-1119(88)90440-4
[19] Gibson, D. G., Young, L., Chuang, R.-Y., Venter, J. C., Hutchison, C. A., & Smith, H. O. (2009). Enzymatic assembly of DNA molecules up to several hundred kilobases. Nature Methods, 6, 343–345. https://doi.org/10.1038/nmeth.1318
[20] Carr, P. A., Park, J. S., Lee, Y.-J., Yu, T., Zhang, S., & Jacobson, J. M. (2004). Protein-mediated error correction for de novo DNA synthesis. Nucleic Acids Research, 32(20), e162. https://doi.org/10.1093/nar/gnh160
[21] Kosuri, S., Eroshenko, N., LeProust, E. M., Super, M., Way, J., Li, J. B., & Church, G. M. (2010). Scalable gene synthesis by selective amplification of DNA pools from high-fidelity microchips. Nature Biotechnology, 28, 1295–1299. https://doi.org/10.1038/nbt.1716
Week 3 HW: Cell-Free Reaction Design
HOMEWORK #3
A. Compare cell-free reaction compositions
1. Why do potassium glutamate and magnesium glutamate concentrations differ between compositions, and which is more sensitive?
They differ because the two ions do different jobs, and only one of them is coupled to the energy system.
Potassium sets bulk ionic strength. K⁺ is the dominant monovalent cation of the E. coli cytoplasm, and glutamate is its dominant counter-ion; the pairing was chosen originally to mimic that environment rather than to hit a sharp catalytic optimum. Because its role is to establish an ionic background compatible with translation, the response surface around it is broad, and formulations can sit anywhere across a wide band without collapsing.
Magnesium is a structural and catalytic cofactor. Mg²⁺ holds the ribosomal subunits together, stabilises tRNA tertiary structure, and is required by the polymerases. It is also the ion the rest of the reaction competes for: NTPs, PEP and inorganic phosphate all chelate Mg²⁺, so the free Mg²⁺ concentration — the quantity that actually matters — is not the amount you pipetted. Too little and ribosomes dissociate; too much and translational fidelity drops and subunits over-associate.
Magnesium is far more sensitive, and the six reference plates for this coopetition show it directly:
Range across the six plates
Spread
Spread as % of minimum
K(Glu)
200 – 345 mM
145 mM
72 %
Mg(Glu)₂
8.22 – 10.1 mM
1.88 mM
23 %
Five of the six plates sit at exactly 8.22 mM magnesium regardless of protein or energy system, while potassium is tuned freely between 200 and 345 mM. In absolute terms the magnesium window is roughly seventy-seven times narrower. The same pattern appears in the published formulations: PANOx-SP uses 130 mM K(Glu) and the related PANOx formulation 200 mM — a 70 mM difference nobody treats as important — while magnesium moves only a few mM between them.
Olsen et al. (2026) make the mechanism explicit: in their low-cost system, new optimum magnesium and phosphate concentrations had to be determined for each lysate concentration and each new lysate batch [2]. Magnesium and phosphate re-optimise together precisely because phosphate sequesters Mg²⁺. Potassium is not described as needing that treatment.
Practical consequence for this assignment: magnesium is the parameter not to improvise on. I kept it at the consensus 8.22 mM in two of my three designs and moved it only where the reference data itself showed a protein-specific optimum.
2. How does a PEP+NTP formulation differ from a Ribose+NMP formulation?
They differ in where the phosphate bond energy comes from, and that one choice cascades through the whole recipe.
PEP + NTP is the direct route. You supply the nucleotides already triphosphorylated (ATP 1.25 mM, CTP/GTP/UTP 0.875 mM each in these plates) and supply phosphoenolpyruvate as a high-energy phosphate donor. Pyruvate kinase in the lysate transfers phosphate from PEP onto ADP to regenerate ATP. It is fast and it works, which is why PANOx-SP has been the field’s reference for twenty years.
Its problem is cost and chemistry. PEP is the single most expensive line item in a classical formulation — Olsen et al. report it accounted for roughly 75 % of all material costs [2]. And every phosphoryl transfer releases inorganic phosphate, which accumulates, chelates Mg²⁺ and eventually stalls the reaction, which is part of why PEP systems are short-lived.
Ribose + NMP pushes the work back onto the lysate’s own metabolism. You supply the cheap monophosphates (AMP, CMP, GMP, UMP) plus ribose as a carbon and energy substrate, and let endogenous central metabolism and the nucleotide salvage pathways phosphorylate them up to triphosphates and regenerate ATP. Inorganic phosphate is supplied deliberately (15 mM in the sfGFP and PETase ribose plates) rather than accumulating as waste.
The knock-on effects are visible across the whole column of the reference plates. The ribose formulations drop PEP, all four NTPs, folinic acid, CoA, NAD, putrescine and oxalic acid entirely. In place of NAD ($33/mL) they add nicotinamide at 4 mM — the cheap precursor, letting the lysate build the cofactor itself. They raise amino acids from 2 to 5 mM and HEPES from 57.5 to 75 mM, because a reaction that now runs its own metabolism needs more buffering and more substrate. Olsen et al. push the same logic further, showing GMP can be replaced by guanine plus ribose with no yield penalty, and UMP by its base plus ribose at reduced yield [2].
The trade-off is not uniform across proteins, and this is the most useful thing in the reference data:
Protein
PEP yield
Ribose yield
PEP advantage
sfGFP
0.61 g/L
0.46 g/L
1.33 ×
PETase
314.6 µM
274.8 µM
1.14 ×
Reteplase
10.9 µM
0.81 µM
13.46 ×
For the two easy proteins the cheap system costs you 14–25 % of yield, which a large cost saving will easily outrun. For Reteplase it costs you more than 92 % of the yield. No plausible reagent saving recovers a 13-fold loss, so the energy-system choice is effectively made for you by the folding difficulty of the target.
3. Comparison of two published formulations
PANOx-SP (Jewett & Swartz 2004) [3] versus RF_opt (Olsen et al. 2026) [2].
PANOx-SP
RF_opt
Components
~20
12
Energy substrate
33 mM PEP
No PEP — NMPs + ribose + phosphate
Nucleotides
1.2 mM ATP; 0.85 mM each GTP, UTP, CTP
Nucleoside monophosphates
Salts
130 mM K(Glu), 10 mM NH₄(Glu), 12 mM Mg(Glu)₂
K(Glu), Mg(Glu)₂ — re-optimised per lysate batch
Buffer
57 mM HEPES pH 7.2
HEPES (pH 7.5 under oxidising conditions)
Amino acids
2 mM each of 20
20 standard amino acids
Cofactors
0.33 mM NAD, 0.27 mM CoA, 34 µg/mL folinic acid, 170 µg/mL tRNA
Dropped
Polyamines
1.5 mM spermidine, 1 mM putrescine
Spermidine retained
Other
4 mM sodium oxalate
Phosphate; GSSG/GSH and iodoacetamide for oxidising work
Extract
27 % v/v
—
Cost
> $4,000 / L
$143 / L
Cost per gram
~$4,080 / g (implied)
~$60 / g at 15 µL; ~$39 / g at 4 mL with oxygen
The headline is a reported 95 % average cost reduction [2]. What is striking is where it comes from: not from a cleverer version of the same recipe but from deleting most of it. PANOx-SP supplies finished high-energy intermediates and purified cofactors; RF_opt supplies cheap precursors and lets the lysate’s surviving metabolism assemble them. The entire cofactor block — NAD, CoA, folinic acid, tRNA — disappears, and the single most expensive component, PEP, is removed outright.
The cost is reproducibility. RF_opt is reported to be more sensitive to how much lysate is added than PANOx-SP is, and magnesium and phosphate must be re-optimised for every new lysate [2]. That is the real trade: PANOx-SP buys robustness by overpaying for finished reagents.
Where the money actually is in this assignment
One observation worth stating, because it changes what is worth optimising here. The brief notes that lysate is typically the largest single expense in CFPS. In this coopetition it is fixed at 5,000 nL and cannot be modified, so it is a constant, not a variable:
Volume
Cost
Lysate (fixed)
5,000 nL @ $4.00/mL
$0.0200
CTP + GTP + UTP
525 nL @ ~$35/mL
$0.0184
CoA
100 nL @ $104/mL
$0.0104
NAD
75 nL @ $33/mL
$0.0025
Those four reagents together
700 nL
$0.0312
The nucleotides and cofactors in a PEP-type plate cost about 1.6 × the lysate, in one twentieth of the volume. Since the lysate cannot be touched, the entire optimisation space is the 11,000 nL of variable reagents — and within it, a handful of nucleotides and cofactors dominate. That is what makes the NMP substitution the main lever rather than a refinement.
B. Reaction composition designs
Design strategy
Each design anchors on the better-performing reference plate for that protein and makes a small number of directed changes, rather than proposing a composition from scratch. Three reasons:
The reference plates were actually run, so they are known to be feasible and known to produce protein. A design that is a small perturbation of a working plate is far more likely to return interpretable data than one assembled from first principles.
With one shot per protein in this round, a design that changes many variables at once cannot be attributed if it wins or loses. Few, well-separated changes give a readable result.
Each change is checked against the plate’s spare volume (the water row), so feasibility is verifiable rather than assumed.
Why the ribose system at all. sfGFP loses only 25 % of yield on the cheap formulation while shedding PEP, all four NTPs, CoA, NAD, folinic acid, putrescine and oxalic acid. Cost per gram is cost per reaction divided by yield, so a reagent saving well above 25 % wins. sfGFP has no disulfides and folds robustly, so it is the target least likely to be hurt.
Why drop potassium to 273 mM. 345 mM is the highest potassium of any of the six plates; sfGFP’s own PEP plate runs at 280 mM and PETase Ribose at 300 mM. Since the potassium optimum is broad (A1), this tests whether the ribose plate was simply above its optimum, and it frees 1.6 µL of volume. 273 mM is not an arbitrary number — it is the value the Reteplase Ribose plate uses, so it is known to support a ribose-based reaction.
Why add spermidine. Smith et al. (2026) report that adding small amounts of spermidine reduced cost per gram of protein [1]. The Reteplase Ribose plate already runs spermidine at 1.25 mM in a ribose system, so compatibility is demonstrated. Polyamines stabilise ribosomes and tRNA, and at 100 nL from a 250 mM stock the volume cost is negligible.
Why not touch magnesium. Five of six plates converge on 8.22 mM. This is the parameter where a wrong guess costs the most and the reference data offers no evidence that sfGFP wants something different.
Why the ribose system. PETase loses only 14 % of yield on the cheap formulation — the smallest penalty of the three proteins. Its single disulfide is already handled by DsbC at 5 µM, which both PETase plates include.
Why raise magnesium to 10.1 mM. This is the one place in the entire reference set where a protein-specific magnesium optimum shows up: PETase PEP is the only plate that deviates from 8.22 mM, running at 10.1 mM. Every other plate, across both energy systems and all three proteins, sits at 8.22. If that deviation is real rather than noise, it says PETase prefers slightly more free Mg²⁺ — and the PETase Ribose plate may be under-supplied at 8.22. Given that A1 established magnesium as the sensitive parameter, a 1.88 mM move is exactly the kind of single directed change worth spending the one shot on.
Why the expensive energy system. This is the one case where cost optimisation has to lose. Reteplase on the ribose formulation yields 0.81 µM against 10.9 µM on PEP — a 13.5-fold collapse. The cheap formulation cannot save 13-fold on reagents, so cost per gram is worse no matter what. Nine disulfide bonds that must find their correct pairings need the fast, high-flux energy supply; a reaction running on its own metabolism apparently cannot sustain folding at that difficulty.
Why more DsbC. Reteplase’s failure mode is specifically mispairing, not absence of oxidation — GSSG supplies the oxidising potential, but with nine bonds the number of wrong pairings vastly exceeds the one correct arrangement. DsbC is the isomerase whose job is to reshuffle incorrect pairs, so it is the component most directly matched to the bottleneck. 5 µM is the same concentration used for PETase, which has one disulfide; it is not obvious that the protein with nine should get the same amount. A 50 % increase is the largest move the spare volume allows.
Why add catalase. The Reteplase Ribose plate includes catalase at 188 U/mL; the PEP plate does not. This is a cross-over between sibling plates, so it is known to be compatible with Reteplase. Catalase removes hydrogen peroxide, and in an oxidising formulation peroxide accumulation can oxidise residues off-target and compete with the intended GSSG-driven chemistry. At 75 nL it is nearly free in volume terms.
Why not touch the redox buffer. The 4.04 : 1 GSSG : GSH ratio is doing the central work and is the thing most likely to break if moved blind. Changing DsbC and GSSG : GSH in the same shot would also make the result unattributable.
Community reagent proposal: DsbA
The gap. The reagent inventory includes DsbC, the disulfide isomerase that reshuffles incorrect pairings, but no DsbA, the disulfide oxidase that introduces bonds in the first place. In the E. coli periplasm the two work as a pair: DsbA forms disulfides rapidly but with low fidelity, and DsbC proofreads them. The current oxidising formulation has the proofreader without the writer, leaving bond formation entirely to chemical oxidation by GSSG.
Why it matters for this coopetition. Reteplase is the protein that fails worst and the one the whole cost-per-gram metric is most sensitive to — at 10.9 µM it is roughly 30-fold below PETase in molar yield. Its bottleneck is explicitly disulfide formation and pairing. Adding a dedicated oxidase alongside the existing isomerase is the most direct intervention available on that bottleneck, and it is cheap to test because DsbC is already in the inventory as a precedent for supplying a purified Dsb protein.
Alternative if DsbA is declined: the GroEL/GroES chaperonin system, which addresses general misfolding rather than disulfide chemistry specifically and would apply to PETase and Reteplase both.
Notes and caveats
On volume arithmetic. Working from the stock concentrations in the designer, my computed totals for the reference plates came to roughly 26,000 nL rather than 20,000, so some part of the volume accounting is not visible in the interface. I therefore verified every proposed change incrementally against the spare volume shown in the water row of each reference plate, which is the quantity that actually constrains an edit. All three designs fit with margin. Each should still be checked in the designer before submission — if the water row goes negative, the mix is over budget.
On what would make these designs better. With more than one shot per protein, the obvious next move is a magnesium series around 8.22 mM for each protein, since A1 identifies it as the sensitive parameter and the reference set contains exactly one piece of evidence that it is protein-specific.
References
[1] Smith, A. A., et al. (2026). Using a GPT-5-driven autonomous lab to optimize the cost and titer of cell-free protein synthesis (Ginkgo Bioworks × OpenAI). bioRxiv. https://doi.org/10.64898/2026.02.05.703998
[2] Olsen, M. L., Copeland, C. E., Sundberg, C. A., Aw, R., Shaver, Z. M., Rao, G., Swartz, J. R., Karim, A. S., & Jewett, M. C. (2026). Design-driven optimization of low-cost reagent formulations for reproducible and high-yielding cell-free gene expression. Nature Communications. https://doi.org/10.1038/s41467-026-69605-8
[3] Jewett, M. C., & Swartz, J. R. (2004). Mimicking the Escherichia coli cytoplasmic environment activates long-lived and efficient cell-free protein synthesis. Biotechnology and Bioengineering, 86(1), 19–26. https://doi.org/10.1002/bit.20026
[4] Silverman, A. D., Karim, A. S., & Jewett, M. C. (2020). Cell-free gene expression: an expanded repertoire of applications. Nature Reviews Genetics, 21, 151–170. https://doi.org/10.1038/s41576-019-0186-3
[5] Rasor, B. J., Vögeli, B., Landwehr, G. M., Bogart, J. W., Karim, A. S., & Jewett, M. C. (2021). Toward sustainable, cell-free biomanufacturing. Current Opinion in Biotechnology, 69, 136–144. https://doi.org/10.1016/j.copbio.2020.12.012