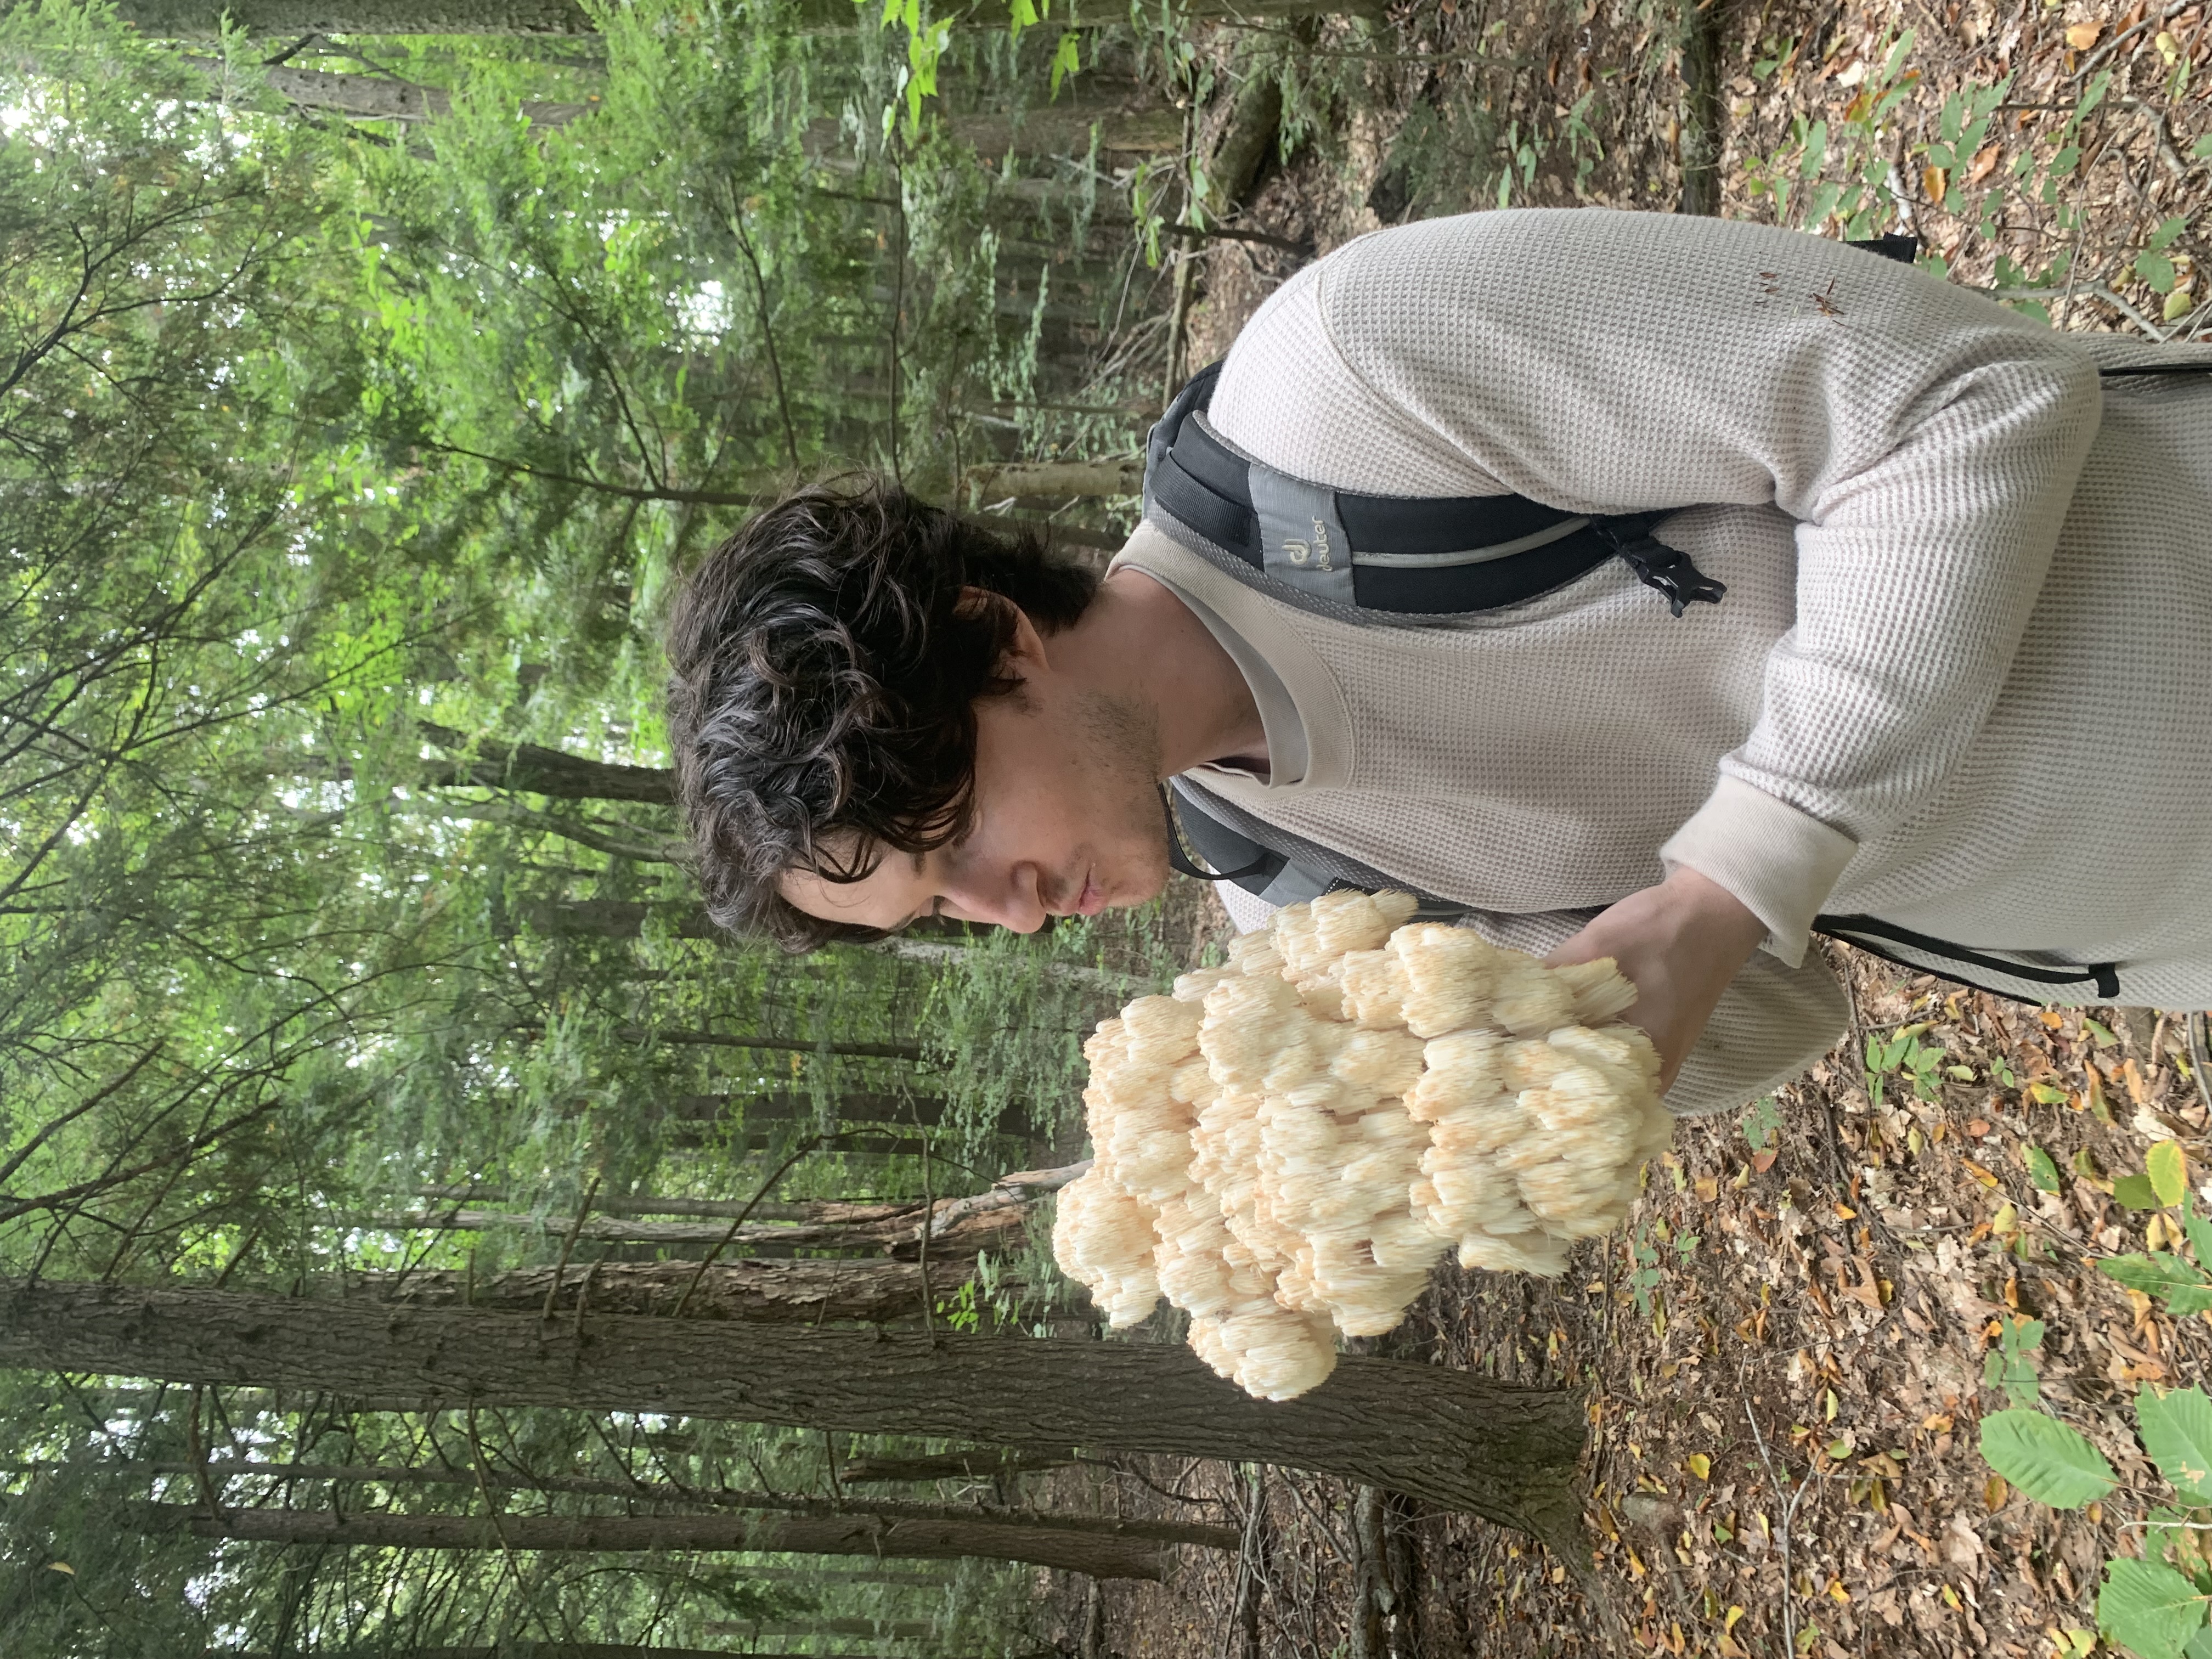
I love growing things, on the weekends you can find me either gardening or in the forest looking for mushrooms to bring back home and clone. I am passionate about biotechnology and am looking forward to learning about automation and strengthening my knowledge of synthetic biology.
Contact info
Homework, Labs, and Projects
See the nav bar on the left to look through my work for How To
Biomanufacture Almost Anything (Fall 2026)!
Subsections of <Caleb Seward> — HTBAA Fall 2026
Week 1 HW: Final Project Ideas
HTBAA Homework #1 — Recombinant human lactoferrin in Komagataella phaffii
# 1. What I would like to biomanufacture and why
I would like to biomanufacture recombinant human lactoferrin (hLF) using engineered yeast.
Human lactoferrin is an approximately 80-kDa iron-binding glycoprotein found naturally in human milk. It has several important biological functions, including binding iron, limiting microbial growth, supporting immune responses, and interacting with intestinal and immune cells.
Lactoferrin has also been studied for its potential to protect against bacterial infections, influence inflammation, and support the development of the intestinal and immune systems, particularly in newborns.
Because of these biological functions, human lactoferrin has potential applications in infant nutrition, therapeutics, and other health-related products.
My project would focus on producing hLF using engineered Komagataella phaffii and improving the productivity of the existing production process. A 2024 study achieved 3.1 g/L extracellular hLF in a 3-L bioreactor, showing that K. phaffii can produce hLF at relatively high concentrations. Additionally, a private company, Heleina, has commercialized the production of hLF using yeast. This proves that it can be done at a large scale
The goal of my project would be to improve this process by increasing hLF production, secretion, and overall process efficiency, while maintaining the quality and biological activity of the final protein.
2. What living system would I use?
I would use the yeast Komagataella phaffii as the production chassis.
K. phaffii is attractive because it can reach high cell densities, is widely used for recombinant protein production, and has a eukaryotic secretory pathway capable of producing complex proteins. Engineering of its secretion, folding, glycosylation, and metabolic pathways has become an important strategy for improving recombinant protein production.
The system has already been demonstrated for industrial hLF production. Helaina’s published process uses K. phaffii in batch, fed-batch, and induction phases, followed by cell removal and downstream purification.
More recently, Wang et al. demonstrated that engineering the secretion pathway can substantially increase extracellular hLF production. Their work specifically addressed intracellular hLF accumulation by modifying secretion signals and vesicle trafficking, ultimately achieving 3.1 g/L extracellular hLF in a 3-L bioreactor.
I would investigate host tolerance and secretion capacity as potential bottlenecks.
Potential engineering strategies could include:
increasing secretion efficiency
optimizing secretion signals
increasing ER protein-folding capacity
improving vesicle trafficking
reducing intracellular proteolysis
optimizing hLF gene copy number
optimizing iron availability
optimizing fermentation conditions (to prevent cell death from the product)
The goal would be to prevent the production system from reaching a point where increasing hLF expression simply increases intracellular accumulation and cellular stress.
3. How would I use automation?
I would use a liquid-handling robot such as an Opentrons to screen many yeast strains and fermentation conditions simultaneously.
Variables could include:
hLF gene copy number
secretion signal
ER folding capacity
secretion pathways
iron concentration
temperature
pH
induction conditions
The robot would automatically grow the strains, collect samples, and measure:
This would allow me to identify strains that produce high amounts of hLF while maintaining good growth and secretion.
The best strains could then be tested in progressively larger bioreactors.
4. How much would I need to make, and how long would it take?
(a) How much?
As a simple example, I would calculate the amount required for a hypothetical 1,000-infant program.
Assuming:
1,000 infants
1.5 kg average weight
150 mg/kg/day
28 days
Each infant would require:
1.5 × 150 × 28 = 6.3 g
For 1,000 infants:
6.3 g × 1,000 = 6.3 kg
Assuming 70% recovery during production and purification:
6.3 kg ÷ 0.70 = 9 kg
Therefore, I would use approximately 9 kg of purified hLF as a manufacturing target.
(b) How long?
The 2024 study produced 3.1 g/L of hLF in a 3-L bioreactor, however, the length of time is unknown since that information is behind a paywall.
At this titer and assuming 70% recovery:
9,000 g ÷ (3.1 g/L × 0.70) ≈ 4,150 L
Therefore, approximately 4,150 L of fermentation broth would be required.
If using a 1,000-L working-volume reactor, this would require approximately 5 production batches.
If each batch takes approximately one week, including fermentation, harvest, and reactor turnaround, production would take roughly 5 weeks. Additional time would be needed for downstream purification and quality testing.
The actual timeline would depend on fermentation duration, reactor utilization, downstream-processing capacity, and the final productivity of the engineered strain.
Improving the titer would reduce both the required fermentation volume and production time.
5. What don’t I know yet?
What is the major limitation at high hLF production?
The recent 3.1-g/L study provides an important clue: secretion was a major bottleneck.
The researchers observed substantial intracellular accumulation of hLF. By optimizing secretion signals and vesicle trafficking, they were able to substantially increase extracellular production and reduce the intracellular/extracellular ratio from 1.69:1 to approximately 1.01:1.
This suggests that simply increasing hLF gene expression may not be sufficient.
I would therefore want to determine whether the next bottleneck is:
This would allow me to distinguish between a strain that simply makes more hLF and a strain that actually has a more efficient secretion system.
Can I improve productivity without compromising product quality?
Increasing titer is not sufficient if the resulting protein has inappropriate glycosylation, aggregation, degradation, or reduced biological activity.
The optimized strain would therefore need to be evaluated for:
hLF concentration
purity
aggregation
glycosylation
structural integrity
iron-binding activity
biological activity
This is particularly important because recombinant hLF produced in K. phaffii can be structurally very similar to native hLF while still having differences in its N-glycosylation pattern. Industrial-scale characterization of Helaina’s recombinant hLF provides an important reference for evaluating product quality.
The ideal production strain would therefore not simply maximize hLF concentration. It would maximize:
functional hLF produced per unit of reactor volume and time while maintaining an appropriate product-quality profile.
Key references
Wang et al. (2024), Engineering a transport pathway to boost extracellular production of human lactoferrin in Komagataella phaffii.Food Bioscience. — 3.1 g/L hLF benchmark.
Griffiths et al. (2019), Enteral lactoferrin supplementation for very preterm infants.The Lancet. — ELFIN trial.
Characterization of recombinant human lactoferrin expressed in Komagataella phaffii (2024). — Industrial-scale hLF production.
Advances in Cell Engineering of the Komagataella phaffii Platform for Recombinant Protein Production (2022). — Yeast engineering and secretion strategies.
AI Use Disclosure
I used ChatGPT (OpenAI) as a research and brainstorming tool during development of this proposal. AI was used to help identify relevant scientific concepts, organize the proposed biomanufacturing strategy, compare production approaches, and refine the experimental and process-development framework. Scientific claims and references were independently reviewed against the cited literature.
Example prompts used included:
“I want to develop a biomanufacturing project around recombinant human lactoferrin production in yeast. Help me identify the major technical challenges and opportunities for improving productivity.”
“What are the main challenges associated with producing recombinant human lactoferrin in Komagataella phaffii?”
“Is lactoferrin toxic or antimicrobial to yeast, and could this create a host–product conflict during recombinant production?”
“How could yeast be engineered to improve lactoferrin secretion, folding, stability, and tolerance?”
“Design an automated screening and optimization strategy for improving recombinant human lactoferrin production in yeast.”
Week 2 HW: Kernel
Part 1: Define your expression target
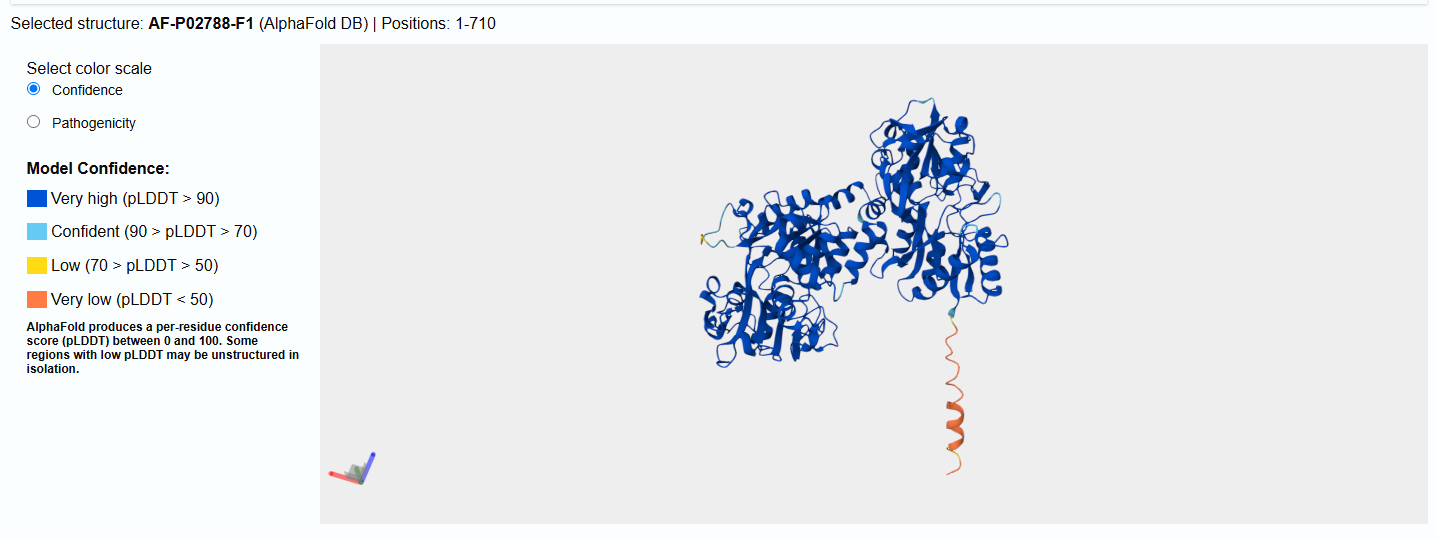
● Molecule: Human Lactoferrin, image obtained from UniProt (AlphaFold prediction)
● The sequence was obtained from uniprot (P02788 · TRFL_HUMAN), it is a 710 amino acid protein.
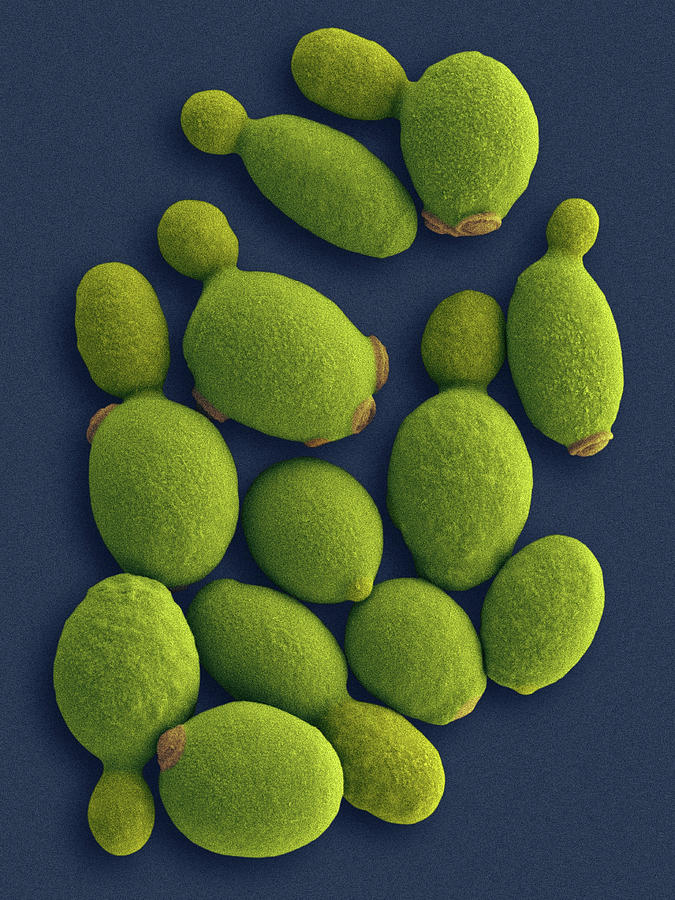
● The living system is a yeast (Komagataella phaffii)
● The product needs to be excreted out of the cell to make purification easier.
Part 2: Design your genetic parts
I first used the open-source codon optimizer Pichi CLM. I uploaded this DNA sequence into Kernel (Human Lactoferrin codon optimized for Komagataella phaffii). Sequence came from uniprot (P02788 · The full length lactoferin protein seqeunce was used since it requires the full sequence to make an active protein. Komagataella phaffii was chosen as the host because it can reach high cell densities, is widely used for recombinant protein production, and has a eukaryotic secretory pathway capable of producing complex proteins. TRFL_HUMAN) and was codon optimized using open source tool (Pichia CLM). Seqeunce:
I assembled my construct by adding my human lactoferrin sequence immediately downstream of the pPICZ A promoter. Kernel did not let me insert it directly into the pPICZ A backbone, I therefore had to create two separate parts. Part 1: the promoter alone and the pPICZ A backbone without the promoter. There potentially is a better way to do this however, I was not able to find it. Bellow is a schematic of my constructed backbone
Part 4: Optimize and quality-check
I ran the codon optimizer using the lactoferrin AA sequence however it was only for brewers yeast which is a different organism. I got the following sequence back. The sequence change by around 53% (claude analysis), it reduced the GC content.
Prior to pasting my sequence into kernel, I had already used an open source codon optimizer for my organism (Pichi CLM). Therefore I did not change my sequence in kernel since the I had used a more fitting tool.
Biosecurity Risk
Using Kernels tool I did not find any biosecurity risks.
Blast
By blasting my sequence the only thing that came up was Sitophilus oryzae transferrin (LOC115881357), mRNA.
Part 5: From design to build
I would order the CDS as one synthetic gene (2,136 bp), buy the vector, and join them with Gibson. I would purchase the pPICZ A backbone. I would join the two using Gibson assembly. Gibson assembly is preferred since the complexity is low and does not necessitate a more complex approach.
Sequence difficulty isn’t my constraint: no repeats of 20 bp or more, GC 37 to 55% across every 100 nt window, longest homopolymer six A’s, and the plasmid’s two bad AT runs are in the promoter and terminator I’m buying.
Once I construct my plasmid using gibson I would transfect it into E Coli to produce it. I would then extract it and sequence it to make sure that it was inserted well into the bacbone. I would then transfect it into yeast and try producing my product.
Part 6: What don’t you know yet?
Whether my signal peptide works. I kept the native human secretion peptide, but I couldn’t find one paper expressing human lactoferrin in Pichia with it they all used α-factor. I’d build five versions differing only in the first 57 bp and measure secreted protein by ELISA.
Whether it folds. Codon optimization does nothing for disulfides, and mature lactoferrin has 32 cysteines in 16 of them plus two iron lobes. A band at the right size proves nothing, so I’d check iron binding by A465/A280.
Readings: Carr et al. 2004, NAR 32:e162 · Gibson et al. 2009, Nat Methods 6:343 · Kosuri et al. 2010, Nat Biotechnol 28:1295
Week 3 HW: CFPS
A. Comparing compositions
Potassium vs magnesium glutamate
Magnesium glutamate is more sensitive.
Potassium glutamate just sets the ionic background, approximating the cytoplasm the ribosome evolved in. The optimum is broad, so published values scatter from 130 mM in PANOx-SP to 362 mM in Olsen’s RFopt. Magnesium is a catalytic cofactor with a narrow window: free Mg2+ drives 30S/50S association, holds tRNA tertiary structure together, and is the catalytic metal for T7 polymerase and the synthetases. Too little and ribosomes don’t assemble, too much and elongation slows and fidelity drops. Across those same formulations it barely moves, 7 to 10 mM everywhere.
The giveaway is how Olsen treats them: magnesium and phosphate re-optimized for every lysate batch, every lysate loading and every source strain, while potassium sat at 362 mM throughout. Where the magnesium number does drift it’s chelation, not a different requirement. Phosphorylated species bind Mg roughly stoichiometrically, so the optimum tracks the chelating load, and in a PEP system the free phosphate climbs as PEP is consumed and precipitates magnesium phosphate. Change the energy system and the magnesium optimum moves with it.
PEP + NTP vs Ribose + NMP
Both formulations have to end up with the same thing, a supply of ATP, GTP, CTP and UTP. They differ in whether those arrive ready-made or get built in the reaction from cheaper precursors.
PEP + NTP is the PANOx-SP lineage. Pyruvate kinase hands PEP’s phosphate straight to ADP, so ATP appears within half an hour and the nucleotides arrive ready to use, along with the classical supplements: folinic acid, tRNA, NAD, CoA, putrescine, oxalate. It’s fast and it burns out. Every PEP consumed releases a phosphate, phosphatases waste more of it, and the accumulated phosphate drags magnesium out of solution. It’s also the expensive route, with CTP, GTP and UTP at $28 to $39/mL.
Ribose + NMP has no NTPs and no phosphorylated energy substrate. Ribose feeds the lysate’s own pentose phosphate and glycolytic enzymes and endogenous kinases phosphorylate the NMPs up to triphosphates, so phosphate has to be added deliberately at 5 to 15 mM. ATP comes up slower but holds near 250 µM for the full 20 hours instead of spiking and crashing, and the expensive supplements can just be deleted because undialyzed crude lysate already has them. Nicotinamide replaces NAD for pennies. RFopt gets reagent cost to $133/L.
PANOx-SP vs RFopt
With the best GPT-5 composition as a third column, since all three are the same lineage twenty-two years apart.
Component
PANOx-SP (2004)
RFopt (2026)
GPT-5 #35 (2026)
Lysate (% v/v)
24
30
25
HEPES-KOH (mM)
57
75
67.5
K glutamate (mM)
130
362
273
Mg glutamate (mM)
8
8
8.8
Amino acids (mM)
2
5
4.8
PEP (mM)
33
Ribose / glucose (mM)
50 / 10
40 / 8.3
K phosphate (mM)
15
15
ATP / other NTPs (mM)
1.2 / 0.85 each
AMP / other NMPs (mM)
3 / 2.15 each
0.5 / 1.0 each
Folinic acid, tRNA, NAD, CoA
all present
none
none
Nicotinamide (mM)
4
4
Spermidine (mM)
1.5
1.2
sfGFP titer (g/L)
~1.3
2.4
3.04
Specific cost ($/g)
698
422
Deletion did most of the work. RFopt drops tRNA, folinic acid, NAD, CoA, putrescine, oxalate, DTT and ammonium glutamate outright, because undialyzed crude lysate already supplies them. That’s three of the four priciest items in the classical mix, and it cost nothing: RFopt still made 87% more sfGFP. Magnesium meanwhile didn’t move at all while potassium nearly tripled, which is question 1 again. Buffering turned out to be a yield reagent rather than background, and GPT-5 put a number on it: median 0.057 g/L with no added HEPES against 0.177 g/L with it.
GPT-5’s gain came from different levers than Olsen’s. Once reagent cost was down, lysate and DNA were over 90% of the total, so it went after the fixed side: lysate 30% to 25%, DNA 8.7 to 5 nM, NMPs cut two to fourfold. Then it bought titer back with spermidine, median 0.253 against 0.131 g/L. The lesson for part B is that lysate and DNA are fixed by the rules, so specific cost is driven almost entirely by titer.
B. The three designs
The 5,000 nL of lysate costs $0.0200 a reaction and the template is fixed, so neither is mine to optimize. In the 11,000 nL I do control, only six things carry real cost: DsbC at $5,632/mL, CoA at $104/mL, CTP, GTP and UTP at $28 to $39/mL, NAD at $33/mL and folinic acid at $9/mL. Everything else is fractions of a cent. So each design is a decision about which of those six I can do without.
Final concentrations below include the base buffer background, which I back-calculated from the designer’s example JSON: 200 mM K glutamate, 2.6 mM Mg glutamate, 30 mM HEPES, and 1 mM each of the amino acid mix, tyrosine and cysteine.
Reagent
sfGFP
PETase
Reteplase
K glutamate (mM)
300.6
300.6
200.0
Mg glutamate (mM)
8.23
8.23
8.23
NH4 glutamate (mM)
10.0
HEPES pH 7.5 (mM)
75.0
75.0
85.0
Amino acid mix / Tyr (mM)
5.00 / 1.19
5.00 / 1.19
5.00 / 1.19
Cysteine (mM)
1.00
2.00
3.00
K phosphate di / mono (mM)
7.5 / 7.5
7.5 / 7.5
Ribose / glucose (mM)
49.96 / 8.33
49.96 / 8.33
PEP (mM)
25.0
ATP / CTP, GTP, UTP (mM)
1.25 / 0.875 each
AMP / CMP, GMP, UMP (mM)
1.50 / 1.00 each
1.50 / 1.00 each
Adenosine / guanine (mM)
0.41 / 0.19
0.41 / 0.19
Nicotinamide (mM)
4.00
4.00
Spermidine / putrescine (mM)
1.25
1.25
1.56 / 1.25
Oxalic acid (mM)
3.75
GSSG / GSH (mM)
4.04 / 1.00
DsbC (µM)
2.50
Catalase (U/mL)
187.5
187.5
187.5
Priced cost per reaction
$0.02
$0.02
$2.85
sfGFP. Ribose and NMP backbone with none of the expensive six, so the cost is basically all lysate and titer is the whole game. HEPES at 75 mM because it’s the best-evidenced titer lever on the menu and costs nothing; phosphate at 15 mM because the salvage kinases need it and the window is narrow; NMPs cut with adenosine and guanine filling in, following both papers, though CMP and UMP can’t be swapped for their nucleosides; spermidine because it roughly doubled median titer in Smith’s data. Catalase because sfGFP is the one target where oxygen is mechanistically required, since chromophore maturation ends in an O2-dependent step. That last one is speculative and deserves a minus-catalase arm.
PETase. Same backbone, cysteine up to 2 mM, no DsbC. Leaving DsbC out is the whole design. At $5,632/mL the default 5 µM is $5.63 a reaction against $0.02 of lysate, so a reference PETase reaction spends 280 times more on DsbC than on cell extract and over 99% of its reagent budget on one protein. And an isomerase doesn’t have much to do here: DsbC reshuffles wrong pairings, but TfCut2 has one disulfide, so there’s only one possible pairing and nothing to reshuffle. The caveat is that DsbC also has holdase activity, so it isn’t guaranteed inert. A 0 / 0.5 / 1.25 / 2.5 µM ladder would settle it and is the highest-value block of wells on a PETase plate. Everything else I held identical to sfGFP on purpose, so any difference is down to the protein rather than a dozen simultaneous changes.
Reteplase. Keep PEP and the NTPs, pay for them by deleting the cofactor package, since reteplase doesn’t survive the cheap backbone at any price. DsbC genuinely is needed, but the default overshoots the literature: Yin and Swartz, where this construct comes from, got 200 µg/mL total vtPA and almost no activity in a standard system. Glutathione plus iodoacetamide raised soluble protein to about 50 µg/mL and raised active protein not at all. Only DsbC produced activity, about 26 µg/mL, and bovine PDI did nothing, so it’s DsbC specifically. Their working concentration was 75 µg/mL, about 2.9 µM, while the platform default of 5 µM is roughly 128 µg/mL. I set 2.5 µM, inside the range they used, which halves the dominant cost. HEPES goes to 85 mM because 5 mM of glutathione is what drops reaction pH and buffer is the cheapest fix. No added phosphate, since in a PEP system phosphate is a product and above 25 mM gives essentially zero titer, which is also why PEP is at 25 rather than 30 mM. GSSG to GSH at 4:1 is Yin and Swartz’s measured optimum across five ratios. Since DsbC is about 99% of the cost, the rest of a reteplase plate should be a DsbC ladder: at 5 µM the reference works out near $0.52 per µM AMC, so anything holding above a third of reference activity at 1.25 µM wins.