I am an industrial designer with ~10 years of biotechnology and pharmaceutical project management experience, followed by ~15 years of manufacturing industry expertise in the learning & development field. I am so excited to be involved in the convergence of synbio and automation, combined with design and creativity!
See the nav bar on the left to look through my work for How To
Biomanufacture Almost Anything (Fall 2026)!
Subsections of Eric Schneider — HTBAA Fall 2026
Week 1 HW: Final Project Ideas
HTBAA Homework #1
Q1. What do you want to make?
I am making a scalable platform that uses optics and genetics to create
light-responsive spatial images, also known as bacterial photography. This
includes engineering biosensors and biocircuits that report as fluorescent
proteins, as well as designing biofilm materials that record images based on
spatial patterns of light and dark.
The Photoplasm device I created in HTGAA ‘26 has
become a key component of the Genspace Community Project focused on synthetic
biology and optogenetics. This activity aligns well with the original project,
where I went from initial design (Aim 1)to an open-source build and test cycle (Aim 2).
We are now in week 14 of the community project, and the device has evolved closer and closer to a prototype
that is suitable for Aim 3: scaling the device to the larger community.
HTBAA is a perfect fit and natural progression for Photoplasm. We are
actively in the design, build, test and analyze phase; We have data, successes,
failures and end-user feedback.
I would like to branch the project into a cloud lab ecosystem where I may design
and manufacture a cell-free protein system with a biofilm, as well as a
living-cell culture that could reach industrial scale through automation. I will compare
both to see which has the strongest application.
Q2. What living system could make it?
The current construct targets use of E. coli for the purpose of achieving a
calibrated system that can create spatial images, as the baseline. Since the
system is an incubator and light projector, the ability to grow and test
different engineered microbes means that we can open up the path for experiments
that use light-responsive and light-repressive circuits.
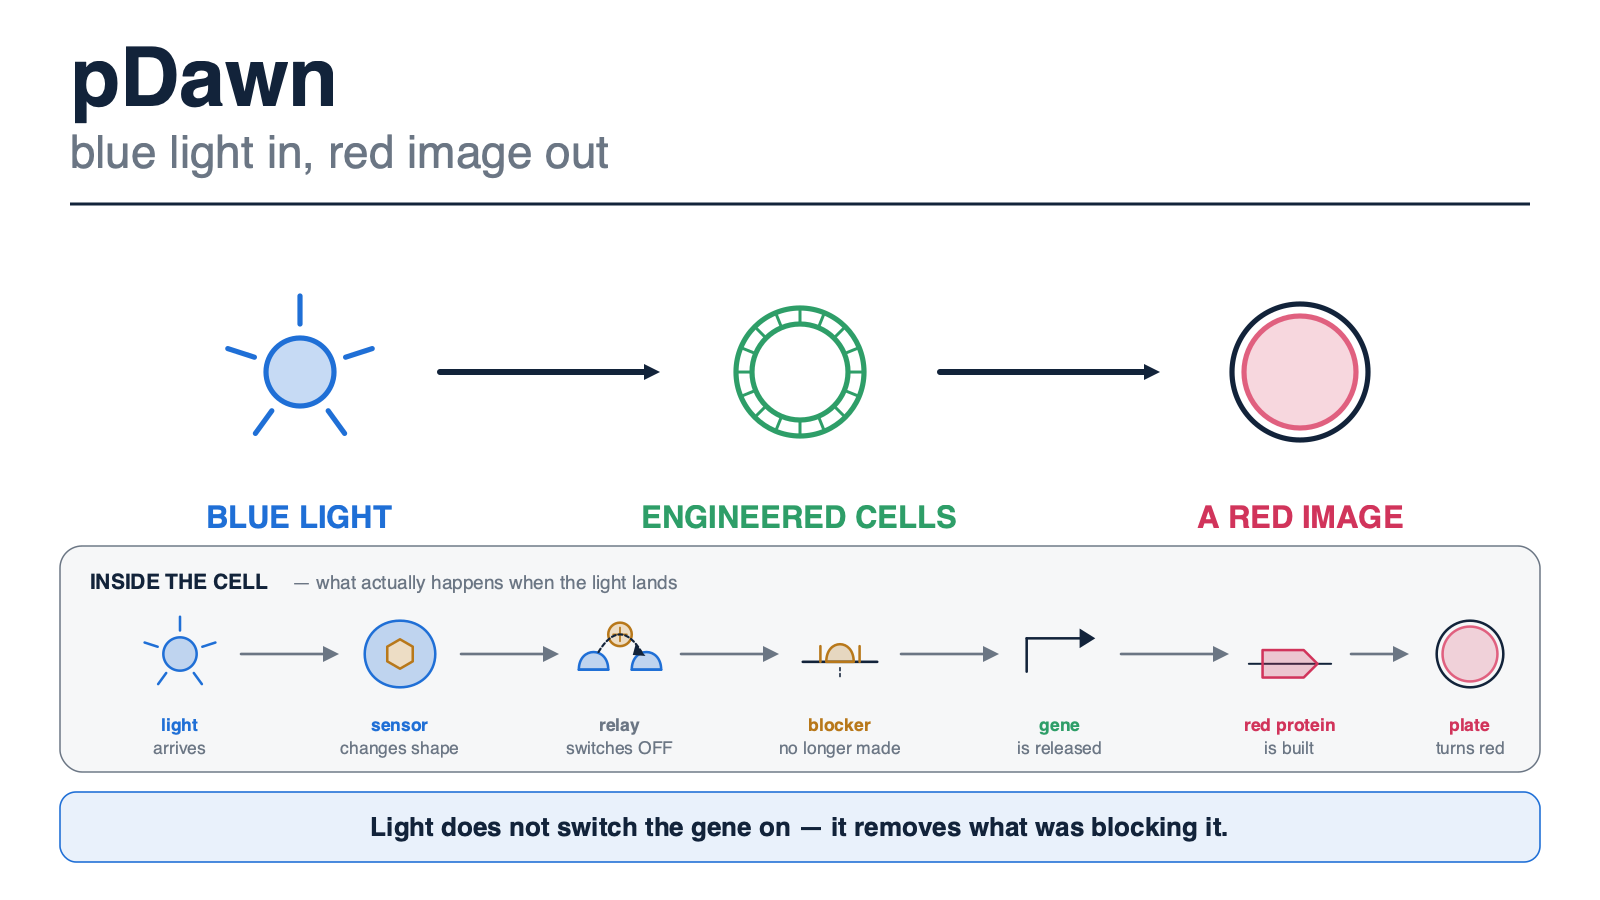
pDawn light responsive circuit
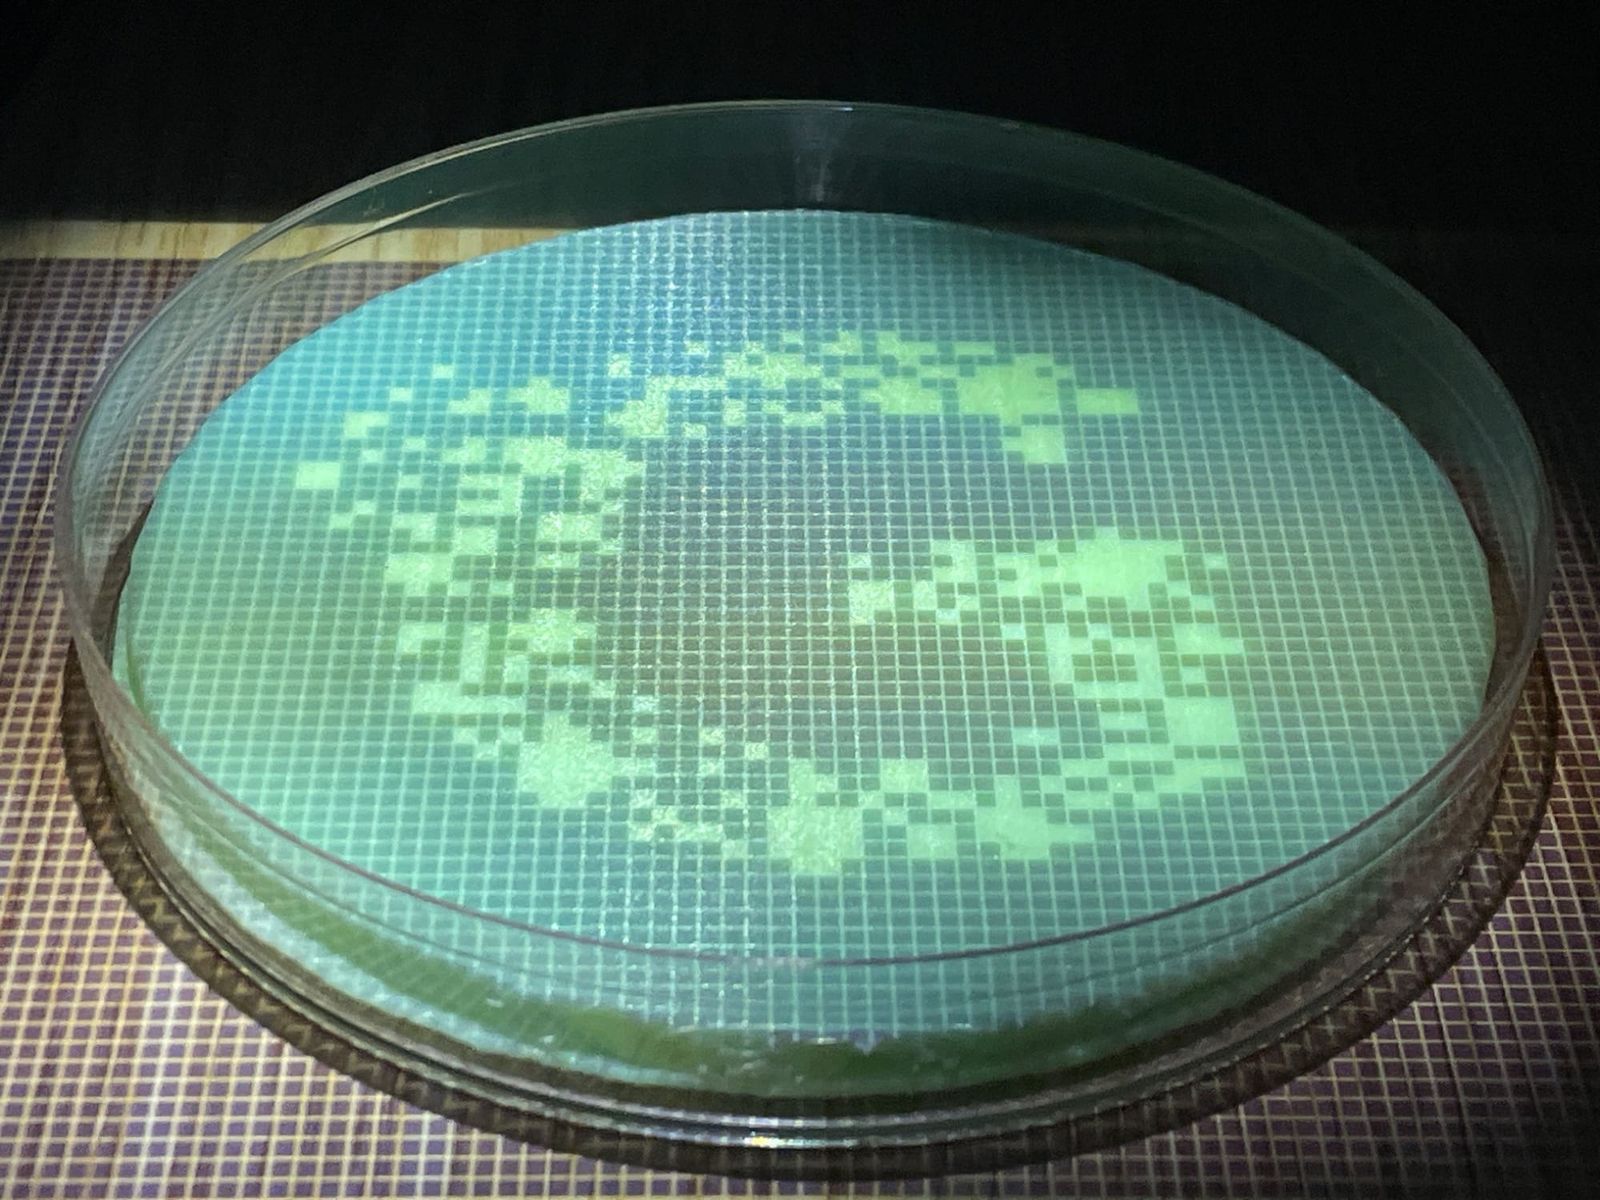
For example, we are currently using pDawn, since it represses transcription from
the promoter for DsRed in the dark and, under ~470 nm blue light, begins to glow —
based on the amount of light reaching an agar flood plate through a patterned
image mask; like a film negative, but digital.
We also have BioLight_GenV10, which is a clonal gene synthesized by Twist
Bioscience — the culmination of Aim 1, and the start of Aim 2 once we quantify
the device performance with pDawn and have created protocols for wet lab use in
the community lab.
Q3. How could automation help you make it?
This is a two-part answer. Part 1 is the effective techniques of an automated
provider like Twist Bioscience for a clonal gene. Part 2 is what happens after we
have identified a strong candidate for propagation. I fully expect to achieve an
image in a bacterial culture in the next 12 weeks, through the wonderful collaborative efforts
with the Genspace Community Lab Project.
The automation I am referring to here is the propagation of the selected cultures
into an increasing number of plates that can be used by local and remote participants
experiencing Photoplasm. Rather than creating a stockpile, which can be expensive
and carries a high risk of contamination or expiration, I want to explore
on-demand plate making, exposure, incubation, visual monitoring in a closed loop,
with data analysis — to optimize the system in near real time.
As stated in Aim 3 of Photoplasm, the collective neural network of active devices will
contribute to the knowledge base of community participants, which range from
curious new learners to expert scientists striving to achieve experimental
results.
Q4. What would it take to make it at a meaningful scale?
To make this solution at a meaningful scale, I am following a methodology known
as Design Thinking, where the persona of the end user comes first. Who is the
target audience? What is the competitive and complementary landscape? What are
the risks of not doing this?
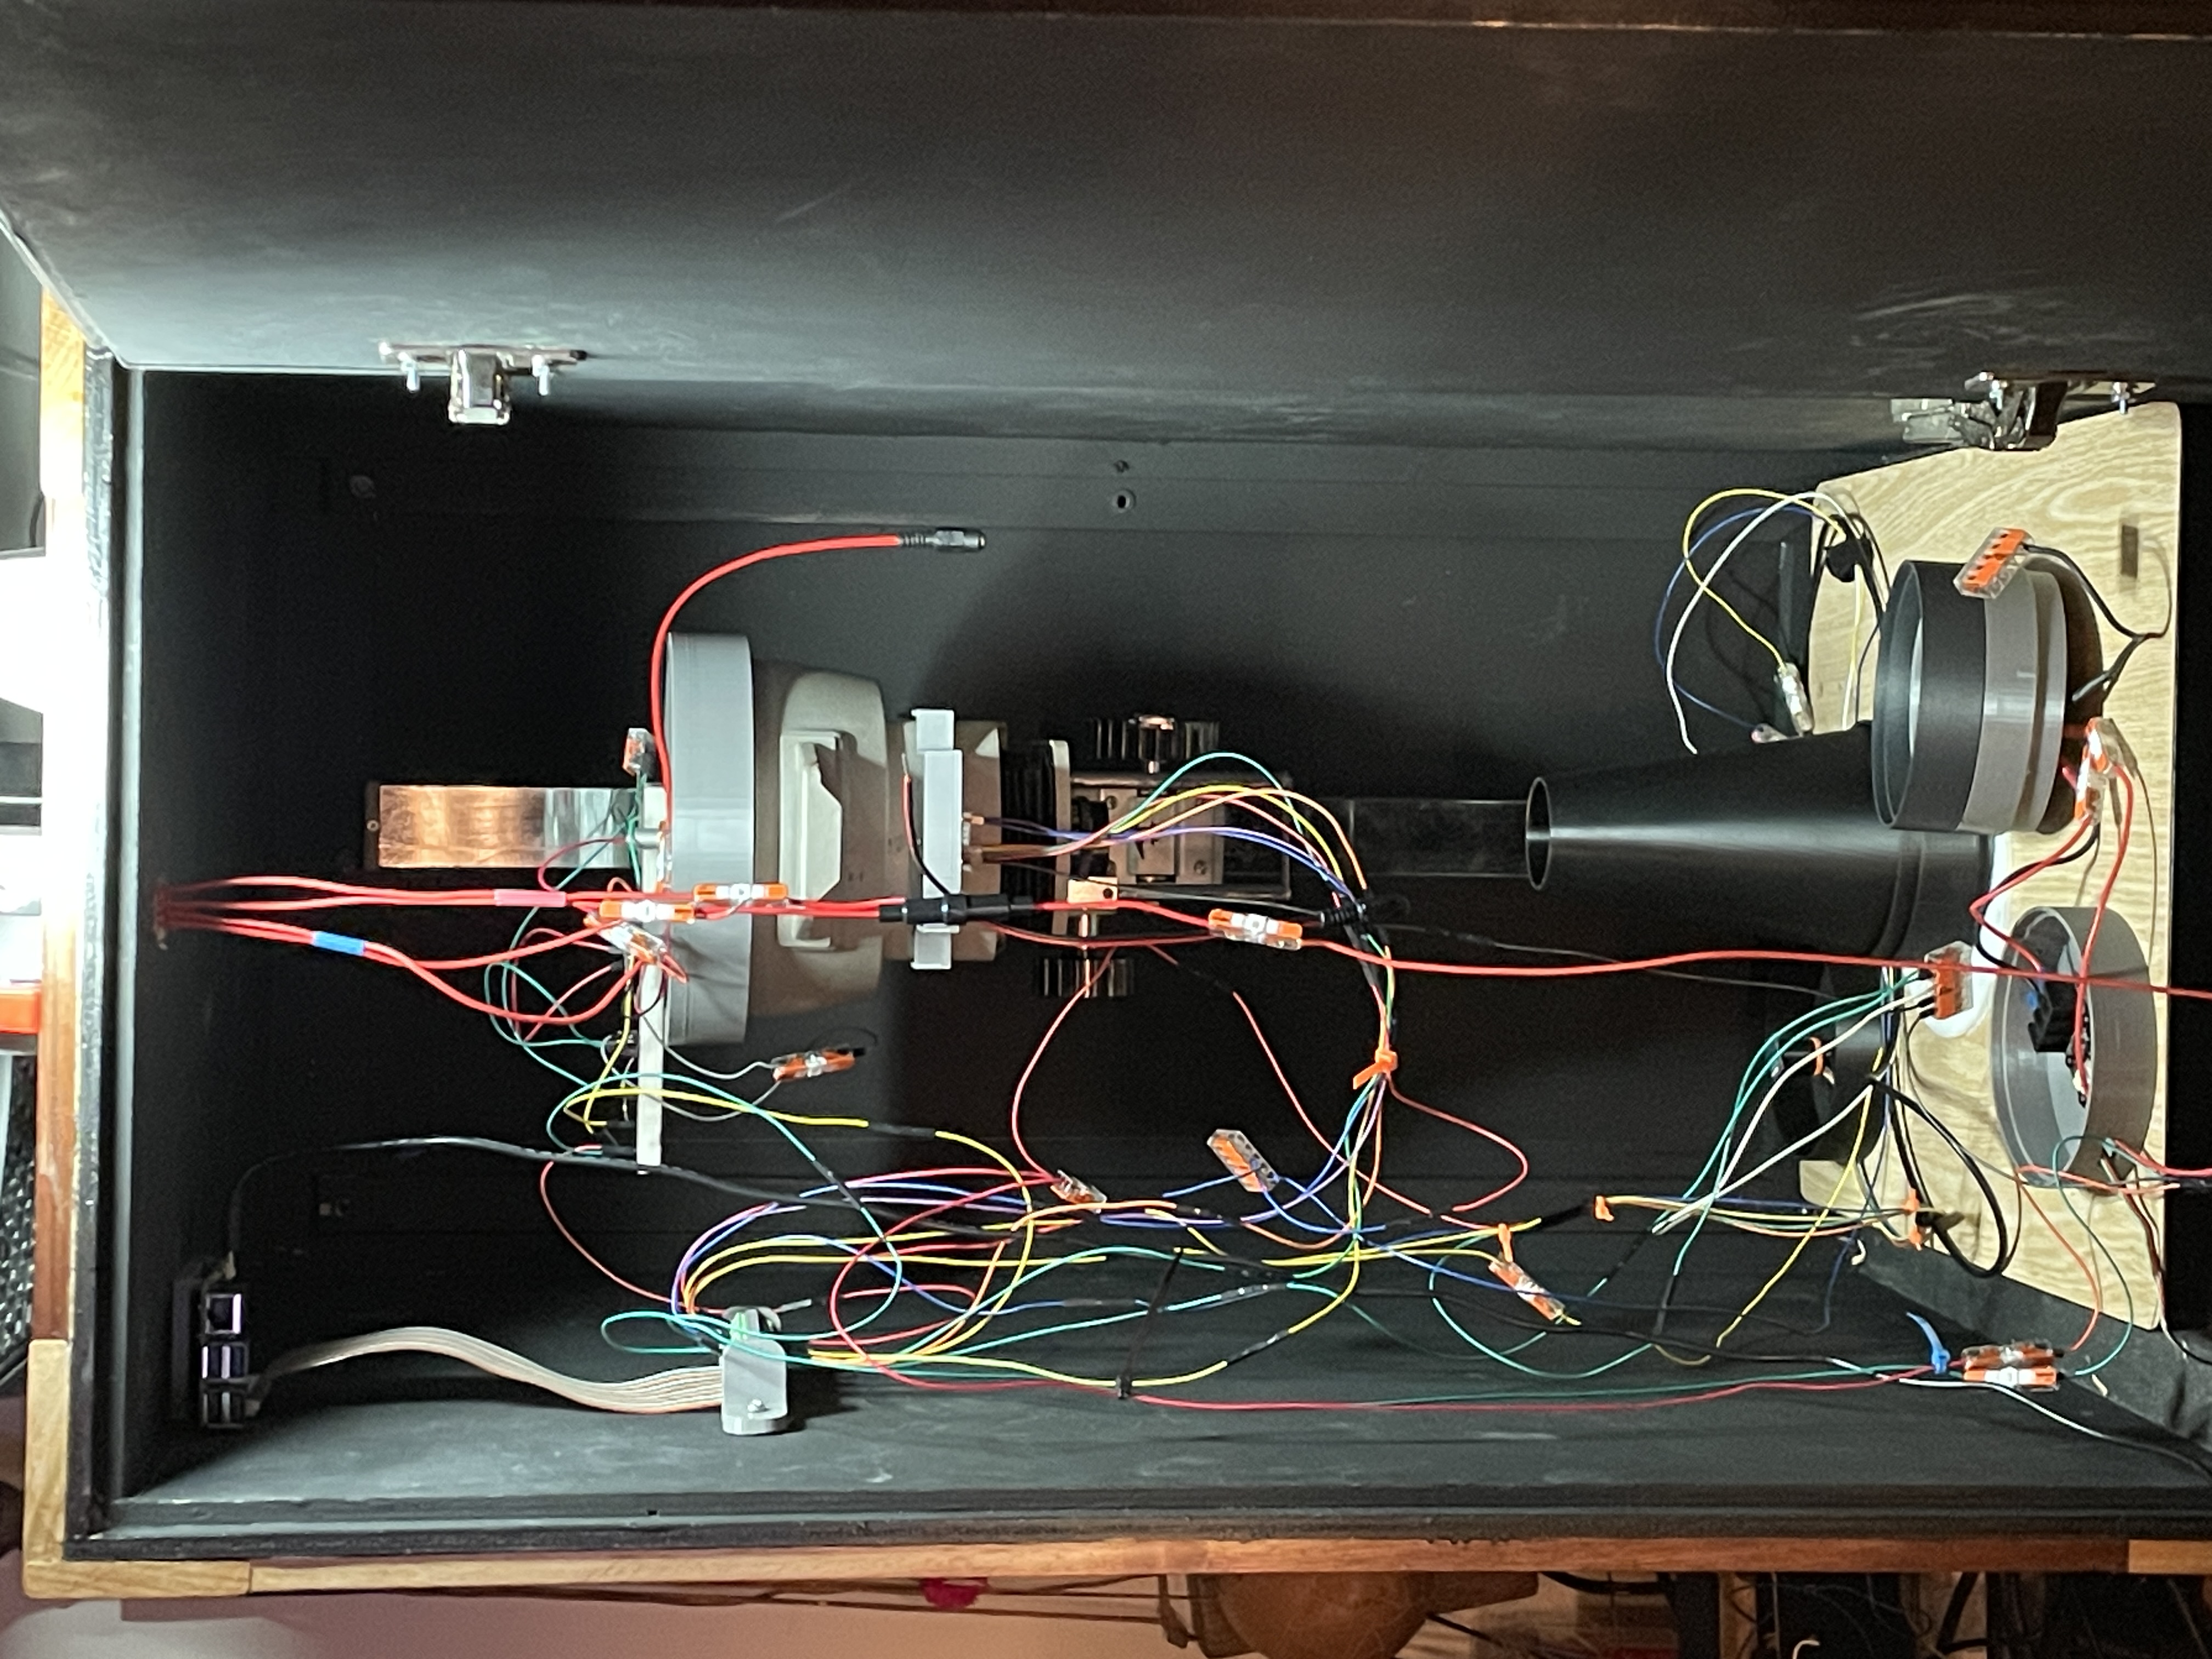
I have built a fully functioning prototype of Photoplasm v1.0, which helped to
identify essential updates ranging from safety, cost, mechanical,
electrical and code-based rapid improvements. The scalability model is focused on
going purposefully from rapid prototype to a streamlined manufacturing process.
Photoplasm 1.0 in Enclosure
There is an important intermediate phase. The open-source version of Photoplasm
is deemed just that — a fully open-source platform for anyone with access to
GitHub to download. It is now supported by a robust interactive build guide,
which has become a primary focus. If someone learns how to make one themselves,
the scalability is inherent and individualized.
From a commercialization perspective, I am introducing a branch of the
open-source project that strives to optimize, resize, and adapt to a robotic
automation platform. Both can exist in harmony, as they have the same purpose
only at different scale. For the open-source DIY version, it is fully accessible
and has a learning component. For the high-volume automated production process,
the medical-device-grade product can conduct rapid assays and would be fully
compatible with the Reconfigurable Automation Cart platform.
There is even an exciting branch of the open-source project where I am building
my own virtual cloud lab for prototype 1.0, which means that remote participants
can experience Photoplasm from anywhere, leading to hybrid learning
opportunities.
HTBAA and my final project are focused on scalability through emerging cloud
labs, with potential for cell-free protein systems to greatly increase
scalability and productivity, and to launch a massively adopted optogenetics
platform for learning and industrial use.
(1) What you would like to biomanufacture and why?
Describe the target product or output you would like to make. Why are you interested in making it? Your motivation might be
utilitarian — for example, addressing a problem in health, sustainability,
food, energy, or manufacturing — but it does not need to be. Your project might
instead have a social, cultural, artistic, or personal motivation. Clearly
articulate what you want to make, who or what it is for, and why you think it
is interesting or important.
Now that we have described a platform for optogenetics in cloud labs, I want to
focus on the essential construct: a light-responsive cell-free system that can be
applied to a substrate suitable for use in the next evolution of Photoplasm.
Think of this as a type of film with specific characteristics, similar to how the
photographic film industry used batch manufacturing of film.
For example, if we were targeting a therapeutic application, the resulting
substrate may use the same light-responsive biocircuit to deliver a manufactured
product on demand — reducing overproduction, increasing shelf life, and
personalizing the delivery.
I want to biomanufacture a cell-free system that is
light-responsive and has the ability to modify the reporter to be fluorescent,
with digital images as the observable record. Then, lean into reporters that bind
to materials as a substrate of record.
My primary focus is on the creation of photographic fine art,
to bring social awareness and accessibility to the community through venues such
as makerspaces, wet labs, galleries, and museums. Not just my own fine art, but
the creative expression of the wider public audience — very much how photography
has been used to capture moments. This may be our synthetic biology moment, made
possible by cloud automation.
My “why” goes back to the Design
Thinking approach to understanding the persona — the named person who would
benefit from the product. A learner exploring their career path; an artist
seeking inspiration from nature; a maker building a tool for exploration; and an
accessible experience for people of varying abilities, that is, Universal Design.
My personal interest in automated biomanufacturing would be greatly enhanced by
observing a live facility, to better understand the scale, operating requirements,
and engineering knowledge.
(2) What living system would you use?
Propose at least one living-system manufacturing chassis
that could produce your target — for example, a microbial, mammalian, or
cell-free system. At a high level, describe how the system would make your
target product. What goes into the system? What biological process or processes
occur? What comes out? You do not need to design the complete biological system
yet. Make reasonable assumptions where necessary and identify them.
I think a cell-free protein system applied to a biofilm will become a primary
use case, and the use of E. coli as a living cell may become an economical and
scalable automation solution. So there are two unique constructs to use. I will
be researching exactly how we may go from a cell-free reagent to a material
substrate that can hold an image.
Biofilm in this instance is any substrate coated or manufactured with a
light-responsive surface: an agar lawn, a paper-based lawn, or even a ceramic
coated with a sample. The cell-free protein system would be activated by
distilled water and produce a recorded image on a variety of materials.
Living cell construct
Cell-free construct
Role
Economical, scalable automation solution
Cell-free protein system applied to a biofilm — the primary use case
Status
Current calibration baseline, using pDawn
Research direction
When I refer to the substrate, I intend to make my own paper
and apply an agarose medium with a bacterial flood, to see if I can record an
image onto recycled mashed fiber paper — which in itself is a fine art medium.
A cell-free protein system could help to accelerate an automated production process.
I am very interested in pDawn-Ag43, since that means we continue our pDawn
calibration with regard to swappable fluorescent reporters and a swappable
structural output.
I am specifically interested in the calcium carbonate and curli
route: I have been exploring the use of clay with kiln-fired glazes that react
with biochemical residues to create highly expressive color mutations in a
permanent, fired medium. We have a kiln, we have glaze, and we have Photoplasm —
another reason why we need a way to biomanufacture the light-responsive spatial
imaging systems.
The “take something with you” mentality applies to the need for a physical artifact, when created by the individual. That defines
the experiential process and artistic expression. Virtual and digital expreiences can also lead to an artifact, such as a shared image which will be available through camera optics found in the device.
The cell-free system is the light-sensing element, with a promoter and a
fluorescent reporter: a DNA sequence transcribed and translated to protein in a
cell-free protein synthesis reaction. From an example perspective, putting a
cell-free reaction into a substrate and exposing it to light may lead to a unique
definition of a recorded film layer.
I am steering away from spores and mycelium at this level, though an inert form
may lead to a follow-on discussion. Again, keeping scope closer to the production of a digital image or
a manufactured substrate as the permanent record.
Stage
Content
Inputs
DNA sequence — light-sensing element, promoter, fluorescent reporter; cell-free extract and energy mix; patterned light through an image mask; a substrate — agar, handmade paper, or fired clay
Process
Transcription and translation in the cell-free reaction, gated by light dose through the mask
Outputs
Primary: the digital image as the observable record. Secondary, next phase: the physical substrate carrying the recorded image
We are currently using pDawn as the calibration reference. My
own construct, BioLight_GenV10, is a clonal gene synthesized by Twist Bioscience;
its design source is the eLightOn system of Li et al. I want to make a plasmid
with cut sites that rely on Golden Gate or Gibson assembly, to be able to try
different reporters. The 470 nm figure is the input — it is what Photoplasm
currently emits.
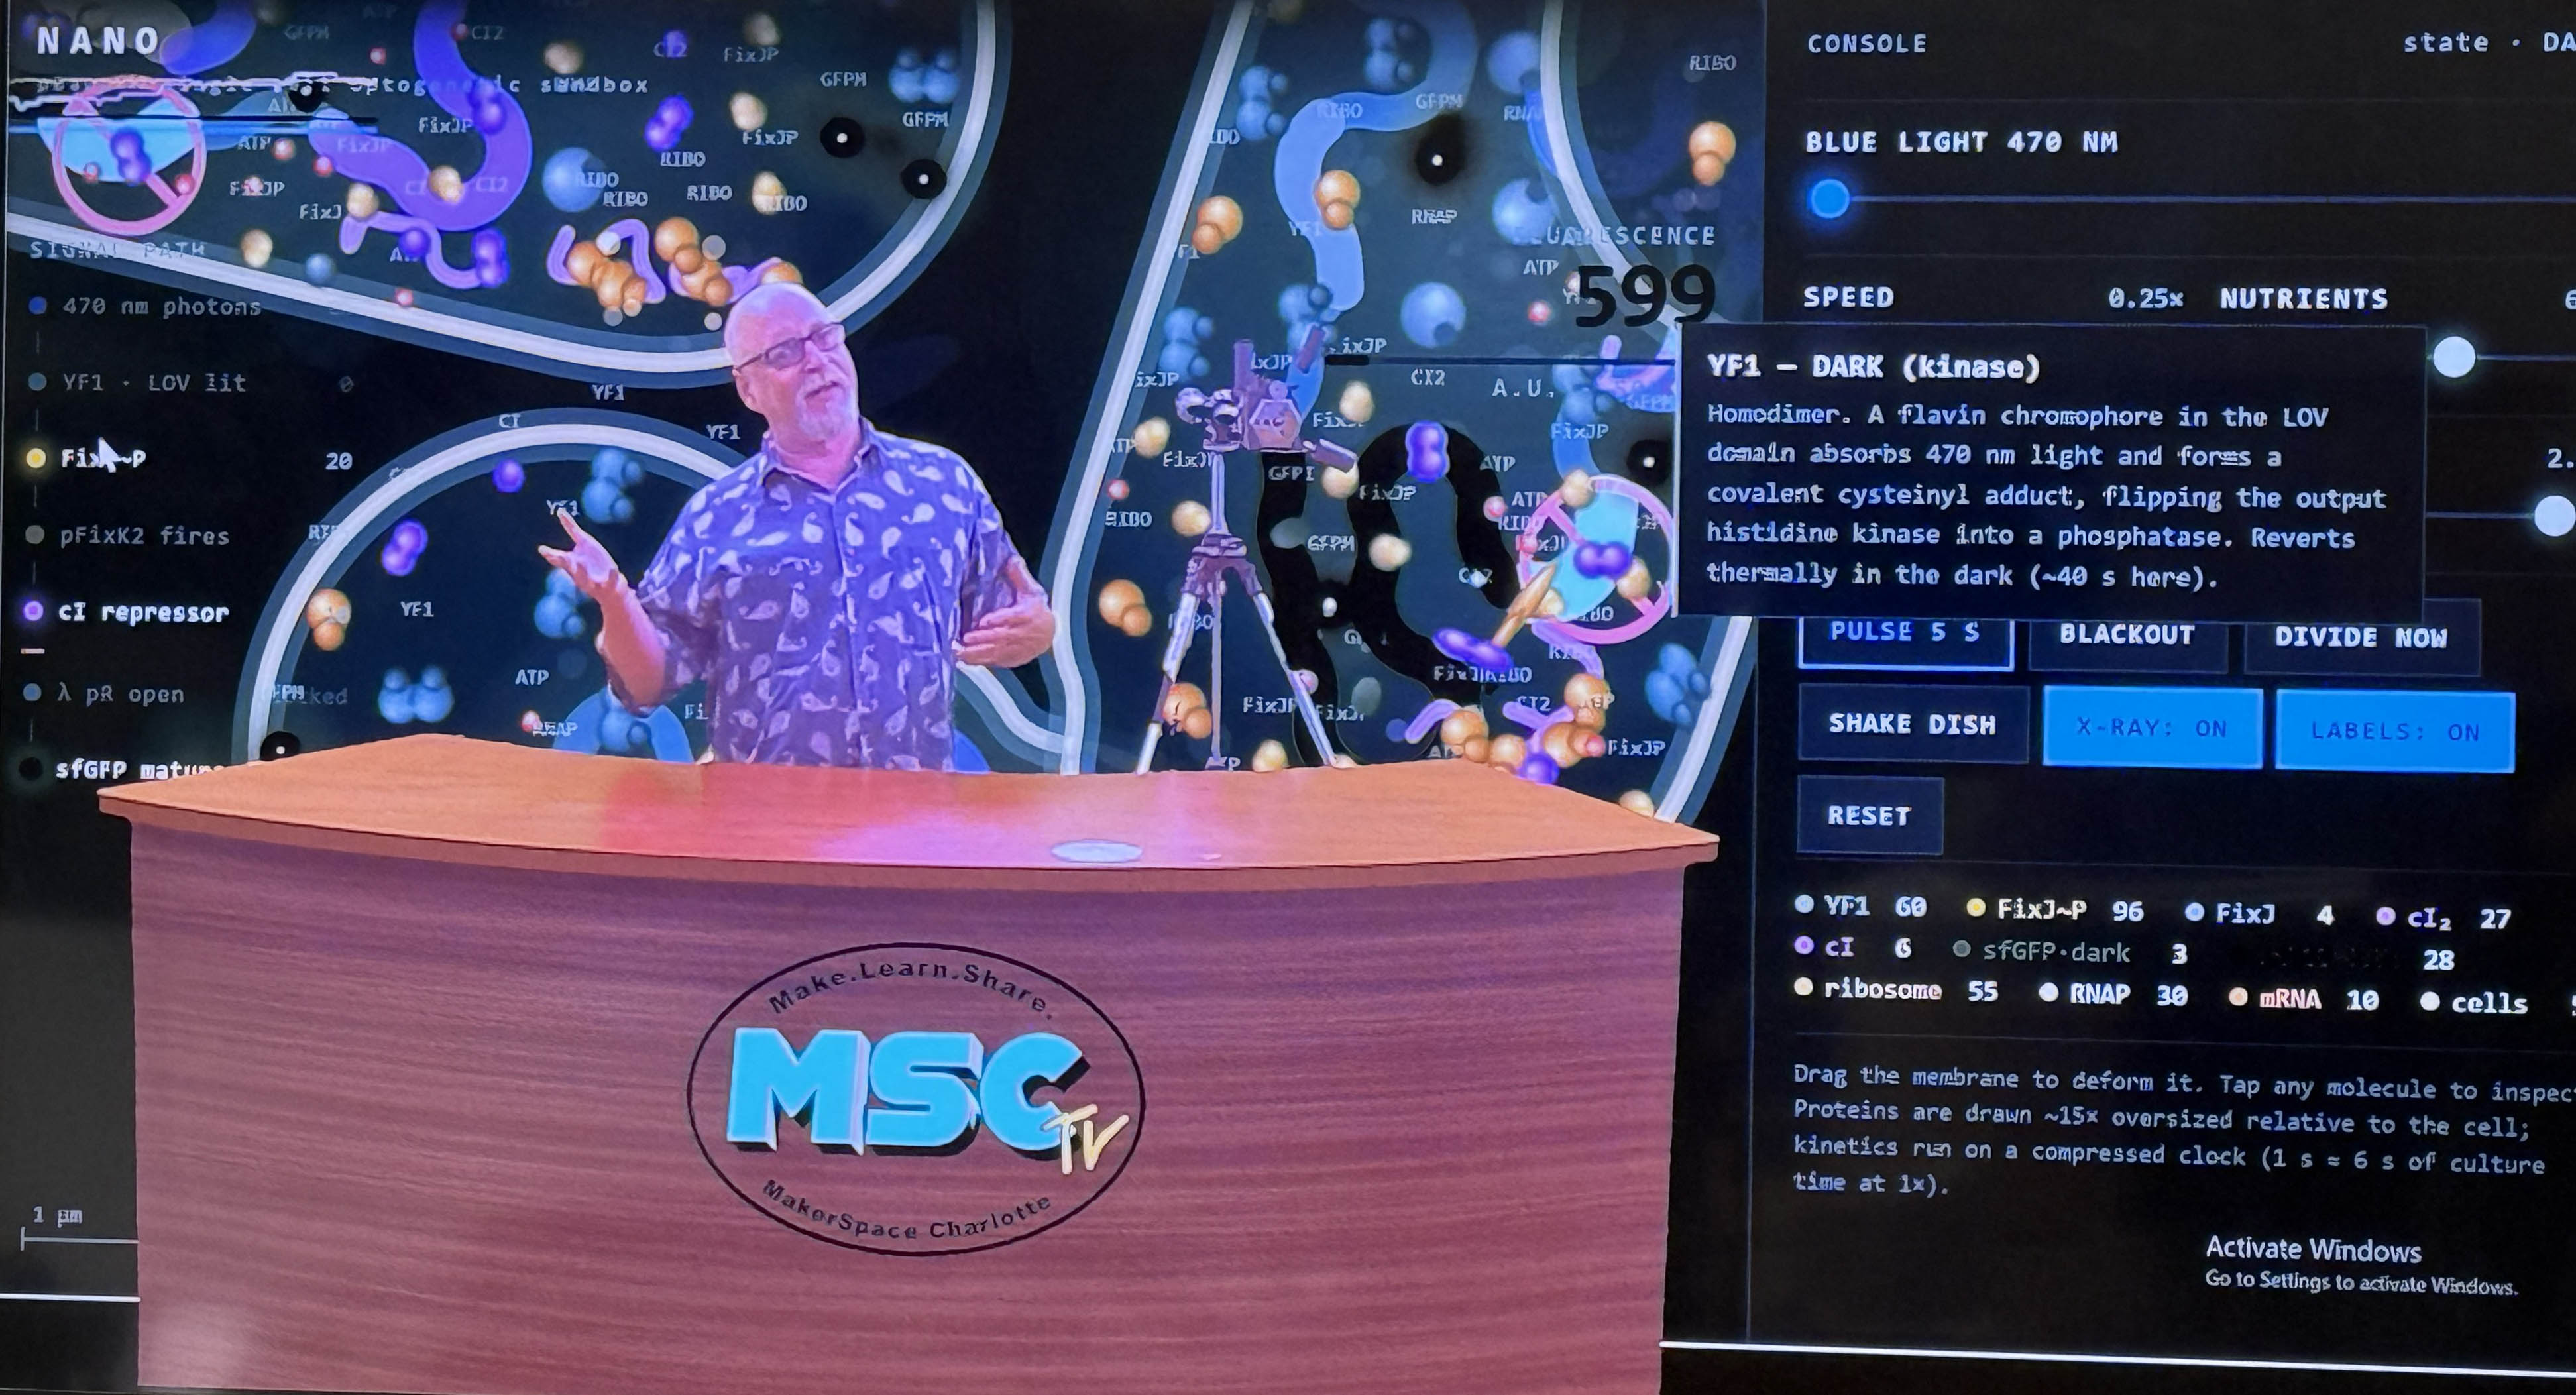
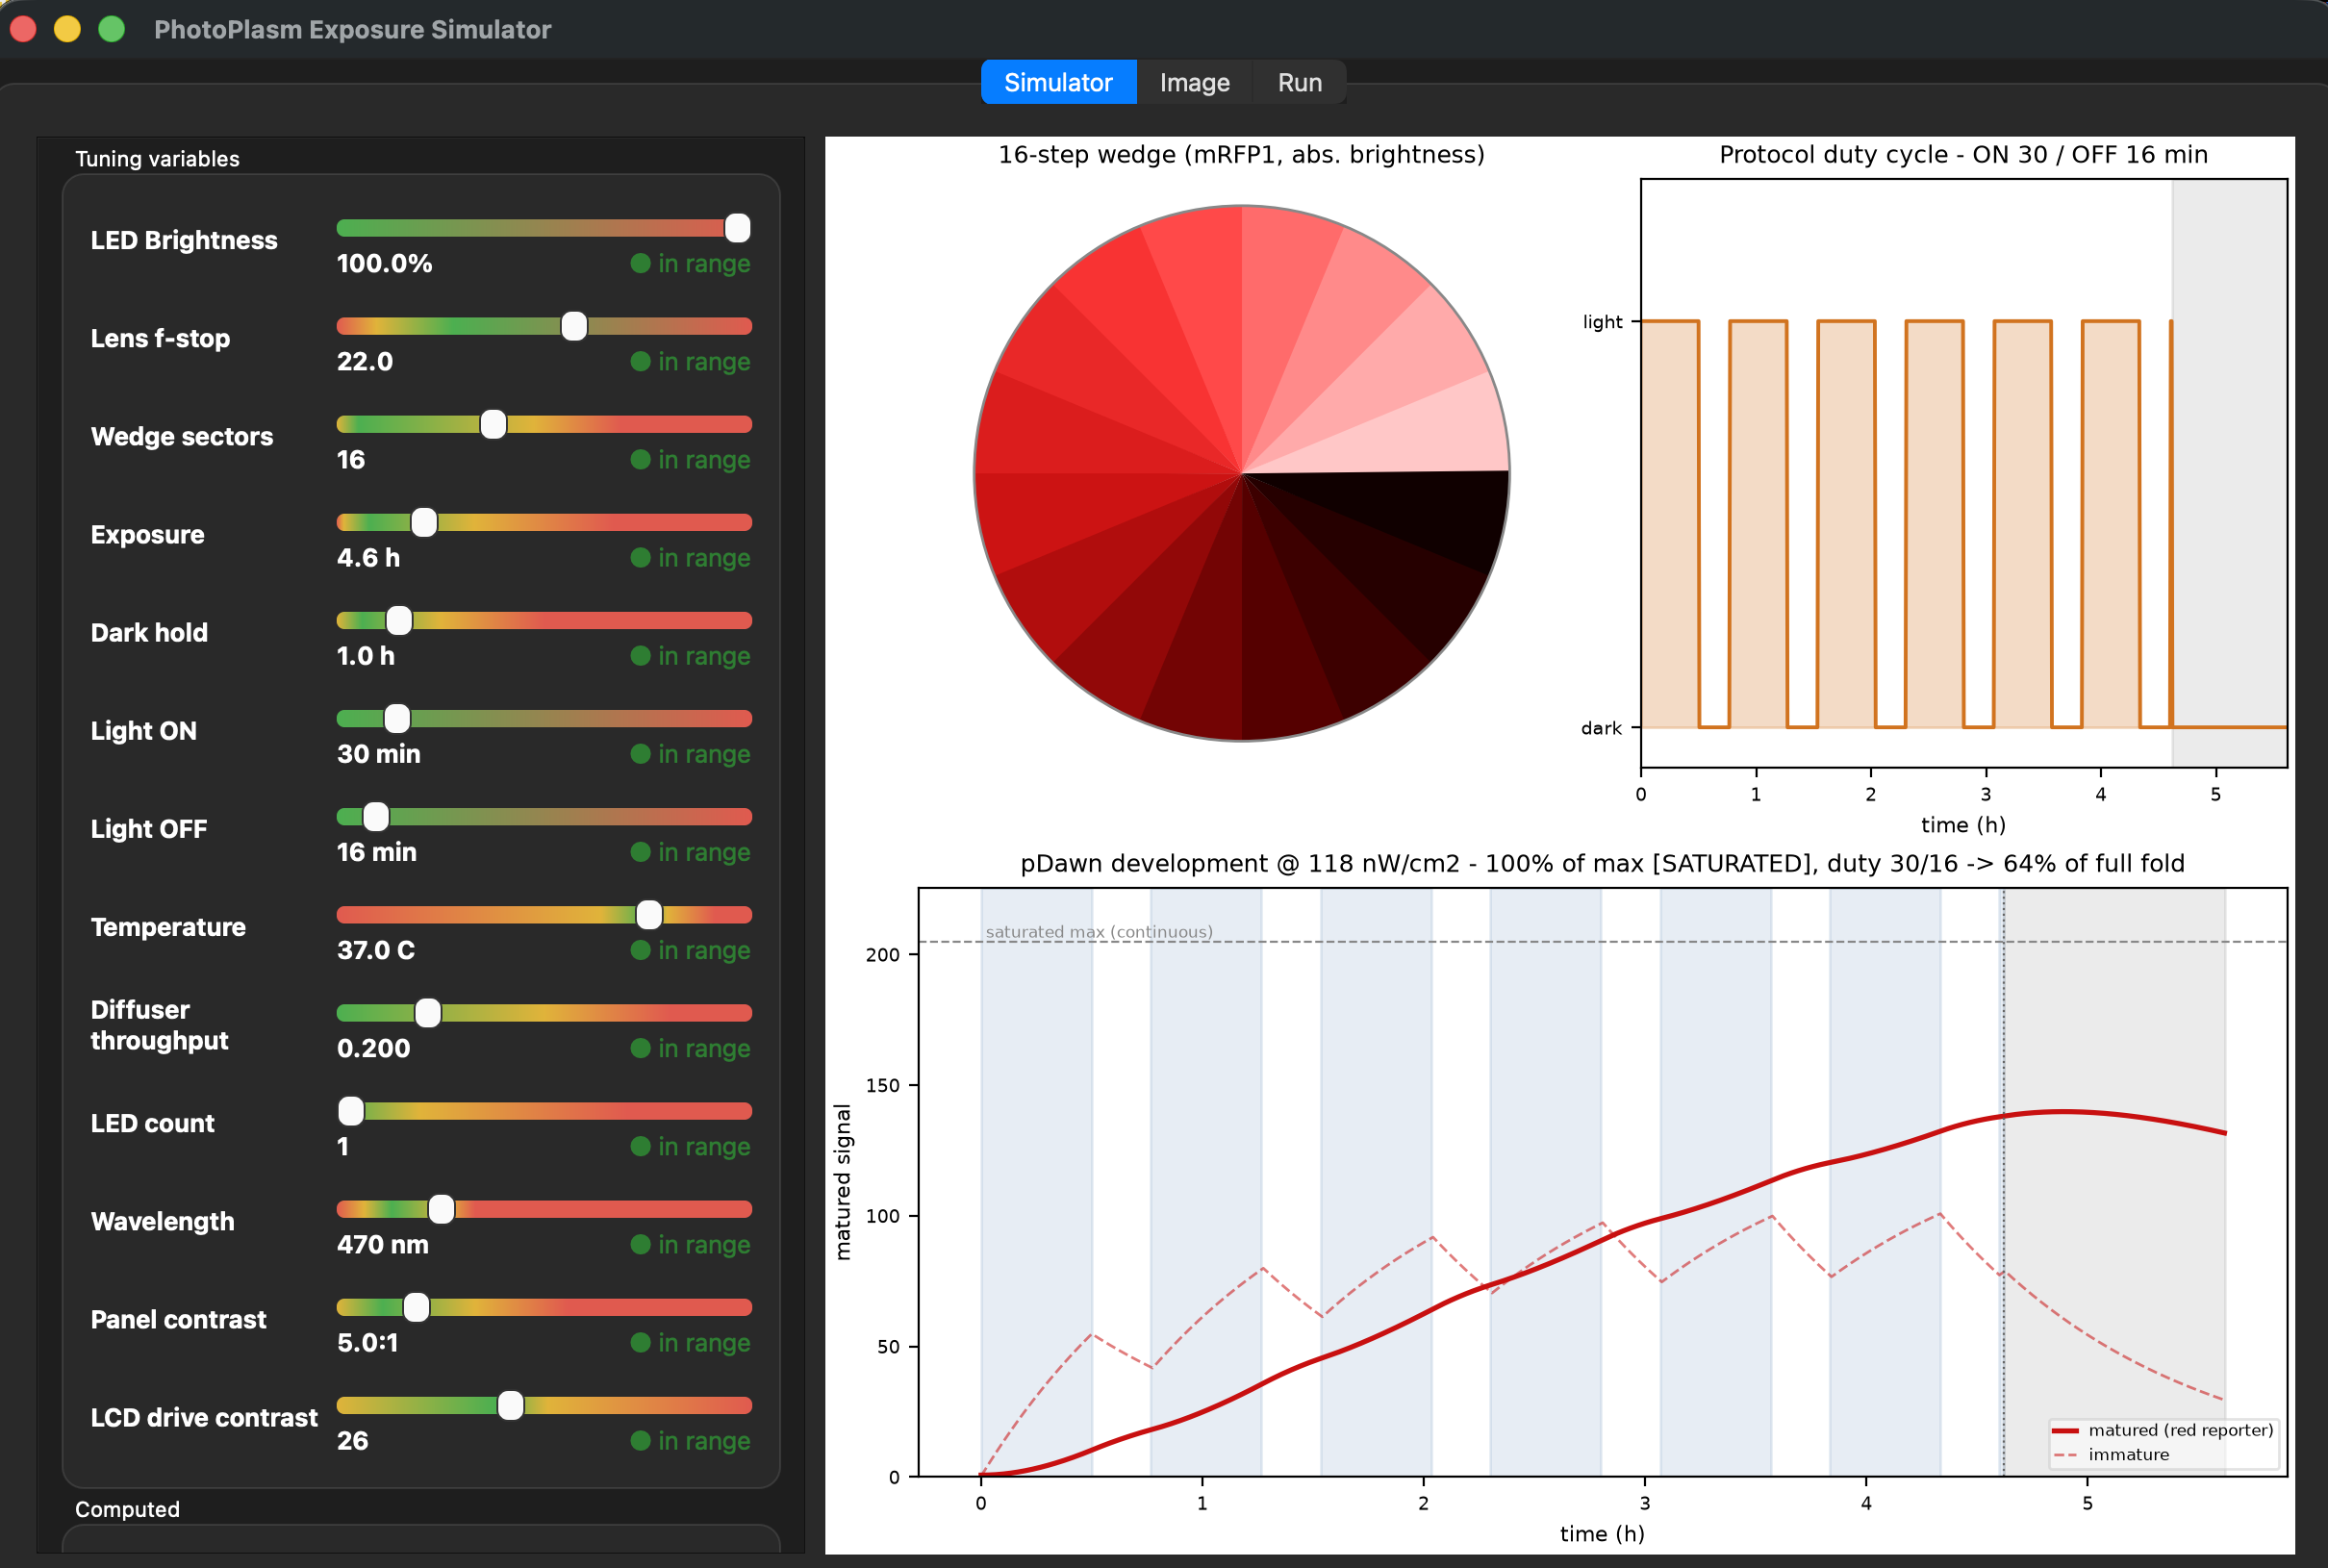
Photoplasm 1.0 Device Simulator
(3) How would you use automation?
Identify at least one automation technology that you
would combine with your living system. This could include a large-scale Cloud
Lab, a desktop liquid-handling robot such as an Opentrons, a programmable
microfluidics platform such as Nuclera’s, or another automation technology.
Describe what part of the biomanufacturing workflow you would automate and why.
For example, you might automate liquid handling, culturing, assembly,
screening, sampling, measurement, optimization, or another step.
The RAC is the Robotic Automation platform from Ginkgo Bioworks — the
Reconfigurable Automation Cart. The use of Twist is fully compatible, as they
synthesize clonal genes which would be the provider for my downstream colony
propagation or other synthetic biology constructs including cell-free systems.
I am seeking to use Ginkgo’s RAC system to create plates with an agarose lawn
containing my engineered and selected light-responsive culture. Then, through
petri dish handling robotics, transfer into a cylindrical light-emitting
projector, the Photoplasm “Beam.” The device includes an incubator module. I may
be able to modify the device to reside inside an existing incubator RAC module,
leading to multiple runs in one enclosed unit.
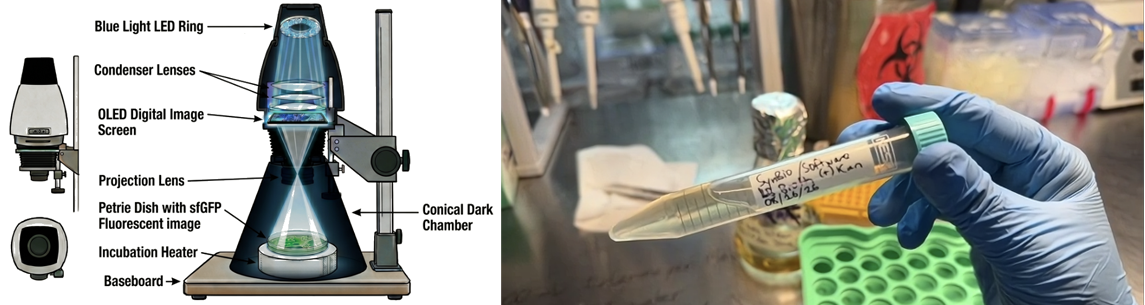
The Photoplasm “Beam” is a branch, and will contain its own optical stack,
deviating from the original 1.0 darkroom enlarger into a fully self-contained
manufacturing specification. The addition of RAC protocols means the design will
be directly influenced by — and integrated with — the RAC from the start: the
beginning of device development with a standardized automation platform.
There will always be an open-source “builder” version using petri dishes. I do
like the idea of a rectilinear mode for well plates, but I still see potential in
the petri dish form factor — the analogy is to photographic film formats, small,
medium and large: 35 mm, 4×5, 2¼ square. We will likely stay round as an
aesthetic.
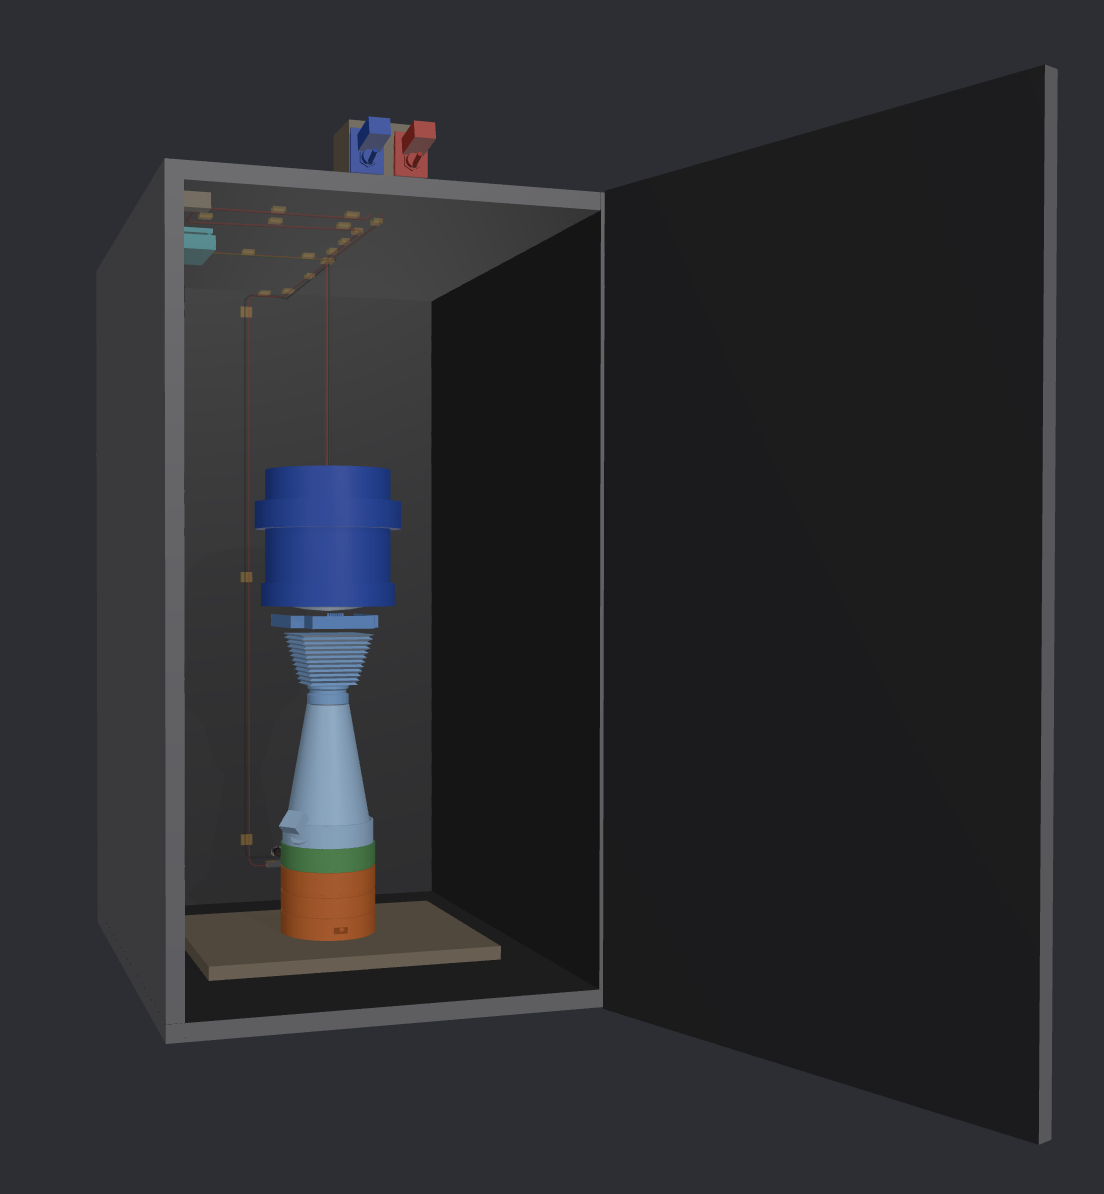
Photoplasm 1.0 Interactive 3D Visualization
The key is to provide repeatable, automated plating and light-responsive spatial
imaging in a robotic pipeline, to increase consistent throughput.
The device includes an image monitoring and capture phase, which leads to remote
monitoring. There is no human in the readout; camera sensors in the “Beam” do the
work.
It is a neural network of connected Photoplasm devices, with opt-in — or out —
to participate in a larger knowledge base.
The device will capture logs that can also be used for diagnostics in a customer
support model.
Workflow step
Automated here
Mechanism
Liquid handling
Plate creation — agarose lawn seeded with the selected light-responsive culture
RAC liquid handling
Transfer
Plate into the exposure device
Petri dish handling robotics
Culturing
Incubation during and after exposure
Beam incubator module, or a host incubator RAC module
Measurement
Image monitoring and capture; remote monitoring; device log capture
Camera sensors in the Beam; on-device logging
Optimization
Closed-loop adjustment in near real time; pattern-finding across pooled results
Data analysis on captured images; a neural network of connected Photoplasm devices
(4) How much would you need to make, and how long would it take?
Perform a back-of-the-envelope calculation estimating what it would take to manufacture your target at a meaningful scale.
(a) How much? Define a scale relevant to your project and calculate
approximately how much of your target product you would need to manufacture.
If you are producing an art or design artifact, define an appropriate scale
yourself. Clearly show your calculation, including units, assumptions, and
sources for important numbers.
The scale for this project is: how many light-responsive exposures can be
incubated? In a wet lab, one at a time, with one machine, operator attended —
that is about 2 per a normal eight-plus-hour day, five days a week. With
automation, the system runs 24/7, so one device can produce 4–6 images per day,
seven days a week. With two machines and an optimized metabolic load, perhaps we
strive for 3 hours for a high-contrast, high-fold-ratio result, running 24×7 with
an image queue in the automation pipeline.
There is a linear curve as more devices are introduced, but the data set grows
with every shared result.
Photoplasm 1.0 Exposure Time
A typical roll of film was 36 exposures, limited by the length of
film compacted into a light-tight canister. That is the unit adopted here: one
roll = 36 exposures, and the production target is one roll per day.
In our model, a group of 6 each making one image in a classroom or group setting
means that every day we can create one image every 4 hours with one purpose-made
device. If we had 6 devices, or “Beams,” in an automated RAC, we could reach 36
images per day. So building one locally and six remotely means a group of six can
build, calibrate and test, then quickly ramp up.
Operating point
Per hour
Per day
Per month
Per year
Manual, attended, 1 device
0.08
2
43
520
Automated, 1 device, 4 h cycle, 24/7
0.25
6
180
2,190
Automated, 6 devices, 4 h cycle, 24/7
1.5
36 = one roll per day
1,080
13,140
Automated, 6 devices, 3 h target, 24/7
2.0
48
1,440
17,520
Exposures. A month is 30 operating days and a year 365 for the automated
rows; the attended row runs 21.7 working days a month and 260 a year.
Cohort of 6, one image each
Time to serve the cohort
On 1 device at 4 h
24 hours — a full day
On 6 devices at 4 h
4 hours — one cycle, whole cohort at once
One exposure = one flood plate = one image. Cycle time
is an anticipated 4–6 hours for exposure on flood plates; actual time will be
observed. Throughput figures assume 24/7 operation and 100% yield.
The 4–6 hour cycle is cited from pDawn
from The ODIN, a bacterial culture that expresses DsRed. For BioLight_GenV10, the
design source is Li et al.’s eLightOn system, which indicates a 4–6 hour
incubation with a duty cycle of light on/off pulses to support the ratio of
light-emitting protein to non-emitting protein. The
definitive answer will come from our calibration protocol.
If we host the device in the
cloud, that is a fixed throughput that can grow as demand increases. If someone
wants to build the open-source device, they may benefit from repeated cloud
experiments. The platform then becomes a DIY kit — which is where a
non-replicating cell-free system comes in, as a differentiator: it ships no
living organism, so it reaches venues a living-system kit cannot. The ability to
ship as a kit to a school with an educational component means that optogenetics
reaches the classroom, and the cloud lab is waiting for your next scalable
production: a pipeline that extends into the community and feeds the cloud lab.
Low volume, high cost for the cell-free route; high volume, low cost for living
cells. Both are applicable.
(b) How long? Using your proposed living system and
automation technology, estimate how long it would take to manufacture that
amount. Consider quantities such as production rate, yield, volume, number of
parallel experiments or reactors, automation throughput, or whatever parameters
are most appropriate for your system. You may discover that the automation
technology you would use to prototype your system is very different from what
you would use to manufacture at scale. If so, describe both.
At six devices on a 4-hour cycle, one roll of 36 exposures takes one day.
Devices
4 h cycle
3 h cycle
1
6.0 days
4.5 days
2
3.0 days
2.2 days
6
1.0 day
0.8 days
In rolls, at six devices on a 4-hour cycle: one roll per day, 30 rolls per
month, 365 rolls per year. At the 3-hour target: 40 rolls per month and 487 per
year.
These differ in kind,
not degree. Photoplasm 1.0 is built upon a retrofitted photographic darkroom
enlarger, operated by hand. The Beam is designed for automation from the first
drawing, with its own optical stack and a self-contained manufacturing
specification, integrated with a standardized automation platform from the start.
“One-day Photoplasm Lab” is very similar to the one-hour
photo lab model.
(5) What don’t you know yet?
After completing your analysis, identify the 2–3 biggest
technical unknowns, bottlenecks, or assumptions in your proposed
biomanufacturing system. What would you need to learn, measure, or
experimentally determine to know whether your idea could actually work?
What does success look like? Material handling of a form factor through the RAC
system. Can we load a cylindrical “Beam” with success? This precedes the
biological experimentation, and it can be modeled and achieved in less than 14
weeks. In parallel, we explore the synthetic biology and proceed with the
community optogenetics project, to inform the result.
My next unknown will be related to cell-free systems. What sequence I choose will
be based on research, prior knowledge of canonical systems, cost of
manufacturing, and the path to engineering, synthesizing, lysating,
reconstituting, and calibrating with the light-responsive device.
Another unknown is what the pipeline would look like to create a living cell
culture that has a light-responsive biosensor expressing a color reporter, in a
cloud lab infrastructure. What would the cost comparison be to cell-free? With an
expectation that living cells may be less expensive to produce, what is the
trade-off in terms of accessibility and sustainability outside of a lab? Is there
a dual pathway?
In summary, for this section, I will analyze living cell systems and cell-free
protein systems in automated cloud labs, to optimize manufacturing time, cost,
and quality. This comparison will allow me to make strategic design decisions
that could lead to a successful launch of a solution founded on open-source
principles, with opportunities for funding models to support delivery at scale.
The definitive answer on cycle time will come from our calibration protocol.
Learning as a Solution
The biomanufacturing pipeline I am proposing is supported by an experiential
learning platform, which provides resources that inform the practitioner about
optogenetics. The Photoplasm device and synbio concepts reside in a growing
online library of connected learning activities which show how to build the
device itself, and will include visual explorations of light-responsive genetic
circuits and sensors. For HTBAA, I plan on introducing the digital twin of the
device for instructional learning, which will lead to wider adoption and
understanding, as well as remote operation and simulation. Once the device is built and can be used as a learning
tool in a makerspace setting, the ability for participants to create physical
artifacts derived from optogenetics supports the idea of “learning by doing.”
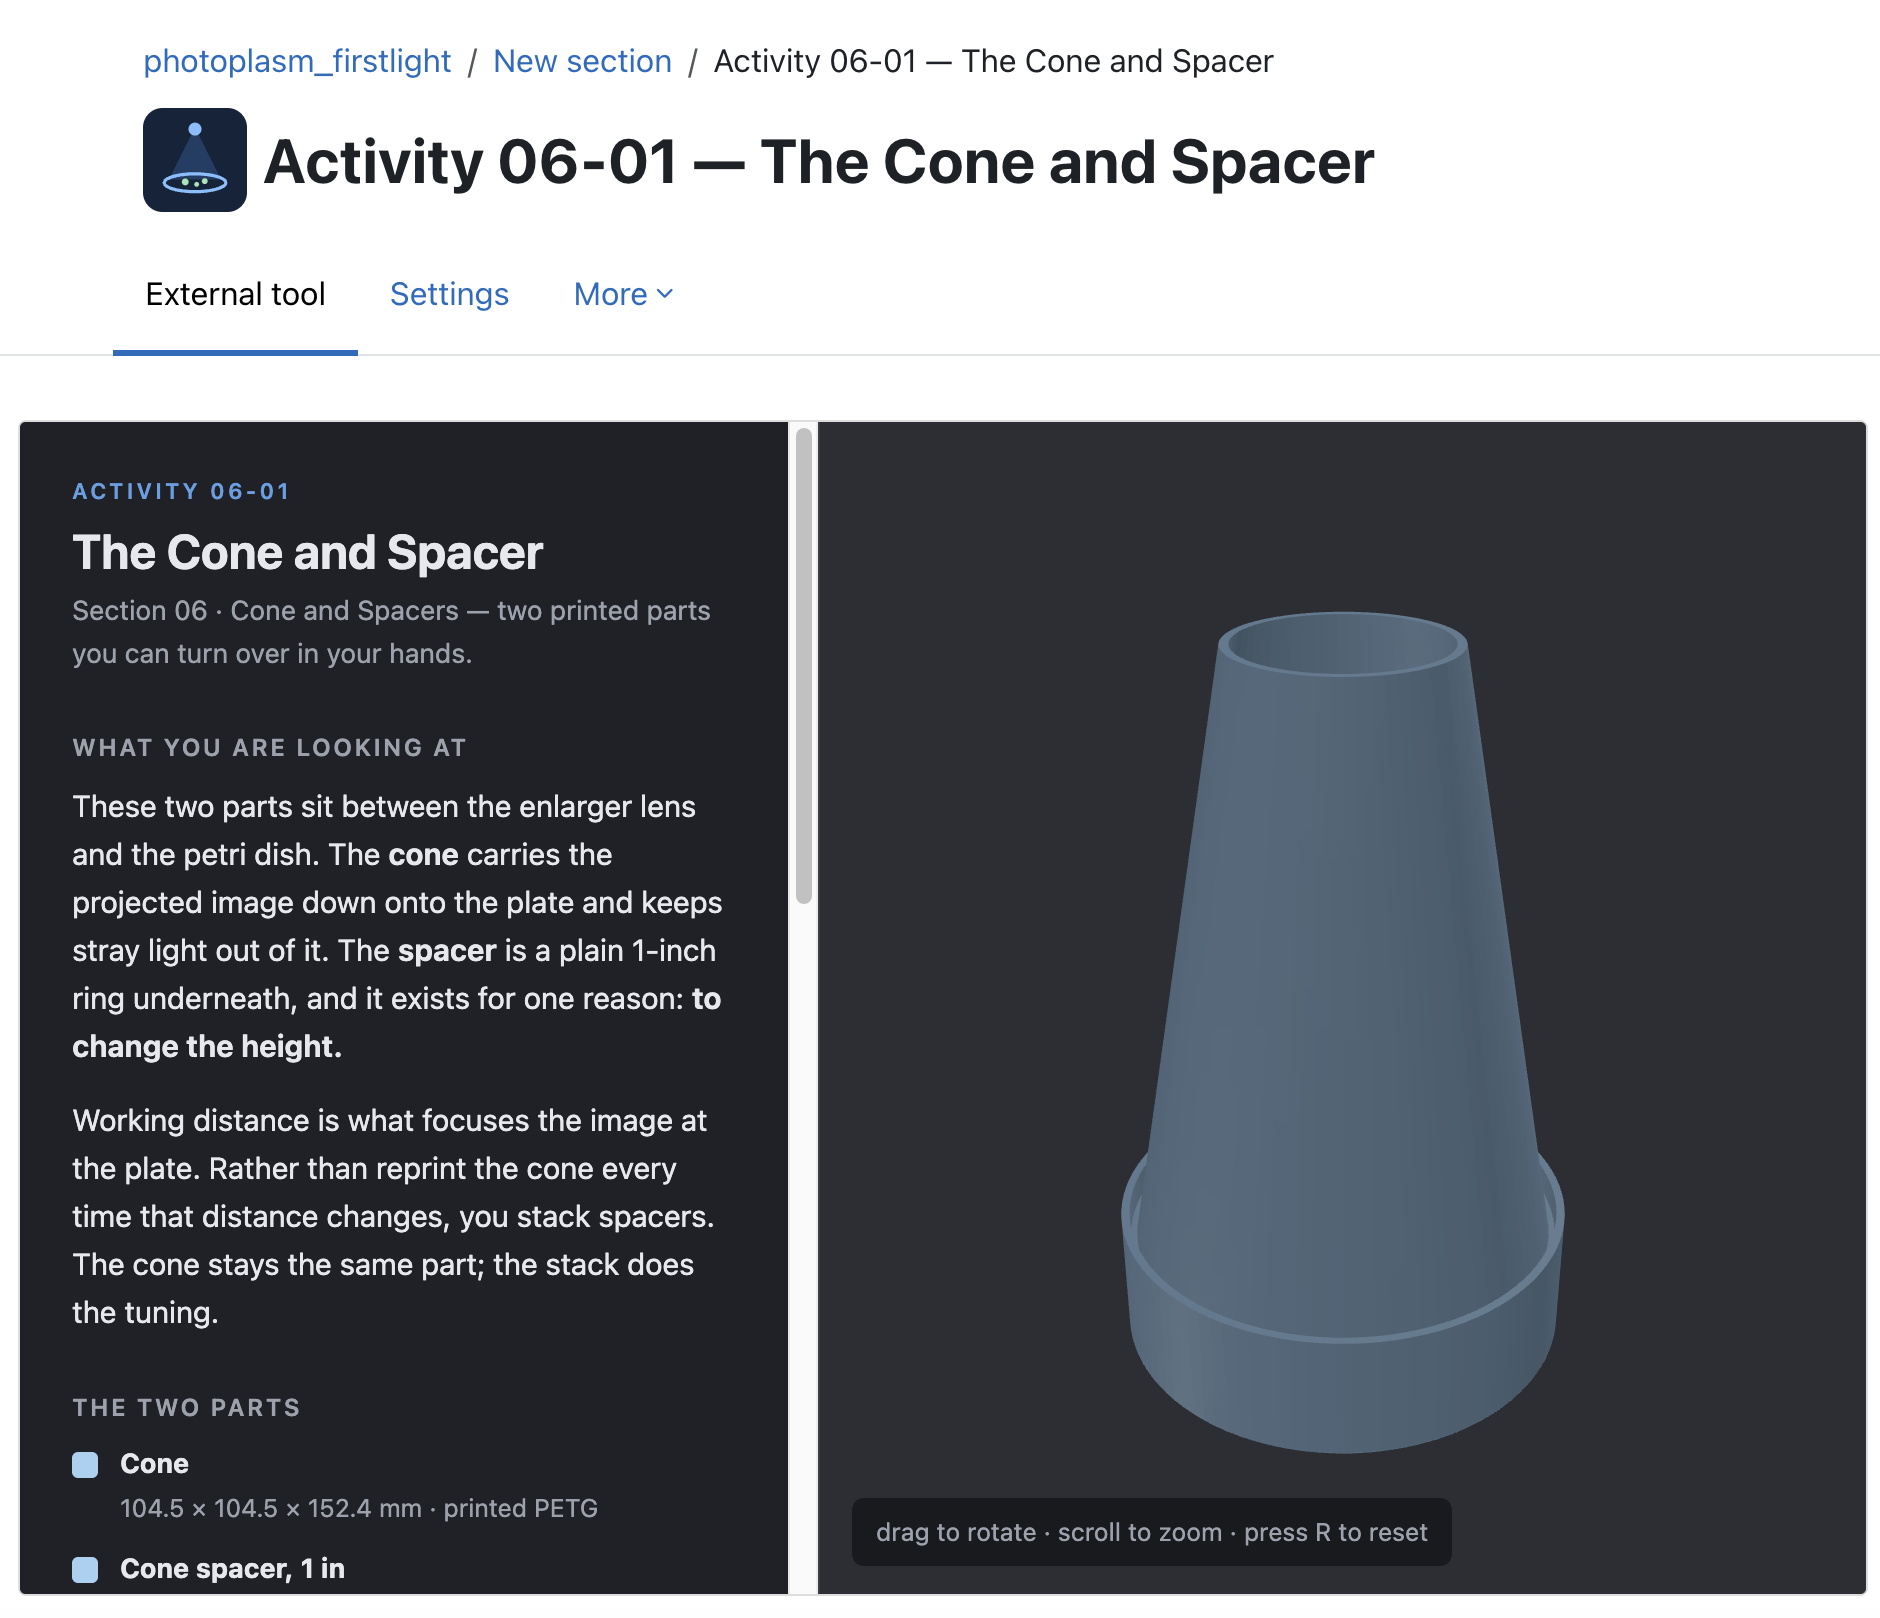
Photoplasm 1.0 Interactive eLearning Module
Conclusion
What I am doing is setting the stage for the return of the historical
neighborhood photo lab, where you would go get your film developed, then return
to pick up your photos — sometimes in an hour or less! If the future of AI and
personalized therapeutics stands, one day your corner optogenetics lab will
have your order synthesized and waiting. I plan to build out the model and
allow innovation to reach the community — in the same way the photo lab and
darkroom became a premier creative destination, supported by the photographic
industry. In a way, we are going from analog to digital, and back to analog.
HTBAA Homework #1 — Ai Framework with Claude Science (Opus 5)
The authoring framework was defined incrementally by the author across 120
prompts in one session, each new rule stated as an instruction, applied
immediately, versioned, and logged — so the method was built from the work rather
than imposed on it.
Session — 120 authored prompts, 1,087 total message records, 32 artifacts, 2026-09-17 to 09-20.
Agent role — mentor, not author: structure, verification and questions, with no assignment content unless co-authoring was requested, and every rule tagged handout-binding, author-binding or agent-advisory.
Baseline — the author’s first answers to the four framing questions frozen verbatim, with 10 revisions recorded beneath them as timestamped addenda, for authorship provenance.
Documents — a clean submission draft in the author’s voice (v1.36) kept separate from a working file, a mentor memory, and a verbatim record of every prompt.
Citations
Original references — provided with the course
Assigned readings and course materials issued with the assignment. Author lists
follow the publisher record.
Asin-Garcia, E., Fawcett, J. D., Batianis, C., & Martins dos Santos, V. A. P. (2025). A snapshot of biomanufacturing and the need for enabling research infrastructure. Trends in Biotechnology, 43(5), 1000–1014. https://doi.org/10.1016/j.tibtech.2024.10.014
Averesch, N. J. H., Berliner, A. J., Nangle, S. N., Zezulka, S., Vengerova, G. L., Ho, D., Casale, C. A., Lehner, B. A. E., Snyder, J. E., Clark, K. B., Dartnell, L. R., Criddle, C. S., & Arkin, A. P. (2023). Microbial biomanufacturing for space-exploration—what to take and when to make. Nature Communications, 14, 2311. https://doi.org/10.1038/s41467-023-37910-1
Petzold, C. J., & Mukhopadhyay, A. (2025). From bench to biofactory: High-throughput technologies and automated workflows to accelerate biomanufacturing. Current Opinion in Biotechnology, 94, 103320. https://doi.org/10.1016/j.copbio.2025.103320
Rasor, B. J., Vögeli, B., Landwehr, G. M., Bogart, J. W., Karim, A. S., & Jewett, M. C. (2021). Toward sustainable, cell-free biomanufacturing. Current Opinion in Biotechnology, 69, 136–144. https://doi.org/10.1016/j.copbio.2020.12.012 ¹
Yap, W. S., Choudhury, D., & Suntornnond, R. (2023). Towards biomanufacturing of cultured meat. Trends in Biotechnology, 41(3), 292–294. https://doi.org/10.1016/j.tibtech.2023.01.014
Ye, J.-W., Lin, Y.-N., Yi, X.-Q., Yu, Z.-X., Liu, X., & Chen, G.-Q. (2023). Synthetic biology of extremophiles: A new wave of biomanufacturing. Trends in Biotechnology, 41(3), 342–357. https://doi.org/10.1016/j.tibtech.2022.11.010
Zhang, Y.-H. P., Sun, J., & Ma, Y. (2017). Biomanufacturing: History and perspective. Journal of Industrial Microbiology & Biotechnology, 44(4–5), 773–784. https://doi.org/10.1007/s10295-016-1863-2
How to BioManufacture (Almost) Anything — Class #1 Reading List [Annotated project reading list]. Internal working document.
Conducted research — located during this work
Sources found independently in the course of answering the assignment, resolved
against GenBank, Crossref, PubMed and Europe PMC rather than from recall.
Gregorio, N. E., … Oza, J. P. (2020). Unlocking applications of cell-free biotechnology through enhanced shelf life and productivity of E. coli extracts. ACS Synthetic Biology, 9(4). https://doi.org/10.1021/acssynbio.9b00433
Huang, A., … Collins, J. J. (2018). BioBits Explorer: A modular synthetic biology education kit. Science Advances, 4(8), eaat5105. https://doi.org/10.1126/sciadv.aat5105
Huang, A., … Stark, J. C. (2022). Implementing hands-on molecular and synthetic biology education using cell-free technology. Methods in Molecular Biology. https://doi.org/10.1007/978-1-0716-1998-8_25
Jayaraman, P., Yeoh, J. W., Jayaraman, S., Teh, A. Y., Zhang, J., & Poh, C. L. (2018). Cell-free optogenetic gene expression system. ACS Synthetic Biology, 7(4), 986–994. https://doi.org/10.1021/acssynbio.7b00422
Möglich, A. (n.d.). pDawn (Plasmid #43796) [Plasmid]. Addgene. http://n2t.net/addgene:43796 (RRID:Addgene_43796)
Expression vector pDawn, complete sequence (GenBank accession JN579121.1) [Nucleotide record]. National Center for Biotechnology Information. https://www.ncbi.nlm.nih.gov/nuccore/JN579121.1
Ohlendorf, R., Vidavski, R. R., Eldar, A., Moffat, K., & Möglich, A. (2012). From dusk till dawn: One-plasmid systems for light-regulated gene expression. Journal of Molecular Biology, 416(4), 534–542. https://doi.org/10.1016/j.jmb.2012.01.001
Shivakumar, T., … Williams, P. M. (2025). A design of experiments approach for enhancing room temperature stability of a lyophilised and paper-based bacterial cell-free system. Bioengineering, 12(3), 223. https://doi.org/10.3390/bioengineering12030223
Smith, M. T., … Bundy, B. C. (2014). Lyophilized Escherichia coli-based cell-free systems for robust, high-density, long-term storage. BioTechniques, 56(4), 186–193. https://doi.org/10.2144/000114158
Stark, J. C., … Jewett, M. C. (2018). BioBits Bright: A fluorescent synthetic biology education kit. Science Advances, 4(8), eaat5107. https://doi.org/10.1126/sciadv.aat5107
Stark, J. C., … Jewett, M. C. (2019). BioBits Health: Classroom activities exploring engineering, biology, and human health with fluorescent readout. ACS Synthetic Biology, 8(5). https://doi.org/10.1021/acssynbio.8b00381
Williams, L. C., Gregorio, N. E., So, B., Kao, W. Y., Kiste, A. L., Patel, P. A., Watts, K. R., & Oza, J. P. (2020). The Genetic Code Kit: An open-source cell-free platform for biochemical and biotechnology education. Frontiers in Bioengineering and Biotechnology, 8, 941. https://doi.org/10.3389/fbioe.2020.00941
Zhang, P., Yang, J., Cho, E., & Lu, Y. (2020). Bringing light into cell-free expression. ACS Synthetic Biology, 9(8), 2144–2153. https://doi.org/10.1021/acssynbio.0c00211
Week 2 HW: DNA Design
HTBAA Homework #2 — Final Draft
pColorWheel: Light-Patterned Biomanufactured Paper
Popcorn Pop Art Generator
Project Summary
The pColorWheel project crystallized through 12 major design decisions. The path moved from building Popcorn (an SBOL-inspired simulator) while awaiting Kernel access, to obtaining access and shifting to live Kernel part creation, to recognizing that the subtractive color mechanism required three integrated layers (living biofilm → cell-free synthesis → paper substrate), to establishing paper production as the core platform with ceramics as a secondary extension.
The final construct design builds on pDawn (Jin & Riedel-Kruse 2018) for light-responsive biofilm patterning and engineered curli (Nguyen et al. 2014) for programmable surface display. The build strategy (synthetic order for calibration → Gibson assembly for modular exploration → chip synthesis for scale) balances validation with scalability.
The three core unknowns are all tied to making the paper production work: pH-indicator response, spatial resolution, and color stability.
Part 0 — Kernel Setup
Where are you building this?
I logged into Asimov Kernel through a prior Genspace account and joined the HTBAA 2026 workspace. My project repository is HTBAA26_Genspace and my folder is Eric Schneider. I used Kernel to deconstruct existing parts from pDawn-sfGFP and to begin prototyping the two-reporter constructs.
Part 1 — Define Your Expression Target
What molecules are you expressing, and where do they come from?
I am expressing two reporters, one for each color space. For additive light (fluorescent, emitted), the reporter is sfGFP from pDawn-sfGFP. For subtractive light (pigment on substrate), the reporter is CsgA, the major curli subunit from E. coli K-12. Both are expressed under blue-light control (pDawn, 470 nm, YF1/FixJ).
Detailed Answer
Additive reporter — sfGFP (fluorescent protein):
Source: pDawn-sfGFP (Addgene #107741), published in Jin & Riedel-Kruse, PNAS 115(14):3698–3703 (2018)
Backbone: GenBank JN579121.1 (Ohlendorf et al., 2012)
Size: 238 amino acids
Behavior: Stays soluble in cytoplasm, emits light under 488 nm excitation
Light control: Blue-light responsive promoter (pDawn), YF1-FixJ photoreceptor system
Source: UniProt P28307 (csgA, E. coli K-12 MG1655)
Sequence: RefSeq NC_000913.3, 151 amino acids
Signal peptide: Residues 1–20 (secretion signal)
Behavior: Secreted, self-assembles into amyloid nanofibers on cell surface
Host requirement: csgA-deletion strain that retains the rest of curli export machinery (CsgG, CsgE, CsgF, CsgB nucleator)
Key distinction: Both are proteins, but distinguished by what they do and where they go. The additive reporter is fluorescent and cytoplasmic (light-emitting). The subtractive reporter is structural and surface-deposited (light-absorbing/reflecting, building a physical spatial record).
Chassis: Single host (E. coli K-12) drives both outputs via the same blue-light control layer (470 nm).
Part 2 — Design Your Genetic Parts
What are the parts you will use to build these constructs?
The parts are: pDawn promoter (blue-light responsive), RBS (Shine-Dalgarno, E. coli standard), sfGFP coding sequence (238 aa), CsgA coding sequence (151 aa with signal peptide), rrnB T1 terminator, pBR322 origin, and kanR selection marker. All parts are standard prokaryotic parts compatible with E. coli cloning.
Parts Register
Part
Type
Sequence source
Justification
pDawn promoter
Inducible promoter
GenBank JN579121.1
Blue-light responsive operator; YF1-FixJ binding site
Major curlin subunit, 151 aa, signal peptide intrinsic
rrnB T1 terminator
Transcription terminator
pDawn backbone
Standard terminator
pBR322 origin
Origin of replication
pDawn backbone
Medium-copy replication
kanR
Selection marker
pDawn backbone
Kanamycin resistance
All parts created in Kernel with correct types (Promoter, RBS, CDS, Terminator, Origin, Marker) and registered in the parts library.
Part 3 — Assemble Your Construct
How do the parts go together in the final constructs?
The pDawn-sfGFP construct has the pDawn promoter, RBS, sfGFP CDS, and terminator in series, ending in the pBR322-kanR vector backbone. The pDawn-CsgA construct is identical except CsgA replaces sfGFP. Both are assembled in 5’ to 3’ order with reading frames checked: ATG start, no internal stops, TGA/TAA/TAG stop.
[AUTHOR CAVEAT: Construct maps will be rendered and exported from Kernel as part of the D3-FINAL workflow. Schematic placeholder pending Kernel export.]
Part 4 — Optimize and Quality-Check
How do you optimize the constructs and verify safety?
Kernel runs codon optimization (avoiding BamHI/XhoI sites, maintaining 45–55% GC, eliminating rare codons), BLAST search against NCBI nr and UniProt databases, and a safety screen for pathogenic sequences or toxins.
Expected Results
Codon optimization (pending Kernel execution):
Constraints: No BamHI/XhoI sites (preserve MCS), GC content 45–55%, no rare codons
sfGFP: 238 aa → optimized
CsgA: 151 aa → optimized
BLAST search (pending Kernel execution):
sfGFP: Expected 100% match to Aequorea victoria GFP (UniProt P42212)
CsgA: Expected 100% match to E. coli K-12 csgA (UniProt P28307)
Safety screen (pending Kernel execution):
pDawn-sfGFP: No pathogenic sequences, antimicrobial resistance, or toxin systems flagged. pBR322 and kanR are standard non-pathogenic markers.
pDawn-CsgA: No flagged concerns. CsgA is a structural biofilm protein, not a virulence factor.
[AUTHOR CAVEAT: Kernel tools (codon optimization, BLAST, safety screen) were planned but not executed in this draft. These sections reflect expected processes pending actual Kernel workflow execution. Per framework §3, an honest caveat about what could not be run is acceptable.]
Part 5 — From Design to Build
Popcorn Pop Art Generator
What is the biomanufacturing platform, and how will you build it?
pColorWheel is a light-patterned biological paper made from three integrated layers: living cell biofilm patterned under blue light, cell-free protein synthesis producing colored proteins that bind the biofilm, and paper substrate pre-coated with pH-responsive indicator that develops color when the cell-free reaction diffuses into the fibers. Build method: synthetic DNA order (Addgene) for calibration, Gibson assembly for modular exploration, chip oligo synthesis for scale.
The Platform
The primary deliverable is a light-patterned biological paper — a biomanufactured material made from living E. coli cells and cell-free protein synthesis.
Three integrated layers:
Living cell layer: Cells expressing pDawn-CsgA pattern a biofilm under blue light (470 nm). CsgA self-assembles into amyloid nanofibers on the cell surface, creating a spatial map of the light pattern.
Cell-free color layer: A cell-free protein synthesis (CFPS) reaction produces a colored protein (GFP-family chromoprotein or pH-responsive indicator) that binds to the deposited curli biofilm.
Paper substrate layer: Pre-coat paper with a pH-responsive indicator. When CFPS reaction runs with distilled water as carrier, reaction outputs (pH shift, metabolites, color-binding proteins) diffuse into the paper matrix and trigger color development in the fibers. The color is made within the paper, not added to it.
Platform value: Encodes biological information into a solid-state material. The light pattern controls what gets made and where; CFPS + paper substrate scale the output.
Ceramics is a secondary artistic extension: patterned paper can be fired with collaborators to create permanent glazed versions, but the core platform’s value is paper production itself.
Build Strategy: Staged Synthesis
Phase 1 — Calibration (synthetic DNA order from Addgene): Order complete pDawn-sfGFP and pDawn-CsgA constructs as synthesized DNA (Twist Bioscience, IDT). Baseline calibration — verified sequences that establish light-response dynamics and biofilm patterning before additional complexity.
Phase 2 — Modular assembly (Gibson assembly or Golden Gate): Once calibration constructs are working, introduce genes of interest (alternative chromoproteins, binding domains, pH-responsive proteins). Gibson assembly enables in-frame fusion of new CDS into MCS; Golden Gate allows hierarchical cloning of multiple parts in one reaction.
Phase 3 — Reagent-driven color expression: Final construct optimized for cell-free protein synthesis and tested with pH-indicator paper substrate. CFPS reaction conditions tuned to paper’s pre-coating chemistry and chromoprotein’s maturation kinetics.
Synthesis Feasibility
Both constructs are ~4.5–5 kb (pBR322 backbone ~4.4 kb + sfGFP 0.7 kb or CsgA 0.45 kb + regulatory sequences 0.2 kb), well within the standard synthetic DNA order limit (10 kb). No GC-rich regions, poly(A) tracts, or problematic secondary structures expected.
Constraints applied: Codon optimization, no internal BamHI/XhoI sites, no rare codons, GC content 45–55%.
Assembly viability: Fragment-based Gibson assembly is viable — pDawn-MCS can be synthesized as fragments (5’ promoter-RBS, middle CDS, 3’ terminator-vector) and assembled in one reaction. Chip-based oligo synthesis (Kosuri et al. 2010, Tian et al. 2004) is also viable for production scale — 5 kb constructs are routine for programmable DNA synthesis, and modular structure maps cleanly to oligo tiling and error correction.
Part 6 — What Don’t You Know Yet?
What are the three biggest technical unknowns?
Unknown 1: Does the pH-indicator paper actually respond to the CFPS output? Unknown 2: Does the spatial resolution of the light pattern survive diffusion through biofilm and paper? Unknown 3: How stable is the color over time and environmental conditions?
Unknown 1: pH/Reagent Response in Paper Matrix
The problem: CFPS produces a pH shift and metabolites. Pre-coated paper carries an indicator that changes color within a pH range. Does diffusion into the matrix and indicator activation produce visible, stable color?
How to find out: Run CFPS reaction in contact with small pieces of pre-coated pH-indicator paper (calibrated to expected CFPS pH range). Image paper over time to measure color intensity and spatial uniformity. Compare different indicator coatings (anthocyanins, bromocresol green, pH-responsive dyes) to find the best reporter for CFPS kinetics.
Unknown 2: Spatial Resolution Through the Pipeline
The problem: Light pattern controls biofilm at ~25 µm resolution (pDawn biofilm lithography). Does that pattern survive transfer to CFPS (diffusion into cell-free reaction) and then to paper (diffusion into fibers), or does it blur?
How to find out: Pattern pDawn-CsgA biofilm under controlled illumination (stripes, grids, or image projected via Beam device). Run CFPS on biofilm in contact with pH-indicator paper. Image resulting paper at high magnification (confocal if fluorescent, optical microscopy otherwise) and measure edge sharpness of color transitions. Correlate against original light pattern to quantify resolution loss.
Unknown 3: Color Stability and Environmental Persistence
The problem: How long does color remain stable in paper? Over what timescales (hours, days, weeks)? Under what conditions (light, humidity, temperature)? “Permanent biological record” requires stability over months or years.
How to find out: Make patterned papers with different indicator coatings and CFPS color proteins. Store samples in controlled conditions (dark, ambient light, 4°C, room temperature, 37°C, varying humidity) and measure color intensity and hue retention periodically. Run accelerated stability tests (light exposure, moisture cycling, heat) to predict long-term stability.
Citations
Primary Literature
Gibson, D. G., et al. (2009). Enzymatic assembly of DNA molecules up to several hundred kilobases. Nature Methods, 6(5), 343–345. https://doi.org/10.1038/nmeth.1318
Jin, X., & Riedel-Kruse, I. H. (2018). Biofilm lithography enables high-resolution cell patterning via optogenetic adhesin expression. Proceedings of the National Academy of Sciences, 115(14), 3698–3703. https://doi.org/10.1073/pnas.1720676115
Kosuri, S., et al. (2010). Scalable gene synthesis by selective amplification of DNA pools from high-fidelity microchips. Nature Biotechnology, 28(12), 1295–1299. https://doi.org/10.1038/nbt.1716
Nguyen, P. Q., et al. (2014). Programmable biofilm-based materials from engineered curli nanofibres. Nature Communications, 5(1), 4945. https://doi.org/10.1038/ncomms5945
Ohlendorf, R., Vidavski, R. R., Eldar, A., Moffat, K., & Möglich, A. (2012). From dusk till dawn: one-plasmid systems for light-regulated gene expression. Journal of Molecular Biology, 416(4), 534–542. https://doi.org/10.1016/j.jmb.2012.01.001
Course Readings
Elowitz, M. B., & Leibler, S. (2000). A synthetic oscillatory network of transcriptional regulators. Nature, 403(6767), 335–338. https://doi.org/10.1038/35002125
Tools and Databases
Kernel (Asimov). Accessed 2026-09-29 via HTBAA 2026 workspace.
Per HTBAA homework framework §3 (R-27): “Please also cite your AI client and prompts.”
Session Summary: 100+ turns (500+ total messages including author questions, AI responses, tool results, revisions, and auditor findings across the full conversation)
This log records all AI interactions used to develop the assignment. Entries are written as the work happens, not reconstructed afterwards. The author’s prompt is quoted verbatim; AI outputs and author actions follow.
Date
Client / model
Author’s prompt (quoted)
What the AI produced
What the author did
2026-09-29
Claude Science (Claude Opus)
“HW#2: follow my framework for finishing this assignment:” (handout attached)
Framework scaffold: Parts 0–6 structure, coverage tracker (33 rows extracted from handout), baseline question set, section containers mirroring assignment structure, duplication-seam map, reading list with DOIs and author lists (flagged unverified). No assignment content.
Built baseline answer and design statements to unlock the framework. Froze Q0-BASELINE responses verbatim.
2026-09-29
Claude Science
“my key question, can this be synthesized as a cell free lysate with a ~470nm light responsive operator”
Literature search: PubMed queries for cell-free optogenetics + pDawn dynamics. Fetched two relevant papers (ACS SynBio 2020, ACS SynBio 2017). Design memo (mentor voice) verifying pDawn cell-free compatibility and protocol conditions. Decision log DL-1 through DL-12 began.
Transcribed design decisions, confirmed cell-free route was viable, moved to live part analysis.
2026-09-29
Claude Science
“Once I received a prior Genspace login for Kernel, I began to deconstruct pDawn - sfGFP because it is readily available, well-studied…”
Fetched pDawn-sfGFP GenBank record (JN579121.1), Ag43 reference sequence (UniProt P39180) from E. coli K-12, verified no internal stop codons, extracted reading frames, saved as FASTA and GenBank files for Kernel import.
Imported sequences into Kernel workspace for live part creation. Acknowledged CsgA as subtractive reporter choice.
2026-09-29
Claude Science
“go ahead and build the homework draft. Selectively rebuild my verbatim responses into a reviewable paragraph…”
Rebuilt author’s verbatim statements into co-authored proposal paragraphs for Parts 0–6. Flagged framework requirements (decision log, research objectives register). Prepared clean draft with all mandatory coverage rows.
Reviewed proposals, accepted or edited. Confirmed decision log freezing (DL-1 through DL-12). Locked build method choice (synthetic order → Gibson → chip synthesis).
2026-09-29
Claude Science
“paper production becomes #1. Ceramic is an artistic collaboration”
Reframed Parts 5 and 6: paper production elevated to primary deliverable; ceramics explicitly secondary extension. Updated decision log (DL-9, DL-11, DL-12) to reflect paper-first priorities. Verified Part 6 unknowns address paper production, not kiln firing.
Endorsed paper-first frame. Confirmed CsgA curli as subtractive platform. Final summary locked.
2026-09-29
Claude Science
“focus on the required questions, my answers, a round of revision, and final draft.”
Final draft: author answers to all 33 rows of coverage tracker; decision log 1–12 complete with frozen decision path; Parts 0–6 with full design rationale; all appendices (illustrations index, references, AI use log, research objectives register) ready. Sequences (pDawn-sfGFP, CsgA) downloaded and verified.
Reviewed final draft. Corrected citations (Ohlendorf, Jin/Riedel-Kruse bibliographic data). Reframed Part 4 with honest caveats (Kernel tools not executed; expected results pending actual workflow per framework §3). Submitted.
Author reflection
The AI’s role evolved from scaffolding (outline + coverage tracker) through elicitation (ask the author the verbatim questions) through co-authoring (build the draft from the author’s answers) to correction (catch citation errors, flag incomplete tool runs, revise for honesty and accuracy). At each step, authorship remained clearly with the author: the AI proposed, the author decided. The framework’s §3 requirement to log and cite AI work kept the boundary transparent.
Key decisions made by the author, not the AI:
Popcorn simulator + Beam device naming and scope
Choice of sfGFP (additive) and CsgA (subtractive) reporters
pDawn blue-light control layer (470 nm) for both
Paper production as primary deliverable; ceramics secondary
Staged synthesis strategy (synthetic order → Gibson → chip)
Part 6 unknowns scoped to paper (pH response, resolution, stability)
All three core research objectives
The AI served as a research partner and accountability mechanism: finding literature, verifying sequences, organizing the framework, and catching errors. The author owned the science.
Week 3 HW Cell-free reaction design
HTBAA Homework #3
Cell-Free Reaction Design
Part A — Compare cell-free reaction compositions
A1. Why does the concentration of potassium glutamate and magnesium glutamate differ between compositions? Which is more sensitive?
My response.
Because each concentration responds differently to disulfide bonds. For example, in in sfGFP which does not have disulfide bonds, potassium glutamate is more effective at successful folding. Magnesium glutamate is more suited for disulfide bonds as required for Petase and even more so for reteplase
So I am choosing Magnesium for A1 as it provides the reaction energy needed for NTPs
Ok, so adding magnesium is a low cost way to provide a catalyst for the NTP energy source .
I initially attributed the difference between the two salts to disulfide requirement, then to magnesium supplying the reaction energy, before settling on magnesium as a low-cost catalyst.
Feedback. Both salts share the glutamate anion, so the contrast is K⁺ versus Mg²⁺, not the salts. Magnesium is the more sensitive of the two it occupies discrete saturable sites and is chelated roughly 11 by nucleotides and phosphate, so free Mg²⁺ — not added Mg²⁺ — is what the machinery sees, and it operates near 5 mM against potassium’s 270 mM. The first two framings above were tested and discarded neither cation is redox-active, and magnesium is a non-consumed catalyst, not an energy source.
→ Worked analysis, calculations and caveats Appendix E.1.
A2. Explain how a PEP+NTP reaction formulation is different from a Ribose+NMP reaction formulation.
My response.
give me some socratic reasoning around A2 since PEP+NTP different from Ribose+NMP in that one is the energy for transcription and one is the energy for translation. that’s my starting point.
what makes the most sense for me is the pre-made vs in situ process. I believe premade will save energy for other in situ processing.
I proposed a starting frame for the comparison, then replaced it when the first frame did not survive scrutiny.
Feedback. The two formulations differ in whether phosphate-bond energy and nucleotides are bought pre-made or generated in situ — not in which process they feed. Both routes supply both transcription and translation, and translation dominates demand at four phosphate equivalents per peptide bond, so PEP at 30 mM covers only ~39% of one run’s requirement and the remainder comes from metabolism either way. The pre-made route buys a fast start, not a larger total.
→ Worked analysis, calculations and caveats Appendix E.2.
A3. Choose two cell-free reaction compositions from the literature; compare and contrast the choice of reagents and the concentration of reagents.
My response.
for A3, now that we know Mg is important, and is low cost but only provides catalyst, and that kinetic Km sets the floor, we need to look at more impactful tuning levers, that have more kinetic impact AND less cost. GMP seems to be the best focus area to pursue. Let’s test the theory with calculations.
I named a lever and asked for it to be tested numerically rather than asserted.
Feedback. Pair compared PANOx-SP against the cost-optimised RFopt of Olsen et al. The GMP hypothesis was right in direction and wrong in ranking — nucleotide form is the largest coherent lever class, but GTP is third at 15.1% of variable cost, behind PEP at 29.0% and coenzyme A at 22.8%; substituting G, U and C as a class recovers 39.4%. The unexpected result was that a cost substitution silently moves an unrelated optimum the substitution pushes free Mg²⁺ further off target, so nucleotide and magnesium changes are not independent.
→ Worked analysis, calculations and caveats Appendix E.3.
Part B — Design one reaction composition for each of the three proteins
Shared design constraints (Section 2F of the assignment)
Constraint
Value
Total reaction volume
20 µL = 20,000 nL
Fixed, not modifiable
5,000 nL lysate (25%) + 2,000 nL DNA template + 2,000 nL base buffer = 9,000 nL
Variable allocation
11,000 nL selected from the reagent menu
Filler
Nuclease-free water to exactly 20,000 nL
Volume granularity
All reagent volumes in multiples of 25 nL
Submission
JSON, automatically validated before experiments run
Cost anchors (assignment, sourced to Olsen et al. 2026)
Reagent
Approx. cost
Note
Lysate
$4.00/mL
25% of every reaction; typically the single largest cost
CTP, GTP, UTP
$28–39/mL
Primary target for NMP substitution
NAD
$33/mL
Coenzyme A
$104/mL
Most expensive item on the menu
Salts, sugars
fractions of a cent
Water
free
Scoring objective cost per gram of functional protein.
for the submittals to the coopetition, it is looking like both PEP and RIBOSE reagents are being made for each of 3
I built the sfGFP composition on the assigned RFopt reference plate, changing five reagents and leaving the rest at reference. The per-reagent rationale is in the table below.
What changed from the source well (full per-reagent table in the appendix)
Reagent
Source well
Submitted
K(Glu)
200 mM
214.22 mM
Mg(Glu)₂
8.225 mM
4.475 mM
Tyrosine
5 mM
2.5 mM
Cysteine
5 mM
1 mM (base buffer only)
AMP
3 mM
2.125 mM
All other reagents held at the reference value. Designable volume 8,675 nL of 11,000 nL;
$0.0263007 per 20 µL reaction; 0 errors, 0 guardrail failures.
Feedback. Five reagents changed, twelve held at reference. The magnesium cut is the mechanistically strongest move, and the AMP trim pays twice — it makes the four nucleotides equimolar and, by removing chelation load, carries free Mg²⁺ onto its optimum at no cost. The cost result is negligible all-in falls 0.49%, because 92% of a reaction is lysate, DNA template and base buffer, none of which is designable.
→ Worked analysis, calculations and caveats Appendix E.4.
B1b. PETase (TfCut2) composition
My response.
I gave PETase the same vector as sfGFP after testing whether any reducing-regime reagent could improve its folding outcome. None could.
What changed from the source well (full per-reagent table in the appendix)
Reagent
Source well
Submitted
K(Glu)
200 mM
214.22 mM
Mg(Glu)₂
8.225 mM
4.475 mM
Tyrosine
5 mM
2.5 mM
Cysteine
5 mM
1 mM (base buffer only)
AMP
3 mM
2.125 mM
All other reagents held at the reference value. Designable volume 8,675 nL of 11,000 nL;
$0.0265907 per 20 µL reaction; 0 errors, 0 guardrail failures.
Feedback. Identical vector to sfGFP. The decision not to diverge is supported rather than assumed all 51 reducing-compatible reagents on the menu were tested at two volumes each and none changed the active fraction. The 57% loss is an unmeasured folding prior, not a formulation fault, and the crystal structure agrees that redox chemistry is not the lever — the single disulfide sits 26 Å from the catalytic serine.
→ Worked analysis, calculations and caveats Appendix E.5.
B1c. Reteplase composition
My response.
let’s compare a more aggressive move on reteplace. make some multiple variable moves to see if we can get cost down in comparison to energy and kinetics
what is the minimum amount of folding we can expect before the choice is not a good candidate
I took a multi-variable approach on reteplase rather than testing one reagent at a time, and set an acceptance threshold from the assay before accepting any design.
What changed from the source well (full per-reagent table in the appendix)
Reagent
Source well
Submitted
K(Glu)
200 mM
214.22 mM
Mg(Glu)₂
8.225 mM
4.475 mM
Tyrosine
5 mM
2.5 mM
Cysteine
5 mM
1 mM (base buffer only)
AMP
3 mM
2.125 mM
DsbC
5 µM
absent
All other reagents held at the reference value. Designable volume 9,350 nL of 11,000 nL;
$0.0273835 per 20 µL reaction; 0 errors, 0 guardrail failures.
GSSG 4.04 mM and GSH 1.0 mM retained at reference.
Feedback. Order mattered. Removing DsbC alone looks like a bad move until cysteine is fixed first, so one-at-a-time testing would have rejected the correct answer. At the plate’s assigned 5 mM, cysteine acts as a reductant in the DSB regime and modelled pairing falls below the assay’s replicate-safe threshold; with it removed, pairing improves without DsbC at all. Cost falls 206.7× on a single reagent.
→ Worked analysis, calculations and caveats Appendix E.6.
B2. Community reagent contribution
My response.
what can we do to increase the protein output of PetAse without so much misfolding? wIthout raising cost.
we will come back to chaperone, for a future round. Let’s stop here with our first finalized hypothesis and get ready for submittal
I identified the chaperone gap while asking how to raise PETase output, chose to defer it rather than fold it into this submission, and then selected GroEL/GroES as the reagent to propose.
Feedback. GroEL/GroES is proposed for the reducing regime because it is the only identified mechanism that addresses a quantity the present menu cannot move — every reagent that helps PETase helps by raising total titer, leaving the misfolded fraction unchanged. It is also unproven for this substrate and ATP-dependent, and the proposal states both limits rather than claiming a guaranteed gain.
→ Worked analysis, calculations and caveats Appendix E.7.
B3. Forum participation
My response.
make a brief draft of a forum post that summarizes my tool development approach with an example. The initial tool was built in Claude Science without code management. (Week 3). Week 4 introduces a code framework to be introduced.
What I did. Specified the subject and framing of the post, and joined the forum page.
Forum post (draft).
Building a reaction configurator before writing a codebase
For Week 3 I built an interactive CFPS configurator instead of working from a spreadsheet —
reagent menu, volume and increment constraints, exact cost arithmetic, magnesium speciation,
guardrails, and a folding and kinetics simulator. Every composition I submitted came out of it.
One example of why that mattered. The assigned oxidising plate for Reteplase carries 5 mM
cysteine. Running it as a baseline tripped a free-thiol guardrail — in a DSB regime cysteine
acts as a reductant. Removing it fixed disulfide pairing and made the DsbC we were paying for
unnecessary $5.66 → $0.027 per reaction. The transferable part is the order. Removing DsbC
alone looks wrong until cysteine is fixed first, so one-variable-at-a-time testing would have
rejected the right answer.
This version was built conversationally in Claude Science, with no repository and no tests.
Week 4 moves it onto a proper code framework with version control.
Feedback. The post leads with the cysteine result because the transferable lesson is about the
order of a multi-variable move, not about reteplase specifically. The Week 3 / Week 4 framing is
accurate and worth stating publicly two of the errors corrected during this work — a g/L unit
conversion and a folding prior wrongly multiplying a synthesis rate — are exactly the class a test
suite catches and a conversation does not.
→ Numbers behind the worked example, and the full tooling note Appendix E.8.
Part C — Asimov Kernel (optional)
I did not attempt Part C. The supplied sequences were extracted and checked during Part B work, so the starting material exists.
C1. T7-compatible plasmids for cell-free expression
(status not attempted)
Sequences supplied by the assignment for sfGFP, PETase, and Reteplase. Note that the
PETase and Reteplase sequences as given carry an N-terminal Strep-tag II (WSHPQFEK)
followed by a TEV protease site (ENLYFQS), and both end in a C-terminal
GGSGVSGWRLFKKIS extension; sfGFP instead carries the Strep-tag at its C-terminus. These
features need to be preserved or deliberately removed in the plasmid design.
Candidate cargo categories general chaperones, disulfide-bond formation and isomerization
machinery, peptidyl-prolyl isomerases.
Feedback. Not attempted. The three supplied sequences were extracted and verified during Part B (sfGFP 240 aa, PETase 309 aa, Reteplase 399 aa), and the tag architecture is noted above, so C1 has its starting material if revisited.
Use of AI
Model Claude Opus 5 (claude-opus-5), via Claude Science. One continuous session,
86 human-authored prompts and 319 code executions.
Summary. AI was used in three ways to build a provenance rubric separating exact arithmetic
(cost, concentrations, free magnesium, pH, volumes, guardrails) from fitted heuristics (titer,
folding priors) from illustrative constants (simulation timing); to run the homework questions
Socratically — question asked plain, answered first, critiqued after; and to build the CFPS
configurator used to design and test every composition submitted here. The rubric is why titer is
never used to rank a design. The tool is where the results came from.
Actual prompts, verbatim
“just ask me the question so I can research and answer verbatim, then we will analyze and mentor”
“I would like to create a visual simulator of the kinetic response to a selected formula. using
the calculator or now we will call it the CFPS configurator, add a new tab for training and
modeling an interactive simulation of the molecular compounds. It can be very abstract and
illustrative at first, but based on actual metrics and values, as well as assumptions made in
this activity.”
“for A3, now that we know Mg is important, and is low cost but only provides catalyst, and that
kinetic Km sets the floor, we need to look at more impactful tuning levers, that have more
kinetic impact AND less cost. GMP seems to be the best focus area to pursue. Let’s test the
theory with calculations.”
“let’s compare a more aggressive move on reteplace. make some multiple variable moves to see if
we can get cost down in comparison to energy and kinetics”
“what is the minimum amount of folding we can expect before the choice is not a good candidate”
Where the prompts led. The Socratic prompt produced A1–A3. The simulator prompt produced the
configurator and, through it, the kinetics and folding modules. The GMP prompt was tested and came
back partly supported — right that nucleotide form is the largest lever class, wrong that GMP
ranks first. The multi-variable prompt produced the cysteine-as-reductant result. The folding-floor
prompt set the assay threshold used to accept the reteplase design.
Appendix — worked analysis, by question
The main-body answers above are deliberately short. This appendix carries the worked reasoning, calculations, figures and caveats behind them.
E.1 — A1 potassium vs magnesium glutamate
The contrast is between the cations, not the salts. Potassium glutamate and magnesium
glutamate share the same anion, so nothing that distinguishes them can be attributed to
glutamate. Glutamate is the counter-ion of choice for both because it mimics the E. coli
cytoplasm, and it is not inert — it is also an energy source via oxidative deamination into
the TCA cycle, which is why a formulation of potassium glutamate, nucleotide monophosphates
and amino acids can make protein with no sugar and no PEP at all. But that contribution is
common to both reagents. The real question is K⁺ versus Mg²⁺.
What magnesium does. Mg²⁺ is a catalytic and structural cofactor occupying discrete,
saturable sites. It supplies the two metal ions in the T7 RNA polymerase active site — one
positioning and activating the attacking 3′-OH, the other coordinating the β,γ-phosphates
and stabilizing the departing pyrophosphate. It bridges the 30S and 50S ribosomal subunits,
holds the tertiary core of every tRNA together, and is required by the aminoacyl-tRNA
synthetases and the translational GTPases. It is also half of the substrate Mg·ATP is the
physiological species, so without magnesium the nucleotides are present but chemically
inert.
Magnesium is explicitly not an energy source. The energy comes from phosphoanhydride
bonds — those in the NTPs themselves and in whatever secondary donor regenerates them
(PEP, maltose, maltodextrin, glucose, or glutamate). Magnesium is a catalyst it lowers
activation barriers, is not consumed, and contributes no thermodynamic driving force. If
anything it reduces the free energy released per nucleotide hydrolysed, since ΔG°′ for ATP
hydrolysis becomes less negative as free Mg²⁺ rises.
What potassium does. K⁺ sets bulk ionic strength and reproduces the cytoplasmic
potassium environment. It tunes translation-initiation fidelity and the strength of
nonspecific protein–nucleic-acid electrostatics. This is a bulk solution property acting
through Debye screening — a smooth, monotonic function of ionic strength — rather than
occupancy of a defined site.
Why the concentrations differ between compositions chelation. Chelation is the binding
and sequestration of a metal ion. Nucleotides chelate magnesium roughly 11, which means
what the machinery experiences is free Mg²⁺, not the magnesium written on the recipe. The
size of that sink depends on the energy system in my simulator’s engine, NTPs carry a
magnesium-chelation weight of 1.0 against 0.3 for NMPs and 0.05 for inorganic phosphate,
over a lysate-supplied baseline of ~3.45 mM. (A fourth coefficient for polyphosphate,
mg_chelate_poly = 1.5, is defined in the coefficient file but is not applied by the
engine’s freeMagnesium() function, which adds the polyphosphate term raw — so its
effective weight is 1.0. I checked the source rather than the coefficient table; none of
the formulations compared here contain a polyphosphate chelator, so no number in this
answer depends on it either way.) A high-phosphate PEP+NTP formulation therefore has to add
substantially more total magnesium than a low-phosphate NMP formulation to put the same
free Mg²⁺ in front of the ribosome.
A speciation calculation makes the size of the effect concrete at 8 mM total magnesium
glutamate, a high-phosphate PEP+NTP load leaves ~1.0 mM free Mg²⁺ while a low-phosphate NMP
load leaves ~6.8 mM — roughly a 7-fold difference from identical added magnesium.
Two further sources of between-composition variance each lysate prep carries its own
endogenous magnesium — Olsen et al. report an S30 buffer of 14 mM magnesium acetate and
60 mM potassium acetate — and the chelation landscape shifts during the reaction as NTPs
are consumed and phosphate accumulates. Olsen et al. accordingly had to determine new
optimum magnesium concentrations for each lysate concentration they tested.
Potassium has no comparable sequestration sink, so added potassium is essentially free
potassium, and published potassium concentrations cluster far more tightly than magnesium
ones.
Which is more sensitive magnesium, for four reasons that stack.
Site occupancy versus a bulk property. Function is steeply nonlinear in the occupancy
of a saturable site near its binding constant; it is gradual in ionic strength.
Opposing failure modes make a peak rather than a plateau. Too little magnesium and
ribosomal subunits dissociate, tRNA misfolds and the polymerase loses catalysis; too much
and translational fidelity drops, mRNA secondary structure blocks initiation, and
Mg-phosphate precipitates. Two distinct mechanisms closing in from either side give a
sharp optimum. Potassium’s failure modes arrive gradually, and glutamate as counter-ion
buffers the high end.
Chelation amplifies error. Free Mg²⁺ is the difference between two comparable large
numbers, so a small fractional change in what is added produces a larger fractional
change in what is available — I calculate amplification factors of ~1.6–1.9 under
phosphate load against ~1.1 without, and that conclusion is robust across a 16-fold range
of assumed binding constants. Potassium’s amplification is ~1.0 by construction.
Concentration scale. Magnesium operates near 10 mM and potassium near 130 mM, so equal
absolute pipetting error is a ~13-fold larger fractional perturbation for magnesium. Under
this project’s 25 nL dispensing granularity, one increment of a 100 mM stock into 20 µL is
1.25% of a magnesium setpoint but 0.10% of a potassium setpoint.
One apparent counter-example, resolved. Olsen et al. screened 1,231 formulations and
arrived at a minimal active system comprised only of potassium glutamate, nucleotide
monophosphates and amino acids — supplemental magnesium glutamate was among the components
that did not improve yield on individual add-back. That is not evidence that magnesium is
insensitive. Sensitivity is the steepness of yield against concentration near the optimum;
it is not the same as needing supplementation. Magnesium is essential but already supplied
by the lysate, and the same authors still had to re-determine its optimum for every lysate
concentration. Notably, all of that work was on sfGFP, which has no disulfide bonds — so
none of this magnesium behaviour has anything to do with disulfide chemistry.
Design consequences I am carrying into Part B. Magnesium glutamate costs fractions of a
cent, which makes it a free tuning variable I can titrate it densely across compositions in
a way I cannot afford with CTP, GTP, UTP, NAD or coenzyme A. But cheapness is not a licence
to add more — the dose is set by the optimum, not by the price. And because NMPs chelate
magnesium far less than NTPs, retuning magnesium is the obligatory second step of any
NTP→NMP cost substitution GTP at $39.34/mL against GMP at $0.533/mL is a 74-fold saving
that silently moves the magnesium optimum the moment it is taken.
Caveat on the numbers the speciation model above uses literature-typical order-of-magnitude
binding constants rather than values measured in this session. The ~7-fold free-Mg²⁺ gap is
robust to that uncertainty; the absolute millimolar values should not be quoted as measured.
E.2 — A2 PEP+NTP vs Ribose+NMP
Each name contains two slots, not one. Phosphoenolpyruvate is a phosphoryl donor;
NTP is a nucleotide. Ribose is a pentose and carbon source; NMP is a nucleotide at a lower
level of phosphorylation. So each formulation names one energy term and one nucleotide term
PEP+NTP is “high-energy donor plus fully phosphorylated nucleotides,” and Ribose+NMP is
“carbon/pentose source plus partially phosphorylated nucleotides.” Framing the contrast as
transcription-energy versus translation-energy does not survive the accounting below.
Why the transcription/translation split fails. Translation consumes NTPs too, and it
consumes far more of them than transcription does. Charging a tRNA costs 2 high-energy
phosphate equivalents (ATP → AMP + PPi), EF-Tu delivery costs 1 GTP and EF-G translocation
costs 1 GTP — 4 equivalents per peptide bond. For sfGFP (240 residues) at the 2.4 g/L titer
Olsen et al. report, that is 85.3 mM of phosphate equivalents for translation alone. By
contrast, each transcript is read many times, so the nucleotides polymerised into mRNA are a
small fraction of the budget at 100 copies translated per transcript, pre-purchasing NTPs
instead of phosphorylating NMPs saves roughly 1.6% of the translation demand (and
between 0.3% and 31% across a 500-to-5 range of ribosome loading). Pre-made nucleotides are
therefore a cost and kinetics decision, not an energy-budget decision.
Neither formulation escapes in-situ metabolism. PEP at the 30 mM of a PANOx-SP-type
recipe supplies only about 39% of that 85.3 mM translation demand, so even the “pre-made”
formulation depends on downstream metabolism of the pyruvate PEP leaves behind for roughly
2.6× more energy than PEP itself carries. The honest contrast is how much in-situ work is
required, not whether any is.
Pool versus flux — the asymmetry that matters. The NTP line items in a recipe are pool
sizes, not total consumption. A ~3.75 mM total NTP pool has to turn over about 23× to
meet an 85 mM demand, recharged continuously by the energy system. This splits the four
nucleotides into two classes
Nucleotide
Sinks
Can it be cut?
ATP
transcription substrate, aminoacylation, general phosphoryl donor
At 100 copies per transcript, a 0.85 mM supply of CTP or UTP exceeds stoichiometric demand
(~0.17 mM) by about 5×. Those two are the first place to cut.
But the floor is kinetic, not stoichiometric. T7 RNA polymerase follows saturation
kinetics, so the limit is the concentration the active site sees, not the total mass
available. Because nucleotides are consumed, concentration falls during the run, and
supplying exactly the stoichiometric demand drives the rate to zero before the demand is met.
Starting at 1× Km retains only 28% of the initial transcription rate by the end of the run;
starting at 5× Km retains 97%. Roughly 3–5× Km is the operating choice, and that headroom is
what the apparent “excess” actually is. Two further complications a dual-use nucleotide’s
floor is set by whichever of its several consumers has the highest Km, and the true substrate
is Mg·NTP, so free magnesium and nucleotide supply are not independent knobs.
Byproducts and pH — where the two routes diverge most. PEP donating its phosphate yields
pyruvate and releases inorganic phosphate stoichiometrically. That phosphate chelates
magnesium, inhibits the reaction, and drops the pH — the three problems that motivated the
Cytomim system’s move away from high-energy phosphate donors in the first place. It also
raises the apparent Km through product inhibition, so the kinetic floor rises while
nucleotide concentration falls two effects converging, which is why batch PEP+NTP
reactions have a finite lifetime. Ribose and sugar routes instead accumulate organic acids
through glycolysis, which also lowers pH but without the stoichiometric phosphate burst — so
buffering capacity (HEPES-KOH, formate) becomes the governing design choice rather than
phosphate management.
Cost — the reason any of this matters here. GTP costs $39.34/mL against GMP at
$0.533/mL, a 74-fold difference, and CTP, GTP and UTP all sit in the $28–39/mL band.
Since the scoring metric is cost per gram of functional protein, nucleotide provisioning is
the largest lever available after lysate. What the 74-fold premium buys is real, though
faster onset, higher flux, and independence from the lysate’s kinase and salvage capacity —
which is a batch-to-batch variable, since those enzymes have to survive lysis and
clarification in sufficient activity.
The dichotomy is not even exhaustive. Olsen et al. screened 1,231 formulations and
arrived at a minimal active system of potassium glutamate, nucleotide monophosphates and
amino acids — no sugar and no PEP at all. The energy in that system comes from glutamate
itself, via oxidative deamination into the TCA cycle, and they further showed nucleoside
triphosphates could be produced from nitrogenous bases and ribose. So the real design space
is not “PEP+NTP or Ribose+NMP” but a continuum of how much nucleotide and phosphate
provisioning you delegate to the lysate.
Design consequences I am carrying into Part B. Cut the pure-transcription nucleotides
(CTP, UTP) hardest; protect the flux carriers (ATP, GTP); substitute NMPs where the lysate
can phosphorylate them; respect a 3–5× Km headroom rather than cutting to stoichiometric
demand; buffer for the acid load of whichever energy route is chosen; and retune magnesium
after every nucleotide change, because NMPs chelate magnesium at roughly a third the weight
of NTPs.
Caveats. Copies translated per transcript and the polymerase Km under these conditions are
both unmeasured, and they are the two parameters the argument pivots on — the percentages
above are an order-of-magnitude ledger, not measurements. The 0.85 mM per-NTP supply figure
is a PANOx-SP-type value that could not be verified against its primary source (see decision
log entry 2). Energy stoichiometry (4 equivalents per peptide bond, 1 per nucleotide
polymerised, 2 per NMP→NTP conversion) is standard biochemistry; the 2.4 g/L titer is Olsen
et al.’s reported value.
E.3 — A3 PANOx-SP vs Olsen RFopt, and the lever test
Reagent-class comparison.
PANOx-SP (2004)
Olsen RFopt (2026)
Energy source
PEP 30 mM
glucose 10 mM + ribose 50 mM
Nucleotides
ATP 1.2, CTP/GTP/UTP 0.85 mM each
AMP 3, CMP/GMP/UMP 2.15 mM each
Potassium glutamate
130 mM
362 mM
Magnesium glutamate
8 mM
8 mM
Amino acids
2 mM
5 mM
HEPES
57 mM
75 mM
Cofactors
CoA 0.27, NAD 0.4, tRNA 0.17 mg/mL, folinic 0.03, putrescine 1, spermidine 1.5, oxalate 4 mM
nicotinamide 4 mM, phosphate 15 mM
Published cost per gram
$4,083
$60
Exact variable cost / reaction
$0.04555
$0.00238
Exact all-in cost / reaction
$0.06985
$0.02669
Free Mg²⁺ (engine, exact)
7.80 mM
8.11 mM
The classes of reagent removed matter more than any concentration change RFopt deletes the
secondary energy substrate, all four triphosphates, and four separate cofactors, and pays for
it with higher potassium glutamate, higher amino acids, more buffer, and a reliance on lysate
kinase and salvage activity.
Variable-cost decomposition (exact). PANOx-SP PEP 29.0%, coenzyme A 22.8%, GTP 15.1%,
UTP 14.5%, CTP 10.7%, NAD 5.5%, ATP 0.8%. RFopt CMP 22.6%, AMP 17.6%, UMP 15.0%, ribose
11.3%, potassium glutamate 10.9%, GMP 9.5%. Note the inversion — in the cheap formulation the
nucleotides are still the largest line, but the whole variable budget is 19× smaller, so the
fixed lysate cost ($0.02/reaction) becomes 75% of the all-in total.
Substitution ladder on PANOx-SP (exact cost, exact free Mg²⁺).
Variant
Variable $/rxn
Saving
Free Mg²⁺
Mg factor
baseline
0.04555
—
7.80 mM
0.630
GTP→GMP only
0.03875
14.9%
8.41 mM
0.547
CTP,UTP→NMP
0.03440
24.5%
9.03 mM
—
G,U,C→NMP, keep ATP
0.02761
39.4%
9.64 mM
0.405
all four →NMP
0.02740
39.8%
10.51 mM
—
G,U,C→NMP + Mg 225→25 nL
0.02760
39.4%
4.64 mM
1.000
Caveats. Reagent cost, final concentrations, free magnesium, volumes and the 25 nL
increment are exact outputs of the engine. The magnesium factor and the 4.6 mM optimum
come from the engine’s titer heuristic, which the tool itself documents as having negative
leave-one-out R² against eleven published formulations and which must not be used to rank
untested designs — so the factor is directional evidence that the substitution moves
magnesium off-optimum, not a yield prediction. The substitutions hold nucleotide
concentration constant in mM; the engine applies a 0.86 supply weight to NMPs, so matched mM
is a ~14% reduction in nucleotide-supply equivalents that a real screen would need to check.
Nucleosides and nucleobases are cheaper still per mM but arrive on 0.025 M stocks — 800 nL per
mM against 200 nL for NMPs — so they consume the 11,000 nL variable budget four times faster
and are gated on ribose.
E.4 — B1a sfGFP composition, full specification
The composition. Source well RFopt (2026) · reducing regime · 8,675 nL of 11,000 designable · $0.0263007 per 20 µL reaction. Removed from the source well added cysteine (5 → 1 mM, base buffer only).
Reagent
Volume (nL)
Final conc.
Rationale
Potassium glutamate K(Glu)
325
214.2 mM
Ionic strength. 200 → 214.22 mM brings total K⁺ to 269.5 against a 270 optimum; nearly free, and marginal by design.
Magnesium glutamate Mg(Glu)2
75
4.475 mM
Cut from the reference 8.225 mM. Free Mg²⁺ 8.11 → 4.63 mM, onto the 4.6 optimum; magnesium factor 0.587 → 0.9999.
17 amino acid mix
1,600
5 mM
Held at reference. The engine wanted this cut; glycine (34 residues in PETase) would fall to 1.19× headroom, so refused.
Tyrosine pH 12
1,000
2.5 mM
Halved. 9 Tyr in sfGFP / 11 in PETase = ~1.09 mM demand; 2.5 mM leaves 2.28× headroom.
HEPES-KOH pH 7.5
900
75 mM
Held at reference. Buffering; pH lands at 7.54.
Potassium phosphate 1.61 dimono
600
15 mM
Held at reference. Phosphate for the in-situ energy route.
Glucose
175
9.714 mM
Held at reference (175 nL is the grid value behind the plate’s nominal 10 mM).
Ribose
1,500
49.96 mM
Held at reference. Primary carbon/energy source; cutting it buys 0.34% of all-in cost and costs real energy headroom.
Nicotinamide
800
4 mM
Held at reference. Cofactor term.
AMP
425
2.125 mM
Cut from 3 mM. Makes ACGU equimolar — nucleotide balance 0.951 → 1.0000, and the reduced chelation moves free Mg²⁺ onto its optimum at no cost.
CMP
425
2.125 mM
Held at reference.
GMP
425
2.125 mM
Held at reference.
UMP
425
2.125 mM
Held at reference.
Nuclease-free water
2,325
—
Filler to exactly 20,000 nL.
Feedback. Five reagents moved; twelve stayed at reference. The magnesium cut is the
mechanistically strongest of them — free Mg²⁺ falls 8.11 → 4.63 mM onto the modelled optimum and
the magnesium factor goes 0.587 → 0.9999 for fractions of a cent. The AMP trim is the one that
earns twice it makes the four nucleotides equimolar (balance 0.951 → 1.0000) and, by removing
chelation load, is what carries free Mg²⁺ onto that optimum at no cost. The cost result here is
negligible — variable cost falls 6.7% but all-in only 0.49%, because 92% of a reaction is
lysate, DNA template and base buffer, which are not designable. Validity 0 errors, 0 guardrail
failures, one inherited warning (nmp_precipitate, total NMP 8.50 mM against a 5 mM threshold).
MODEL output, not used for ranking total titer 3.2845 g/L, active fraction 1.0000, active titer
3.2845 g/L.
E.5 — B1b PETase composition, full specification
The composition. Source well RFopt (2026) · reducing regime · 8,675 nL of 11,000 designable · $0.0265907 per 20 µL reaction. Removed from the source well added cysteine (5 → 1 mM, base buffer only).
Reagent
Volume (nL)
Final conc.
Rationale
Potassium glutamate K(Glu)
325
214.2 mM
Ionic strength. 200 → 214.22 mM brings total K⁺ to 269.5 against a 270 optimum; nearly free, and marginal by design.
Magnesium glutamate Mg(Glu)2
75
4.475 mM
Cut from the reference 8.225 mM. Free Mg²⁺ 8.11 → 4.63 mM, onto the 4.6 optimum; magnesium factor 0.587 → 0.9999.
17 amino acid mix
1,600
5 mM
Held at reference. The engine wanted this cut; glycine (34 residues in PETase) would fall to 1.19× headroom, so refused.
Tyrosine pH 12
1,000
2.5 mM
Halved. 9 Tyr in sfGFP / 11 in PETase = ~1.09 mM demand; 2.5 mM leaves 2.28× headroom.
HEPES-KOH pH 7.5
900
75 mM
Held at reference. Buffering; pH lands at 7.54.
Potassium phosphate 1.61 dimono
600
15 mM
Held at reference. Phosphate for the in-situ energy route.
Glucose
175
9.714 mM
Held at reference (175 nL is the grid value behind the plate’s nominal 10 mM).
Ribose
1,500
49.96 mM
Held at reference. Primary carbon/energy source; cutting it buys 0.34% of all-in cost and costs real energy headroom.
Nicotinamide
800
4 mM
Held at reference. Cofactor term.
AMP
425
2.125 mM
Cut from 3 mM. Makes ACGU equimolar — nucleotide balance 0.951 → 1.0000, and the reduced chelation moves free Mg²⁺ onto its optimum at no cost.
CMP
425
2.125 mM
Held at reference.
GMP
425
2.125 mM
Held at reference.
UMP
425
2.125 mM
Held at reference.
Nuclease-free water
2,325
—
Filler to exactly 20,000 nL.
Feedback. The decision not to diverge from sfGFP is the substantive one here, and it
is supported rather than assumed all 51 reducing-compatible reagents on the menu were tested at
two volumes each and none changed the active fraction off 0.4295. Decomposing
fold_prior × (0.85 + 0.15·p_pair) shows why — the disulfide term spans only 1.14× across its
entire reachable range while the unanchored prior’s ±1 sd spans 3.0×. The crystal structure agrees
that redox chemistry is not the lever the single disulfide sits 26 Å from the catalytic serine,
so it is a stability feature. The 57% loss is an unmeasured parameter, not a formulation fault,
and the cheapest way to close it is one 30-minute p-nitrophenyl read, not a reagent. Validity
0 errors, 0 guardrail failures, nmp_precipitate inherited. MODEL output total titer 3.2845 g/L,
active fraction 0.4295, active titer 1.4107 g/L.
E.6 — B1c Reteplase composition, full specification
The composition. Source well RFopt (ox.) (2026) · oxidizing / DSB regime · 9,350 nL of 11,000 designable · $0.0273835 per 20 µL reaction. Removed from the source well added cysteine (5 → 1 mM, base buffer only); DsbC (5 µM → absent).
Reagent
Volume (nL)
Final conc.
Rationale
Potassium glutamate K(Glu)
325
214.2 mM
Ionic strength. 200 → 214.22 mM brings total K⁺ to 269.5 against a 270 optimum; nearly free, and marginal by design.
Magnesium glutamate Mg(Glu)2
75
4.475 mM
Cut from the reference 8.225 mM. Free Mg²⁺ 8.11 → 4.63 mM, onto the 4.6 optimum; magnesium factor 0.587 → 0.9999.
17 amino acid mix
1,600
5 mM
Held at reference. The engine wanted this cut; glycine (34 residues in PETase) would fall to 1.19× headroom, so refused.
Tyrosine pH 12
1,000
2.5 mM
Halved. 9 Tyr in sfGFP / 11 in PETase = ~1.09 mM demand; 2.5 mM leaves 2.28× headroom.
HEPES-KOH pH 7.5
900
75 mM
Held at reference. Buffering; pH lands at 7.54.
Potassium phosphate 1.61 dimono
600
15 mM
Held at reference. Phosphate for the in-situ energy route.
Glucose
175
9.714 mM
Held at reference (175 nL is the grid value behind the plate’s nominal 10 mM).
Ribose
1,500
49.96 mM
Held at reference. Primary carbon/energy source; cutting it buys 0.34% of all-in cost and costs real energy headroom.
Nicotinamide
800
4 mM
Held at reference. Cofactor term.
AMP
425
2.125 mM
Cut from 3 mM. Makes ACGU equimolar — nucleotide balance 0.951 → 1.0000, and the reduced chelation moves free Mg²⁺ onto its optimum at no cost.
CMP
425
2.125 mM
Held at reference.
GMP
425
2.125 mM
Held at reference.
UMP
425
2.125 mM
Held at reference.
GSSG
475
4.037 mM
Held at reference. Oxidising half of the redox buffer.
GSH
200
1 mM
Held at reference. Reducing half; GSSGGSH ≈ 41, the modelled optimum.
Nuclease-free water
1,650
—
Filler to exactly 20,000 nL.
Feedback. The multi-variable approach was the right call and the evidence says so
removing DsbC alone looks like a bad move until cysteine is fixed first, so one-at-a-time testing
would have rejected the correct answer. At the plate’s assigned 5 mM, cysteine acts as a reductant
in the DSB regime — modelled pairing is p_pair 0.3674, which back-solves to 0.56× the
replicate-safe assay threshold, i.e. the plate as specified cannot produce a scoreable well. With
added cysteine removed, pairing reaches p_pair 0.5132 with no DsbC at all, above the 0.4452 an
earlier design bought with 3.5 µM. The cut is stoichiometrically safe 18 cysteines at 0.5–2 g/L
protein need 0.23–0.92 mM against the base buffer’s 1.0 mM. Cost falls 206.7×, and it is one
reagent — DsbC was 99.97% of that plate’s variable cost. Caveat that belongs with the number
the engine treats the 9 disulfides as pairing independently (active = p_pair⁹), while the AlphaFold
model of tPA shows three coupled modules of three, so the true active fraction is 7–55× higher
than reported and 0.0025 is a floor. Validity 0 errors, 0 guardrail failures, nmp_precipitate
inherited. MODEL output total titer 2.0364 g/L, active fraction 0.0025, active titer 0.005029 g/L.
E.7 — B2 GroEL/GroES community reagent proposal
Feedback. The proposal below is GroEL/GroES for the reducing regime. It is the one mechanism identified that addresses the quantity shown to be immovable with the present menu.
double-ring GroEL plus the GroES lid), for the reducing regime.
Rationale. It is the only mechanism I could identify that would move the quantity my own
analysis showed is currently immovable. PETase loses 57% of synthesised protein to misfolding,
and that loss is a folding-outcome term, not a concentration term. I tested all 51
reducing-compatible reagents on the present menu at two volumes each none of them changed the
active fraction off 0.4295. Every reagent that helps at all helps by raising total titer, so
active and misfolded protein rise together and the ratio is untouched. The menu has no chaperone
at all — DsbC exists but is gated to the oxidising regime, where it addresses disulfide pairing
rather than conformational folding.
Why GroEL/ES specifically. Its documented effect is on the soluble/active fraction rather
than on expression level, which is exactly the term that is missing. Over-expressing GroEL/GroES
increased the fluorescence of GFP-expressing cells without changing the amount of GFP protein
made, by raising the fraction that was soluble rather than aggregated — a yield effect, not a
titer effect. In a cell-free system specifically, adding GroEL–GroES to nascent CCR5 chains
increased both the rate and the yield of functional folding where spontaneous folding was slow and
inefficient. On a defined substrate (DapA) the chaperonin accelerated folding ~30-fold and
carried the yield to ~100%, and co-expression of both subunits raised soluble aconitase yield to
~39% where GroEL alone did nothing — so both components are needed; GroEL alone is not enough.
How the decision was reached. Not by assumption. The sequence was (1) decompose PETase’s
active fraction into fold_prior × (0.85 + 0.15·p_pair) and sweep each part — the disulfide term
spans only 1.14× across its entire reachable range while the prior’s ±1 sd spans 3.0×;
(2) confirm from the crystal structure (4CG1, 1.4 Å) that the single disulfide sits 26 Å from
the catalytic serine, so it is a stability feature and redox chemistry cannot be the answer;
(3) sweep every reducing-compatible reagent and find none that moves the fraction. Only then did
“the menu is missing a reagent class” become the conclusion rather than the premise.
Honest caveats, which belong in the proposal. GroEL/ES assists roughly 10% of newly
synthesised E. coli proteins, so PETase may simply not be a client — this is a hypothesis to
test, not a guaranteed gain. The chaperonin is ATP-dependent, and our composition deliberately
carries no ATP (only AMP, recharged in situ), so a dosing study would need to confirm the
adenylate pool supports the cycle. It can also slow folding of proteins that fold well without
it, and in at least one membrane-protein study GroES actively reduced folding yield. Finally, it
is a large, costly protein reagent — any menu addition needs a cost per mL before it can be
scored against a cost-per-gram objective.
Supporting research (links)
Chi et al., Folding of newly translated membrane protein CCR5 is assisted by the chaperonin
GroEL-GroES — cell-free system, rate and yield of functional folding.
https//www.ncbi.nlm.nih.gov/pmc/articles/PMC4653635/
Georgescauld et al., GroEL/ES chaperonin modulates the mechanism and accelerates the rate of
TIM-barrel domain folding — ~30-fold acceleration, ~100% yield on DapA.
https//pmc.ncbi.nlm.nih.gov/articles/PMC4071350/
Tang et al., Essential role of the chaperonin folding compartment in vivo — GroEL alone does
not improve yield; GroEL + GroES raises soluble aconitase to ~39%.
https//pmc.ncbi.nlm.nih.gov/articles/PMC2396394/
Horwich & Fenton, Chaperonin-assisted protein folding a chronologue, Quarterly Reviews of
Biophysics — the soluble-fraction effect on GFP, and the view that preventing aggregation
matters more than accelerating folding.
https//www.cambridge.org/core/journals/quarterly-reviews-of-biophysics/article/chaperoninassisted-protein-folding-a-chronologue/99CCB61641B4C118EAA879F177E2AC4B
A note that connects to my own design. The CCR5 cell-free work used Brij-35 to keep nascent
chains soluble. Brij-35 is already on the menu, and in my own scan it was the single best
gain-per-dollar reagent available (+5.4% active protein for $0.0000108 — 7,105 g/L per dollar).
The model books that benefit as a titer multiplier; the literature suggests at least part of it is
an anti-aggregation effect, i.e. a fraction effect the model cannot represent. That is a second
argument for adding a folding-outcome term to the scoring, not just a folding reagent to the menu.
E.8 — B3 numbers behind the forum example, and the tooling note
The cysteine result, in full. The assigned RFopt (ox.) plate carries 5 mM cysteine. Sweeping
cysteine with DsbC held fixed gives modelled pairing of p_pair 0.3674. Back-solving the app’s
own assay calibration — 540 RFU per µM AMC, 260 RFU blank, 0.42 µM AMC/min per µM enzyme, a
480-minute window and a lowest calibrated standard of 0.39 µM AMC — puts that at 0.56× the
replicate-safe threshold, meaning the plate as specified cannot produce a scoreable well.
Sweeping DsbC with cysteine at base level instead gives p_pair 0.5132 with no DsbC at all,
above the 0.4452 an earlier design had bought with 3.5 µM of it.
Why the order matters. DsbC was compensating for a problem cysteine was creating. Evaluated
alone, removing DsbC lowers modelled pairing and looks like a bad move; evaluated after cysteine
is corrected, it is free. A strict one-factor-at-a-time protocol would therefore have rejected the
correct design. This is the general case against single-lever screening when two reagents interact
through the same term — here, the thiol penalty.
Cost decomposition. DsbC at 5 µM costs 1,000 nL on a 0.1 mM stock and accounts for 99.97%
of that plate’s variable cost ($5.632 of $5.634). Removing it takes the reaction from $5.6595134
to $0.0273835 all-in, a 206.7× reduction. It also resolves a budget problem the plate as
specified needs 11,750 nL against an 11,000 nL allowance, so it is not loadable as written.
Stoichiometric check before the cut. Reteplase carries 18 cysteine residues. At 0.5–2 g/L
total protein that is 0.23–0.92 mM of demand, against 1.0 mM supplied by the base buffer — so
removing added cysteine leaves the requirement covered. The engine does not model cysteine as a
limiting amino acid, only as a thiol, so it would have permitted the cut regardless; the check is
what makes it defensible.
Tooling note. The Week 3 configurator was built conversationally with no repository, version
control or test suite. That was a reasonable trade for a first pass — the tool grew as the
questions did, and the folding simulator answered questions that were not anticipated when it was
started. The cost of that trade is visible in the error record a g/L-to-mM unit conversion on the
ribose and glucose stocks (a 3.3× overdose that was reported as correct), and a folding prior
multiplying a synthesis rate, which silently produced zero protein for reteplase and half for
PETase. Both were found by re-deriving results, not by any automated check. A parity test now runs
on every build of the folding module and reproduces the engine’s active fraction to within 2×10⁻¹⁵
— that test is what caught the second error, and it is the pattern Week 4’s code framework is
intended to generalise.
E.9 — What is exact, what is modelled, and what is not used for ranking
Stated explicitly so the reader need not infer it.
Tier
Quantities
How they may be used
Exact arithmetic
cost per reaction, final concentrations, volumes, free Mg²⁺, pH, osmolality, ionic strength, guardrail status
quoted directly; designs ranked on them
Fitted heuristic
total titer, active fraction, cost per gram
reported with error bars; never used to rank an untested design
Illustrative
simulation timing constants in the kinetics and folding modules
curve shape only; no number in a conclusion
The titer model’s leave-one-out R² on log titer is −0.26 with median fold error 1.456 across
11 reference formulations — worse than predicting the mean. That is the reason for the second row.
Open items carried forward, not resolved
nmp_precipitate warns on all three designs (total NMP 8.50 mM against a 5 mM threshold).
Inherited from the reference plates. Clearing it costs ~24% of modelled titer to save 1.4% of
variable cost, so the trade was refused.
Reteplase’s active fraction is a floor, not an estimate. The engine treats its 9 disulfides
as pairing independently; the AlphaFold model of tPA shows three coupled modules of three, so
the defensible exponent is between 3 and 9 and the true value is 7–55× higher. The exponent was
left at 9 so all reference formulations stay comparable.
PETase’s fold_prior is unanchored at 0.50 ± 0.25. One 30-minute p-nitrophenyl read would
replace it with a measurement.
Submission JSON field names are unverified against ginkgobioworks/autonomous-cfps; the
repository was unreachable when the exporter was built.
The assignment cites DOI 10.1002/bit.20026 as PANOx-SP; that DOI resolves to the Cytomim paper.
The PANOx-SP table used here came from the tool’s own reference record.
The tool lists reteplase at 355 aa; the supplied sequence is 399 aa (Strep-tag II / TEV
construct). Flagged, not silently resolved.
A Brij-35 plus spermidine/putrescine combination raises active titer 18.2% for +$0.000211 per
reaction. Deliberately held for a future round so the three levers under test keep clean
attribution.
Citations
(status in progress)
Olsen, M. L., Copeland, C. E., Sundberg, C. A., Aw, R., Shaver, Z. M., Rao, G.,
Swartz, J. R., Karim, A. S., & Jewett, M. C. (2026). Design-driven optimization of
low-cost reagent formulations for reproducible and high-yielding cell-free gene
expression. Nature Communications. DOI 10.1038/s41467-026-69605-8. Full text
retrieved, open access.
Smith, A. A., et al. (2026). Using a GPT-5-driven autonomous lab to optimize the cost
and titer of cell-free protein synthesis (Ginkgo Bioworks × OpenAI). bioRxiv.
DOI 10.64898/2026.02.05.703998. Not yet retrieved.
Jewett, M. C., & Swartz, J. R. (2004). Mimicking the Escherichia coli cytoplasmic
environment activates long-lived and efficient cell-free protein synthesis.
Biotechnology and Bioengineering, 86(1), 19–26. DOI 10.1002/bit.20026.
Paywalled; abstract only. See decision log entry 2 — this is the Cytomim paper, not
the PANOx-SP paper.
Silverman, A. D., Karim, A. S., & Jewett, M. C. (2020). Cell-free gene expression an
expanded repertoire of applications. Nature Reviews Genetics, 21, 151–170.
DOI 10.1038/s41576-019-0186-3.
Rasor, B. J., Vögeli, B., Landwehr, G. M., Bogart, J. W., Karim, A. S., & Jewett, M. C.
(2021). Toward sustainable, cell-free biomanufacturing. Current Opinion in
Biotechnology, 69, 136–144. DOI 10.1016/j.copbio.2020.12.012.
Decision log
A1 mechanism rejected. An initial framing that attributed differing potassium- and
magnesium-glutamate concentrations to differing disulfide-bond requirements was
discarded. K⁺ and Mg²⁺ are closed-shell, non-redox-active cations and do not participate
in thiol oxidation; disulfide outcomes in this system are controlled by the DTT / IAM /
GSSG-GSH / DsbC / Δgor variables enumerated in Section 2C. The retained explanation is
free-Mg²⁺ buffering by phosphate and nucleotide load.
Assignment citation discrepancy, carried into A3. The assignment recommends
“PANOx-SP (Jewett & Swartz 2004)” and gives DOI 10.1002/bit.20026, but that DOI resolves
to the Cytomim paper — the pyruvate-driven, phosphate-free system assayed with
chloramphenicol acetyltransferase at 700 µg/mL. PANOx-SP is a distinct formulation.
A primary PANOx-SP source with an actual concentration table is still needed before A3
can be written. Do not describe PANOx-SP while citing this DOI.
Part A3 pair not yet selected. Choice is open between the yield-vs-cost contrast
(PANOx-SP vs Olsen 2026) and the human-vs-AI contrast (Olsen 2026 vs Smith 2026), the
latter being closer to the coopetition’s own question.
A1 second correction — magnesium is not an energy source. An intermediate framing
held that magnesium “provides the reaction energy needed for NTPs.” Rejected the energy
resides in phosphoanhydride bonds (NTPs and the secondary donor regenerating them), while
Mg²⁺ is a non-consumed catalyst contributing no driving force — and rising free Mg²⁺ makes
ΔG°′ of ATP hydrolysis less negative, so the claim fails in direction as well as kind.
Retained instead Mg·NTP is the physiological substrate, so magnesium is what makes the
nucleotides usable.
A1 — necessity distinguished from sensitivity. Being essential does not make a
reagent sensitive (the 20 amino acids are essential with broad optima). The sensitivity
argument rests on saturable-site occupancy, opposing high- and low-side failure modes,
chelation amplification, and the ~13-fold fractional-precision disadvantage of operating
at 10 mM rather than 130 mM.
A1 — cheapness is not a dosing argument. Magnesium glutamate costs fractions of a
cent, which licenses dense titration across compositions, not a higher setpoint. Overshoot
carries real penalties (fidelity loss, mRNA structure, Mg-phosphate precipitation). The
cost lever is NTP→NMP substitution; magnesium is the variable that must be retuned to
realise it.
Engine coefficient claim corrected. An earlier draft of A1 stated the engine applies a
polyphosphate magnesium-chelation weight of 1.5. Reading freeMagnesium() in the engine
source shows the polyphosphate term is added raw, so its effective weight is 1.0 and
mg_chelate_poly is an unused coefficient. The claim is corrected in Appendix E.1. No
number in Part A depended on it — none of the compared formulations contain a
polyphosphate chelator — and the same error was fixed in the kinetics model so that its
free-Mg²⁺ calculation now reproduces the engine to within 1e-9 on all four reference
formulations.
PANOx-SP source resolved, and a concentration corrected. The configurator’s own
reference-formulation record carries PANOx-SP in full (Mg-glutamate 8 mM, K-glutamate
130 mM, ATP 1.2 mM, CTP/GTP/UTP 0.85 mM each, PEP 30 mM, HEPES 57 mM, with cost
$4,083/g). This supplies the concentration table A3 needs without relying on the
mis-cited DOI in decision log entry 2. It also corrects an earlier draft figure PEP is
30 mM, not ~33 mM.
Answer format changed on author instruction. Main-body answers now lead with the
author’s own claim in italic, followed by a brief rationale and the key learnings that
shaped it. The full worked analysis moved to Appendix E so the submitted answers stay
short and the supporting work remains auditable.