I’m Erum Azeez Khan, a partner at Messaginglab, a strategic communications firm working with biotech and pharma clients. I have a drug development, healthcare, and tech background, including six years of pharma lab expertise (J&J, GSK). I joined a “climate nanotech startup” that built a reactor that converts carbon emissions into carbon nanomaterials. After that, I was co-founder and CEO of an voice assistant SaaS company that was acquire, and now I’m in the world of biotech strategy & communications. I hold a B.S. in Forensic Chemistry & Toxicology from West Chester University of Pennsylvania, class of 2005.
I’m currently building an early-stage biotech commercialization platform that licenses bio-based innovations to consumer brands. I also co-host Grow Everything, a podcast covering industrial, consumer, and climate biotech. That combination, watching which biotech innovations actually make it out of the lab and into products people use, is what drew me to this course. I’m especially interested in the color space: natural dye companies have solved red, blue, and yellow, but nobody’s cracked a biomanufactured white yet, and that’s the gap I want to dig into this semester.
Contact info
Homework, Labs, and Projects
See the nav bar on the left to look through my work for How To
Biomanufacture Almost Anything (Fall 2026)!
Subsections of <Erum Azeez Khan> — HTBAA Fall 2026
Week 1 HW: Final Project DRAFT
Biomanufactured Structural White: A TiO2 Replacement
1. What I want to biomanufacture, and why
I want to explore a biomanufactured, particle-free white colorant and opacifier, something that could replace titanium dioxide (TiO2, listed as E171 in food) in food coatings, tablet/supplement coatings, and cosmetics.
This isn’t a hypothetical problem. TiO2 was banned as a food additive in the EU in August 2022, on genotoxicity concerns tied to its nanoparticle form [1]. It’s still permitted in the US and several other markets, but that kind of ruling tends to spread. A petition asking the FDA to revoke its color additive listing is already pending, US states are moving on food additive bills, and manufacturers are reformulating around it [2]. So the premise here isn’t “can something beat TiO2 on price”, TiO2 is being pulled off the table on health grounds regardless of cost. The premise is: something has to fill that slot, and the market hasn’t settled on what.
That’s what makes white the interesting color to work on. Natural-colorant companies (including the biocolor work I’m involved in) have technically cracked red, blue, and yellow, including with fermentation-derived pigments, though these remain expensive in use. Nobody has cracked a fermentation-derived white that matches TiO2. It’s the unsolved color, both technically and commercially, which is why it’s talked about as a kind of holy grail in the natural-colorant industry.
Who it’s for: food and supplement manufacturers currently scrambling for a TiO2 replacement (especially ones selling into the EU, or ones that want to get ahead of a similar US ruling), and by extension, consumers who’d rather not have a nanoparticle mineral pigment in their food or pills.
2. What living system would I use?
Rather than trying to biosynthesize a white pigment molecule (there isn’t really such a thing, white pigments work by scattering light broadly, not absorbing specific wavelengths), I’d take a structural-color approach, copying how some organisms are white with no pigment at all.
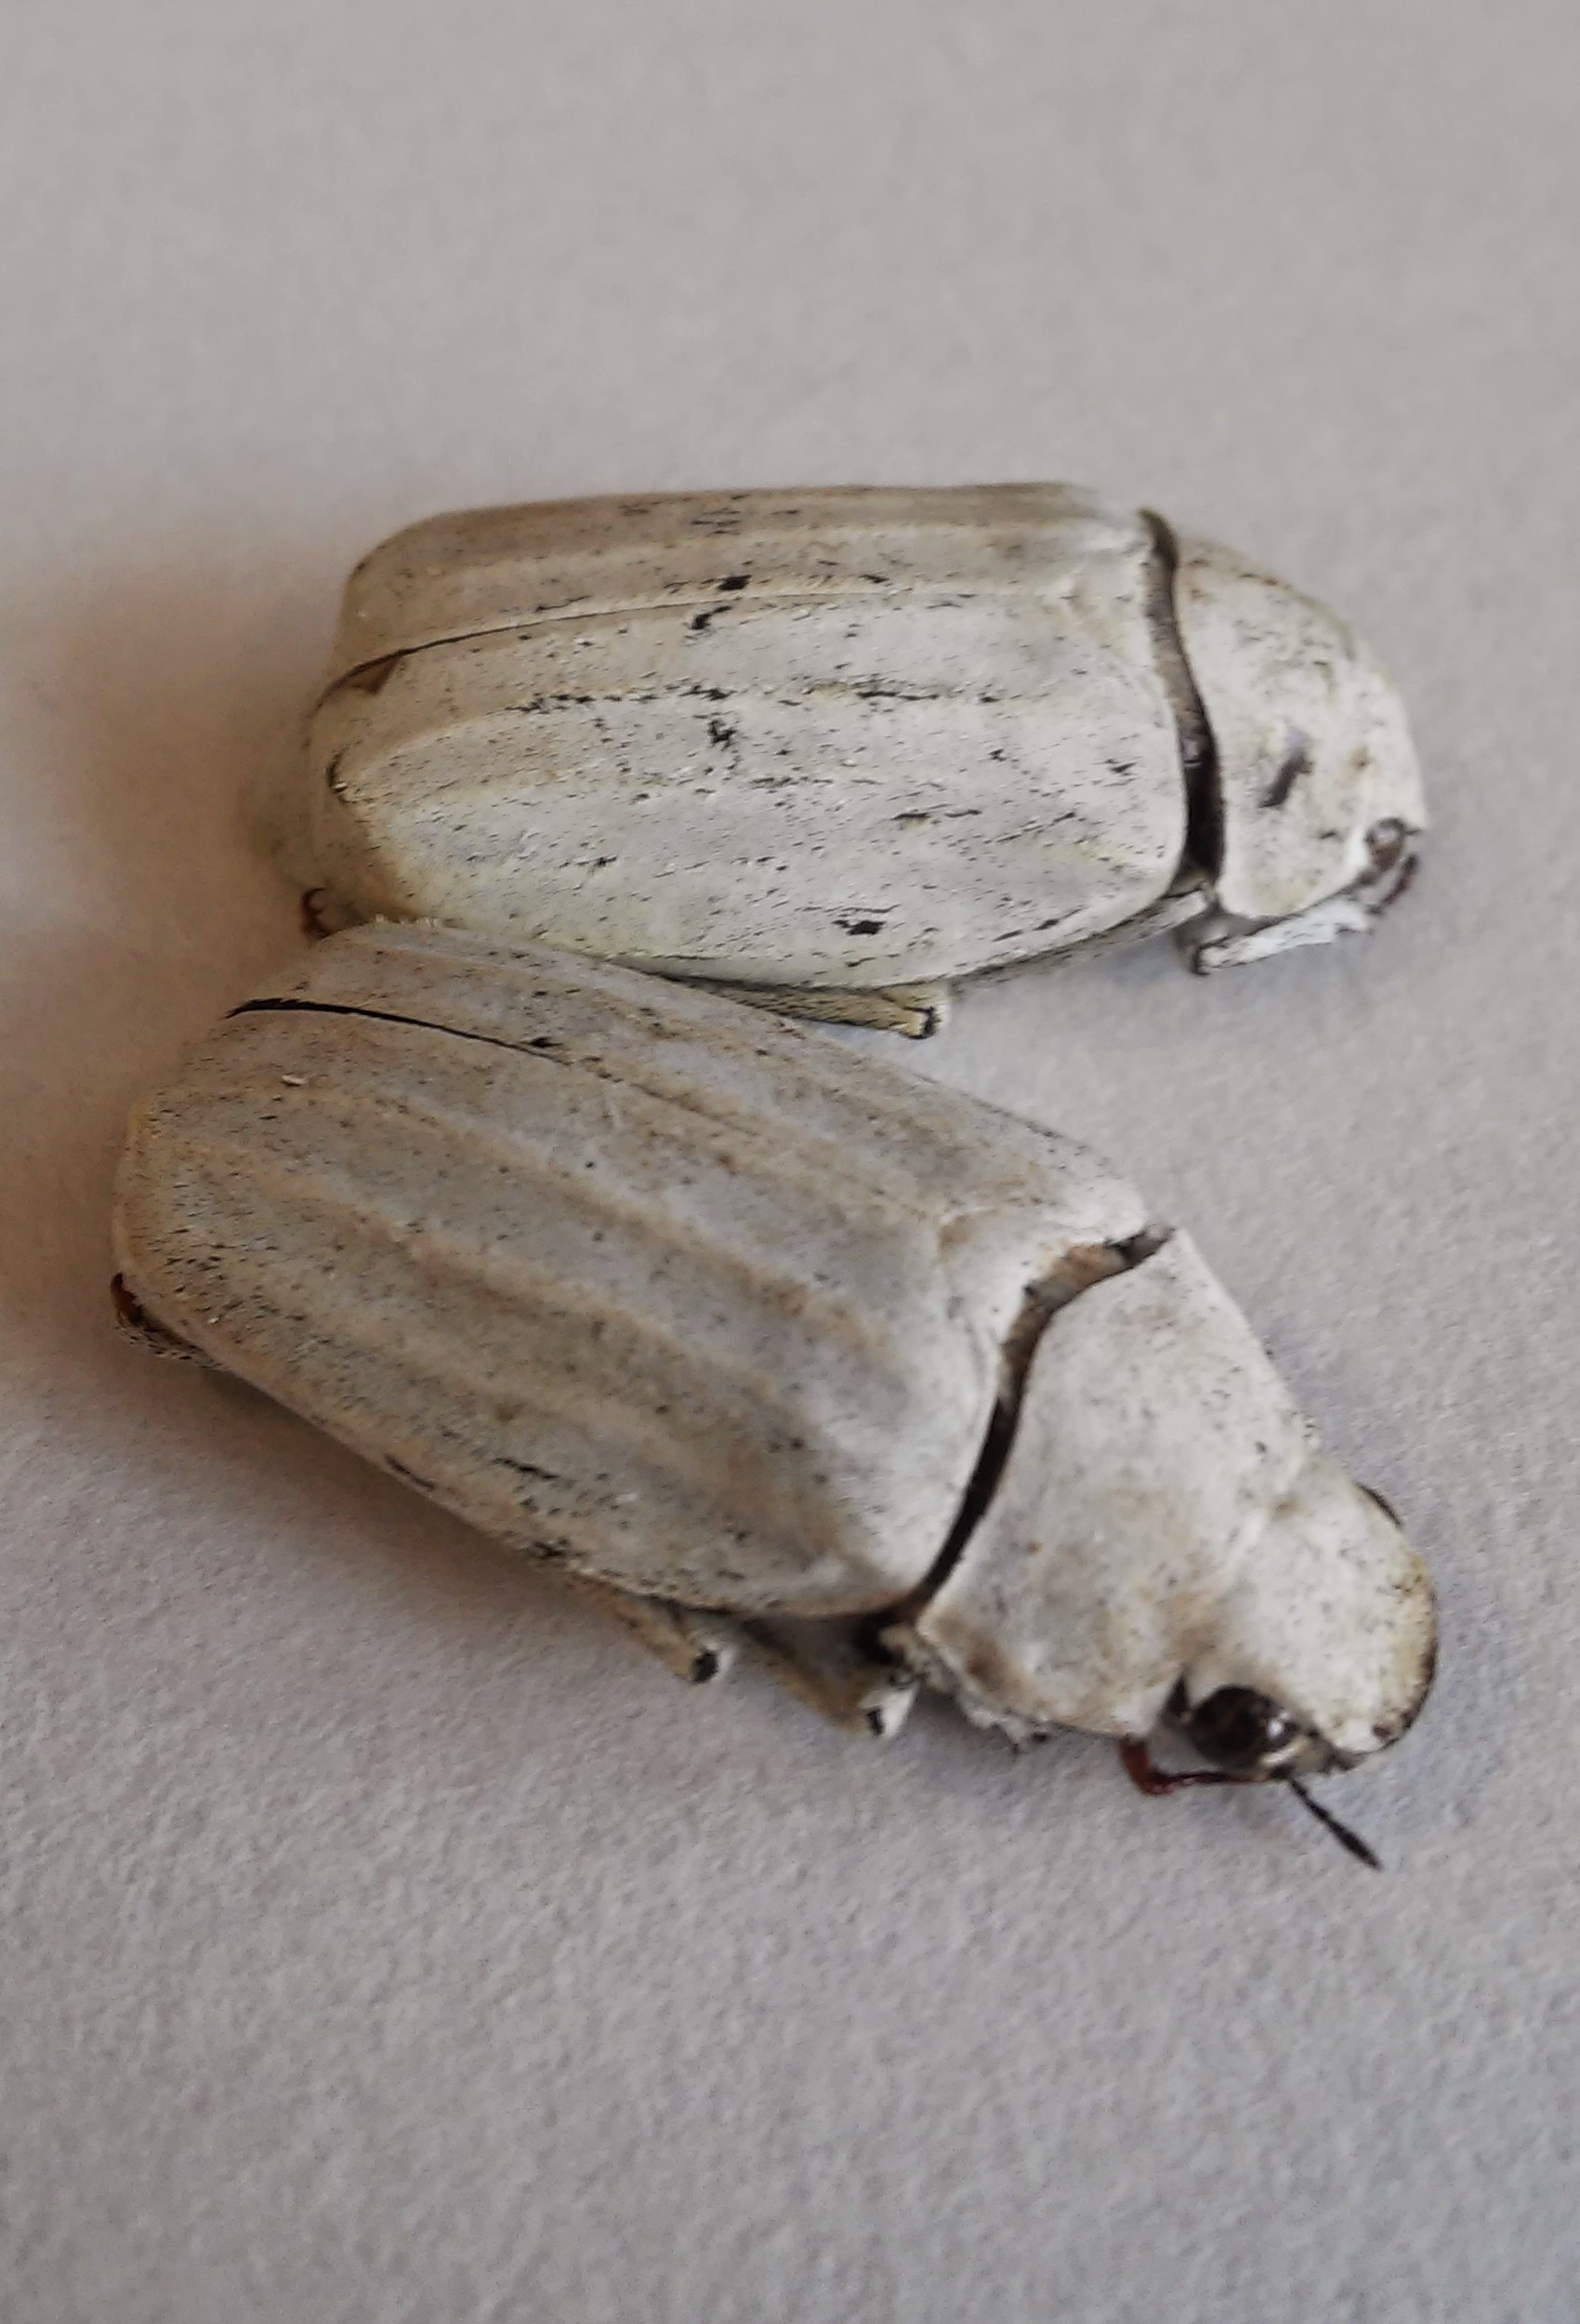
The best natural example is the Cyphochilus beetle. Its scales are a disordered, randomly-oriented network of chitin nanofibers, refractive index around 1.5. That randomness is the key: it scatters light broadly across the visible spectrum instead of absorbing any of it, which reads as bright white using a fraction of the material a solid pigment would need. Researchers have built synthetic mimics, such as a PMMA foam version that hit 90% reflectance at just 60 microns thick, comparable to TiO2 films [3], but that’s a synthetic polymer process, not a biomanufacturing one.
My proposed organism is Komagataeibacter (formerly Gluconacetobacter), the bacterium behind kombucha SCOBY and nata de coco. It’s food-safe and already used industrially. Fed glucose or sucrose, it secretes a nanofibril cellulose network. Cellulose and chitin are close chemical cousins with similar refractive index (about 1.55 for cellulose) and similar fibrous architecture.
The reframe: I’m fermenting a structure, not a molecule. Cellulose itself is a commodity. What the organism provides is a self-assembled nanofibril network that the synthetic mimic needed PMMA and supercritical CO2 drying to fake. The organism does the nanofabrication, fermentation sets the dimensions, and drying preserves them.
What the structure has to look like. A natural assumption is that Komagataeibacter’s fibrils are already close to what the beetle uses. The best-documented benchmark says otherwise. The Cyphochilus scale is a network of chitin filaments about 244 nm in diameter ([4], as used in [5]), packed into a layer only about 8 µm thick [5]. Bacterial cellulose nanofibers are typically 25 to 100 nm in diameter [6], so even at the top of that range they are smaller than the beetle’s filaments, and at the bottom they are about a tenth the size. I’m using the beetle as a benchmark, not as proof that 244 nm is the optimum for cellulose in air. The failure mode of undersized features is a blue-grey cast, because thin fibrils scatter short wavelengths preferentially, which fails a whiteness specification even when total reflectance looks acceptable. That is my physical expectation, not a measurement, and the optical testing in Section 5 is what would confirm it. The direction is what matters: I need larger, better-organized scattering features, not finer ones.
Production organism versus testbed. In my opinion, native K. xylinus is the most plausible production organism for a food ingredient: it has documented food use (nata de coco) and no host-derived contaminants. In Homework 2 I design an E. coli construct, not as the production strain but as a genetic testbed for one hypothesis, that expression level of the BcsD subunit moves fibril diameter. What that dose-response teaches would feed back into strain and media work in the native organism.
A cell-free path, parked as an open question. In 2015, researchers used crude lysate from Gluconacetobacter hansenii (now classified as Komagataeibacter hansenii), a close relative, and converted glucose to cellulose more efficiently than live cells (57.68% versus 39.62% yield on consumed glucose), while producing about the same amount of cellulose, 3.72 versus 3.78 g/L over 15 days [7]. But the figures I have are yield and conversion efficiency, not fibril structure. Since structure is the product, a lysate route only matters if it can assemble organized fibrils, which I don’t know. I’m keeping it as a question to test, not a recommended path.
3. How would I use automation?
Prototyping and screening. Testing strain variants and culture conditions in parallel is well suited to a desktop liquid handler like an Opentrons or a shared Cloud Lab: automated media prep and inoculation across many small cultures. This works well for screening cellulose yield. It does not work for the property I actually care about. Whiteness is a property of a dried solid, and cloud labs and plate readers measure liquids. Fibril architecture needs SEM or AFM, and whiteness needs reflectance spectroscopy on dried films. So I’d split the workflow deliberately: automated parallel culture for yield, and a core facility or collaborator with the right instruments for architecture and optics. A handheld colorimeter giving Lab* values and a whiteness index is a cheap first-pass proxy that would catch the blue-cast failure mode.
Production. Once a recipe is chosen, the need shifts to bioreactor process control (feed rate, pH, dissolved oxygen) and a harvest, wash and dry line. The drying step matters most, because it’s where the structure is preserved or lost. The tools I’d prototype with are not what I’d scale production with.
4. How much would I need to make, and how long would it take?
(a) How much.I’m using tablet/supplement coating as my scale example, since it’s a real, near-term target (a plant-based cellulose TiO2 alternative called SilvaAlba, from BIOGRUND and Seprify, launched into exactly this market in 2026 [8]).
Assume a mid-size nutraceutical manufacturer producing 100 million tablets/year.
Assume 500 mg tablet cores, a 5% coating weight gain (25 mg of coating per tablet), and a coating formulation that is 40% opacifier. That gives about 10 mg of opacifier per tablet. These figures come from a published titanium dioxide versus calcium carbonate coating study [9] on strongly colored cores, so I’m treating them as a realistic high-coverage case rather than a minimum, and I’d want to verify against real formulation data.
100,000,000 tablets × 10 mg = 1,000,000,000 mg = 1,000 kg of dry white material per year.
The mass needed also depends on how well the structure scatters light. Better fibril architecture means less material per tablet, which links the genetic design in Homework 2 directly to scale. One caveat on the 10 mg anchor: TiO2 is far denser than cellulose, so 10 mg of a low-density cellulose network takes up much more coating volume than 10 mg of TiO2. Equal mass will not mean equal coverage, so the true mass could land well above or below 10 mg. I haven’t measured this, so I treat 10 mg as a placeholder anchor, not a result.
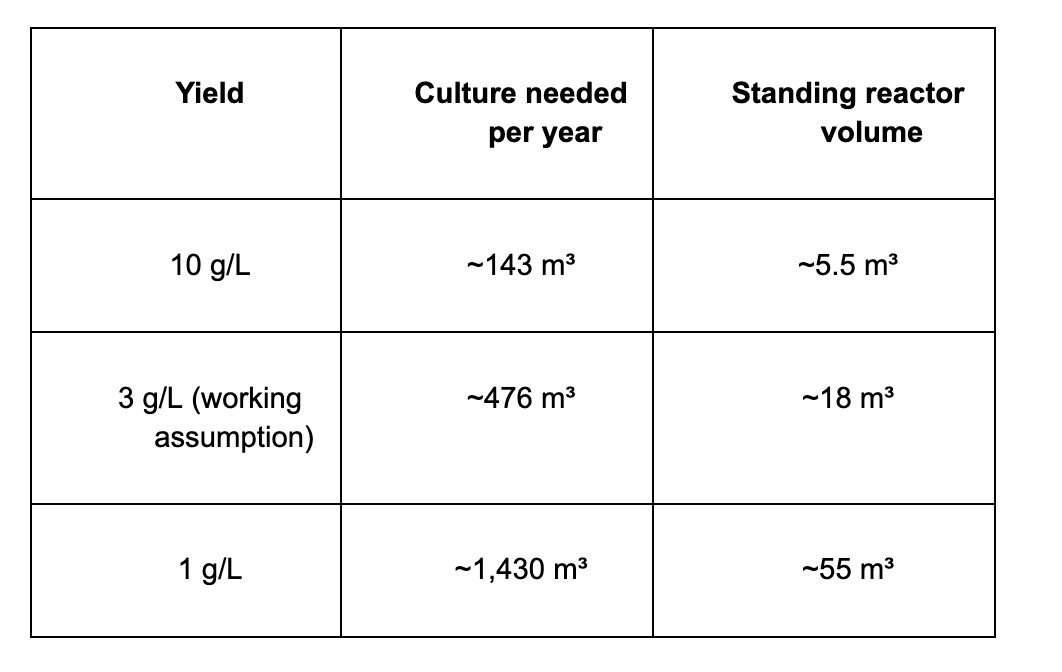
(b) How long. Reported bacterial cellulose yields vary widely. One review describes pellicles forming in 3 to 14 days at up to about 10 g dry weight per liter [6], while one optimized strain reports more than 23 g/L in 10 days of static culture [10] (I haven’t confirmed whether that is dry weight). I don’t have a verified yield for the strain and medium I’d use, so I’m bracketing it with scenarios of 1, 3 and 10 g/L and treating yield as the first thing to measure. Productivity matters more than titer, because reactor cost scales with volume multiplied by time occupied. At 3 g/L over a 10 day cycle that’s about 0.3 g/L/day (10 days of growth inside a 14-day cycle, about 0.2 g/L/day over the full cycle).
Not every gram in the vessel becomes finished white material after harvest, purification, washing, drying and milling. I’m assuming roughly 70% recovery as a placeholder to verify. Culture needed per year is the 1,000 kg of dry material divided by yield times recovery. The table assumes a 14-day cycle (growth plus turnaround):
Yield moves the answer by an order of magnitude, from roughly 140 to 1,430 m³ of culture a year, or about 5 to 55 m³ of reactor running continuously. Yield is therefore the number I would verify first.
Scale also depends on culture mode. Static culture is surface-area limited, so it doesn’t scale linearly with vessel volume. Agitated culture scales better, but it changes pellicle morphology, and morphology is the thing being sold.
The gap between the prototyping scale (small parallel cultures on a liquid handler) and the production scale (thousands of liters) is itself one of the more interesting engineering problems, this is a case where the automation used to develop the idea is nothing like the automation used to make it at volume.
5. What I don’t know yet
These are ordered by how much each would change the project. The first two decide whether the product can be white at all. The last two decide whether it can be sold.
Can the fibrils reach a useful feature size, and does genetics or process move it? Whiteness depends on fibril dimensions and packing. The beetle’s network uses filaments of about 244 nm ([4], as used in [5]), while bacterial cellulose nanofibers are typically 25 to 100 nm in diameter [6]. Thin fibrils scatter short wavelengths preferentially, so an undersized network risks a blue-grey cast instead of white. The open question is whether anything I can control moves fibril diameter toward the beetle’s range. One candidate is the level of the BcsD subunit, which bundles glucan chains into ribbons and is the hypothesis I test in Homework 2. Culture and process conditions are the other. How I’d find out: SEM or AFM for fibril diameter and reflectance on dried films, starting from a wild-type baseline. If nothing moves, this becomes a process invention running on a fermentation feedstock, which is still biomanufacturing, but a different project.
Does the structure survive drying and formulation? The organism builds the structure, but drying and coating decide whether it survives into the finished product. Drying sets the pore and aggregate size distribution, and scattering depends on that distribution and on packing, not on primary fibril size alone. Scattering strength does not increase linearly with filling fraction [5], so packing and drying matter as much as fibril size. I expect drying to be a dominant variable, which makes it something to characterize rather than assume. And because whiteness depends on air in the pores, embedding the material in a coating binder of similar refractive index collapses the contrast the structure relies on. Neither of these is a genetics problem. How I’d find out: a drying and formulation sweep on wild-type pellicles, which are cheap and food-safe, run in parallel with the strain work so the two levers get characterized against each other.
What’s the regulatory pathway, and how long is it? A fermented nanocellulose whitener would likely need a novel food filing (EU) or a GRAS determination (US), which could take longer than the technical work. Native K. xylinus has a documented food-use history through nata de coco, which should help. A recombinant E. coli route would add endotoxin (LPS) removal, antibiotic-marker concerns and host-modified cellulose to the filing. I don’t yet know realistic timelines or precedent for a fermented, rather than extracted, cellulose ingredient.
Can it beat the stopgap alternatives on cost and performance? TiO2 is banned in the EU and under growing pressure elsewhere, so it can’t be the long-term benchmark. The competition is the replacements already on the market (calcium carbonate, calcium phosphate, silica, rice starch, [2] and a plant-based cellulose like SilvaAlba [8]). They are cheaper than a new bioprocess would likely be, but optically weaker than TiO2 ever was. How I’d find out: compute cost per kg on a g/L/day basis, including drying and formulation, and compare against those incumbents. The cell-free route from Section 2 only enters this comparison if it can assemble the right fibril structure.
AI use disclosure
Developed with Claude (Anthropic), used for background research (regulatory status of TiO2/E171, structural-white biomimicry literature, bacterial cellulose fermentation characteristics, existing commercial TiO2 alternatives, cell-free bio-cellulose production precedent) and for structuring/drafting this write-up around the four core questions. All claims below are ones I’ve reviewed and can defend; estimates I haven’t independently verified are flagged inline as assumptions.
I also used Claude Science (Anthropic) as a second AI tool for adversarial review of my drafts and for checking calculations and checking citations. Where its output included figures I could not trace to a source, I removed them or replaced them with sourced values. The volume estimates in Section 4 are stated as scenarios with assumptions flagged inline, and I checked the arithmetic myself.
Prompts for Used for Claude:
Here are notes from the intro class. (added notes summary). Here is homework 1 in detail (shared the homework google doc)
“yeah, let’s ground the project on biocolors. and specifically white. that is the holy grail in the industry and would love to take a stab at it if possible.”
I’d like to refine. So if TiO2 has serious health risks and will be banned, it needs to be removed or replaced. Therefore, whether the biomanufactured or plant extracted versions of white are more expensive than TiO2 isn’t the challenge to solve because it’s gone, it’s what is going to replace it and how much cheaper are the alternatives. So don’t think that’s the unknown
Biomanufactured Structural White: Engineering Cellulose Fibril Architecture for a TiO2 Replacement
Homework 1 proposed a fermented, air-structured white colorant to replace titanium dioxide in food and supplement coatings. This homework designs the genetic construct that sets the structure that colorant depends on.
Part 0: Set up in Kernel
Repository: Azeez White
Project folder: HW2_bcsABD_construct
A note on what Kernel can and can’t do for this project. Kernel’s simulator is mammalian-only, so this E. coli construct is designed and assembled in Kernel using SBOL visual language, but not simulated there. Sequence extraction and verification were done in Benchling, from the source record (GenBank M37202) retrieved from NCBI [1].
The construct checker was run with E. coli K-12 as the expression host and returned zero errors (green check mark).
Part 1: Define your expression target
What molecule am I expressing? BcsA, BcsB, and BcsD from Komagataeibacter xylinus. BcsA and BcsB form the catalytic core of bacterial cellulose synthase, sufficient for cellulose synthesis in vitro [2], and BcsD is the crystallization subunit.
What is the sequence? BcsA (UniProt P19449, [3] 754 aa), BcsB (UniProt P37716 [4], 802 aa), BcsD (UniProt P0DTX0 [5]; GenBank M37202 coordinates 8964..9434, 156 aa). CDS regions extracted and verified in Benchling.
What host or chassis? E. coli K-12 (lacIq, e.g. JM109). See below for why.
Where does the product need to go? BcsA and BcsB are inner-membrane proteins — they insert by nature and need no targeting signal. BcsD is periplasmic in K. xylinus but has no annotated signal peptide, so its localization in E. coli is untested. This is a named risk in Part 6.
What food-safety implications does the host carry? As a Gram-negative organism, E. coli carries lipopolysaccharide (LPS) in its outer membrane. Cellulose product from E. coli fermentation will carry LPS contamination requiring removal in downstream processing — an added purification burden and regulatory consideration for a food ingredient filing. This is a further argument for native K. xylinus as the production chassis once mechanistic questions are answered in E. coli.
Why this is a biomanufacturing problem, not a materials one
I’m not fermenting a molecule, I’m fermenting a structure. Cellulose itself is a commodity. What the organism provides is a self-assembled network of nanofibrils in a size range no chemical process reaches cheaply at scale. The published synthetic mimic of this effect needed PMMA and supercritical CO2 drying to fake an architecture that Komagataeibacter secretes as a byproduct of growing [6].
So the organism is doing the nanofabrication, and the construct’s job is to set the dimensions of what it fabricates. That framing is what makes bcsD the right gene to add. It also means the three stages here are all bioprocess rather than a fermentation step followed by a materials step: the organism builds the structure, the fermentation sets its dimensions, the drying preserves it.
The optical constraint that drives the design
Structural whiteness comes from broadband scattering by a disordered network of features at the right size and packing. The best-documented natural benchmark is the Cyphochilus beetle, whose scales are a chitin filament network with filaments about 244 nm in diameter ([7], as reported in [8]), in a layer only about 8 µm thick [8]. Bacterial cellulose nanofibers are typically 25 to 100 nm in diameter [9], so they sit below that benchmark. I’m treating the beetle as a benchmark, not as proof that 244 nm is the optimum for cellulose in air. The actual target is something the Part 6 experiments have to establish. The direction is clear: the design needs more bundling into larger organized features, not finer ones. The failure mode of undersized features is not dim white, it’s a blue-grey cast, because thin fibrils scatter short wavelengths preferentially. That is a physical expectation, not a measurement.
BcsD promotes the bundling of individual glucan chains into organized crystalline ribbons. If bundling drives feature size upward, BcsD is the genetic lever that sits closest to the optical variable. I’m flagging this as a hypothesis, not an established result. The link between BcsD activity and a specific fibril diameter is exactly what Part 6 proposes to test.
The sequences
BcsA (catalytic subunit): UniProt P19449 [3], K. xylinus, 754 aa. A multi-pass inner-membrane protein. Its cytosolic glycosyltransferase (GT) domain carries both catalytic motifs: the DXD motif, which binds the UDP-glucose substrate and catalyzes glycosidic bond formation, and the QXXRW motif, which confers processivity so the chain keeps growing rather than releasing early. The C-terminus is a separate PilZ domain that binds c-di-GMP and gates the enzyme’s activity.
BcsB: UniProt P37716 [4], K. xylinus, 802 aa. Largely periplasmic with a single C-terminal membrane anchor, tightly associated with BcsA, and required for activity. It guides the nascent glucan chain across the membrane.
BcsD: K. xylinus, from the same GenBank M37202 operon record, coordinates 8964..9434. 471 bp, 156 aa. A small protein that assembles into an octamer forming the passageway where glucan chains crystallize into ribbons; deleting bcsD yields disorganized, less crystalline cellulose. It is periplasmic in K. xylinus, but UniProt annotates no signal peptide and no transmembrane segment, so how it reaches the periplasm is not something I can read off the record. That matters for a heterologous host: I can’t simply “retain the native signal” when no signal is annotated. Treated as a named risk in Part 6, with an engineered signal peptide (PelB or DsbA) as the version-two fix if fractionation shows BcsD stuck in the cytoplasm. Verified in UniProt P0DTX0 [5] (secondary accession P19451, from the same 1990 deposition as M37202): the feature table contains a single CHAIN 1..156 annotation and no SIGNAL or TRANSMEM features, and the sequence is identical to the GenBank translation.
What I’m deliberately leaving out, and the risk that carries
bcsC is not in this construct. It encodes the outer-membrane porin that exports the glucan chain. I’m omitting it because it’s the largest gene in the operon and E. coli carries its own BcsC homolog and outer-membrane export machinery. This is a real bet, not a free omission: without BcsC, product may accumulate in the periplasm rather than being exported. Carried forward as a named risk in Part 6.
This omission has to be read together with the strain choice in Part 2, because on a fast read they look like they cancel: I drop bcsC on the grounds that the host supplies one, then pick a cellulose-negative host. They don’t cancel. The K-12 cellulose-negative phenotype comes from a bcsQ lesion, not a bcsC deletion, so native BcsC remains genomically intact and available for export while the host is still unable to make cellulose of its own. That is the design argument: a clean measurement background and a borrowed export channel from the same strain choice. The honest caveat is that the native E. coli bcs operon is CsgD-regulated and largely silent at 37 °C in rich medium, so genomically present is not the same as expressed. Whether BcsC is actually available under my growth conditions is an experimental question, not an assumption, and it is in Part 6.
Sequence verification
I pulled the source record (GenBank M37202) into Benchling and extracted the CDS regions as standalone sequences to confirm they match the UniProt entries I’m designing around:
bcsA_CDS_Kxylinus, M37202:328..2592, 2,265 bp — Benchling link
bcsB_CDS_Kxylinus, M37202:2594..5002, 2,409 bp — Benchling link
bcsD_CDS_Kxylinus, M37202:8964..9434, 471 bp — Benchling link
The completed lengths match exactly: 754 aa, 802 aa and 156 aa respectively, times three, plus a stop codon. That confirms clean CDS extractions with no extra flanking sequence.
One thing I didn’t know going in
E. coli is not a blank heterologous host here. It has its own native cellulose synthase system, and it is structurally different from Komagataeibacter’s. A 2021 cryo-EM structure [10] shows the E. coli complex pairs one BcsA with a BcsB hexamer, rather than the one-to-one pairing in K. xylinus, plus additional subunits including BcsG, which decorates the cellulose with phosphoethanolamine for biofilm adhesion.
Two consequences I hadn’t anticipated. First, the host’s own machinery competes for the same UDP-glucose pool and confounds attribution of any cellulose I measure. Second, phosphoethanolamine-modified cellulose is a food-safety liability for a product headed toward an ingredient filing, so host background isn’t only an experimental nuisance. Both push toward the strain choice in Part 2.
Host and chassis
Committing to E. coli, K-12 derivative with lacIq (e.g. JM109), rather than E. coli Nissle 1917 or native Komagataeibacter fermentation.
Why E. coli over native fermentation
E. coli has the mature, well-characterized parts catalog this design exercise requires. Native Komagataeibacter fermentation would need no construct design at all. This is an active choice with a real tradeoff, not a default.
Why K-12 and not Nissle, departing from my own precedent
The precedent I’m citing co-expressed bcsA and bcsB from G. xylinus BPR2001 in E. coli Nissle 1917 under a tac promoter and got 1.94 g/L dry cellulose [11]. Critically, expressing either gene alone produced none, so co-expression is obligate.
But Nissle 1917 is cellulose-positive. That means the 1.94 g/L benchmark itself includes an unknown host contribution and cannot be cleanly attributed to the heterologous construct. K-12 lab derivatives commonly carry a bcsQ frameshift that renders them cellulose-negative, which gives a clean background against which to measure. The lacIq genotype also gives tight tac repression until induction.
As noted in Part 1, the bcsQ lesion is what makes this work: it silences host cellulose production without removing bcsC, so the export channel stays available while the measurement background goes clean.
The titer objection, and why titer alone isn’t the right metric
The obvious objection is that 1.94 g/L is below native Komagataeibacter. One review describes native pellicles forming in 3 to 14 days at up to about 10 g dry weight per liter under standard conditions [9], and one optimized strain reports more than 23 g/L in 10 days of static culture [12]. I haven’t confirmed whether that figure is dry weight.
Titer ignores time. If E. coli reaches about 1.94 g/L in roughly a day (an assumption to verify against the source paper), then productivity rather than titer drives reactor cost. But optimized native strains report productivity that would match or exceed that, so I treat any productivity advantage for E. coli as a hypothesis to test, not a result.
One qualification I owe this number. I argue above that Nissle’s cellulose-positive background contaminates the 1.94 g/L figure, which means the same figure cannot then serve as a clean numerator here. The contamination inflates the E. coli side, so any E. coli productivity advantage is an upper bound. Whether any productivity advantage survives depends on the native baseline, which I haven’t verified, so the comparison needs a clean E. coli titer and a measured native productivity before it carries weight.
Two further points bear on the comparison. Native production is static surface culture, which is surface-area limited and does not scale linearly with vessel volume. Agitated culture does scale, but it changes pellicle morphology, and morphology is the thing being sold.
Part 2: Design your genetic parts
All parts were created or imported in Kernel (HTBAA 2026 workspace, repository Azeez White, folder HW2_bcsABD_construct) with the correct part type assigned to each.
Per the recitation guidance, parts are sourced from the iGEM Registry [13] and existing sequence records rather than designed from scratch, and the backbone is reused rather than built.
Part 3: Assemble the construct
5’ to 3’ order
ptac → RBS1 → bcsA → RBS2 → bcsB → RBS3 → bcsD → BBa_B0015 terminator
A single tricistronic transcript on the pKK223-3 backbone, with lacI supplied in trans by the lacIq host.
The schematic shows the insert. pKK223-3 is described rather than drawn, as it was not available in any repository connected to Kernel. Its contribution is the ColE1 origin, ampicillin resistance, ptac and rrnB T1T2; ptac is inherited from the vector rather than added as a separate registry part.
Why one operon rather than three cassettes
Co-expression is obligate, so a single transcript enforces coordinated induction by construction rather than by hoping two plasmids stay balanced. It also mirrors why the native bcs genes are clustered in the first place: stoichiometric co-expression. Three separate cassettes would add three promoters and three terminators for no benefit.
Why bcsD sits last, and why that position is the design
bcsD is the tuning target. Putting it at the 3’ end means RBS3 can be swept across a strength ladder while the catalytic core’s expression stays fixed, so any change in fibril architecture is attributable to BcsD level rather than to a shifting BcsA:BcsB ratio.
Flagging the limitation honestly: polar effects mean absolute BcsD level also depends on position in the polycistron, so an RBS sweep measures relative rather than absolute changes. That’s sufficient for finding a direction, not for reporting an absolute stoichiometry.
Strand and directionality checks
Readthrough termination and convergent-transcription risk from backbone promoters could not be verified in Kernel (pKK223-3 unavailable); both would be confirmed against the vector map before ordering.
Sequence checks: confirmed in Kernel
Reading frame intact. The sequence viewer translates bcsA from its ATG as MSEVQSPVPAESRLDRFSNK, matching the protein deposited with M37202 exactly.
Start and stop codons present on each CDS. The native CDSs from M37202 each end in a single TGA stop; the codon-optimized versions ordered in Part 5 carry TGA+TAA double stops from the optimizer’s stop-codon preference (see Part 4).
Note on sequence sets: the Kernel assembly uses native CDSs for reading-frame and junction verification. The gene fragments to be ordered (Part 5) are the codon-optimized versions, which already carry the TGA+TAA double stops. The native-vs-optimized comparison for BcsA described in Part 5 is a planned first experiment, not an unresolved choice.
No frameshift at the RBS-to-CDS junctions. Implied by the correct bcsA translation: a shifted junction would have produced nonsense from the first codon.
No internal stop codons in the native sequences. All three translate cleanly end to end.
Still pending, because they depend on codon optimization
No internal stop codons introduced during optimization
No unintended restriction sites created during optimization
Size, and one native feature this design breaks
Coding sequence totals 2,265 + 2,409 + 471 = 5,145 bp. Regulatory parts add 226 bp (ptac 61, three RBSs at 12 each, terminator 129), giving a 5,371 bp insert and roughly a 10 kb plasmid with the backbone.
In M37202, bcsC ends at 8964 and bcsD begins at 8964, a single-base overlap. That arrangement is the classic signature of translational coupling, where ribosomes terminating on the upstream gene reinitiate on the downstream one, tying BcsD synthesis to BcsC synthesis. My construct omits bcsC and gives bcsD an independent RBS, which deliberately decouples them. That is the point, since decoupling is what makes RBS3 a usable tuning variable, but it means BcsD expression here is not regulated the way it is natively, and the native ratio is not something I’m preserving.
Part 4: Optimize and quality-check
The native CDSs measured from the M37202 sequences in Benchling are in the ~58–63% GC range (per-gene values from the sequence records), compared to ~50–51% for E. coli, so meaningful codon divergence was expected. bcsA 58.45%, bcsB 62.64%, bcsD 61.78%.
Ran a rare-codon analysis on the native sequences extracted from GenBank M37202:
Rare codons are dominated by CCC (Pro) and CGG (Arg), not the AGA/AGG/AUA codons typically flagged for E. coli expression. With 1.3 to 5.0% burden, codon scarcity alone is unlikely to be rate-limiting. I generated optimized versions as a comparison arm for synthesis and expression, not on the assumption that they will outperform the native sequences (see Part 5).
Codon optimization
Ran Kernel’s Codon optimizer (Toolbox → Codon optimizer) on each of the three native CDSs with identical parameters: expression host Escherichia coli, input type DNA, algorithm SIMPLE_0_3, stop codon preference TGA+TAA. Quality scores (Asimov Codon Usage Index, RNA structure score) returned N/A for all three — expected for a non-mammalian host, since those metrics are calibrated to CHO/HEK expression systems. Outputs saved as bcsA_CDS_Kxylinus_Ecoli_opt, bcsB_CDS_Kxylinus_Ecoli_opt, bcsD_CDS_Kxylinus_Ecoli_opt.
Sequence alignment (native vs. optimized)
Ran Kernel’s pairwise Sequence alignment tool (Toolbox → Sequence alignment) comparing each native K. xylinus CDS against its codon-optimized version:
DNA identity of ~65-68% confirms extensive synonymous codon substitution. The 3 bp length difference in each alignment reflects stop codon handling by the optimizer and introduces no frameshift. The identity percentages are as reported by the Kernel tool; direct arithmetic, (length − mismatches)/length, gives 59.5%, 57.9% and 62.4%, a gap of roughly 6 to 7 points from the reported identity whose source is not explained here. The mismatch counts are the unambiguous figures: 918 of ~2,265 positions changed in bcsA, 1,014 of ~2,409 in bcsB, 177 of ~471 in bcsD — all confirm extensive synonymous substitution. Protein-level identity is 100% for all three genes and confirms that optimization changes only which codons encode each amino acid, not which amino acids are encoded.
Identity verification was done upstream: CDSs were extracted directly from GenBank M37202 in Benchling and protein lengths confirmed against UniProt. The 100% protein identity in all three pairwise alignments confirms no amino acid changes were introduced by codon optimization. Known limit: pairwise native-vs-optimized alignment verifies sequence identity but does not detect unintended homology between the optimized sequences and off-target human or pathogen proteins. A full BLASTp search against nr/Swiss-Prot remains the appropriate check for any sequence entering a synthesis order.
Biosecurity scan
Ran Kernel’s Biosecurity sequence scanner (Toolbox → Biosecurity sequence scanner) on each codon-optimized CDS. All three returned “No flagged sequences detected.” The cellulose synthase genes are derived from Komagataeibacter xylinus, a non-pathogenic acetic acid bacterium classified as BSL-1, and encode structural polysaccharide biosynthesis enzymes with no known toxicity or dual-use concern.
Part 5: From design to build
How I’d build it
Order three codon-optimized gene fragments (bcsA, bcsB, bcsD), plus a native-sequence bcsA fragment as the comparison arm, and assemble them with the backbone and regulatory parts by Gibson Assembly [14]. The codon analysis in Part 4 complicates the optimization step, and suggests testing the native sequences first may be the better first experiment, especially for BcsA. BcsA is a polytopic inner-membrane protein with multiple predicted transmembrane helices. At the junctions between membrane-spanning and cytoplasmic segments, naturally occurring rare codons can act as translational pause sites, giving each nascent helix time to insert before the next is synthesized. Full codon optimization removes those pauses and can accelerate translation past membrane insertion windows, producing misfolded or aggregated product. The native codon bias in BcsA may be partially functional rather than accidental, and a head-to-head native-vs-optimized comparison for BcsA specifically would test this directly. The assembly method is the same either way. Gibson suits this specifically because it needs no restriction sites at the junctions, and four to five overlapping fragments self-assemble in correct order in a single 50 °C reaction. With roughly eight functional parts folded into four or five physical fragments, that’s considerably simpler than stepwise restriction-ligation.
What synthesis constrains
Carr et al. [15] is the relevant caution: synthesis error rates compound with length. bcsA is the risk in this construct. As a multi-pass transmembrane protein it encodes several repeated, hydrophobic helix regions, which is exactly the sequence character prone to elevated local error and secondary-structure problems during synthesis. I’d apply MutS-based protein-mediated error correction to the bcsA fragment specifically, rather than assuming standard synthesis purity across a construct this size. bcsB is intermediate. bcsD, at 471 bp, is short enough to be low-risk.
Prototype versus scale: 1 unit to 10,000
At 1 unit, the goal is confirming the construct works at all: one Gibson assembly, one transformation, sequence-verified, then a Calcofluor white or cellulase-release glucose assay to quantify cellulose output against the 1.94 g/L reported figure, as a rough yardstick rather than a clean baseline (see Part 1). (Congo red is not suitable as the primary readout in K-12: E. coli K-12 is curli-competent, and Congo red stains amyloid-like curli fimbriae with similar intensity to cellulose. Any Congo red signal would be a mixed readout, not attributable to cellulose alone. Calcofluor white is more cellulose-selective; a cellulase-release glucose assay or gravimetric pellicle measurement gives a direct quantitative readout. If Congo red is used for rapid screening, include a ΔcsgA or ΔcsgD curli-null isogenic control).
At 10,000 units, matching the Homework 1 scale estimate (roughly 140 to 1,430 m³ of culture per year, depending mostly on yield), the construct itself doesn’t change but everything around it does:
The strain needs banking and genetic stability checks across many generations. Plasmid loss and mutation risk rise over long fermentation runs, and a 10 kb plasmid under strong induction is a real burden.
IPTG becomes a genuine cost line at volume. The right move at scale is migrating to autoinduction or a constitutive variant, which means the tac system is a prototyping choice, not a production one.
AmpR is similarly a prototyping choice, not a production one. Beta-lactam resistance markers are disfavored in food production strains; residual antibiotic use and resistance gene transfer are both concerns that complicate ingredient filings. A food-grade vector without an antimicrobial resistance selectable marker, or a marker-free integration strategy, would be the requirement before any scale-up for food use.
Bioreactor behavior differs from shake flask on oxygen transfer, mixing and induction timing.
Most importantly: the step that determines whether the product is white at all is downstream of everything on this plasmid. Harvest, wash and dry are not DNA problems. See Part 6.
Part 6: What I don’t know yet, and how I’d find out
Eight unknowns are listed here, ordered roughly by how much each would change the design.
Does BcsD do anything useful without BcsC and the rest of the terminal complex? This is the central bet of the construct. BcsD’s ribbon-crystallization role is characterized in the context of a full native terminal complex, and I’m asking it to work with only BcsA and BcsB for company. How I’d find out: build the construct with and without bcsD as a matched pair, grown identically, and compare the cellulose by SEM or AFM for fibril diameter and by XRD or FTIR for crystallinity index.
The harder version of this question, which I don’t think adding bcsC would answer. In K. xylinus, ribbon width is set by the geometry of a linear array of terminal complexes running along the cell surface, and E. coli has no equivalent array. If array geometry rather than BcsD is what determines ribbon width, then no amount of BcsD in E. coli produces a native-width ribbon, and adding bcsC next would not fix it either. That would point to a two-chassis framing — but for a food colorant ingredient, the split doesn’t hold cleanly. Native K. xylinus wins on fibril architecture, documented food use (nata de coco is a commercial food product), no pEtN cellulose modification, and no AmpR marker complicating an ingredient filing. The E. coli construct may win on volumetric productivity, but that is unverified and the benchmark is contaminated as argued in Part 1. The more honest conclusion: native K. xylinus is the likely production route for a food application; the E. coli construct is a mechanistic testbed for characterizing how BcsD level affects fibril architecture without conflating it with organismal context. What experiment 2 learns about the BcsD dose–response would directly inform strain selection and media optimization in the native organism.
How I’d tell the two apart: measure crystallinity and width separately. XRD or FTIR reports crystallinity; SEM or AFM reports width. If BcsD raises crystallinity but leaves width unchanged, the array geometry explanation is the live one and the chassis is the problem. If both move together, BcsD is doing the work and the design holds.
Does bcsD expression level actually move fibril diameter? (the designed experiment) The whole rationale for the RBS3 ladder is the hypothesis that more BcsD means more bundling means larger scattering features. That is currently an inference, not a measurement.How I’d find out: build a BcsD expression-level series by varying RBS3, grow in parallel, and plot measured fibril diameter against measured BcsD protein level (Western blot). Critical note on part selection: BBa_B0034 is the strongest member of the community (Elowitz) collection (BBa_B0030–B0034); sweeping that family downward tests less BcsD than the baseline and cannot falsify “more BcsD → more bundling.” Variants that test the predicted direction sit above B0034 — the Salis RBS Library Calculator or a short degenerate NNN region after the Shine–Dalgarno can sample that space. B0030–B0033 could still serve as a lower-expression control arm, establishing whether the dose–response is monotonic. A flat line falsifies the design rationale only if BcsD protein level actually changed across the series and BcsD reached the periplasm (item 3). With those two checks in place it is a clean test, which is what makes it worth running first. This experiment structure is also what the Petzold/Mukhopadhyay reading’s parallel screening infrastructure is built for.
Do BcsC’s absence and BcsD’s missing signal peptide both strand the product in the wrong compartment? Two localization risks share one assay. Without BcsC, cellulose may accumulate in the periplasm instead of being exported. And since BcsD has no annotated signal peptide, it may never reach the periplasm at all, in which case the passageway the construct is built around never forms. How I’d find out: fractionate cytoplasm, periplasm and extracellular medium, then blot for BcsD to confirm where the protein ends up and assay cellulose in each fraction to confirm where the product ends up. A cytoplasmic BcsD signal says add an engineered signal peptide (PelB or DsbA) in version two. A periplasmic BcsD with periplasmic cellulose says BcsC is required after all.
Will the complex fold and function, and where does any yield gap come from? A shortfall could come from incomplete membrane insertion, subunit misfolding, insufficient c-di-GMP to activate BcsA, or simply low expression, and each points to a different fix. How I’d find out: membrane fractionation plus Western blot to confirm all three subunits are inserted at the expected size and not degraded or in inclusion bodies, paired with a Calcofluor white or cellulase-release glucose assay to confirm cellulose output. If c-di-GMP turns out to be limiting, the corrected mechanism says the lever is co-expressing a diguanylate cyclase to raise the host pool, not increasing BcsB.
Will host background confound the measurement? How I’d find out: confirm the chosen K-12 derivative is cellulose-negative by assaying the untransformed strain first, and treat that as the blank. This is also why I moved off Nissle. A cellulose assay can’t tell me whether host BcsC is expressed, so I’d also run qPCR or a Western blot for BcsC on the untransformed strain under my growth conditions, since the bcsC omission rests on that assumption.
The measurement gap, which is a project risk and not just an experimental one. Whiteness is a property of a dried solid. Cloud labs and plate readers measure liquids. So the automation infrastructure available to this course can screen cellulose yield across many conditions, but cannot measure the property I actually care about. Fibril architecture needs SEM or AFM; whiteness needs reflectance spectroscopy on dried films. How I’d find out: split the workflow deliberately. Yield screening goes to automated parallel culture; architecture and optics go to a core facility or a collaborator with the right instruments. A handheld colorimeter giving Lab* and a whiteness index is a cheap first-pass proxy that would catch the blue-cast failure mode.
Dividing the labor honestly: what genetics controls and what process controls.
The construct sets the target dimension. The drying process determines whether that dimension survives into the finished material. Both are bioprocess steps, both can fail independently, so it’s worth being precise about which does what.
Process carries real weight here. Drying sets the pore and aggregate size distribution, and scattering depends on that distribution and on packing, not on primary fibril size alone. Scattering strength does not increase linearly with filling fraction [8], so packing and drying matter as much as fibril size. I expect drying to be a dominant variable, which is why it’s worth characterizing rather than assuming. And because whiteness depends on air filling the pores, embedding the material in a tablet-coating binder of similar refractive index collapses the very contrast the structure relies on. Neither is something a plasmid addresses. This is the ordinary shape of materials biomanufacturing, where the organism makes the building block and downstream processing makes the material, the same division found in spider silk and mycelium leather.
What that means for the construct: it has to earn its place by hitting a fibril dimension that wild-type can’t reach reproducibly. That is a falsifiable claim, and experiment 2 above is the test. If BcsD level moves fibril diameter toward the optimum, strain engineering is doing real work on a measurable material property. If it doesn’t, I’d have learned this is a process invention running on a fermentation feedstock, which is still a biomanufacturing project (nata de coco is a fermented food) but a different one, and I’d rather know that early.
How I’d find out where the leverage actually sits: run a drying sweep on wild-type Komagataeibacter pellicles, which are cheap, food-safe and need no genetics, and measure reflectance across drying methods. Run it in parallel with the RBS ladder rather than before it, so the two levers get characterized against each other instead of sequentially.
Does any of this make economic sense? How I’d find out: once real titer, run time and media cost exist for this construct, redo the Homework 1 cost-per-kg math on a g/L/day basis rather than titer, including drying and formulation cost, and compare against calcium carbonate, rice starch and microcrystalline cellulose. The honest possibility remains that this construct is a good proof of concept for engineering the pathway and not the eventual production strain.
AI use disclosure
Developed with Claude (Anthropic), used for background research (bcs operon structure and subunit function, c-di-GMP regulation, structural-color scattering physics, E. coli native cellulose machinery, iGEM part characteristics) and for structuring this write-up against the assignment deliverables.
Claude and Claude Science (both Anthropic) were also used adversarially, across three rounds of critical review of my own drafts. Round one surfaced the inverted reasoning about bcsC/bcsD, the BcsB c-di-GMP error, and the catalytic motif placement. Round two surfaced the unsupported BcsD signal-peptide claim, the apparent contradiction between omitting bcsC and choosing a cellulose-negative host, and the fact that I was using a contaminated titer as a clean numerator in the productivity argument. All of those corrections are incorporated above and flagged inline where they changed the design. A third round addressed structural issues in the design argument, including the RBS ladder direction and the scattering target framing, both of which are corrected above. Figures from either tool that I could not trace to a source were removed, and I checked the citations and numbers in this document against the source records.
Representative prompts included: “What is the function of BcsD in the K. xylinus cellulose synthase complex and does it have a signal peptide?”; “Review this construct design for scientific errors”; “What are the rare codons in bcsA from GenBank M37202?”; “Compare E. coli vs. Komagataeibacter on volumetric productivity.”
All claims here are ones I’ve reviewed and can defend. Estimates I haven’t independently verified are flagged inline as assumptions, and items still requiring verification in Benchling or against source papers are marked in brackets.
Sources referenced
[1] National Center for Biotechnology Information. GenBank accession M37202, Komagataeibacter xylinus cellulose synthase operon (source record for bcsA, bcsB and bcsD CDS extraction; bcsD at 8964..9434). https://www.ncbi.nlm.nih.gov/nuccore/M37202
[2] Omadjela, O., Narahari, A., Strumillo, J., Mélida, H., Mazur, O., Bulone, V., & Zimmer, J. (2013). BcsA and BcsB form the catalytically active core of bacterial cellulose synthase sufficient for in vitro cellulose synthesis. Proceedings of the National Academy of Sciences, 110(44), 17856-17861. https://doi.org/10.1073/pnas.1314063110
[6] Syurik, J., Siddique, R. H., Dollmann, A., Gomard, G., Schneider, M., Worgull, M., Wiegand, G., & Hölscher, H. (2017). Bio-inspired, large scale, highly-scattering films for nanoparticle-alternative white surfaces. Scientific Reports, 7, 46637. https://doi.org/10.1038/srep46637
[7] Luke, S. M., Hallam, B. T., & Vukusic, P. (2010). Structural optimization for broadband scattering in several ultra-thin white beetle scales. Applied Optics, 49(22), 4246-4254. https://pubmed.ncbi.nlm.nih.gov/20676179/
[8] Burresi, M., Cortese, L., Pattelli, L., Kolle, M., Vukusic, P., Wiersma, D. S., Steiner, U., & Vignolini, S. (2014). Bright-white beetle scales optimise multiple scattering of light. Scientific Reports, 4, 6075. https://doi.org/10.1038/srep06075
[9] Potočnik, V., Gorgieva, S., & Trček, J. (2023). From nature to lab: Sustainable bacterial cellulose production and modification with synthetic biology. Polymers, 15(16), 3466. https://doi.org/10.3390/polym15163466
[10] Acheson, J. F., Ho, R., Goularte, N. F., Cegelski, L., & Zimmer, J. (2021). Molecular organization of the E. coli cellulose synthase macrocomplex. Nature Structural & Molecular Biology, 28(3), 310-318. https://doi.org/10.1038/s41594-021-00569-7
[11] Sajadi, E., Fatemi, S. S.-A., Babaeipour, V., Deldar, A. A., Yakhchali, B., & Anvar, M. S. (2019). Increased cellulose production by heterologous expression of bcsA and B genes from Gluconacetobacter xylinus in E. coli Nissle 1917. Bioprocess and Biosystems Engineering, 42(12), 2023-2034. https://doi.org/10.1007/s00449-019-02197-4
[12] Gullo, M., Sola, A., Zanichelli, G., Montorsi, M., Messori, M., & Giudici, P. (2017). Increased production of bacterial cellulose as starting point for scaled-up applications. Applied Microbiology and Biotechnology, 101(22), 8115-8127. https://doi.org/10.1007/s00253-017-8539-3
[13] iGEM Registry of Standard Biological Parts. BBa_K864400 (ptac promoter, 61 bp; used as the reference sequence for ptac, which the construct gets from the pKK223-3 backbone), BBa_B0034 (RBS, designed by Elowitz, 1999), BBa_B0030 to BBa_B0033 (RBS strength ladder), BBa_B0015 (double terminator). https://parts.igem.org/Part:BBa_K864400, https://parts.igem.org/Part:BBa_B0034 and https://parts.igem.org
[14] Gibson, D. G., et al. (2009). Enzymatic assembly of DNA molecules up to several hundred kilobases. Nature Methods, 6, 343-345. https://doi.org/10.1038/nmeth.1318
[15] Carr, P. A., et al. (2004). Protein-mediated error correction for de novo DNA synthesis. Nucleic Acids Research, 32, e162. https://doi.org/10.1093/nar/gnh16
Designs submitted:coopetition.htgaa.org. One composition each for sfGFP, PETase and Reteplase, submitted October 8 and 12.
Status: Part A and Part B complete. Part C not attempted. Five reagents upvoted in Community Reagents, with the Erv1p rationale written up in B2.
If you are picking this up: the open questions are listed at the end of B2 and in the Reflection. The two I would most want challenged are the DsbA-versus-Erv1p mechanism argument and whether H₂O₂ contributes useful oxidizing capacity.
The short version
I was given a 20 microlitre drop of liquid and asked to decide what goes in it, so that three different proteins get built as cheaply as possible. This page explains what I chose and why.
If you have no biology background, the next three sections should be enough to follow the whole thing.
Making protein without a cell
Normally, if you want a protein, you grow bacteria and let them make it. The cell handles everything: it feeds itself, keeps itself alive, manages its own chemistry.
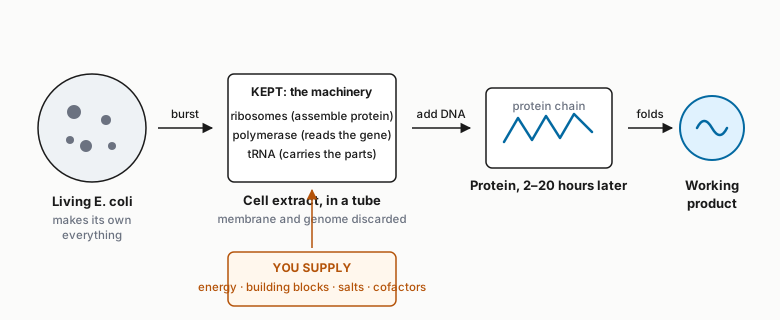
Cell-free protein synthesis skips the living part. You burst the bacteria open, throw away the shell and the genome, and keep the machinery that reads genes and assembles proteins. Then you add a gene you care about, plus everything the cell used to supply for itself.
That last part is the whole assignment. In a living cell, the recipe is the cell’s problem. Here it is mine. Energy, raw materials, salts, acidity, helper molecules: I pick every one, and the protein comes out well or badly depending on what I picked.
The upside is total control and speed. You can change the recipe and see the result the same day, with no organism to keep alive.
Three proteins, one easy and one brutal
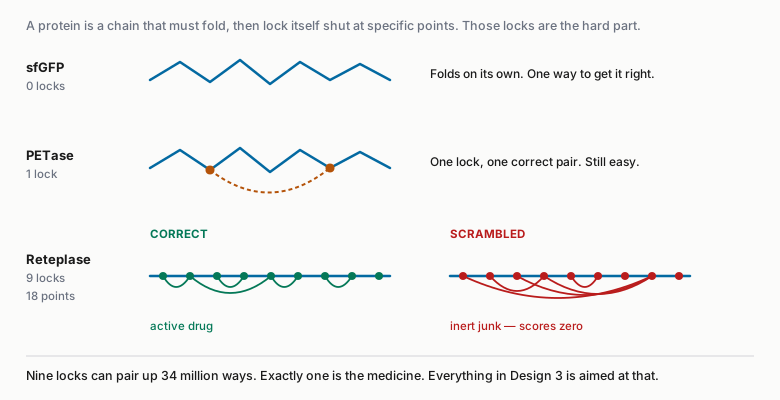
A protein starts as a long chain and has to fold into a specific shape. Some proteins also lock themselves shut at particular points along the chain, like snapping a few press studs. Those locks are called disulfide bonds, and they are where this gets hard.
sfGFP has none. It folds on its own and glows green when it works, so you can measure it by shining a light at it.
PETase has one. It is an enzyme that breaks down PET plastic.
Reteplase has nine. It is a real clot-busting drug given to heart attack patients. Nine locks means eighteen points that have to find the right partner, and there are over 34 million ways to pair them up. One of those is the medicine. The rest are inert junk.
This is why Reteplase is normally not made this way at all. Industrially it is produced as useless clumps and then chemically unfolded and refolded in a separate step.
Volume is the real constraint
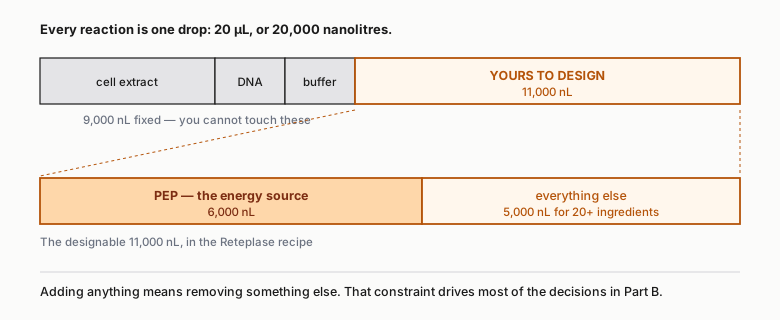
The reaction is one drop. Just over half of it is already spoken for before I touch anything.
Everything is dispensed by a robot that moves liquid in 25 nanolitre increments, roughly a two-thousandth of a drop. So the recipe is not just a list of ingredients. It is a budget, and the energy source alone can eat more than half of it.
The rule that drives every decision
The three proteins are not scored the same way, and this is the single most useful thing to know before reading the rest.
sfGFP is scored on how much protein you make per dollar. More is better. Simple.
PETase and Reteplase are scored on how much working protein you make per dollar. Misfolded protein counts as zero.
So the two halves of this project pull in opposite directions. My sfGFP recipe chases cheap volume. My Reteplase recipe spends scarce space on folding help it could have spent on making more protein, because more broken Reteplase is worth nothing.
What happens to these recipes
This is a coopetition, a cooperative competition. Everyone in the class designs recipes, OpenAI agents running GPT-5 design their own, and Ginkgo Bioworks runs the best ones in an automated lab. Around 320 unique recipes go in per cohort. Selection favors ideas that explore somewhere new, so near-duplicates get dropped. Expert labs are competing too, including Kate Adamala’s and Mark Styczynski’s.
How to read the rest
Part A compares published recipes and works out which ingredients actually matter.
Part B gives my three recipes, what each one tests, and what it cost.
The Appendix shows every calculation, so you can check my arithmetic.
The AI use section records three things I got wrong and how they were caught.
Part A: Compare Cell-Free Reaction Compositions
A1. Why does the concentration of potassium glutamate and magnesium glutamate differ between compositions? Which is more sensitive?
Why both are glutamate salts in the first place
Before the concentrations, the counter-ion. Every modern CFPS formulation uses glutamate rather than acetate or chloride, and that was a deliberate change made by Jewett & Swartz in 2004 [1]. Glutamate is the principal anion E. coli accumulates under osmotic stress, and protein–nucleic acid interactions are more favorable in glutamate than in acetate solutions (Record et al., as cited in [1]). Chloride actively inhibits some CFPS enzymes. So when we adjust “potassium glutamate,” we are tuning K⁺ against a counter-ion chosen to mimic the cytoplasm.
They do different jobs
Potassium is the bulk monovalent cation. It sets ionic strength and supports ribosome function, and the cell’s own K⁺ concentration is in the physiological range these formulations target.
Magnesium is a structural divalent. It holds the ribosomal subunits together and keeps tRNAs correctly folded. Too little and translation stalls; too much and proteins aggregate.
Three reasons the numbers differ between published compositions
1. How the extract was prepared. Dialyzed extracts are stripped of residual small molecules and need more supplementation. Jewett’s 2004 work used dialyzed A19 (a K-12 derivative) and landed on 20 mM magnesium glutamate for PANOx-SP. Modern formulations built on non-dialyzed BL21 Star (DE3) lysate, which carries its own residual magnesium, sit at 7 to 9 mM. Both are correct for their own system.
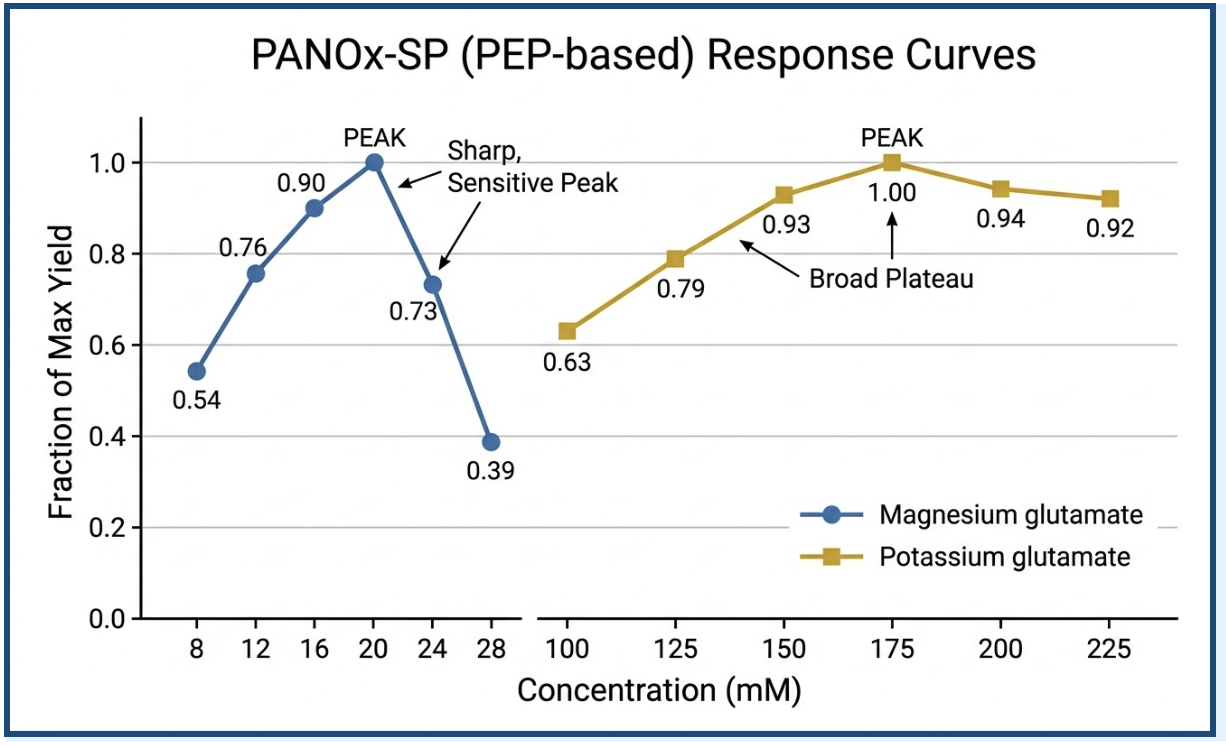
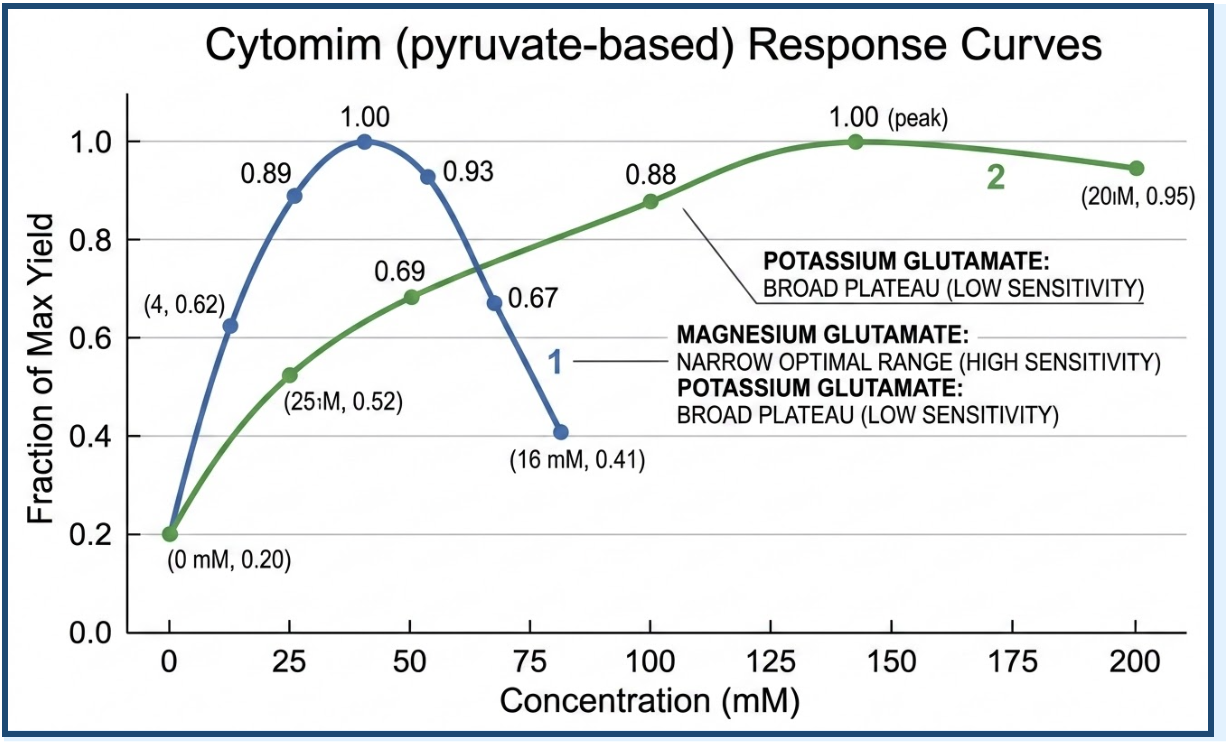
2. Which energy substrate is used. PEP chelates Mg²⁺ with higher affinity than pyruvate does, so a PEP-based system needs more total magnesium to deliver the same free Mg²⁺. This shows up cleanly in Jewett’s own data: the optimum is 20 mM in PANOx-SP (with PEP) and 8 mM in Cytomim (with pyruvate), in otherwise comparable reactions [1].
3. Which protein is being made. The coopetition designer’s reagent notes state that reteplase needs lower potassium glutamate (~250 mM) than sfGFP (~354 mM) to reduce aggregation during synthesis, and slightly less magnesium (~5.7 mM vs ~7 mM) because oxidizing conditions alter Mg²⁺ sensitivity.
Which is more sensitive: magnesium, decisively
Jewett & Swartz’s Table II varies one solute at a time and reports the fraction of maximum yield. Format is concentration mM / fraction of max:
The contrast is stark. In Cytomim, doubling magnesium from 8 to 16 mM costs 59% of yield. Moving potassium from 130 to 200 mM, a 1.5x change, costs 5%. Magnesium has a sharp peak; potassium has a broad plateau. The same pattern holds in PANOx-SP, where magnesium falls to 0.39 of maximum at 28 mM while potassium stays above 0.92 across the entire 175 to 225 mM range.
The point I think matters most
Magnesium is not just the more sensitive parameter. Its optimum is system-specific, moving with extract preparation, dialysis and energy substrate. That is why a magnesium number cannot be ported between papers, and why Jewett’s 20 mM and Olsen’s 8 mM are both right.
I learned this the hard way during this assignment. I initially reasoned from Jewett’s Table II that the coopetition’s PEP reference plates, which sit at 8.22 mM, were magnesium-starved for a PEP system and should be raised toward 14, reasoning from Jewett’s 20 mM optimum. The designer’s own guidance says the opposite: the optima are ~7 mM for sfGFP and ~5.7 mM for reteplase. One striking table from 2004 outweighed six modern data points measured in this exact lysate. The practical rule I would take forward is to treat magnesium as narrow and re-tune it whenever the extract or energy system changes, and to treat potassium as a wide knob that can be moved for other reasons.
A2. How does a PEP+NTP formulation differ from a Ribose+NMP formulation?
In one line: PEP+NTP buys the energy and the building blocks pre-made. Ribose+NMP buys cheap precursors and lets the lysate’s own metabolism build them.
The mechanism
In a PEP+NTP system, phosphoenolpyruvate is a high-energy phosphate donor. Pyruvate kinase, present in the lysate, transfers its phosphate to ADP to regenerate ATP. The four nucleoside triphosphates are supplied directly, so transcription has its substrates from the start.
In a Ribose+NMP system, no high-energy phosphate is added. Ribose and nicotinamide feed the lysate’s nucleotide salvage pathways, which phosphorylate the supplied monophosphates up to triphosphates in situ. Olsen et al. showed this works: their RFopt formulation starts with zero exogenous ATP and still reaches comparable ATP levels within 30 minutes [2].
Four practical differences
1. Cost. The triphosphates are where the money goes. From the coopetition’s own price list:
NTP
$/mL of stock
NMP
$/mL of stock
GTP
$39.34
GMP
$0.53
UTP
$37.85
UMP
$0.84
CTP
$27.94
CMP
$1.27
ATP
$1.54
AMP
$0.70
Roughly 30 to 70-fold on the three expensive ones. Add PEP at $2.20/mL and the gap compounds. Olsen reports PANOx-SP at $4,083 per gram of protein against RFopt at $60 [2].
2. Phosphate accumulation and pH. PEP liberates inorganic phosphate as it is consumed. Jewett measured roughly 30 mM accumulating over a PANOx-SP batch reaction, which is precisely the concentration above which phosphate inhibits coupled transcription–translation, and the pH fell nearly a full unit to below 6.5 [1]. A pyruvate-based Cytomim reaction accumulated only ~4 mM and held pH stable. RFopt holds 10 to 15 mM phosphate, three times lower than PANOx-SP, because no free phosphate is liberated [2].
3. ATP profile over time. PANOx-SP spikes ATP within 30 minutes and then crashes to near zero by the end of the reaction. RFopt sustains ~250 µM for the full duration, comfortably above the affinity threshold for cell-free gene expression [2]. The ribose route trades a fast start for a longer productive window.
4. Volume, which is specific to this coopetition. PEP’s stock is 0.1 M, so reaching 30 mM in a 20 µL reaction takes 6,000 nL, more than half of the 11,000 nL we get to design. Ribose at 666 mM takes 1,500 nL for 50 mM. In a volume-constrained design, PEP is expensive twice over.
What the coopetition reference data actually shows
This is where it gets interesting, because the measured results cut against the literature’s direction of travel:
Target
PEP plate
Ribose plate
PEP advantage
sfGFP
0.61 g/L
0.46 g/L
1.3x
PETase
314.6 µM
274.8 µM
1.1x
Reteplase
10.9 µM
0.81 µM
13.5x
PEP wins on raw output for all three. The reteplase gap is the striking one, and the explanation is in the compositions: the reteplase ribose plate is Smith et al.’s GPT-5-designed winner (#35) with the GSSG/GSH/DsbC package bolted on. An sfGFP-optimized composition fails badly on a nine-disulfide protein. Olsen saw the same thing, reporting a 75 to 97% yield loss when the disulfide package was added to RFopt, which they only recovered by raising HEPES to pH 7.5 and using a Δgor lysate with 20-fold less iodoacetamide [2].
Since scoring is cost per unit of output rather than output alone, the honest comparison is the titer ratio against the cost ratio, not titer alone.
Partial substitution is a real third option
Both Olsen and Smith confirmed that guanine plus ribose replaces GMP with no loss of yield, and Smith found AMP partially replaceable by adenosine (median titer 0.279 with adenosine versus 0.138 without, in their Step 5 data) [3]. Attempts to replace CMP and UMP with the corresponding pyrimidine nucleosides failed in both studies. So the choice is not strictly binary; the cheapest published compositions sit partway along it.
A3. Compare and contrast two literature compositions
I chose PANOx-SP (Jewett & Swartz, 2004) and RFopt (Olsen et al., 2026). They bracket two decades of the field, they are the two endpoints of the PEP-versus-ribose question above, and both have been run in Ginkgo’s lab on the same lysate, so the comparison is grounded rather than paper-to-paper.
Headline numbers, as measured in this system
Metric
PANOx-SP (2004)
RFopt (2026)
sfGFP yield
1.11 g/L
2.39 g/L
Cost per gram protein
$4,083
$60
Reagent cost
$4.54/mL
$0.14/mL
Distinct components
~20
~14
RFopt roughly doubles the yield at under 2% of the cost.
Composition, side by side (mM unless noted)
Reagent
PANOx-SP
RFopt
Potassium glutamate
130
362
Magnesium glutamate
8
8
Ammonium glutamate
10
—
Amino acids
2
5
Tyrosine
2
5
Cysteine
2
5
HEPES pH 7.5
57
75
Phosphate (di:mono)
—
15
PEP
30
—
Glucose
—
10
Ribose
—
50
Nicotinamide
—
4
ATP
1.25
—
CTP / GTP / UTP
0.875 each
—
AMP
—
3
CMP / GMP / UMP
—
2.15 each
Folinic acid (mg/mL)
0.025
—
CoA
0.25
—
NAD
0.375
—
Putrescine
1.25
—
Spermidine
1.56
—
Oxalate
3.75
—
What changed, and why
Ten kinds of component disappear. RFopt drops PEP, all four NTPs, tRNA, CoA, NAD, folinic acid, putrescine, spermidine, oxalate and ammonium glutamate. Several of those were treated as mandatory for twenty years. Olsen’s explanation for the cofactors is that they are unnecessary when lysates are not dialyzed, since the extract supplies them [2]. Oxalate’s disappearance makes chemical sense on its own: it exists to inhibit PEP synthetase, which only matters when PEP and pyruvate are cycling.
Potassium nearly triples, from 130 to 362 mM. Given the A1 finding that potassium sits on a broad plateau, this is a cheap change that the optimization was free to make. Potassium glutamate costs $0.07/mL.
Magnesium does not move at all. Both sit at 8 mM. I find this the most telling line in the table. Everything else about the chemistry was rebuilt, and the one parameter that stayed fixed is the one Jewett’s own data identified as the most sensitive. That is A1’s argument restated as an accident of history.
Amino acids, tyrosine and cysteine all go from 2 to 5 mM, and buffer rises from 57 to 75 mM. RFopt is more generous with the things that are cheap and more frugal with the things that are not.
Nucleotides go up in concentration while going down in cost. NMPs at 2.15 to 3 mM against NTPs at 0.875 to 1.25 mM is roughly 2.5x more nucleotide by concentration, at about a thirtieth of the unit price.
Where RFopt is worse
It would be too easy to read this as a clean win. Olsen documents three fragilities:
More sensitive to lysate amount than PANOx-SP, reflecting a finer metabolic balance.
Much more sensitive to surface-area-to-volume ratio, because oxidative phosphorylation in the crude lysate is doing real work. 20% O₂ gives under 2 g/L; 100% O₂ gives 3.7 g/L [2].
It collapses under oxidizing conditions, losing 75 to 97% of yield when the disulfide package is added, recovered only by raising HEPES to pH 7.5 and switching to a Δgor lysate. PANOx-SP, which has more buffering headroom, tolerates the same package.
That third point is confirmed by the coopetition’s own reteplase data in A2. It is a good reminder that “state of the art” is scoped to the protein it was optimized on.
A brief third composition
Smith et al.’s GPT-5-designed composition #35 is worth noting because it is neither of the above [3]. It keeps RFopt’s ribose/NMP skeleton (ribose 40, nicotinamide 4, phosphate 7.5/7.5, glucose 8.3) but adds spermidine back at 1.2 mM, cuts the NMPs by half to a sixth, and adds sodium pyruvate at 9.1 mM and catalase at 187.5 U/mL. It reports $430/g at 3.04 g/L in 2 mL tubes, and 0.72 g/L in 384-well plates against RFopt’s ~0.25.
The spermidine detail is the one I keep returning to. Olsen’s optimization removed it; GPT-5’s independently restored it and measured a near-2x effect on median titer. Two careful optimizations of the same system reached opposite conclusions about a reagent costing $1.05/mL, which says something about how rugged this landscape is.
Part B: Design One Composition for Each Protein
B1. Three compositions
I submitted one composition for each protein. Rather than tune all nine reagent categories at once, I treated each design as a small number of named hypotheses against a reference backbone, so that if a design performs well or badly I can say which change was responsible. All three sum to exactly 11,000 nL of designable volume with no negative water.
Every volume, cost and redox figure below is derived in the Appendix. Each design is followed by the hypothesis text exactly as submitted to the coopetition platform, so the record of what I predicted is visible alongside the reasoning.
Design 1 — sfGFP
Base: sfGFP Ribose. Measured cost: $0.12 per well.
Type
Reagent
mM
nL
Salts
K(Glu)
345
3,325
Salts
Mg(Glu)₂
8.22
225
Amino acids
Amino acids
5
1,600
Amino acids
Tyrosine
1
0
Amino acids
Cysteine
1
0
Buffers
HEPES pH 7.5
75
900
Buffers
Phosphate (mono:di)
15
600
Energy substrates
Ribose
50
1,500
Cofactors
Nicotinamide
4
800
Polyamines / redox
Spermidine
1.25
100
Enzymes
Catalase
187.5 U/mL
75
NMPs
AMP
1.0
200
NMPs
CMP
1.0
200
NMPs
GMP
1.0
200
NMPs
UMP
1.0
200
Water
Water
1,075
Salts unchanged from the reference, which was the deliberate choice after getting the magnesium reasoning wrong in A1. Energy system stays ribose plus nicotinamide salvage, since sfGFP is the one target where cost per gram is the score and the NMP route is roughly thirty-fold cheaper on the expensive nucleotides. Building blocks: amino acids raised to 5 mM, and all four NMPs trimmed from the reference toward the Smith winner range. The two real bets sit outside the core recipe: spermidine at 1.25 mM and catalase at 187.5 U/mL, both restored from compositions where RFopt had removed them. No GSSG/GSH or DsbC, since sfGFP has no disulfides.
Text Submitted for Design1:
The sfGFP Ribose plate (Olsen RFopt) omits two cheap additives with independent published support. Smith et al. 2026 measured ~1.9x higher median titer with spermidine (0.253 vs 0.131 g/L, Step 5), and their best 384-well composition (#35, 0.72 g/L vs ~0.25 for RFopt) is the only one containing catalase, consistent with oxygen limitation in sealed 384-well plates. Adding spermidine 1.25 mM and catalase 187.5 U/mL costs under 200 nL. NMPs are trimmed toward the Smith winner range to cut reagent cost without limiting synthesis. Prediction: titer at or above the 0.46 g/L baseline at lower cost per 20 µL.
Design 2 — PETase
Base: PETase Ribose. Measured cost: $1.47 per well.
Type
Reagent
mM
nL
Salts
K(Glu)
300
2,275
Salts
Mg(Glu)₂
8.22
225
Amino acids
Amino acids
5
1,600
Amino acids
Tyrosine
1
0
Amino acids
Cysteine
1
0
Buffers
HEPES pH 7.5
75
900
Buffers
Phosphate (mono:di)
15
600
Energy substrates
Ribose
50
1,500
Cofactors
Nicotinamide
4
800
Polyamines / redox
Spermidine
1.25
100
Enzymes
DsbC
1 µM
200
NMPs
AMP
3
600
NMPs
CMP
2.125
425
NMPs
GMP
2.125
425
NMPs
UMP
2.125
425
Water
Water
925
Same ribose skeleton and the same spermidine addition as Design 1, so that the sfGFP and PETase designs share a backbone and the comparison between them isolates the disulfide variable. The one deliberate move is DsbC cut from 5 µM to 1 µM. PETase has a single disulfide, and 5 µM is the dose the reference formulations use for proteins with one disulfide and with nine alike. Since PETase is scored on dollars per unit of activity and DsbC is about 83% of the reaction’s reagent cost, a fivefold cut that preserves activity improves the score far more than any yield tweak available at this volume.
Where the published doses sit. No published DsbC dose-response curve exists in a cell-free system. What the open literature does pin down is where the field sits: Hunt et al. (2019) work at 100 µg/mL, which is 2.1 µM as the functional dimer (46.8 kDa) or 4.3 µM as the monomer. So published working concentrations cluster at roughly 2 to 4 µM, and the reference plates’ 5 µM sits at or just above the top of that range. Design 3 at 2.5 µM lands on the dimer value. Design 2 at 1 µM goes below the published floor entirely. Neither region has a measured response curve behind it, which is the point of probing them.
Measured cost is $1.47 per well, down from $6.79 at the reference 5 µM DsbC. The designer scores Design 2 at 88% similarity to its reference plate, so the changes are substantive without putting the design somewhere uninterpretable.
Text Submitted for Design 2:
PETase is scored on enzyme activity per dollar. DsbC is $5,632/mL of stock, so 5 µM costs $5.63 per well and is 83% of this composition’s total reagent cost, verified by toggling it in the designer ($6.79 vs $1.16). PETase carries one disulfide (Cys274–Cys292) and the brief places it in the reducing regime with no folding helper, yet the reference plates carry 5 µM anyway, and DsbC appears as a single fixed value in the OFAT control plates with no sweep. Reducing to 1 µM cuts reagent cost ~66%. Spermidine is added at 1.25 mM, absent from this plate but measured by Smith et al. at ~1.9x median titer (0.253 vs 0.131 g/L, Step 5). Prediction: activity falls less than cost, improving $/unit activity. If activity holds entirely, 5 µM was overspecified for a single-disulfide target.
Design 3 — Reteplase
Base: Reteplase PEP. Measured cost: $3.51 per well.
Type
Reagent
mM
nL
Salts
K(Glu)
200
0
Salts
Mg(Glu)₂
8.22
225
Salts
NH₄(Glu)
10
200
Amino acids
Amino acids
2
400
Amino acids
Tyrosine
1
0
Amino acids
Cysteine
1
0
Buffers
HEPES pH 7.5
75
900
Energy substrates
PEP
30
6,000
Cofactors
Folinic acid
0.025 mg/mL
50
Cofactors
CoA
0.25
100
Cofactors
NAD
0.375
75
Polyamines / redox
Putrescine
1.25
50
Polyamines / redox
Spermidine
1.5625
125
Polyamines / redox
GSSG
8.08
950
Polyamines / redox
GSH
1
200
Polyamines / redox
Oxalic acid
3.75
150
Enzymes
DsbC
2.5 µM
500
NTPs
ATP
1.25
250
NTPs
CTP
0.875
175
NTPs
GTP
0.875
175
NTPs
UTP
0.875
175
Water
Water
300
This is the only design that stays on PEP, because the reference data gives PEP a 13.5x advantage on Reteplase specifically (10.9 µM against 0.81 µM). Salts, energy system and cofactors are left at reference values, and K(Glu) stays at the reference plate’s 200 mM rather than the tooltip’s ~250, since changing a salt was exactly the move A1 argues against making on indirect evidence.
The design asks one question: can cheap oxidant substitute for expensive isomerase? DsbC is an isomerase. It rearranges wrong cysteine pairings but does not create disulfide bonds. The oxidant is the GSSG/GSH couple.
The 4.04 : 1 ratio is not a platform default. It is Olsen et al.’s published condition, 4 mM GSSG and 1 mM GSH with 5 µM DsbC, validated across fifteen therapeutic proteins spanning zero to sixteen disulfide bonds, including vtPA cleaving the same IPR-AMC substrate this assay uses. That breadth is the point: it is a condition chosen to work acceptably across many proteins, not optimized for any single one. Reteplase sits near the top of that range at nine disulfides. So the question is whether a broadly validated condition is the right condition for the hardest protein in the set, which is structurally the same question A1 asks about magnesium.
So I halved DsbC to 2.5 µM and doubled GSSG to 8.08 mM, and raised HEPES from 57.5 to 75 mM to give the reaction pH headroom to use the extra oxidant.
Why I moved GSSG rather than GSH. Redox potential follows [GSSG]/[GSH]², so GSH is the stronger lever: halving it shifts the potential twice as far as doubling GSSG, and would have freed 100 nL rather than costing 475 (Appendix E). I did not take it. The designer’s GSH tooltip states that GSH “helps reshuffle incorrectly formed disulfide bonds toward the right pairings” and is the “essential partner to GSSG” that lets DsbC correct mispairings. Cutting the reduced thiol would make the environment more oxidizing while removing what makes isomerization possible, on the protein with the most mispairing to fix. The arithmetic favored GSH; the mechanism did not.
I want to be clear about the weakness: the DsbC cut and the GSSG increase are coupled on purpose, so if activity drops I will not know which one caused it. I accepted that because the question is about the tradeoff between them, not about either variable on its own. The version I submitted first changed only HEPES and DsbC and scored 97% similar to its reference plate. The revision scores 94%, which is still high, though I think that is close to the floor for a PEP-based design: PEP alone occupies 6,000 of the 11,000 designable nL, so more than half the budget is fixed before any choice gets made.
Measured cost is $3.51 per well. Doubling GSSG cost three cents, which is the tradeoff this design is built on: the oxidant is nearly free and the isomerase is not.
Text Submitted for Design 3:
Reteplase carries nine disulfides and the reference plates show how hard that is: 10.9 µM on PEP against 0.81 µM on ribose. I stayed on the PEP backbone for that reason. The design tests one tradeoff: can cheap oxidant substitute for expensive isomerase? DsbC rearranges mispaired bonds but does not create them; the oxidant is the GSSG/GSH couple. The 4.04:1 ratio is not a platform default. It is Olsen et al.’s published condition (4 mM GSSG, 1 mM GSH, 5 µM DsbC), validated across fifteen therapeutic proteins spanning zero to sixteen disulfides. It is tuned for breadth, not for any single protein, and Reteplase sits near the top of that range. I halve DsbC from 5 to 2.5 µM and double GSSG to 8.08 mM, holding GSH at 1 mM because GSH drives the isomerization DsbC depends on. HEPES goes from 57.5 to 75 mM: Jewett measured ~30 mM phosphate accumulating in PEP batch reactions with pH falling below 6.5, and Olsen recovered an oxidizing formulation by raising HEPES to pH 7.5. Prediction: activity holds or improves while cost falls. Caveat: the two redox changes are coupled deliberately, so a drop cannot be attributed to either alone.
Summary of reagents adjusted
Across the three designs, the categories I actually moved are:
Amino acids: raised to 5 mM in Designs 1 and 2
Buffers: HEPES 57.5 → 75 mM in Design 3
Energy substrates: ribose for sfGFP and PETase, PEP retained for Reteplase
Polyamines / redox: spermidine added at 1.25 mM to Designs 1 and 2; GSSG doubled to 8.08 mM in Design 3
Enzymes: catalase added to Design 1; DsbC cut 5 → 1 µM in Design 2 and 5 → 2.5 µM in Design 3
NMPs: trimmed in Design 1, left at reference in Design 2
I left magnesium and potassium at their reference-plate values in all three. A1 explains why.
I upvoted Erv1p rather than proposing it. Caleb Seward had already suggested it, and his rationale reaches the same conclusion I did by the same route: that every other reagent on the board acts downstream of disulfide formation, that the GSSG/GSH pool supplies the oxidizing equivalents and is consumed over the reaction, and that a FAD-dependent oxidase pulling from dissolved O₂ regenerates itself catalytically. He also flags catalase for the peroxide byproduct and cites Ruddock’s group on a tPA fragment with nine disulfide bonds, which is Reteplase.
Two people converging independently on the same reagent and the same mechanism is worth noting on its own. What follows is my own reasoning, developed before I saw his entry. It adds the arithmetic his does not: why the product cannot deplete the pool, what actually drains it, and what the oxygen budget costs.
The gap. The oxidizing reference formulations include DsbC but no oxidase. DsbC is an isomerase: it finds wrong cysteine pairings and reshuffles them. It does not create disulfide bonds. The oxidant is the GSSG/GSH couple.
What drains that pool, and what does not. My first version of this argument claimed the product depletes the glutathione pool. It does not, and the arithmetic is one line: at roughly 11 µM Reteplase with nine disulfides each, demand is about 98 µM of oxidizing equivalents against 4,040 µM of GSSG, a 41-fold surplus. Even ten times more synthesized protein would not exhaust it.
The real drain is catalytic, not stoichiometric. Free cysteine at 1 mM is a competing thiol sink ten times the protein’s demand, roughly 12% of the GSSG pool if fully oxidized. More importantly, residual reductases consume glutathione turn after turn. That is why the oxidizing protocol exists in the form it does: extract is treated with iodoacetamide to inactivate thiol reductases, and the source strain is Δgor because glutathione reductase drains oxidized glutathione [2]. A catalytic drain is a better argument for a catalytic oxidase than a stoichiometric one.
Erv1p is that oxidase. It is a FAD-linked sulfhydryl oxidase that passes electrons from thiols to molecular oxygen as the terminal acceptor (Lee et al. 2000), regenerating oxidizing equivalents continuously rather than topping up a pool. It complements DsbC rather than replacing it.
Why Erv1p and not DsbA. The obvious alternative is DsbA, E. coli’s native oxidase and DsbC’s actual periplasmic partner. I ruled it out on mechanism: DsbA must be re-oxidized by DsbB, which passes electrons to the membrane quinone pool. Crude lysate has no functioning membrane quinone chain, so DsbA would oxidize once and remain reduced. Erv1p is self-sufficient with O₂, the one oxidant the reaction has in supply. This is my reasoning and the part I would most want challenged.
How much Erv1p, and why I can’t cite a number. Erv1p has no published working concentration as an added reagent. In CyDisCo it is co-expressed from a polycistronic plasmid, and in Lanclos’s cell-free work it arrives in autoinduced enriched extract. In both cases the amount is set by a promoter, not dispensed. So I cannot cite a number, and I am not going to invent one. What I can do is anchor it: the reference plates already dose DsbC as an added protein at 5 µM,so I would dose Erv1p at 1 to 2.5 µM, a 1:2 to 1:5 molar ratio to the isomerase already present. The low end is deliberate. Erv1p is catalytic, so turnover capacity rather than stoichiometry is the relevant variable and it does not need to match substrate. This figure is reasoned by analogy, not cited. Caleb Seward’s entry proposes a 100 µM stock and states that Erv1p “works catalytically in the low micromolar range,” which brackets the same window I reached from the DsbC anchor. Two independent estimates landing in the same range is weak evidence, but it is better than one.
Supporting research (sources outside the assigned readings):
Nguyen et al. (2011). Microbial Cell Factories 10:1 — established CyDisCo: co-expressing Erv1p with PDI allows disulfide-bonded eukaryotic proteins to fold in the reducing E. coli cytoplasm without an engineered oxidizing strain.microbialcellfactories.biomedcentral.com
Lee, Hofhaus & Lisowsky (2000), FEBS Letters — mechanism paper establishing Erv1p as a FAD-linked sulfhydryl oxidase.febs.onlinelibrary.wiley.com
Lanclos (2025), LSU doctoral dissertation, Advancing Cell-free Systems for Production of Multiple Disulfide containing Proteins — runs PDI/Erv1p in cell-free systems, with vtPA (a truncated tissue plasminogen activator variant, essentially Reteplase) among the model proteins.repository.lsu.edu
Gąciarz et al. (2017), Microbial Cell Factories — soluble expression of disulfide-bonded proteins in E. coli cytoplasm using this machinery.link.springer.com
The limitation, stated up front. Lanclos found PDI/Erv1p folds proteins with five or fewer disulfides efficiently, and that proteins with six or more showed low solubility and activity. Reteplase has nine. I am not predicting Erv1p solves Reteplase; I am predicting it moves the number. The 9.7-fold vtPA improvement reported in that work came from combining CFPS with chaperone-rich extract or an MBP fusion, not from the oxidase alone. I would rather propose a reagent with a published ceiling than oversell one.
It pairs with catalase, and the reason is oxygen, not peroxide. Erv1p’s mechanism makes one H₂O₂ and consumes one O₂ per disulfide formed, since O₂ is the terminal acceptor that re-oxidizes the flavin. The peroxide is a byproduct of that step, not an intermediate on the way to the next disulfide, and uncatalyzed thiol oxidation by H₂O₂ is far slower than the GSSG and Erv1p routes already in the tube. So scavenging it removes a damage pathway, not oxidizing capacity.
The quantitative argument is better than that. At 98 µM of disulfides to form, Erv1p would consume about 98 µM of O₂ against roughly 230 µM dissolved at air saturation, around 43% of the pool. Catalase turns two H₂O₂ into two water and one O₂, returning about 49 µM. That halves the net oxygen cost. Which matters here specifically: Olsen showed RFopt yields under 2 g/L at 20% O₂ against 3.7 g/L at 100%, so oxygen is a scarce input in this system. Catalase does not just protect the lysate from peroxide, it gives back half the oxygen the oxidase borrowed.
One caveat I could not close: if the lysate’s peroxiredoxin or glutathione peroxidase systems are active, H₂O₂ could feed back into the GSSG pool, in which case scavenging it would cost some oxidant. I found no cell-free study measuring whether those pathways work in crude extract.
The rest of my reagent votes
I upvoted five reagents. Each one addresses a constraint this write-up identified somewhere in Part A, which is why I voted for them rather than for the chaperones at the top of the board.
Erv1p (suggested by Caleb Seward) is above: the only proposal that generates disulfides rather than rearranging them.
Skp, a periplasmic holdase chaperone (Sheila Ramani). It binds unfolded protein and reduces aggregation, and it was used with DsbC and glutathione to improve cell-free folding of v-tPA, the same nine-disulfide protein Reteplase is derived from. It complements DsbC rather than duplicating it.
Polyphosphate kinase (Shirish Goyal). This one addresses A2’s central finding directly. PEP regenerates ATP but liberates inorganic phosphate as it does, roughly 30 mM over a batch reaction, which inhibits transcription–translation and drops the pH nearly a full unit. PPK regenerates ATP from polyphosphate without releasing free orthophosphate. It is the energy system that avoids the failure mode A2 documents, at commodity cost.
Inorganic pyrophosphatase (Tamana Sisodiya). A1 establishes that magnesium is the most sensitive parameter in the system and that its optimum is narrow. T7 polymerase releases pyrophosphate with every nucleotide incorporated, and PPi sequesters Mg²⁺ as an insoluble precipitate. So this protects the one parameter A1 says cannot be ported or guessed, and it does so by removing an inhibitor that accumulates rather than one present at t=0. Target-agnostic across all three proteins, and fractions of a cent per well.
D-Pantethine (Mehmet Erkan Ozseyhan). This is the same logic RFopt applies to nucleotides, applied to cofactors. CoA costs about $104/mL and is among the most expensive small molecules in a PANOx-SP mix. Pantethine is its salvage-pathway precursor, converted by endogenous enzymes at 2 ATP per CoA instead of 3 ATP plus 1 CTP plus 1 cysteine. Buy the cheap precursor, let the lysate build the expensive molecule, which is exactly the move A2 describes for ribose and NMPs.
The pattern across all five: I voted for reagents that address a mechanism the data in Part A identified, and against ones that add folding capacity on the general principle that more folding help is better. FkpA leads the board at 26 votes and may well work, but its rationale is that it could be “an additional folding support,” which is a hypothesis about a direction rather than about a specific constraint.
B3. Forum access
Confirmed access to the cfps-coopetition channel on forum.htgaa.org.
Bonus idea posted: pairing a catalytic sulfhydryl oxidase with catalase, with the oxygen-recycling argument set out in B2. The short version is that catalase returns about half the O₂ an oxidase consumes, which matters in a system where Olsen measured yield more than doubling between 20% and 100% oxygen.
Part C: Asimov Kernel (optional)
Part C, the optional Asimov Kernel plasmid build, was not attempted for this submission.
Reflection
What I would do differently. All three designs are conservative in the same way: each changes two or three reagents against a reference backbone, and none of them leaves the neighborhood the reference plates already occupy. That was deliberate, because I wanted to be able to attribute a result. But Olsen’s finding that single-reagent additions almost never improved yield, and that improvement required simultaneous change, argues the other way. If I had a second round, I would spend it on one composition far enough out that failure would teach me little, rather than three close enough that success teaches me little.
AI use
I used Claude (Opus 5) throughout as a research and reasoning partner rather than a generator, and Claude Science for literature checks near the end. The work split roughly three ways: summarizing the assigned papers into a numeric reference I could query without reopening PDFs; deriving the designer’s volume formula and base buffer composition empirically from nL readouts and validating it against all six reference plates; and arguing through design choices.
Three errors are worth recording, because they bear on how useful the collaboration was and all three share a cause.
First, Claude initially argued from Jewett’s 2004 Table II that the reference plates were magnesium-starved and should move from 8.22 toward 14 mM. That was wrong, and the designer’s own tooltips said so. One striking table from a dialyzed 2004 extract had been weighted over six modern measurements in the exact lysate we are using. I caught it by checking the tooltip. That exchange became the closing argument of A1.
Second, Claude estimated Design 2 at $2.29 per well by extrapolating linearly from a measured DsbC cost delta. The designer reports $1.47.
Third, and the one that reached furthest into this write-up: Claude’s original argument for Erv1p rested on the glutathione pool being depleted by the product. Running a cross-check through Claude Science produced the division that kills it, 98 µM of demand against 4,040 µM of GSSG. That claim was load-bearing in both B2 and Design 3, and it had survived several rounds of review by me and by Claude before a second system caught it in one line.
All three come from reasoning off a model instead of reading the instrument or doing the arithmetic. The rule I take forward is to compute the order of magnitude before accepting any mechanism, and to prefer the platform’s own readouts over inference whenever both exist.
The useful contributions ran the other way: establishing that DsbC is roughly 83% of reagent cost by toggling it to zero and reading the delta; establishing that the Mix and reference cost columns use different bases by loading an unmodified RFopt and finding it priced 37x above its own reference row; and catching the 97% similarity score on my first Reteplase submission in time to redesign it. Using two AI systems against each other was more productive than either alone, since the second had no stake in the first’s reasoning.
One friction point worth recording. Partway through, a question about glutathione redox potential and disulfide bond formation was flagged by Claude’s safety classifiers and the session paused, offering to retry on an earlier model. The notice stated that the safeguards are intentionally broad and can flag legitimate coding, cybersecurity and biology tasks. Nothing about the question was unusual for this assignment: it concerned the oxidation state of a buffer in a cell-free reaction, which is the subject of the homework. The interruption cost a few minutes and changed no conclusion, but it is a genuine constraint on using these tools for biology coursework, and worth measuring if the teaching team is studying how students and AI systems actually work together. A student closer to a deadline, or less sure their question was reasonable, might have abandoned the line of inquiry rather than retrying.
Appendix: Calculations
A. The volume formula
Every reagent volume follows from dilution, C₁V₁ = C₂V₂, adjusted for what the base buffer already contributes:
Cost in USD = Σ [ stock price per mL × volume (nL) × 10⁻⁶ ]
DsbC at the reference 5 µM, stock price $5,632/mL, volume 1,000 nL:
$5,632/mL × 1,000 nL × 10⁻⁶ = $5.63 per well
Verified empirically by toggling DsbC to zero in the designer: $6.79 with it, $1.16 without, a delta of $5.63. DsbC is therefore 83% of that composition’s reagent cost.
Caution: calculated totals did not reproduce the designer’s figures. My estimate for Design 2 was $2.29; the designer reports $1.47. The delta for a single reagent matched exactly, so differences are valid, but absolute totals should be read off the tool, not computed.
Design
Measured $/20 µL
Measured $/mL
1, sfGFP
$0.12
$5.17
2, PETase
$1.47
$73.29
3, Reteplase
$3.51
$175.71
E. Glutathione redox potential
For the half-reaction 2 GSH ⇌ GSSG + 2H⁺ + 2e⁻, the Nernst equation gives:
E = E°′ + (RT / 2F) × ln( [GSSG] / [GSH]² )
GSH is squared because two molecules are consumed per disulfide. At 30 °C (303.15 K):
Taking E°′(GSSG/2GSH) ≈ −240 mV, with concentrations in M:
Condition
[GSSG]
[GSH]
[GSSG]/[GSH]² (M⁻¹)
E (mV)
ΔE
Reference plates
4.04 mM
1.0 mM
4,040
−131.6
—
Design 3
8.08 mM
1.0 mM
8,080
−122.5
+9.1
Halving GSH instead
4.04 mM
0.5 mM
16,160
−113.5
+18.1
Consequence: the ratio alone does not determine the potential. 8 mM / 1 mM and 4 mM / 0.5 mM are both “8:1” and differ by 9 mV. Halving GSH is the stronger lever per unit volume and would have freed 100 nL rather than costing 475. I did not take it, for the mechanistic reason given in Design 3.
F. Oxidizing equivalents required
n_equiv = [protein] × disulfides per molecule
= 10.9 µM × 9 = 98.1 µM
4,040 µM ÷ 98.1 µM = 41.2× surplus
This is the calculation that retracted the “the product depletes the pool” claim in an earlier draft of B2. Even ten times more synthesized protein (981 µM) would consume only 24% of the pool.
Free cysteine as a competing sink. Thiol-disulfide exchange runs 2 RSH + GSSG → RSSR + 2 GSH, so 1 mM cysteine consumes 0.5 mM GSSG:
500 µM ÷ 4,040 µM = 12.4% of the pool
Ten times the protein’s own demand, which is why cysteine and not the product is the relevant stoichiometric competitor.
G. Oxygen budget for Erv1p
Erv1p forms one disulfide per catalytic cycle, consuming one O₂ and producing one H₂O₂:
O₂ demand = 98.1 µM H₂O₂ produced = 98.1 µM
98.1 µM ÷ 230 µM = 43% of the dissolved O₂ pool
98.1 µM ÷ 2 = 49 µM O₂ recovered → net O₂ cost falls from 98 µM to 49 µM
So catalase halves the oxygen cost of running an oxidase.
H. DsbC mass-to-molar conversion
DsbC is a homodimer of 23.4 kDa subunits. Converting the one reproducible published working concentration:
100 µg/mL ÷ 23,400 g/mol = 4.3 µM (monomer)
100 µg/mL ÷ 46,800 g/mol = 2.1 µM (dimer)
Published practice therefore sits at roughly 2 to 4 µM. The reference plates use 5 µM. Design 3 at 2.5 µM lands on the dimer value; Design 2 at 1 µM is below the published floor.
Values used but not verified against a primary source this session
Air-saturated dissolved O₂ at 30 °C (230 µM), E°′(GSSG/2GSH) (−240 mV), and DsbC subunit mass (23.4 kDa) are standard reference values. The Erv1p 1:1 O₂-per-disulfide stoichiometry assumes no uncoupled flavin oxidation; real flavoenzymes leak somewhat, which would increase peroxide output and strengthen rather than weaken the case for catalase.
References
[1] Jewett, M. C., & Swartz, J. R. (2004). Mimicking the Escherichia coli cytoplasmic environment activates long-lived and efficient cell-free protein synthesis. Biotechnology and Bioengineering, 86(1), 19–26. https://doi.org/10.1002/bit.20026
[2] Olsen, M. L., Copeland, C. E., Sundberg, C. A., Aw, R., Shaver, Z. M., Rao, G., Swartz, J. R., Karim, A. S., & Jewett, M. C. (2026). Design-driven optimization of low-cost reagent formulations for reproducible and high-yielding cell-free gene expression. Nature Communications, 17, 3478. https://doi.org/10.1038/s41467-026-69605-8
[3] Smith, A. A., et al. (2026). Using a GPT-5-driven autonomous lab to optimize the cost and titer of cell-free protein synthesis. bioRxiv.https://doi.org/10.64898/2026.02.05.703998
[4] Silverman, A. D., Karim, A. S., & Jewett, M. C. (2020). Cell-free gene expression: an expanded repertoire of applications. Nature Reviews Genetics, 21, 151–170. https://doi.org/10.1038/s41576-019-0186-3
[5] Rasor, B. J., Vögeli, B., Landwehr, G. M., Bogart, J. W., Karim, A. S., & Jewett, M. C. (2021). Toward sustainable, cell-free biomanufacturing. Current Opinion in Biotechnology, 69, 136–144. https://doi.org/10.1016/j.copbio.2020.12.012
Reference plate yields, reagent costs and designer guidance are from the HTBAA CFPS coopetition platform and the Ginkgo coopetition specification document.