Week 2 HW: DNA DESIGN
Biomanufactured Structural White: Engineering Cellulose Fibril Architecture for a TiO2 Replacement
Homework 1 proposed a fermented, air-structured white colorant to replace titanium dioxide in food and supplement coatings. This homework designs the genetic construct that sets the structure that colorant depends on.
Part 0: Set up in Kernel
Repository: Azeez White Project folder: HW2_bcsABD_construct

A note on what Kernel can and can’t do for this project. Kernel’s simulator is mammalian-only, so this E. coli construct is designed and assembled in Kernel using SBOL visual language, but not simulated there. Sequence extraction and verification were done in Benchling, from the source record (GenBank M37202) retrieved from NCBI [1].
The construct checker was run with E. coli K-12 as the expression host and returned zero errors (green check mark).
Part 1: Define your expression target
- What molecule am I expressing? BcsA, BcsB, and BcsD from Komagataeibacter xylinus. BcsA and BcsB form the catalytic core of bacterial cellulose synthase, sufficient for cellulose synthesis in vitro [2], and BcsD is the crystallization subunit.
- What is the sequence? BcsA (UniProt P19449, [3] 754 aa), BcsB (UniProt P37716 [4], 802 aa), BcsD (UniProt P0DTX0 [5]; GenBank M37202 coordinates 8964..9434, 156 aa). CDS regions extracted and verified in Benchling.
- What host or chassis? E. coli K-12 (lacIq, e.g. JM109). See below for why.
- Where does the product need to go? BcsA and BcsB are inner-membrane proteins — they insert by nature and need no targeting signal. BcsD is periplasmic in K. xylinus but has no annotated signal peptide, so its localization in E. coli is untested. This is a named risk in Part 6.
- What food-safety implications does the host carry? As a Gram-negative organism, E. coli carries lipopolysaccharide (LPS) in its outer membrane. Cellulose product from E. coli fermentation will carry LPS contamination requiring removal in downstream processing — an added purification burden and regulatory consideration for a food ingredient filing. This is a further argument for native K. xylinus as the production chassis once mechanistic questions are answered in E. coli.
Why this is a biomanufacturing problem, not a materials one
I’m not fermenting a molecule, I’m fermenting a structure. Cellulose itself is a commodity. What the organism provides is a self-assembled network of nanofibrils in a size range no chemical process reaches cheaply at scale. The published synthetic mimic of this effect needed PMMA and supercritical CO2 drying to fake an architecture that Komagataeibacter secretes as a byproduct of growing [6].
So the organism is doing the nanofabrication, and the construct’s job is to set the dimensions of what it fabricates. That framing is what makes bcsD the right gene to add. It also means the three stages here are all bioprocess rather than a fermentation step followed by a materials step: the organism builds the structure, the fermentation sets its dimensions, the drying preserves it.
The optical constraint that drives the design
Structural whiteness comes from broadband scattering by a disordered network of features at the right size and packing. The best-documented natural benchmark is the Cyphochilus beetle, whose scales are a chitin filament network with filaments about 244 nm in diameter ([7], as reported in [8]), in a layer only about 8 µm thick [8]. Bacterial cellulose nanofibers are typically 25 to 100 nm in diameter [9], so they sit below that benchmark. I’m treating the beetle as a benchmark, not as proof that 244 nm is the optimum for cellulose in air. The actual target is something the Part 6 experiments have to establish. The direction is clear: the design needs more bundling into larger organized features, not finer ones. The failure mode of undersized features is not dim white, it’s a blue-grey cast, because thin fibrils scatter short wavelengths preferentially. That is a physical expectation, not a measurement.
BcsD promotes the bundling of individual glucan chains into organized crystalline ribbons. If bundling drives feature size upward, BcsD is the genetic lever that sits closest to the optical variable. I’m flagging this as a hypothesis, not an established result. The link between BcsD activity and a specific fibril diameter is exactly what Part 6 proposes to test.
The sequences
BcsA (catalytic subunit): UniProt P19449 [3], K. xylinus, 754 aa. A multi-pass inner-membrane protein. Its cytosolic glycosyltransferase (GT) domain carries both catalytic motifs: the DXD motif, which binds the UDP-glucose substrate and catalyzes glycosidic bond formation, and the QXXRW motif, which confers processivity so the chain keeps growing rather than releasing early. The C-terminus is a separate PilZ domain that binds c-di-GMP and gates the enzyme’s activity.
BcsB: UniProt P37716 [4], K. xylinus, 802 aa. Largely periplasmic with a single C-terminal membrane anchor, tightly associated with BcsA, and required for activity. It guides the nascent glucan chain across the membrane.
BcsD: K. xylinus, from the same GenBank M37202 operon record, coordinates 8964..9434. 471 bp, 156 aa. A small protein that assembles into an octamer forming the passageway where glucan chains crystallize into ribbons; deleting bcsD yields disorganized, less crystalline cellulose. It is periplasmic in K. xylinus, but UniProt annotates no signal peptide and no transmembrane segment, so how it reaches the periplasm is not something I can read off the record. That matters for a heterologous host: I can’t simply “retain the native signal” when no signal is annotated. Treated as a named risk in Part 6, with an engineered signal peptide (PelB or DsbA) as the version-two fix if fractionation shows BcsD stuck in the cytoplasm. Verified in UniProt P0DTX0 [5] (secondary accession P19451, from the same 1990 deposition as M37202): the feature table contains a single CHAIN 1..156 annotation and no SIGNAL or TRANSMEM features, and the sequence is identical to the GenBank translation.
What I’m deliberately leaving out, and the risk that carries
bcsC is not in this construct. It encodes the outer-membrane porin that exports the glucan chain. I’m omitting it because it’s the largest gene in the operon and E. coli carries its own BcsC homolog and outer-membrane export machinery. This is a real bet, not a free omission: without BcsC, product may accumulate in the periplasm rather than being exported. Carried forward as a named risk in Part 6.
This omission has to be read together with the strain choice in Part 2, because on a fast read they look like they cancel: I drop bcsC on the grounds that the host supplies one, then pick a cellulose-negative host. They don’t cancel. The K-12 cellulose-negative phenotype comes from a bcsQ lesion, not a bcsC deletion, so native BcsC remains genomically intact and available for export while the host is still unable to make cellulose of its own. That is the design argument: a clean measurement background and a borrowed export channel from the same strain choice. The honest caveat is that the native E. coli bcs operon is CsgD-regulated and largely silent at 37 °C in rich medium, so genomically present is not the same as expressed. Whether BcsC is actually available under my growth conditions is an experimental question, not an assumption, and it is in Part 6.
Sequence verification
I pulled the source record (GenBank M37202) into Benchling and extracted the CDS regions as standalone sequences to confirm they match the UniProt entries I’m designing around:
- bcsA_CDS_Kxylinus, M37202:328..2592, 2,265 bp — Benchling link
- bcsB_CDS_Kxylinus, M37202:2594..5002, 2,409 bp — Benchling link
- bcsD_CDS_Kxylinus, M37202:8964..9434, 471 bp — Benchling link
The completed lengths match exactly: 754 aa, 802 aa and 156 aa respectively, times three, plus a stop codon. That confirms clean CDS extractions with no extra flanking sequence.
One thing I didn’t know going in
E. coli is not a blank heterologous host here. It has its own native cellulose synthase system, and it is structurally different from Komagataeibacter’s. A 2021 cryo-EM structure [10] shows the E. coli complex pairs one BcsA with a BcsB hexamer, rather than the one-to-one pairing in K. xylinus, plus additional subunits including BcsG, which decorates the cellulose with phosphoethanolamine for biofilm adhesion.
Two consequences I hadn’t anticipated. First, the host’s own machinery competes for the same UDP-glucose pool and confounds attribution of any cellulose I measure. Second, phosphoethanolamine-modified cellulose is a food-safety liability for a product headed toward an ingredient filing, so host background isn’t only an experimental nuisance. Both push toward the strain choice in Part 2.
Host and chassis
Committing to E. coli, K-12 derivative with lacIq (e.g. JM109), rather than E. coli Nissle 1917 or native Komagataeibacter fermentation.
Why E. coli over native fermentation
E. coli has the mature, well-characterized parts catalog this design exercise requires. Native Komagataeibacter fermentation would need no construct design at all. This is an active choice with a real tradeoff, not a default.
Why K-12 and not Nissle, departing from my own precedent
The precedent I’m citing co-expressed bcsA and bcsB from G. xylinus BPR2001 in E. coli Nissle 1917 under a tac promoter and got 1.94 g/L dry cellulose [11]. Critically, expressing either gene alone produced none, so co-expression is obligate. But Nissle 1917 is cellulose-positive. That means the 1.94 g/L benchmark itself includes an unknown host contribution and cannot be cleanly attributed to the heterologous construct. K-12 lab derivatives commonly carry a bcsQ frameshift that renders them cellulose-negative, which gives a clean background against which to measure. The lacIq genotype also gives tight tac repression until induction.
As noted in Part 1, the bcsQ lesion is what makes this work: it silences host cellulose production without removing bcsC, so the export channel stays available while the measurement background goes clean.
The titer objection, and why titer alone isn’t the right metric
The obvious objection is that 1.94 g/L is below native Komagataeibacter. One review describes native pellicles forming in 3 to 14 days at up to about 10 g dry weight per liter under standard conditions [9], and one optimized strain reports more than 23 g/L in 10 days of static culture [12]. I haven’t confirmed whether that figure is dry weight.
Titer ignores time. If E. coli reaches about 1.94 g/L in roughly a day (an assumption to verify against the source paper), then productivity rather than titer drives reactor cost. But optimized native strains report productivity that would match or exceed that, so I treat any productivity advantage for E. coli as a hypothesis to test, not a result.
One qualification I owe this number. I argue above that Nissle’s cellulose-positive background contaminates the 1.94 g/L figure, which means the same figure cannot then serve as a clean numerator here. The contamination inflates the E. coli side, so any E. coli productivity advantage is an upper bound. Whether any productivity advantage survives depends on the native baseline, which I haven’t verified, so the comparison needs a clean E. coli titer and a measured native productivity before it carries weight.
Two further points bear on the comparison. Native production is static surface culture, which is surface-area limited and does not scale linearly with vessel volume. Agitated culture does scale, but it changes pellicle morphology, and morphology is the thing being sold.
Part 2: Design your genetic parts
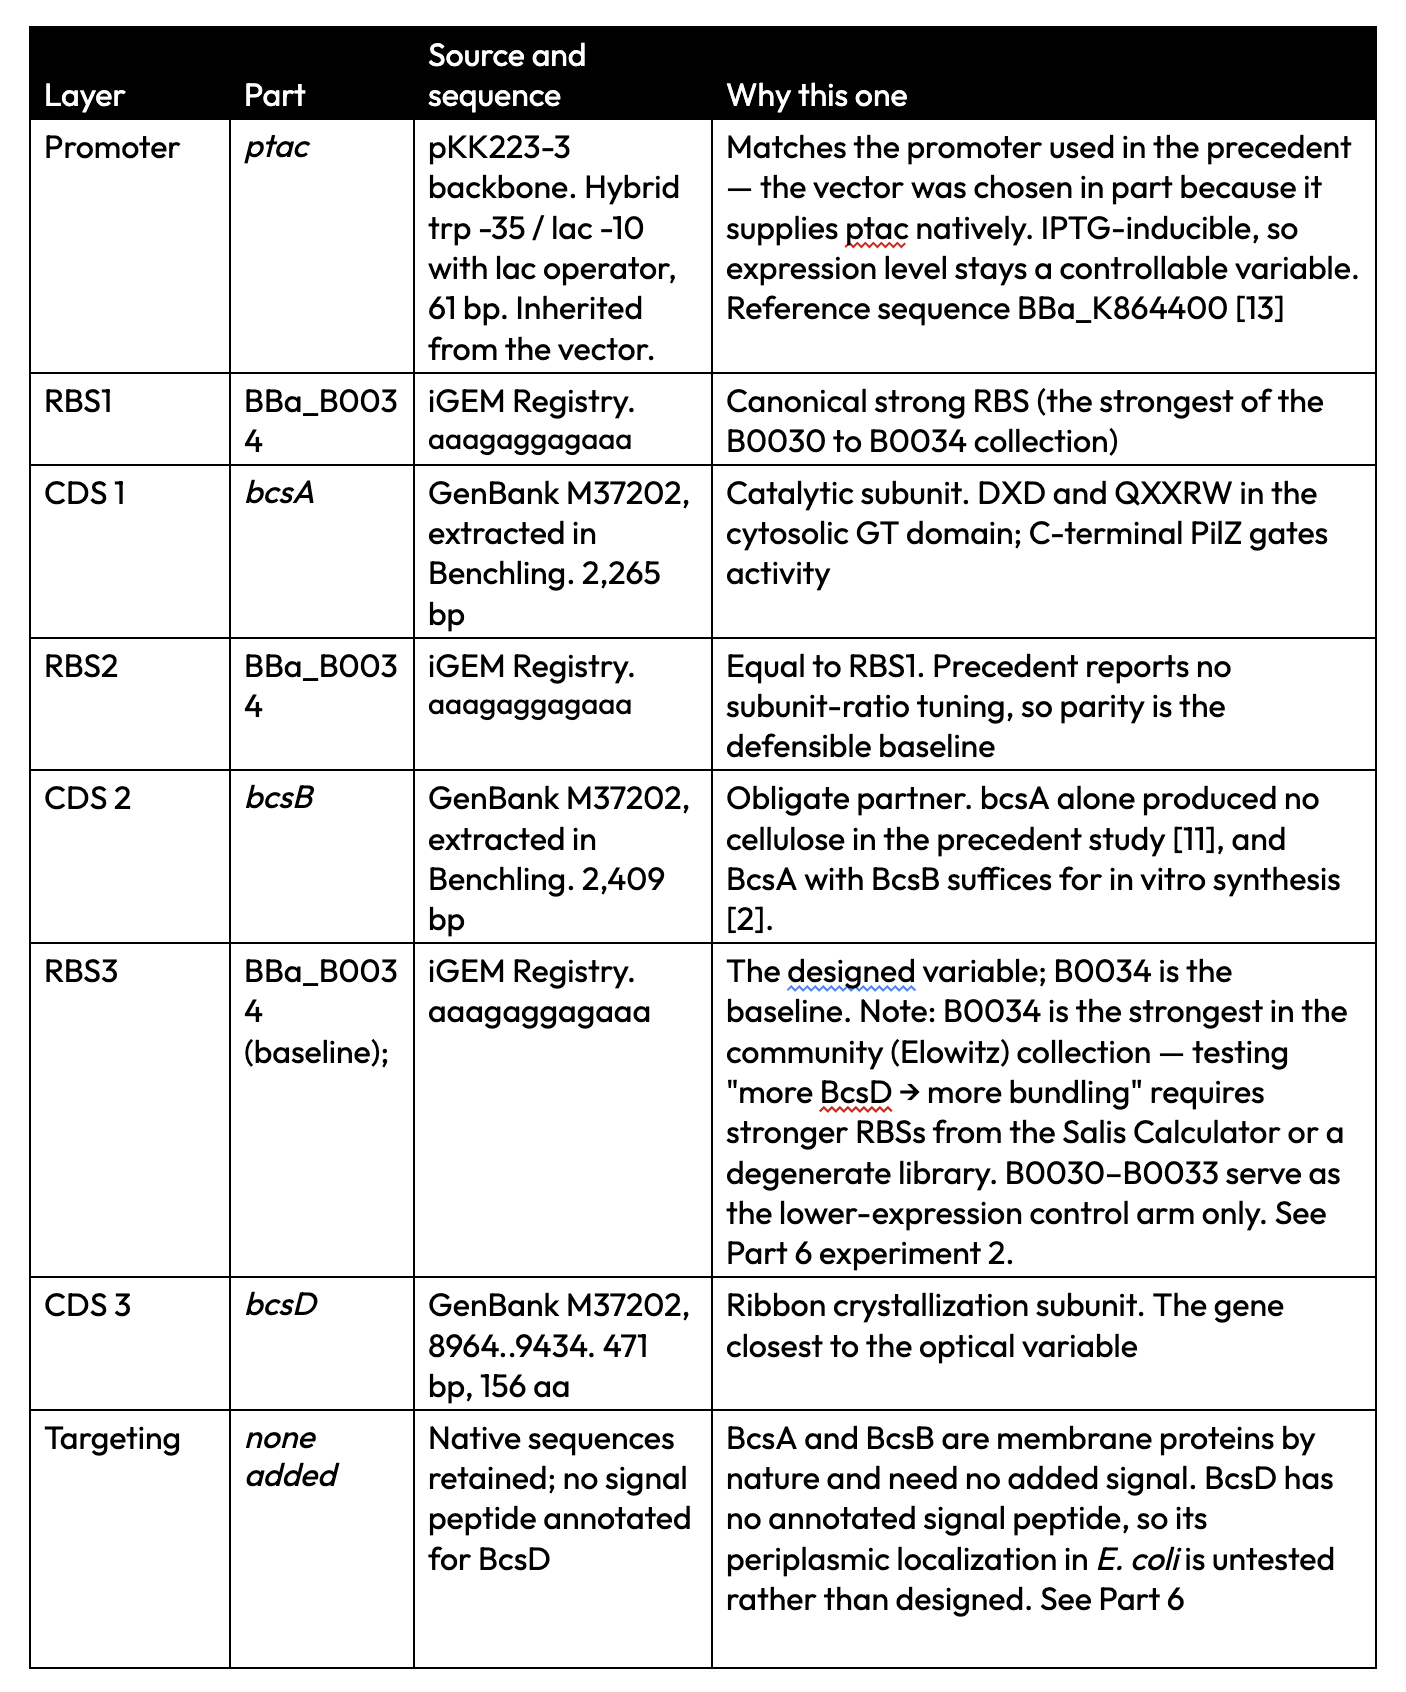
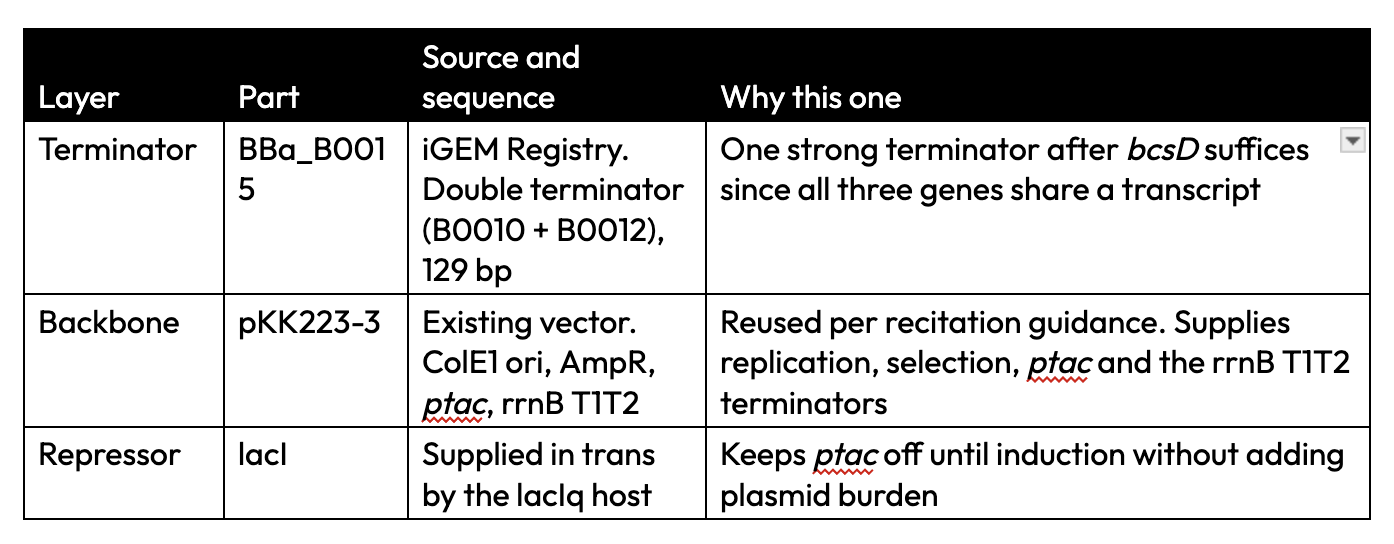
All parts were created or imported in Kernel (HTBAA 2026 workspace, repository Azeez White, folder HW2_bcsABD_construct) with the correct part type assigned to each.
Per the recitation guidance, parts are sourced from the iGEM Registry [13] and existing sequence records rather than designed from scratch, and the backbone is reused rather than built.
Part 3: Assemble the construct
5’ to 3’ order
ptac → RBS1 → bcsA → RBS2 → bcsB → RBS3 → bcsD → BBa_B0015 terminator A single tricistronic transcript on the pKK223-3 backbone, with lacI supplied in trans by the lacIq host.
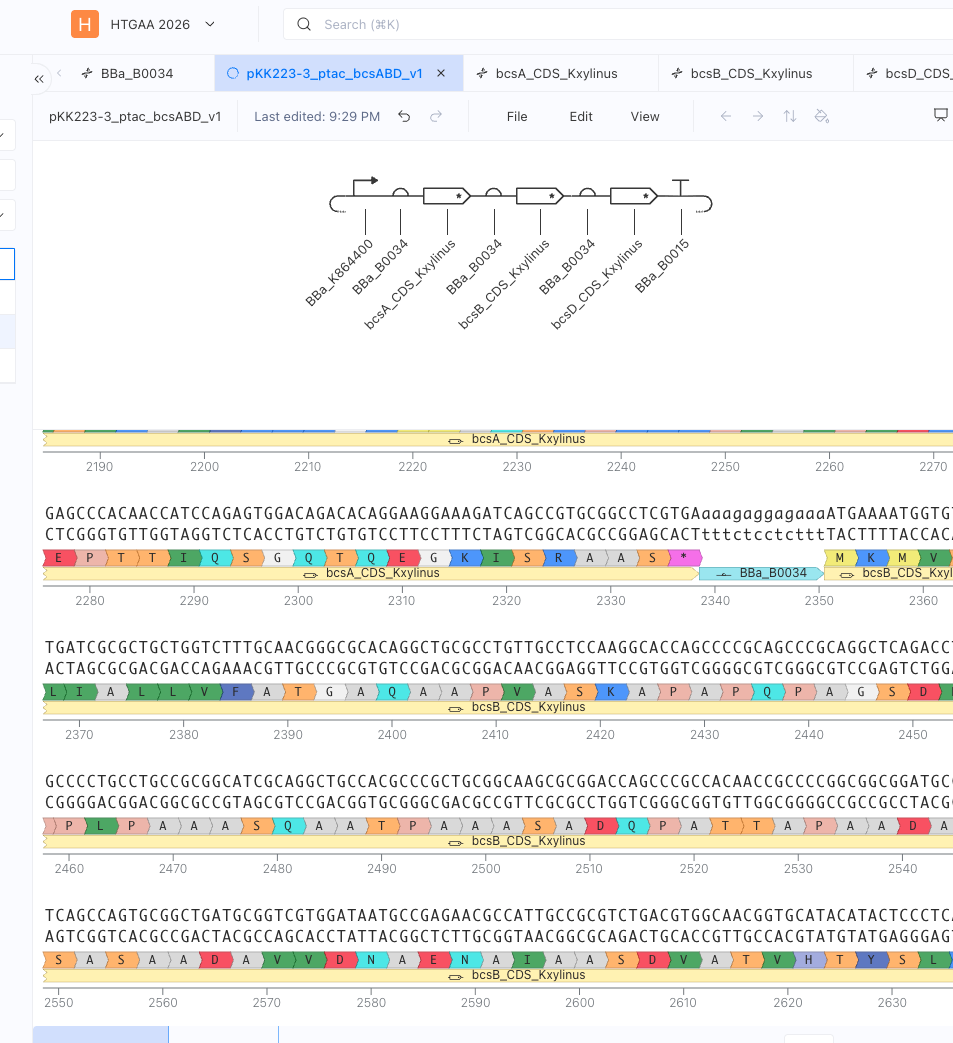
The schematic shows the insert. pKK223-3 is described rather than drawn, as it was not available in any repository connected to Kernel. Its contribution is the ColE1 origin, ampicillin resistance, ptac and rrnB T1T2; ptac is inherited from the vector rather than added as a separate registry part.
Why one operon rather than three cassettes
Co-expression is obligate, so a single transcript enforces coordinated induction by construction rather than by hoping two plasmids stay balanced. It also mirrors why the native bcs genes are clustered in the first place: stoichiometric co-expression. Three separate cassettes would add three promoters and three terminators for no benefit.
Why bcsD sits last, and why that position is the design
bcsD is the tuning target. Putting it at the 3’ end means RBS3 can be swept across a strength ladder while the catalytic core’s expression stays fixed, so any change in fibril architecture is attributable to BcsD level rather than to a shifting BcsA:BcsB ratio.
Flagging the limitation honestly: polar effects mean absolute BcsD level also depends on position in the polycistron, so an RBS sweep measures relative rather than absolute changes. That’s sufficient for finding a direction, not for reporting an absolute stoichiometry.
Strand and directionality checks
Readthrough termination and convergent-transcription risk from backbone promoters could not be verified in Kernel (pKK223-3 unavailable); both would be confirmed against the vector map before ordering.
Sequence checks: confirmed in Kernel
- Reading frame intact. The sequence viewer translates bcsA from its ATG as MSEVQSPVPAESRLDRFSNK, matching the protein deposited with M37202 exactly.
- Start and stop codons present on each CDS. The native CDSs from M37202 each end in a single TGA stop; the codon-optimized versions ordered in Part 5 carry TGA+TAA double stops from the optimizer’s stop-codon preference (see Part 4).
- Note on sequence sets: the Kernel assembly uses native CDSs for reading-frame and junction verification. The gene fragments to be ordered (Part 5) are the codon-optimized versions, which already carry the TGA+TAA double stops. The native-vs-optimized comparison for BcsA described in Part 5 is a planned first experiment, not an unresolved choice.
- No frameshift at the RBS-to-CDS junctions. Implied by the correct bcsA translation: a shifted junction would have produced nonsense from the first codon.
- No internal stop codons in the native sequences. All three translate cleanly end to end.
Still pending, because they depend on codon optimization
- No internal stop codons introduced during optimization
- No unintended restriction sites created during optimization
Size, and one native feature this design breaks
Coding sequence totals 2,265 + 2,409 + 471 = 5,145 bp. Regulatory parts add 226 bp (ptac 61, three RBSs at 12 each, terminator 129), giving a 5,371 bp insert and roughly a 10 kb plasmid with the backbone.
In M37202, bcsC ends at 8964 and bcsD begins at 8964, a single-base overlap. That arrangement is the classic signature of translational coupling, where ribosomes terminating on the upstream gene reinitiate on the downstream one, tying BcsD synthesis to BcsC synthesis. My construct omits bcsC and gives bcsD an independent RBS, which deliberately decouples them. That is the point, since decoupling is what makes RBS3 a usable tuning variable, but it means BcsD expression here is not regulated the way it is natively, and the native ratio is not something I’m preserving.
Part 4: Optimize and quality-check
The native CDSs measured from the M37202 sequences in Benchling are in the ~58–63% GC range (per-gene values from the sequence records), compared to ~50–51% for E. coli, so meaningful codon divergence was expected. bcsA 58.45%, bcsB 62.64%, bcsD 61.78%. Ran a rare-codon analysis on the native sequences extracted from GenBank M37202:
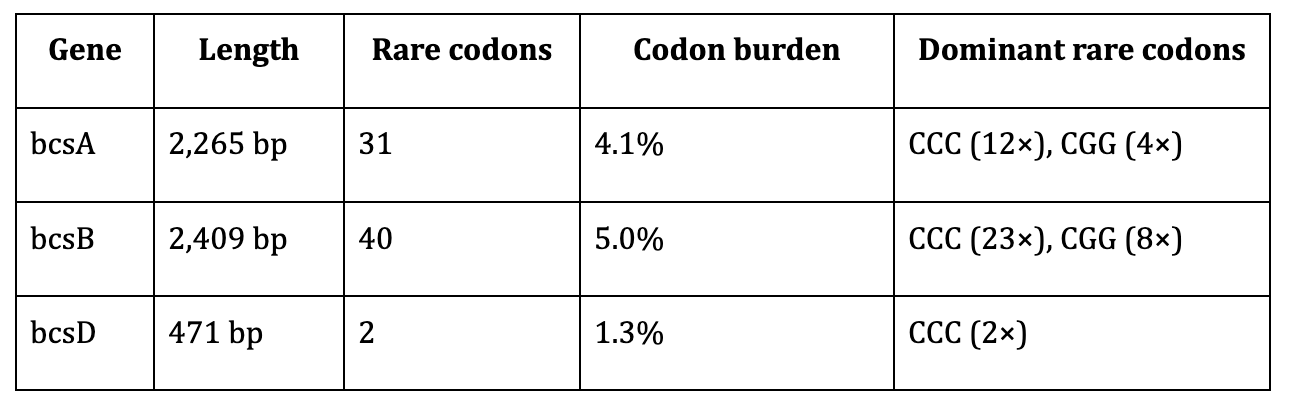
Rare codons are dominated by CCC (Pro) and CGG (Arg), not the AGA/AGG/AUA codons typically flagged for E. coli expression. With 1.3 to 5.0% burden, codon scarcity alone is unlikely to be rate-limiting. I generated optimized versions as a comparison arm for synthesis and expression, not on the assumption that they will outperform the native sequences (see Part 5).
Codon optimization
Ran Kernel’s Codon optimizer (Toolbox → Codon optimizer) on each of the three native CDSs with identical parameters: expression host Escherichia coli, input type DNA, algorithm SIMPLE_0_3, stop codon preference TGA+TAA. Quality scores (Asimov Codon Usage Index, RNA structure score) returned N/A for all three — expected for a non-mammalian host, since those metrics are calibrated to CHO/HEK expression systems. Outputs saved as bcsA_CDS_Kxylinus_Ecoli_opt, bcsB_CDS_Kxylinus_Ecoli_opt, bcsD_CDS_Kxylinus_Ecoli_opt.
Sequence alignment (native vs. optimized)
Ran Kernel’s pairwise Sequence alignment tool (Toolbox → Sequence alignment) comparing each native K. xylinus CDS against its codon-optimized version:
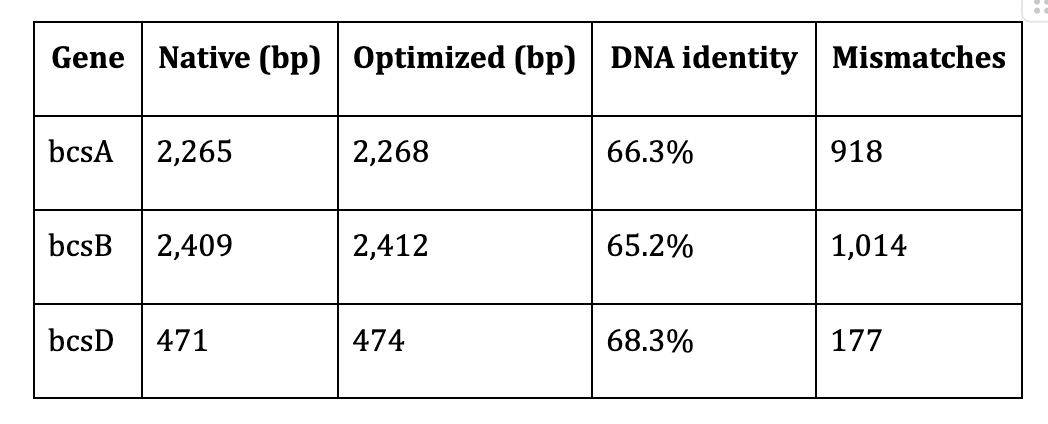
DNA identity of ~65-68% confirms extensive synonymous codon substitution. The 3 bp length difference in each alignment reflects stop codon handling by the optimizer and introduces no frameshift. The identity percentages are as reported by the Kernel tool; direct arithmetic, (length − mismatches)/length, gives 59.5%, 57.9% and 62.4%, a gap of roughly 6 to 7 points from the reported identity whose source is not explained here. The mismatch counts are the unambiguous figures: 918 of ~2,265 positions changed in bcsA, 1,014 of ~2,409 in bcsB, 177 of ~471 in bcsD — all confirm extensive synonymous substitution. Protein-level identity is 100% for all three genes and confirms that optimization changes only which codons encode each amino acid, not which amino acids are encoded.
Identity verification was done upstream: CDSs were extracted directly from GenBank M37202 in Benchling and protein lengths confirmed against UniProt. The 100% protein identity in all three pairwise alignments confirms no amino acid changes were introduced by codon optimization. Known limit: pairwise native-vs-optimized alignment verifies sequence identity but does not detect unintended homology between the optimized sequences and off-target human or pathogen proteins. A full BLASTp search against nr/Swiss-Prot remains the appropriate check for any sequence entering a synthesis order.
Biosecurity scan
Ran Kernel’s Biosecurity sequence scanner (Toolbox → Biosecurity sequence scanner) on each codon-optimized CDS. All three returned “No flagged sequences detected.” The cellulose synthase genes are derived from Komagataeibacter xylinus, a non-pathogenic acetic acid bacterium classified as BSL-1, and encode structural polysaccharide biosynthesis enzymes with no known toxicity or dual-use concern.
Part 5: From design to build
How I’d build it
Order three codon-optimized gene fragments (bcsA, bcsB, bcsD), plus a native-sequence bcsA fragment as the comparison arm, and assemble them with the backbone and regulatory parts by Gibson Assembly [14]. The codon analysis in Part 4 complicates the optimization step, and suggests testing the native sequences first may be the better first experiment, especially for BcsA. BcsA is a polytopic inner-membrane protein with multiple predicted transmembrane helices. At the junctions between membrane-spanning and cytoplasmic segments, naturally occurring rare codons can act as translational pause sites, giving each nascent helix time to insert before the next is synthesized. Full codon optimization removes those pauses and can accelerate translation past membrane insertion windows, producing misfolded or aggregated product. The native codon bias in BcsA may be partially functional rather than accidental, and a head-to-head native-vs-optimized comparison for BcsA specifically would test this directly. The assembly method is the same either way. Gibson suits this specifically because it needs no restriction sites at the junctions, and four to five overlapping fragments self-assemble in correct order in a single 50 °C reaction. With roughly eight functional parts folded into four or five physical fragments, that’s considerably simpler than stepwise restriction-ligation.
What synthesis constrains
Carr et al. [15] is the relevant caution: synthesis error rates compound with length. bcsA is the risk in this construct. As a multi-pass transmembrane protein it encodes several repeated, hydrophobic helix regions, which is exactly the sequence character prone to elevated local error and secondary-structure problems during synthesis. I’d apply MutS-based protein-mediated error correction to the bcsA fragment specifically, rather than assuming standard synthesis purity across a construct this size. bcsB is intermediate. bcsD, at 471 bp, is short enough to be low-risk.
Prototype versus scale: 1 unit to 10,000
At 1 unit, the goal is confirming the construct works at all: one Gibson assembly, one transformation, sequence-verified, then a Calcofluor white or cellulase-release glucose assay to quantify cellulose output against the 1.94 g/L reported figure, as a rough yardstick rather than a clean baseline (see Part 1). (Congo red is not suitable as the primary readout in K-12: E. coli K-12 is curli-competent, and Congo red stains amyloid-like curli fimbriae with similar intensity to cellulose. Any Congo red signal would be a mixed readout, not attributable to cellulose alone. Calcofluor white is more cellulose-selective; a cellulase-release glucose assay or gravimetric pellicle measurement gives a direct quantitative readout. If Congo red is used for rapid screening, include a ΔcsgA or ΔcsgD curli-null isogenic control).
At 10,000 units, matching the Homework 1 scale estimate (roughly 140 to 1,430 m³ of culture per year, depending mostly on yield), the construct itself doesn’t change but everything around it does:
- The strain needs banking and genetic stability checks across many generations. Plasmid loss and mutation risk rise over long fermentation runs, and a 10 kb plasmid under strong induction is a real burden.
- IPTG becomes a genuine cost line at volume. The right move at scale is migrating to autoinduction or a constitutive variant, which means the tac system is a prototyping choice, not a production one.
- AmpR is similarly a prototyping choice, not a production one. Beta-lactam resistance markers are disfavored in food production strains; residual antibiotic use and resistance gene transfer are both concerns that complicate ingredient filings. A food-grade vector without an antimicrobial resistance selectable marker, or a marker-free integration strategy, would be the requirement before any scale-up for food use.
- Bioreactor behavior differs from shake flask on oxygen transfer, mixing and induction timing.
- Most importantly: the step that determines whether the product is white at all is downstream of everything on this plasmid. Harvest, wash and dry are not DNA problems. See Part 6.
Part 6: What I don’t know yet, and how I’d find out
Eight unknowns are listed here, ordered roughly by how much each would change the design.
- Does BcsD do anything useful without BcsC and the rest of the terminal complex? This is the central bet of the construct. BcsD’s ribbon-crystallization role is characterized in the context of a full native terminal complex, and I’m asking it to work with only BcsA and BcsB for company. How I’d find out: build the construct with and without bcsD as a matched pair, grown identically, and compare the cellulose by SEM or AFM for fibril diameter and by XRD or FTIR for crystallinity index.
The harder version of this question, which I don’t think adding bcsC would answer. In K. xylinus, ribbon width is set by the geometry of a linear array of terminal complexes running along the cell surface, and E. coli has no equivalent array. If array geometry rather than BcsD is what determines ribbon width, then no amount of BcsD in E. coli produces a native-width ribbon, and adding bcsC next would not fix it either. That would point to a two-chassis framing — but for a food colorant ingredient, the split doesn’t hold cleanly. Native K. xylinus wins on fibril architecture, documented food use (nata de coco is a commercial food product), no pEtN cellulose modification, and no AmpR marker complicating an ingredient filing. The E. coli construct may win on volumetric productivity, but that is unverified and the benchmark is contaminated as argued in Part 1. The more honest conclusion: native K. xylinus is the likely production route for a food application; the E. coli construct is a mechanistic testbed for characterizing how BcsD level affects fibril architecture without conflating it with organismal context. What experiment 2 learns about the BcsD dose–response would directly inform strain selection and media optimization in the native organism.
How I’d tell the two apart: measure crystallinity and width separately. XRD or FTIR reports crystallinity; SEM or AFM reports width. If BcsD raises crystallinity but leaves width unchanged, the array geometry explanation is the live one and the chassis is the problem. If both move together, BcsD is doing the work and the design holds.
Does bcsD expression level actually move fibril diameter? (the designed experiment) The whole rationale for the RBS3 ladder is the hypothesis that more BcsD means more bundling means larger scattering features. That is currently an inference, not a measurement.How I’d find out: build a BcsD expression-level series by varying RBS3, grow in parallel, and plot measured fibril diameter against measured BcsD protein level (Western blot). Critical note on part selection: BBa_B0034 is the strongest member of the community (Elowitz) collection (BBa_B0030–B0034); sweeping that family downward tests less BcsD than the baseline and cannot falsify “more BcsD → more bundling.” Variants that test the predicted direction sit above B0034 — the Salis RBS Library Calculator or a short degenerate NNN region after the Shine–Dalgarno can sample that space. B0030–B0033 could still serve as a lower-expression control arm, establishing whether the dose–response is monotonic. A flat line falsifies the design rationale only if BcsD protein level actually changed across the series and BcsD reached the periplasm (item 3). With those two checks in place it is a clean test, which is what makes it worth running first. This experiment structure is also what the Petzold/Mukhopadhyay reading’s parallel screening infrastructure is built for.
Do BcsC’s absence and BcsD’s missing signal peptide both strand the product in the wrong compartment? Two localization risks share one assay. Without BcsC, cellulose may accumulate in the periplasm instead of being exported. And since BcsD has no annotated signal peptide, it may never reach the periplasm at all, in which case the passageway the construct is built around never forms. How I’d find out: fractionate cytoplasm, periplasm and extracellular medium, then blot for BcsD to confirm where the protein ends up and assay cellulose in each fraction to confirm where the product ends up. A cytoplasmic BcsD signal says add an engineered signal peptide (PelB or DsbA) in version two. A periplasmic BcsD with periplasmic cellulose says BcsC is required after all.
Will the complex fold and function, and where does any yield gap come from? A shortfall could come from incomplete membrane insertion, subunit misfolding, insufficient c-di-GMP to activate BcsA, or simply low expression, and each points to a different fix. How I’d find out: membrane fractionation plus Western blot to confirm all three subunits are inserted at the expected size and not degraded or in inclusion bodies, paired with a Calcofluor white or cellulase-release glucose assay to confirm cellulose output. If c-di-GMP turns out to be limiting, the corrected mechanism says the lever is co-expressing a diguanylate cyclase to raise the host pool, not increasing BcsB.
Will host background confound the measurement? How I’d find out: confirm the chosen K-12 derivative is cellulose-negative by assaying the untransformed strain first, and treat that as the blank. This is also why I moved off Nissle. A cellulose assay can’t tell me whether host BcsC is expressed, so I’d also run qPCR or a Western blot for BcsC on the untransformed strain under my growth conditions, since the bcsC omission rests on that assumption.
The measurement gap, which is a project risk and not just an experimental one. Whiteness is a property of a dried solid. Cloud labs and plate readers measure liquids. So the automation infrastructure available to this course can screen cellulose yield across many conditions, but cannot measure the property I actually care about. Fibril architecture needs SEM or AFM; whiteness needs reflectance spectroscopy on dried films. How I’d find out: split the workflow deliberately. Yield screening goes to automated parallel culture; architecture and optics go to a core facility or a collaborator with the right instruments. A handheld colorimeter giving Lab* and a whiteness index is a cheap first-pass proxy that would catch the blue-cast failure mode.
Dividing the labor honestly: what genetics controls and what process controls. The construct sets the target dimension. The drying process determines whether that dimension survives into the finished material. Both are bioprocess steps, both can fail independently, so it’s worth being precise about which does what.
Process carries real weight here. Drying sets the pore and aggregate size distribution, and scattering depends on that distribution and on packing, not on primary fibril size alone. Scattering strength does not increase linearly with filling fraction [8], so packing and drying matter as much as fibril size. I expect drying to be a dominant variable, which is why it’s worth characterizing rather than assuming. And because whiteness depends on air filling the pores, embedding the material in a tablet-coating binder of similar refractive index collapses the very contrast the structure relies on. Neither is something a plasmid addresses. This is the ordinary shape of materials biomanufacturing, where the organism makes the building block and downstream processing makes the material, the same division found in spider silk and mycelium leather.
What that means for the construct: it has to earn its place by hitting a fibril dimension that wild-type can’t reach reproducibly. That is a falsifiable claim, and experiment 2 above is the test. If BcsD level moves fibril diameter toward the optimum, strain engineering is doing real work on a measurable material property. If it doesn’t, I’d have learned this is a process invention running on a fermentation feedstock, which is still a biomanufacturing project (nata de coco is a fermented food) but a different one, and I’d rather know that early.
How I’d find out where the leverage actually sits: run a drying sweep on wild-type Komagataeibacter pellicles, which are cheap, food-safe and need no genetics, and measure reflectance across drying methods. Run it in parallel with the RBS ladder rather than before it, so the two levers get characterized against each other instead of sequentially.
- Does any of this make economic sense? How I’d find out: once real titer, run time and media cost exist for this construct, redo the Homework 1 cost-per-kg math on a g/L/day basis rather than titer, including drying and formulation cost, and compare against calcium carbonate, rice starch and microcrystalline cellulose. The honest possibility remains that this construct is a good proof of concept for engineering the pathway and not the eventual production strain.
AI use disclosure
Developed with Claude (Anthropic), used for background research (bcs operon structure and subunit function, c-di-GMP regulation, structural-color scattering physics, E. coli native cellulose machinery, iGEM part characteristics) and for structuring this write-up against the assignment deliverables.
Claude and Claude Science (both Anthropic) were also used adversarially, across three rounds of critical review of my own drafts. Round one surfaced the inverted reasoning about bcsC/bcsD, the BcsB c-di-GMP error, and the catalytic motif placement. Round two surfaced the unsupported BcsD signal-peptide claim, the apparent contradiction between omitting bcsC and choosing a cellulose-negative host, and the fact that I was using a contaminated titer as a clean numerator in the productivity argument. All of those corrections are incorporated above and flagged inline where they changed the design. A third round addressed structural issues in the design argument, including the RBS ladder direction and the scattering target framing, both of which are corrected above. Figures from either tool that I could not trace to a source were removed, and I checked the citations and numbers in this document against the source records.
Representative prompts included: “What is the function of BcsD in the K. xylinus cellulose synthase complex and does it have a signal peptide?”; “Review this construct design for scientific errors”; “What are the rare codons in bcsA from GenBank M37202?”; “Compare E. coli vs. Komagataeibacter on volumetric productivity.”
All claims here are ones I’ve reviewed and can defend. Estimates I haven’t independently verified are flagged inline as assumptions, and items still requiring verification in Benchling or against source papers are marked in brackets.
Sources referenced
[1] National Center for Biotechnology Information. GenBank accession M37202, Komagataeibacter xylinus cellulose synthase operon (source record for bcsA, bcsB and bcsD CDS extraction; bcsD at 8964..9434). https://www.ncbi.nlm.nih.gov/nuccore/M37202
[2] Omadjela, O., Narahari, A., Strumillo, J., Mélida, H., Mazur, O., Bulone, V., & Zimmer, J. (2013). BcsA and BcsB form the catalytically active core of bacterial cellulose synthase sufficient for in vitro cellulose synthesis. Proceedings of the National Academy of Sciences, 110(44), 17856-17861. https://doi.org/10.1073/pnas.1314063110
[3] UniProt P19449, BcsA (Komagataeibacter xylinus). https://www.uniprot.org/uniprotkb/P19449/entry
[4] UniProt P37716, BcsB (Komagataeibacter xylinus). https://www.uniprot.org/uniprotkb/P37716/entry
[5] UniProt P0DTX0, BcsD (Komagataeibacter xylinus); no signal peptide or transmembrane annotation. https://www.uniprot.org/uniprotkb/P0DTX0/entry
[6] Syurik, J., Siddique, R. H., Dollmann, A., Gomard, G., Schneider, M., Worgull, M., Wiegand, G., & Hölscher, H. (2017). Bio-inspired, large scale, highly-scattering films for nanoparticle-alternative white surfaces. Scientific Reports, 7, 46637. https://doi.org/10.1038/srep46637
[7] Luke, S. M., Hallam, B. T., & Vukusic, P. (2010). Structural optimization for broadband scattering in several ultra-thin white beetle scales. Applied Optics, 49(22), 4246-4254. https://pubmed.ncbi.nlm.nih.gov/20676179/
[8] Burresi, M., Cortese, L., Pattelli, L., Kolle, M., Vukusic, P., Wiersma, D. S., Steiner, U., & Vignolini, S. (2014). Bright-white beetle scales optimise multiple scattering of light. Scientific Reports, 4, 6075. https://doi.org/10.1038/srep06075
[9] Potočnik, V., Gorgieva, S., & Trček, J. (2023). From nature to lab: Sustainable bacterial cellulose production and modification with synthetic biology. Polymers, 15(16), 3466. https://doi.org/10.3390/polym15163466
[10] Acheson, J. F., Ho, R., Goularte, N. F., Cegelski, L., & Zimmer, J. (2021). Molecular organization of the E. coli cellulose synthase macrocomplex. Nature Structural & Molecular Biology, 28(3), 310-318. https://doi.org/10.1038/s41594-021-00569-7
[11] Sajadi, E., Fatemi, S. S.-A., Babaeipour, V., Deldar, A. A., Yakhchali, B., & Anvar, M. S. (2019). Increased cellulose production by heterologous expression of bcsA and B genes from Gluconacetobacter xylinus in E. coli Nissle 1917. Bioprocess and Biosystems Engineering, 42(12), 2023-2034. https://doi.org/10.1007/s00449-019-02197-4
[12] Gullo, M., Sola, A., Zanichelli, G., Montorsi, M., Messori, M., & Giudici, P. (2017). Increased production of bacterial cellulose as starting point for scaled-up applications. Applied Microbiology and Biotechnology, 101(22), 8115-8127. https://doi.org/10.1007/s00253-017-8539-3
[13] iGEM Registry of Standard Biological Parts. BBa_K864400 (ptac promoter, 61 bp; used as the reference sequence for ptac, which the construct gets from the pKK223-3 backbone), BBa_B0034 (RBS, designed by Elowitz, 1999), BBa_B0030 to BBa_B0033 (RBS strength ladder), BBa_B0015 (double terminator). https://parts.igem.org/Part:BBa_K864400, https://parts.igem.org/Part:BBa_B0034 and https://parts.igem.org
[14] Gibson, D. G., et al. (2009). Enzymatic assembly of DNA molecules up to several hundred kilobases. Nature Methods, 6, 343-345. https://doi.org/10.1038/nmeth.1318
[15] Carr, P. A., et al. (2004). Protein-mediated error correction for de novo DNA synthesis. Nucleic Acids Research, 32, e162. https://doi.org/10.1093/nar/gnh16