Week 3 HW: Cell-Free Reaction Design
Erum Azeez Khan · HTBAA 2026, Genspace NYC node · October 2026
Designs submitted: coopetition.htgaa.org. One composition each for sfGFP, PETase and Reteplase, submitted October 8 and 12.
Status: Part A and Part B complete. Part C not attempted. Five reagents upvoted in Community Reagents, with the Erv1p rationale written up in B2.
If you are picking this up: the open questions are listed at the end of B2 and in the Reflection. The two I would most want challenged are the DsbA-versus-Erv1p mechanism argument and whether H₂O₂ contributes useful oxidizing capacity.
The short version
I was given a 20 microlitre drop of liquid and asked to decide what goes in it, so that three different proteins get built as cheaply as possible. This page explains what I chose and why.
If you have no biology background, the next three sections should be enough to follow the whole thing.
Making protein without a cell
Normally, if you want a protein, you grow bacteria and let them make it. The cell handles everything: it feeds itself, keeps itself alive, manages its own chemistry.
Cell-free protein synthesis skips the living part. You burst the bacteria open, throw away the shell and the genome, and keep the machinery that reads genes and assembles proteins. Then you add a gene you care about, plus everything the cell used to supply for itself.
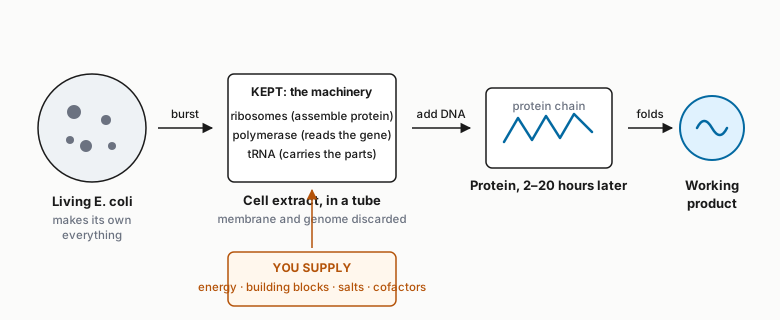
That last part is the whole assignment. In a living cell, the recipe is the cell’s problem. Here it is mine. Energy, raw materials, salts, acidity, helper molecules: I pick every one, and the protein comes out well or badly depending on what I picked.
The upside is total control and speed. You can change the recipe and see the result the same day, with no organism to keep alive.
Three proteins, one easy and one brutal
A protein starts as a long chain and has to fold into a specific shape. Some proteins also lock themselves shut at particular points along the chain, like snapping a few press studs. Those locks are called disulfide bonds, and they are where this gets hard.
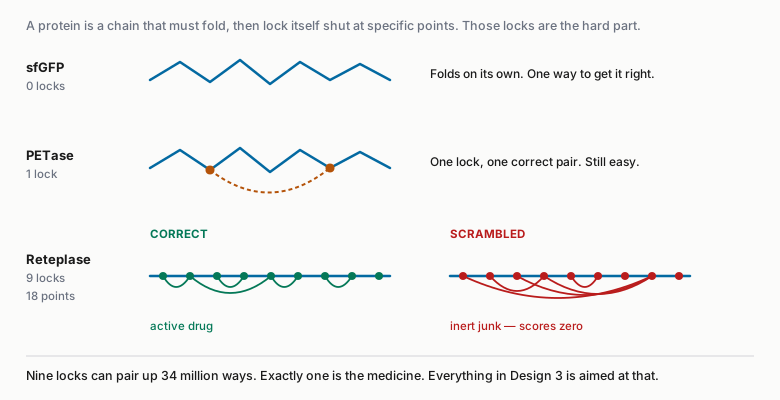
sfGFP has none. It folds on its own and glows green when it works, so you can measure it by shining a light at it.
PETase has one. It is an enzyme that breaks down PET plastic.
Reteplase has nine. It is a real clot-busting drug given to heart attack patients. Nine locks means eighteen points that have to find the right partner, and there are over 34 million ways to pair them up. One of those is the medicine. The rest are inert junk.
This is why Reteplase is normally not made this way at all. Industrially it is produced as useless clumps and then chemically unfolded and refolded in a separate step.
Volume is the real constraint
The reaction is one drop. Just over half of it is already spoken for before I touch anything.
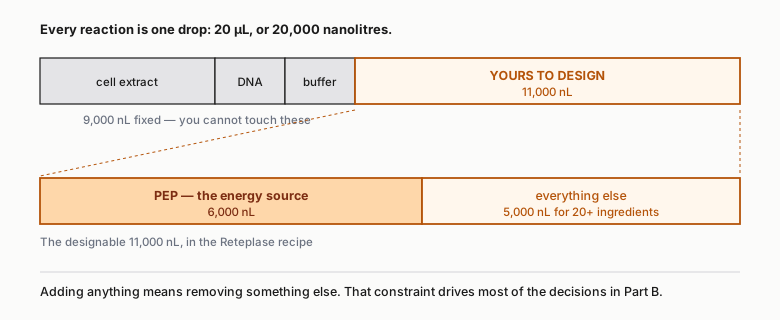
Everything is dispensed by a robot that moves liquid in 25 nanolitre increments, roughly a two-thousandth of a drop. So the recipe is not just a list of ingredients. It is a budget, and the energy source alone can eat more than half of it.
The rule that drives every decision
The three proteins are not scored the same way, and this is the single most useful thing to know before reading the rest.
sfGFP is scored on how much protein you make per dollar. More is better. Simple.
PETase and Reteplase are scored on how much working protein you make per dollar. Misfolded protein counts as zero.
So the two halves of this project pull in opposite directions. My sfGFP recipe chases cheap volume. My Reteplase recipe spends scarce space on folding help it could have spent on making more protein, because more broken Reteplase is worth nothing.
What happens to these recipes
This is a coopetition, a cooperative competition. Everyone in the class designs recipes, OpenAI agents running GPT-5 design their own, and Ginkgo Bioworks runs the best ones in an automated lab. Around 320 unique recipes go in per cohort. Selection favors ideas that explore somewhere new, so near-duplicates get dropped. Expert labs are competing too, including Kate Adamala’s and Mark Styczynski’s.
How to read the rest
Part A compares published recipes and works out which ingredients actually matter. Part B gives my three recipes, what each one tests, and what it cost. The Appendix shows every calculation, so you can check my arithmetic. The AI use section records three things I got wrong and how they were caught.
Part A: Compare Cell-Free Reaction Compositions
A1. Why does the concentration of potassium glutamate and magnesium glutamate differ between compositions? Which is more sensitive?
Why both are glutamate salts in the first place
Before the concentrations, the counter-ion. Every modern CFPS formulation uses glutamate rather than acetate or chloride, and that was a deliberate change made by Jewett & Swartz in 2004 [1]. Glutamate is the principal anion E. coli accumulates under osmotic stress, and protein–nucleic acid interactions are more favorable in glutamate than in acetate solutions (Record et al., as cited in [1]). Chloride actively inhibits some CFPS enzymes. So when we adjust “potassium glutamate,” we are tuning K⁺ against a counter-ion chosen to mimic the cytoplasm.
They do different jobs
Potassium is the bulk monovalent cation. It sets ionic strength and supports ribosome function, and the cell’s own K⁺ concentration is in the physiological range these formulations target.
Magnesium is a structural divalent. It holds the ribosomal subunits together and keeps tRNAs correctly folded. Too little and translation stalls; too much and proteins aggregate.
Three reasons the numbers differ between published compositions
1. How the extract was prepared. Dialyzed extracts are stripped of residual small molecules and need more supplementation. Jewett’s 2004 work used dialyzed A19 (a K-12 derivative) and landed on 20 mM magnesium glutamate for PANOx-SP. Modern formulations built on non-dialyzed BL21 Star (DE3) lysate, which carries its own residual magnesium, sit at 7 to 9 mM. Both are correct for their own system.
2. Which energy substrate is used. PEP chelates Mg²⁺ with higher affinity than pyruvate does, so a PEP-based system needs more total magnesium to deliver the same free Mg²⁺. This shows up cleanly in Jewett’s own data: the optimum is 20 mM in PANOx-SP (with PEP) and 8 mM in Cytomim (with pyruvate), in otherwise comparable reactions [1].
3. Which protein is being made. The coopetition designer’s reagent notes state that reteplase needs lower potassium glutamate (~250 mM) than sfGFP (~354 mM) to reduce aggregation during synthesis, and slightly less magnesium (~5.7 mM vs ~7 mM) because oxidizing conditions alter Mg²⁺ sensitivity.
Which is more sensitive: magnesium, decisively
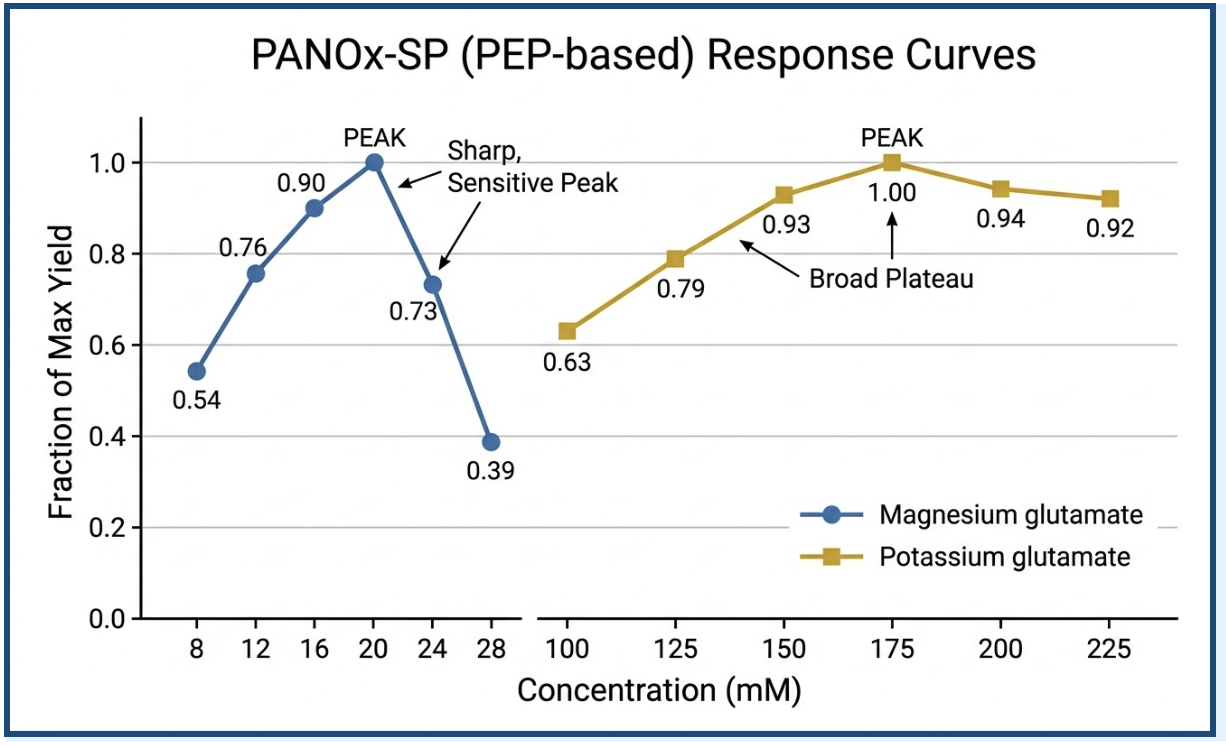
Jewett & Swartz’s Table II varies one solute at a time and reports the fraction of maximum yield. Format is concentration mM / fraction of max:
PANOx-SP (PEP-based):
| Solute | Response curve |
|---|---|
| Magnesium glutamate | 8/0.54 · 12/0.76 · 16/0.90 · 20/1.00 · 24/0.73 · 28/0.39 |
| Potassium glutamate | 100/0.63 · 125/0.79 · 150/0.93 · 175/1.00 · 200/0.94 · 225/0.92 |
Cytomim (pyruvate-based):
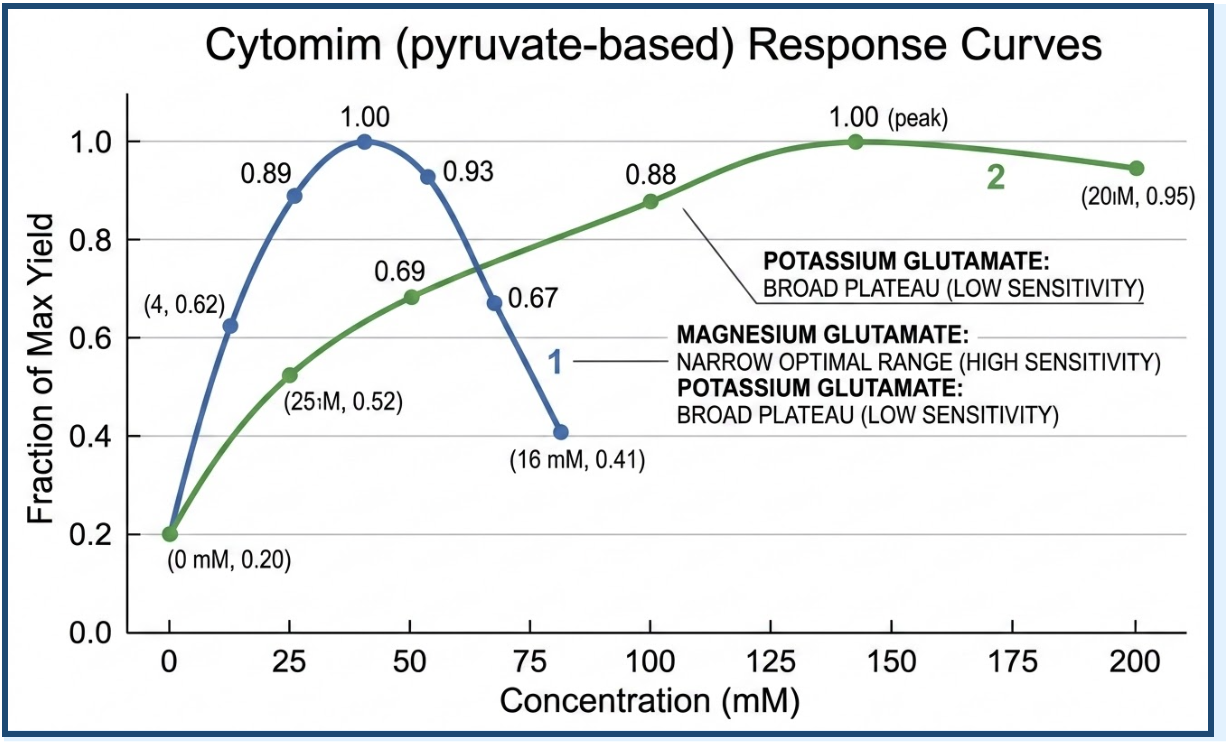
| Solute | Response curve |
|---|---|
| Magnesium glutamate | 4/0.62 · 6/0.89 · 8/1.00 · 10/0.93 · 12/0.67 · 16/0.41 |
| Potassium glutamate | 0/0.20 · 25/0.52 · 50/0.69 · 100/0.88 · 130/1.00 · 200/0.95 |
The contrast is stark. In Cytomim, doubling magnesium from 8 to 16 mM costs 59% of yield. Moving potassium from 130 to 200 mM, a 1.5x change, costs 5%. Magnesium has a sharp peak; potassium has a broad plateau. The same pattern holds in PANOx-SP, where magnesium falls to 0.39 of maximum at 28 mM while potassium stays above 0.92 across the entire 175 to 225 mM range.
The point I think matters most
Magnesium is not just the more sensitive parameter. Its optimum is system-specific, moving with extract preparation, dialysis and energy substrate. That is why a magnesium number cannot be ported between papers, and why Jewett’s 20 mM and Olsen’s 8 mM are both right.
I learned this the hard way during this assignment. I initially reasoned from Jewett’s Table II that the coopetition’s PEP reference plates, which sit at 8.22 mM, were magnesium-starved for a PEP system and should be raised toward 14, reasoning from Jewett’s 20 mM optimum. The designer’s own guidance says the opposite: the optima are ~7 mM for sfGFP and ~5.7 mM for reteplase. One striking table from 2004 outweighed six modern data points measured in this exact lysate. The practical rule I would take forward is to treat magnesium as narrow and re-tune it whenever the extract or energy system changes, and to treat potassium as a wide knob that can be moved for other reasons.
A2. How does a PEP+NTP formulation differ from a Ribose+NMP formulation?
In one line: PEP+NTP buys the energy and the building blocks pre-made. Ribose+NMP buys cheap precursors and lets the lysate’s own metabolism build them.
The mechanism
In a PEP+NTP system, phosphoenolpyruvate is a high-energy phosphate donor. Pyruvate kinase, present in the lysate, transfers its phosphate to ADP to regenerate ATP. The four nucleoside triphosphates are supplied directly, so transcription has its substrates from the start.
In a Ribose+NMP system, no high-energy phosphate is added. Ribose and nicotinamide feed the lysate’s nucleotide salvage pathways, which phosphorylate the supplied monophosphates up to triphosphates in situ. Olsen et al. showed this works: their RFopt formulation starts with zero exogenous ATP and still reaches comparable ATP levels within 30 minutes [2].
Four practical differences
1. Cost. The triphosphates are where the money goes. From the coopetition’s own price list:
| NTP | $/mL of stock | NMP | $/mL of stock |
|---|---|---|---|
| GTP | $39.34 | GMP | $0.53 |
| UTP | $37.85 | UMP | $0.84 |
| CTP | $27.94 | CMP | $1.27 |
| ATP | $1.54 | AMP | $0.70 |
Roughly 30 to 70-fold on the three expensive ones. Add PEP at $2.20/mL and the gap compounds. Olsen reports PANOx-SP at $4,083 per gram of protein against RFopt at $60 [2].
2. Phosphate accumulation and pH. PEP liberates inorganic phosphate as it is consumed. Jewett measured roughly 30 mM accumulating over a PANOx-SP batch reaction, which is precisely the concentration above which phosphate inhibits coupled transcription–translation, and the pH fell nearly a full unit to below 6.5 [1]. A pyruvate-based Cytomim reaction accumulated only ~4 mM and held pH stable. RFopt holds 10 to 15 mM phosphate, three times lower than PANOx-SP, because no free phosphate is liberated [2].
3. ATP profile over time. PANOx-SP spikes ATP within 30 minutes and then crashes to near zero by the end of the reaction. RFopt sustains ~250 µM for the full duration, comfortably above the affinity threshold for cell-free gene expression [2]. The ribose route trades a fast start for a longer productive window.
4. Volume, which is specific to this coopetition. PEP’s stock is 0.1 M, so reaching 30 mM in a 20 µL reaction takes 6,000 nL, more than half of the 11,000 nL we get to design. Ribose at 666 mM takes 1,500 nL for 50 mM. In a volume-constrained design, PEP is expensive twice over.
What the coopetition reference data actually shows
This is where it gets interesting, because the measured results cut against the literature’s direction of travel:
| Target | PEP plate | Ribose plate | PEP advantage |
|---|---|---|---|
| sfGFP | 0.61 g/L | 0.46 g/L | 1.3x |
| PETase | 314.6 µM | 274.8 µM | 1.1x |
| Reteplase | 10.9 µM | 0.81 µM | 13.5x |
PEP wins on raw output for all three. The reteplase gap is the striking one, and the explanation is in the compositions: the reteplase ribose plate is Smith et al.’s GPT-5-designed winner (#35) with the GSSG/GSH/DsbC package bolted on. An sfGFP-optimized composition fails badly on a nine-disulfide protein. Olsen saw the same thing, reporting a 75 to 97% yield loss when the disulfide package was added to RFopt, which they only recovered by raising HEPES to pH 7.5 and using a Δgor lysate with 20-fold less iodoacetamide [2].
Since scoring is cost per unit of output rather than output alone, the honest comparison is the titer ratio against the cost ratio, not titer alone.
Partial substitution is a real third option
Both Olsen and Smith confirmed that guanine plus ribose replaces GMP with no loss of yield, and Smith found AMP partially replaceable by adenosine (median titer 0.279 with adenosine versus 0.138 without, in their Step 5 data) [3]. Attempts to replace CMP and UMP with the corresponding pyrimidine nucleosides failed in both studies. So the choice is not strictly binary; the cheapest published compositions sit partway along it.
A3. Compare and contrast two literature compositions
I chose PANOx-SP (Jewett & Swartz, 2004) and RFopt (Olsen et al., 2026). They bracket two decades of the field, they are the two endpoints of the PEP-versus-ribose question above, and both have been run in Ginkgo’s lab on the same lysate, so the comparison is grounded rather than paper-to-paper.
Headline numbers, as measured in this system
| Metric | PANOx-SP (2004) | RFopt (2026) |
|---|---|---|
| sfGFP yield | 1.11 g/L | 2.39 g/L |
| Cost per gram protein | $4,083 | $60 |
| Reagent cost | $4.54/mL | $0.14/mL |
| Distinct components | ~20 | ~14 |
RFopt roughly doubles the yield at under 2% of the cost.
Composition, side by side (mM unless noted)
| Reagent | PANOx-SP | RFopt |
|---|---|---|
| Potassium glutamate | 130 | 362 |
| Magnesium glutamate | 8 | 8 |
| Ammonium glutamate | 10 | — |
| Amino acids | 2 | 5 |
| Tyrosine | 2 | 5 |
| Cysteine | 2 | 5 |
| HEPES pH 7.5 | 57 | 75 |
| Phosphate (di:mono) | — | 15 |
| PEP | 30 | — |
| Glucose | — | 10 |
| Ribose | — | 50 |
| Nicotinamide | — | 4 |
| ATP | 1.25 | — |
| CTP / GTP / UTP | 0.875 each | — |
| AMP | — | 3 |
| CMP / GMP / UMP | — | 2.15 each |
| Folinic acid (mg/mL) | 0.025 | — |
| CoA | 0.25 | — |
| NAD | 0.375 | — |
| Putrescine | 1.25 | — |
| Spermidine | 1.56 | — |
| Oxalate | 3.75 | — |
What changed, and why
Ten kinds of component disappear. RFopt drops PEP, all four NTPs, tRNA, CoA, NAD, folinic acid, putrescine, spermidine, oxalate and ammonium glutamate. Several of those were treated as mandatory for twenty years. Olsen’s explanation for the cofactors is that they are unnecessary when lysates are not dialyzed, since the extract supplies them [2]. Oxalate’s disappearance makes chemical sense on its own: it exists to inhibit PEP synthetase, which only matters when PEP and pyruvate are cycling.
Potassium nearly triples, from 130 to 362 mM. Given the A1 finding that potassium sits on a broad plateau, this is a cheap change that the optimization was free to make. Potassium glutamate costs $0.07/mL.
Magnesium does not move at all. Both sit at 8 mM. I find this the most telling line in the table. Everything else about the chemistry was rebuilt, and the one parameter that stayed fixed is the one Jewett’s own data identified as the most sensitive. That is A1’s argument restated as an accident of history.
Amino acids, tyrosine and cysteine all go from 2 to 5 mM, and buffer rises from 57 to 75 mM. RFopt is more generous with the things that are cheap and more frugal with the things that are not.
Nucleotides go up in concentration while going down in cost. NMPs at 2.15 to 3 mM against NTPs at 0.875 to 1.25 mM is roughly 2.5x more nucleotide by concentration, at about a thirtieth of the unit price.
Where RFopt is worse
It would be too easy to read this as a clean win. Olsen documents three fragilities:
- More sensitive to lysate amount than PANOx-SP, reflecting a finer metabolic balance.
- Much more sensitive to surface-area-to-volume ratio, because oxidative phosphorylation in the crude lysate is doing real work. 20% O₂ gives under 2 g/L; 100% O₂ gives 3.7 g/L [2].
- It collapses under oxidizing conditions, losing 75 to 97% of yield when the disulfide package is added, recovered only by raising HEPES to pH 7.5 and switching to a Δgor lysate. PANOx-SP, which has more buffering headroom, tolerates the same package.
That third point is confirmed by the coopetition’s own reteplase data in A2. It is a good reminder that “state of the art” is scoped to the protein it was optimized on.
A brief third composition
Smith et al.’s GPT-5-designed composition #35 is worth noting because it is neither of the above [3]. It keeps RFopt’s ribose/NMP skeleton (ribose 40, nicotinamide 4, phosphate 7.5/7.5, glucose 8.3) but adds spermidine back at 1.2 mM, cuts the NMPs by half to a sixth, and adds sodium pyruvate at 9.1 mM and catalase at 187.5 U/mL. It reports $430/g at 3.04 g/L in 2 mL tubes, and 0.72 g/L in 384-well plates against RFopt’s ~0.25.
The spermidine detail is the one I keep returning to. Olsen’s optimization removed it; GPT-5’s independently restored it and measured a near-2x effect on median titer. Two careful optimizations of the same system reached opposite conclusions about a reagent costing $1.05/mL, which says something about how rugged this landscape is.
Part B: Design One Composition for Each Protein
B1. Three compositions
I submitted one composition for each protein. Rather than tune all nine reagent categories at once, I treated each design as a small number of named hypotheses against a reference backbone, so that if a design performs well or badly I can say which change was responsible. All three sum to exactly 11,000 nL of designable volume with no negative water.
Every volume, cost and redox figure below is derived in the Appendix. Each design is followed by the hypothesis text exactly as submitted to the coopetition platform, so the record of what I predicted is visible alongside the reasoning.
Design 1 — sfGFP
Base: sfGFP Ribose. Measured cost: $0.12 per well.
| Type | Reagent | mM | nL |
|---|---|---|---|
| Salts | K(Glu) | 345 | 3,325 |
| Salts | Mg(Glu)₂ | 8.22 | 225 |
| Amino acids | Amino acids | 5 | 1,600 |
| Amino acids | Tyrosine | 1 | 0 |
| Amino acids | Cysteine | 1 | 0 |
| Buffers | HEPES pH 7.5 | 75 | 900 |
| Buffers | Phosphate (mono:di) | 15 | 600 |
| Energy substrates | Ribose | 50 | 1,500 |
| Cofactors | Nicotinamide | 4 | 800 |
| Polyamines / redox | Spermidine | 1.25 | 100 |
| Enzymes | Catalase | 187.5 U/mL | 75 |
| NMPs | AMP | 1.0 | 200 |
| NMPs | CMP | 1.0 | 200 |
| NMPs | GMP | 1.0 | 200 |
| NMPs | UMP | 1.0 | 200 |
| Water | Water | 1,075 |
Salts unchanged from the reference, which was the deliberate choice after getting the magnesium reasoning wrong in A1. Energy system stays ribose plus nicotinamide salvage, since sfGFP is the one target where cost per gram is the score and the NMP route is roughly thirty-fold cheaper on the expensive nucleotides. Building blocks: amino acids raised to 5 mM, and all four NMPs trimmed from the reference toward the Smith winner range. The two real bets sit outside the core recipe: spermidine at 1.25 mM and catalase at 187.5 U/mL, both restored from compositions where RFopt had removed them. No GSSG/GSH or DsbC, since sfGFP has no disulfides.
Text Submitted for Design1:
The sfGFP Ribose plate (Olsen RFopt) omits two cheap additives with independent published support. Smith et al. 2026 measured ~1.9x higher median titer with spermidine (0.253 vs 0.131 g/L, Step 5), and their best 384-well composition (#35, 0.72 g/L vs ~0.25 for RFopt) is the only one containing catalase, consistent with oxygen limitation in sealed 384-well plates. Adding spermidine 1.25 mM and catalase 187.5 U/mL costs under 200 nL. NMPs are trimmed toward the Smith winner range to cut reagent cost without limiting synthesis. Prediction: titer at or above the 0.46 g/L baseline at lower cost per 20 µL.
Design 2 — PETase
Base: PETase Ribose. Measured cost: $1.47 per well.
| Type | Reagent | mM | nL |
|---|---|---|---|
| Salts | K(Glu) | 300 | 2,275 |
| Salts | Mg(Glu)₂ | 8.22 | 225 |
| Amino acids | Amino acids | 5 | 1,600 |
| Amino acids | Tyrosine | 1 | 0 |
| Amino acids | Cysteine | 1 | 0 |
| Buffers | HEPES pH 7.5 | 75 | 900 |
| Buffers | Phosphate (mono:di) | 15 | 600 |
| Energy substrates | Ribose | 50 | 1,500 |
| Cofactors | Nicotinamide | 4 | 800 |
| Polyamines / redox | Spermidine | 1.25 | 100 |
| Enzymes | DsbC | 1 µM | 200 |
| NMPs | AMP | 3 | 600 |
| NMPs | CMP | 2.125 | 425 |
| NMPs | GMP | 2.125 | 425 |
| NMPs | UMP | 2.125 | 425 |
| Water | Water | 925 |
Same ribose skeleton and the same spermidine addition as Design 1, so that the sfGFP and PETase designs share a backbone and the comparison between them isolates the disulfide variable. The one deliberate move is DsbC cut from 5 µM to 1 µM. PETase has a single disulfide, and 5 µM is the dose the reference formulations use for proteins with one disulfide and with nine alike. Since PETase is scored on dollars per unit of activity and DsbC is about 83% of the reaction’s reagent cost, a fivefold cut that preserves activity improves the score far more than any yield tweak available at this volume.
Where the published doses sit. No published DsbC dose-response curve exists in a cell-free system. What the open literature does pin down is where the field sits: Hunt et al. (2019) work at 100 µg/mL, which is 2.1 µM as the functional dimer (46.8 kDa) or 4.3 µM as the monomer. So published working concentrations cluster at roughly 2 to 4 µM, and the reference plates’ 5 µM sits at or just above the top of that range. Design 3 at 2.5 µM lands on the dimer value. Design 2 at 1 µM goes below the published floor entirely. Neither region has a measured response curve behind it, which is the point of probing them.
Measured cost is $1.47 per well, down from $6.79 at the reference 5 µM DsbC. The designer scores Design 2 at 88% similarity to its reference plate, so the changes are substantive without putting the design somewhere uninterpretable.
Text Submitted for Design 2:
PETase is scored on enzyme activity per dollar. DsbC is $5,632/mL of stock, so 5 µM costs $5.63 per well and is 83% of this composition’s total reagent cost, verified by toggling it in the designer ($6.79 vs $1.16). PETase carries one disulfide (Cys274–Cys292) and the brief places it in the reducing regime with no folding helper, yet the reference plates carry 5 µM anyway, and DsbC appears as a single fixed value in the OFAT control plates with no sweep. Reducing to 1 µM cuts reagent cost ~66%. Spermidine is added at 1.25 mM, absent from this plate but measured by Smith et al. at ~1.9x median titer (0.253 vs 0.131 g/L, Step 5). Prediction: activity falls less than cost, improving $/unit activity. If activity holds entirely, 5 µM was overspecified for a single-disulfide target.
Design 3 — Reteplase
Base: Reteplase PEP. Measured cost: $3.51 per well.
| Type | Reagent | mM | nL |
|---|---|---|---|
| Salts | K(Glu) | 200 | 0 |
| Salts | Mg(Glu)₂ | 8.22 | 225 |
| Salts | NH₄(Glu) | 10 | 200 |
| Amino acids | Amino acids | 2 | 400 |
| Amino acids | Tyrosine | 1 | 0 |
| Amino acids | Cysteine | 1 | 0 |
| Buffers | HEPES pH 7.5 | 75 | 900 |
| Energy substrates | PEP | 30 | 6,000 |
| Cofactors | Folinic acid | 0.025 mg/mL | 50 |
| Cofactors | CoA | 0.25 | 100 |
| Cofactors | NAD | 0.375 | 75 |
| Polyamines / redox | Putrescine | 1.25 | 50 |
| Polyamines / redox | Spermidine | 1.5625 | 125 |
| Polyamines / redox | GSSG | 8.08 | 950 |
| Polyamines / redox | GSH | 1 | 200 |
| Polyamines / redox | Oxalic acid | 3.75 | 150 |
| Enzymes | DsbC | 2.5 µM | 500 |
| NTPs | ATP | 1.25 | 250 |
| NTPs | CTP | 0.875 | 175 |
| NTPs | GTP | 0.875 | 175 |
| NTPs | UTP | 0.875 | 175 |
| Water | Water | 300 |
This is the only design that stays on PEP, because the reference data gives PEP a 13.5x advantage on Reteplase specifically (10.9 µM against 0.81 µM). Salts, energy system and cofactors are left at reference values, and K(Glu) stays at the reference plate’s 200 mM rather than the tooltip’s ~250, since changing a salt was exactly the move A1 argues against making on indirect evidence.
The design asks one question: can cheap oxidant substitute for expensive isomerase? DsbC is an isomerase. It rearranges wrong cysteine pairings but does not create disulfide bonds. The oxidant is the GSSG/GSH couple.
The 4.04 : 1 ratio is not a platform default. It is Olsen et al.’s published condition, 4 mM GSSG and 1 mM GSH with 5 µM DsbC, validated across fifteen therapeutic proteins spanning zero to sixteen disulfide bonds, including vtPA cleaving the same IPR-AMC substrate this assay uses. That breadth is the point: it is a condition chosen to work acceptably across many proteins, not optimized for any single one. Reteplase sits near the top of that range at nine disulfides. So the question is whether a broadly validated condition is the right condition for the hardest protein in the set, which is structurally the same question A1 asks about magnesium.
So I halved DsbC to 2.5 µM and doubled GSSG to 8.08 mM, and raised HEPES from 57.5 to 75 mM to give the reaction pH headroom to use the extra oxidant.
Why I moved GSSG rather than GSH. Redox potential follows [GSSG]/[GSH]², so GSH is the stronger lever: halving it shifts the potential twice as far as doubling GSSG, and would have freed 100 nL rather than costing 475 (Appendix E). I did not take it. The designer’s GSH tooltip states that GSH “helps reshuffle incorrectly formed disulfide bonds toward the right pairings” and is the “essential partner to GSSG” that lets DsbC correct mispairings. Cutting the reduced thiol would make the environment more oxidizing while removing what makes isomerization possible, on the protein with the most mispairing to fix. The arithmetic favored GSH; the mechanism did not.
I want to be clear about the weakness: the DsbC cut and the GSSG increase are coupled on purpose, so if activity drops I will not know which one caused it. I accepted that because the question is about the tradeoff between them, not about either variable on its own. The version I submitted first changed only HEPES and DsbC and scored 97% similar to its reference plate. The revision scores 94%, which is still high, though I think that is close to the floor for a PEP-based design: PEP alone occupies 6,000 of the 11,000 designable nL, so more than half the budget is fixed before any choice gets made.
Measured cost is $3.51 per well. Doubling GSSG cost three cents, which is the tradeoff this design is built on: the oxidant is nearly free and the isomerase is not.
Text Submitted for Design 3:
Reteplase carries nine disulfides and the reference plates show how hard that is: 10.9 µM on PEP against 0.81 µM on ribose. I stayed on the PEP backbone for that reason. The design tests one tradeoff: can cheap oxidant substitute for expensive isomerase? DsbC rearranges mispaired bonds but does not create them; the oxidant is the GSSG/GSH couple. The 4.04:1 ratio is not a platform default. It is Olsen et al.’s published condition (4 mM GSSG, 1 mM GSH, 5 µM DsbC), validated across fifteen therapeutic proteins spanning zero to sixteen disulfides. It is tuned for breadth, not for any single protein, and Reteplase sits near the top of that range. I halve DsbC from 5 to 2.5 µM and double GSSG to 8.08 mM, holding GSH at 1 mM because GSH drives the isomerization DsbC depends on. HEPES goes from 57.5 to 75 mM: Jewett measured ~30 mM phosphate accumulating in PEP batch reactions with pH falling below 6.5, and Olsen recovered an oxidizing formulation by raising HEPES to pH 7.5. Prediction: activity holds or improves while cost falls. Caveat: the two redox changes are coupled deliberately, so a drop cannot be attributed to either alone.
Summary of reagents adjusted
Across the three designs, the categories I actually moved are:
- Amino acids: raised to 5 mM in Designs 1 and 2
- Buffers: HEPES 57.5 → 75 mM in Design 3
- Energy substrates: ribose for sfGFP and PETase, PEP retained for Reteplase
- Polyamines / redox: spermidine added at 1.25 mM to Designs 1 and 2; GSSG doubled to 8.08 mM in Design 3
- Enzymes: catalase added to Design 1; DsbC cut 5 → 1 µM in Design 2 and 5 → 2.5 µM in Design 3
- NMPs: trimmed in Design 1, left at reference in Design 2
I left magnesium and potassium at their reference-plate values in all three. A1 explains why.
B2. Community reagents
Upvoted: Erv1p (FAD-linked sulfhydryl oxidase, Saccharomyces cerevisiae)
I upvoted Erv1p rather than proposing it. Caleb Seward had already suggested it, and his rationale reaches the same conclusion I did by the same route: that every other reagent on the board acts downstream of disulfide formation, that the GSSG/GSH pool supplies the oxidizing equivalents and is consumed over the reaction, and that a FAD-dependent oxidase pulling from dissolved O₂ regenerates itself catalytically. He also flags catalase for the peroxide byproduct and cites Ruddock’s group on a tPA fragment with nine disulfide bonds, which is Reteplase.
Two people converging independently on the same reagent and the same mechanism is worth noting on its own. What follows is my own reasoning, developed before I saw his entry. It adds the arithmetic his does not: why the product cannot deplete the pool, what actually drains it, and what the oxygen budget costs.
The gap. The oxidizing reference formulations include DsbC but no oxidase. DsbC is an isomerase: it finds wrong cysteine pairings and reshuffles them. It does not create disulfide bonds. The oxidant is the GSSG/GSH couple.
What drains that pool, and what does not. My first version of this argument claimed the product depletes the glutathione pool. It does not, and the arithmetic is one line: at roughly 11 µM Reteplase with nine disulfides each, demand is about 98 µM of oxidizing equivalents against 4,040 µM of GSSG, a 41-fold surplus. Even ten times more synthesized protein would not exhaust it.
The real drain is catalytic, not stoichiometric. Free cysteine at 1 mM is a competing thiol sink ten times the protein’s demand, roughly 12% of the GSSG pool if fully oxidized. More importantly, residual reductases consume glutathione turn after turn. That is why the oxidizing protocol exists in the form it does: extract is treated with iodoacetamide to inactivate thiol reductases, and the source strain is Δgor because glutathione reductase drains oxidized glutathione [2]. A catalytic drain is a better argument for a catalytic oxidase than a stoichiometric one.
Erv1p is that oxidase. It is a FAD-linked sulfhydryl oxidase that passes electrons from thiols to molecular oxygen as the terminal acceptor (Lee et al. 2000), regenerating oxidizing equivalents continuously rather than topping up a pool. It complements DsbC rather than replacing it.
Why Erv1p and not DsbA. The obvious alternative is DsbA, E. coli’s native oxidase and DsbC’s actual periplasmic partner. I ruled it out on mechanism: DsbA must be re-oxidized by DsbB, which passes electrons to the membrane quinone pool. Crude lysate has no functioning membrane quinone chain, so DsbA would oxidize once and remain reduced. Erv1p is self-sufficient with O₂, the one oxidant the reaction has in supply. This is my reasoning and the part I would most want challenged.
How much Erv1p, and why I can’t cite a number. Erv1p has no published working concentration as an added reagent. In CyDisCo it is co-expressed from a polycistronic plasmid, and in Lanclos’s cell-free work it arrives in autoinduced enriched extract. In both cases the amount is set by a promoter, not dispensed. So I cannot cite a number, and I am not going to invent one. What I can do is anchor it: the reference plates already dose DsbC as an added protein at 5 µM,so I would dose Erv1p at 1 to 2.5 µM, a 1:2 to 1:5 molar ratio to the isomerase already present. The low end is deliberate. Erv1p is catalytic, so turnover capacity rather than stoichiometry is the relevant variable and it does not need to match substrate. This figure is reasoned by analogy, not cited. Caleb Seward’s entry proposes a 100 µM stock and states that Erv1p “works catalytically in the low micromolar range,” which brackets the same window I reached from the DsbC anchor. Two independent estimates landing in the same range is weak evidence, but it is better than one.
Supporting research (sources outside the assigned readings):
- Nguyen et al. (2011). Microbial Cell Factories 10:1 — established CyDisCo: co-expressing Erv1p with PDI allows disulfide-bonded eukaryotic proteins to fold in the reducing E. coli cytoplasm without an engineered oxidizing strain.microbialcellfactories.biomedcentral.com
- Lee, Hofhaus & Lisowsky (2000), FEBS Letters — mechanism paper establishing Erv1p as a FAD-linked sulfhydryl oxidase.febs.onlinelibrary.wiley.com
- Lanclos (2025), LSU doctoral dissertation, Advancing Cell-free Systems for Production of Multiple Disulfide containing Proteins — runs PDI/Erv1p in cell-free systems, with vtPA (a truncated tissue plasminogen activator variant, essentially Reteplase) among the model proteins.repository.lsu.edu
- Gąciarz et al. (2017), Microbial Cell Factories — soluble expression of disulfide-bonded proteins in E. coli cytoplasm using this machinery.link.springer.com
The limitation, stated up front. Lanclos found PDI/Erv1p folds proteins with five or fewer disulfides efficiently, and that proteins with six or more showed low solubility and activity. Reteplase has nine. I am not predicting Erv1p solves Reteplase; I am predicting it moves the number. The 9.7-fold vtPA improvement reported in that work came from combining CFPS with chaperone-rich extract or an MBP fusion, not from the oxidase alone. I would rather propose a reagent with a published ceiling than oversell one.
It pairs with catalase, and the reason is oxygen, not peroxide. Erv1p’s mechanism makes one H₂O₂ and consumes one O₂ per disulfide formed, since O₂ is the terminal acceptor that re-oxidizes the flavin. The peroxide is a byproduct of that step, not an intermediate on the way to the next disulfide, and uncatalyzed thiol oxidation by H₂O₂ is far slower than the GSSG and Erv1p routes already in the tube. So scavenging it removes a damage pathway, not oxidizing capacity.
The quantitative argument is better than that. At 98 µM of disulfides to form, Erv1p would consume about 98 µM of O₂ against roughly 230 µM dissolved at air saturation, around 43% of the pool. Catalase turns two H₂O₂ into two water and one O₂, returning about 49 µM. That halves the net oxygen cost. Which matters here specifically: Olsen showed RFopt yields under 2 g/L at 20% O₂ against 3.7 g/L at 100%, so oxygen is a scarce input in this system. Catalase does not just protect the lysate from peroxide, it gives back half the oxygen the oxidase borrowed.
One caveat I could not close: if the lysate’s peroxiredoxin or glutathione peroxidase systems are active, H₂O₂ could feed back into the GSSG pool, in which case scavenging it would cost some oxidant. I found no cell-free study measuring whether those pathways work in crude extract.
The rest of my reagent votes
I upvoted five reagents. Each one addresses a constraint this write-up identified somewhere in Part A, which is why I voted for them rather than for the chaperones at the top of the board.
Erv1p (suggested by Caleb Seward) is above: the only proposal that generates disulfides rather than rearranging them.
Skp, a periplasmic holdase chaperone (Sheila Ramani). It binds unfolded protein and reduces aggregation, and it was used with DsbC and glutathione to improve cell-free folding of v-tPA, the same nine-disulfide protein Reteplase is derived from. It complements DsbC rather than duplicating it.
Polyphosphate kinase (Shirish Goyal). This one addresses A2’s central finding directly. PEP regenerates ATP but liberates inorganic phosphate as it does, roughly 30 mM over a batch reaction, which inhibits transcription–translation and drops the pH nearly a full unit. PPK regenerates ATP from polyphosphate without releasing free orthophosphate. It is the energy system that avoids the failure mode A2 documents, at commodity cost.
Inorganic pyrophosphatase (Tamana Sisodiya). A1 establishes that magnesium is the most sensitive parameter in the system and that its optimum is narrow. T7 polymerase releases pyrophosphate with every nucleotide incorporated, and PPi sequesters Mg²⁺ as an insoluble precipitate. So this protects the one parameter A1 says cannot be ported or guessed, and it does so by removing an inhibitor that accumulates rather than one present at t=0. Target-agnostic across all three proteins, and fractions of a cent per well.
D-Pantethine (Mehmet Erkan Ozseyhan). This is the same logic RFopt applies to nucleotides, applied to cofactors. CoA costs about $104/mL and is among the most expensive small molecules in a PANOx-SP mix. Pantethine is its salvage-pathway precursor, converted by endogenous enzymes at 2 ATP per CoA instead of 3 ATP plus 1 CTP plus 1 cysteine. Buy the cheap precursor, let the lysate build the expensive molecule, which is exactly the move A2 describes for ribose and NMPs.
The pattern across all five: I voted for reagents that address a mechanism the data in Part A identified, and against ones that add folding capacity on the general principle that more folding help is better. FkpA leads the board at 26 votes and may well work, but its rationale is that it could be “an additional folding support,” which is a hypothesis about a direction rather than about a specific constraint.
B3. Forum access
Confirmed access to the cfps-coopetition channel on forum.htgaa.org.
Bonus idea posted: pairing a catalytic sulfhydryl oxidase with catalase, with the oxygen-recycling argument set out in B2. The short version is that catalase returns about half the O₂ an oxidase consumes, which matters in a system where Olsen measured yield more than doubling between 20% and 100% oxygen.
Part C: Asimov Kernel (optional)
Part C, the optional Asimov Kernel plasmid build, was not attempted for this submission.
Reflection
What I would do differently. All three designs are conservative in the same way: each changes two or three reagents against a reference backbone, and none of them leaves the neighborhood the reference plates already occupy. That was deliberate, because I wanted to be able to attribute a result. But Olsen’s finding that single-reagent additions almost never improved yield, and that improvement required simultaneous change, argues the other way. If I had a second round, I would spend it on one composition far enough out that failure would teach me little, rather than three close enough that success teaches me little.
AI use
I used Claude (Opus 5) throughout as a research and reasoning partner rather than a generator, and Claude Science for literature checks near the end. The work split roughly three ways: summarizing the assigned papers into a numeric reference I could query without reopening PDFs; deriving the designer’s volume formula and base buffer composition empirically from nL readouts and validating it against all six reference plates; and arguing through design choices.
Three errors are worth recording, because they bear on how useful the collaboration was and all three share a cause.
First, Claude initially argued from Jewett’s 2004 Table II that the reference plates were magnesium-starved and should move from 8.22 toward 14 mM. That was wrong, and the designer’s own tooltips said so. One striking table from a dialyzed 2004 extract had been weighted over six modern measurements in the exact lysate we are using. I caught it by checking the tooltip. That exchange became the closing argument of A1.
Second, Claude estimated Design 2 at $2.29 per well by extrapolating linearly from a measured DsbC cost delta. The designer reports $1.47.
Third, and the one that reached furthest into this write-up: Claude’s original argument for Erv1p rested on the glutathione pool being depleted by the product. Running a cross-check through Claude Science produced the division that kills it, 98 µM of demand against 4,040 µM of GSSG. That claim was load-bearing in both B2 and Design 3, and it had survived several rounds of review by me and by Claude before a second system caught it in one line.
All three come from reasoning off a model instead of reading the instrument or doing the arithmetic. The rule I take forward is to compute the order of magnitude before accepting any mechanism, and to prefer the platform’s own readouts over inference whenever both exist.
The useful contributions ran the other way: establishing that DsbC is roughly 83% of reagent cost by toggling it to zero and reading the delta; establishing that the Mix and reference cost columns use different bases by loading an unmodified RFopt and finding it priced 37x above its own reference row; and catching the 97% similarity score on my first Reteplase submission in time to redesign it. Using two AI systems against each other was more productive than either alone, since the second had no stake in the first’s reasoning.
One friction point worth recording. Partway through, a question about glutathione redox potential and disulfide bond formation was flagged by Claude’s safety classifiers and the session paused, offering to retry on an earlier model. The notice stated that the safeguards are intentionally broad and can flag legitimate coding, cybersecurity and biology tasks. Nothing about the question was unusual for this assignment: it concerned the oxidation state of a buffer in a cell-free reaction, which is the subject of the homework. The interruption cost a few minutes and changed no conclusion, but it is a genuine constraint on using these tools for biology coursework, and worth measuring if the teaching team is studying how students and AI systems actually work together. A student closer to a deadline, or less sure their question was reasonable, might have abandoned the line of inquiry rather than retrying.
Appendix: Calculations
A. The volume formula
Every reagent volume follows from dilution, C₁V₁ = C₂V₂, adjusted for what the base buffer already contributes:
Result snapped to the nearest 25 nL, because the Echo 525 acoustic dispenser transfers in 25 nL droplets.
Volume budget:
| Component | nL |
|---|---|
| Total reaction | 20,000 |
| Cell lysate (fixed) | 5,000 |
| DNA template (fixed) | 2,000 |
| Base buffer, 10X (fixed) | 2,000 |
| Designable | 11,000 |
A negative water value means the composition does not fit in 20 µL.
Base buffer contribution (2,000 nL of 10X into 20,000 nL gives 1X final), which is why some reagents show a target concentration at 0 nL added:
HEPES 30 mM · K(Glu) 200 mM · Mg(Glu)₂ 2.6 mM · amino acids 1 mM · tyrosine 1 mM · cysteine 1 mM
B. Worked examples, one per reagent type
Salt above base buffer (Design 1, K(Glu) target 345 mM, stock 875 mM, base 200 mM):
Reagent absent from base buffer (Design 3, PEP target 30 mM, stock 100 mM):
This single reagent takes 6,000 / 11,000 = 55% of the designable budget, which is why Design 3 has so little room to differentiate itself.
Reagent already at base concentration (tyrosine, target 1 mM, base 1 mM):
Enzyme in activity units (Design 1, catalase target 187.5 U/mL, stock 50,000 U/mL):
Protein in µM (Design 3, DsbC target 2.5 µM, stock 100 µM):
Reagent in mg/mL (Design 3, folinic acid target 0.025 mg/mL, stock 10 mg/mL):
C. Volume closure for all three designs
| Design | Σ reagents (nL) | Water (nL) | Total (nL) |
|---|---|---|---|
| 1, sfGFP | 9,925 | 1,075 | 11,000 |
| 2, PETase | 10,075 | 925 | 11,000 |
| 3, Reteplase | 10,700 | 300 | 11,000 |
D. Reagent cost
DsbC at the reference 5 µM, stock price $5,632/mL, volume 1,000 nL:
$5,632/mL × 1,000 nL × 10⁻⁶ = $5.63 per well
Verified empirically by toggling DsbC to zero in the designer: $6.79 with it, $1.16 without, a delta of $5.63. DsbC is therefore 83% of that composition’s reagent cost.
Caution: calculated totals did not reproduce the designer’s figures. My estimate for Design 2 was $2.29; the designer reports $1.47. The delta for a single reagent matched exactly, so differences are valid, but absolute totals should be read off the tool, not computed.
| Design | Measured $/20 µL | Measured $/mL |
|---|---|---|
| 1, sfGFP | $0.12 | $5.17 |
| 2, PETase | $1.47 | $73.29 |
| 3, Reteplase | $3.51 | $175.71 |
E. Glutathione redox potential
For the half-reaction 2 GSH ⇌ GSSG + 2H⁺ + 2e⁻, the Nernst equation gives:
GSH is squared because two molecules are consumed per disulfide. At 30 °C (303.15 K):
Taking E°′(GSSG/2GSH) ≈ −240 mV, with concentrations in M:
| Condition | [GSSG] | [GSH] | [GSSG]/[GSH]² (M⁻¹) | E (mV) | ΔE |
|---|---|---|---|---|---|
| Reference plates | 4.04 mM | 1.0 mM | 4,040 | −131.6 | — |
| Design 3 | 8.08 mM | 1.0 mM | 8,080 | −122.5 | +9.1 |
| Halving GSH instead | 4.04 mM | 0.5 mM | 16,160 | −113.5 | +18.1 |
Consequence: the ratio alone does not determine the potential. 8 mM / 1 mM and 4 mM / 0.5 mM are both “8:1” and differ by 9 mV. Halving GSH is the stronger lever per unit volume and would have freed 100 nL rather than costing 475. I did not take it, for the mechanistic reason given in Design 3.
F. Oxidizing equivalents required
This is the calculation that retracted the “the product depletes the pool” claim in an earlier draft of B2. Even ten times more synthesized protein (981 µM) would consume only 24% of the pool.
Free cysteine as a competing sink. Thiol-disulfide exchange runs 2 RSH + GSSG → RSSR + 2 GSH, so 1 mM cysteine consumes 0.5 mM GSSG:
Ten times the protein’s own demand, which is why cysteine and not the product is the relevant stoichiometric competitor.
G. Oxygen budget for Erv1p
Erv1p forms one disulfide per catalytic cycle, consuming one O₂ and producing one H₂O₂:
So catalase halves the oxygen cost of running an oxidase.
H. DsbC mass-to-molar conversion
DsbC is a homodimer of 23.4 kDa subunits. Converting the one reproducible published working concentration:
Published practice therefore sits at roughly 2 to 4 µM. The reference plates use 5 µM. Design 3 at 2.5 µM lands on the dimer value; Design 2 at 1 µM is below the published floor.
Values used but not verified against a primary source this session
Air-saturated dissolved O₂ at 30 °C (230 µM), E°′(GSSG/2GSH) (−240 mV), and DsbC subunit mass (23.4 kDa) are standard reference values. The Erv1p 1:1 O₂-per-disulfide stoichiometry assumes no uncoupled flavin oxidation; real flavoenzymes leak somewhat, which would increase peroxide output and strengthen rather than weaken the case for catalase.
References
[1] Jewett, M. C., & Swartz, J. R. (2004). Mimicking the Escherichia coli cytoplasmic environment activates long-lived and efficient cell-free protein synthesis. Biotechnology and Bioengineering, 86(1), 19–26. https://doi.org/10.1002/bit.20026
[2] Olsen, M. L., Copeland, C. E., Sundberg, C. A., Aw, R., Shaver, Z. M., Rao, G., Swartz, J. R., Karim, A. S., & Jewett, M. C. (2026). Design-driven optimization of low-cost reagent formulations for reproducible and high-yielding cell-free gene expression. Nature Communications, 17, 3478. https://doi.org/10.1038/s41467-026-69605-8
[3] Smith, A. A., et al. (2026). Using a GPT-5-driven autonomous lab to optimize the cost and titer of cell-free protein synthesis. bioRxiv. https://doi.org/10.64898/2026.02.05.703998
[4] Silverman, A. D., Karim, A. S., & Jewett, M. C. (2020). Cell-free gene expression: an expanded repertoire of applications. Nature Reviews Genetics, 21, 151–170. https://doi.org/10.1038/s41576-019-0186-3
[5] Rasor, B. J., Vögeli, B., Landwehr, G. M., Bogart, J. W., Karim, A. S., & Jewett, M. C. (2021). Toward sustainable, cell-free biomanufacturing. Current Opinion in Biotechnology, 69, 136–144. https://doi.org/10.1016/j.copbio.2020.12.012
Reference plate yields, reagent costs and designer guidance are from the HTBAA CFPS coopetition platform and the Ginkgo coopetition specification document.