Hi! I’m Gonzalo Povea, a biomedical engineer from Lima, Peru 🇵🇪, trained at Universidad Peruana Cayetano Heredia (UPCH) and Pontificia Universidad Católica del Perú (PUCP). My work sits at the intersection of engineering, medicine, and design, with a focus on extended reality, medical imaging, 3D printing, and digital fabrication.
Currently, I work as Head Engineer at the Morphological Sciences Innovation Center of UPCH, where I manage the virtual anatomy classroom and coduct innovation and investigation projects related to improve education in anatomy.
I have a strong interest in cancer research 🔬, particularly in diffuse large B-cell lymphoma, a disease that a close family member went through. In Peru, opportunities and resources for biomedical research are limited, and so far I have not had the chance to work directly in this field. This course is my way to start: learning how living systems, automation, and fabrication come together, and exploring how accessible tools like desktop 3D printers and open-source lab automation could make cancer research more feasible in resource-limited settings.
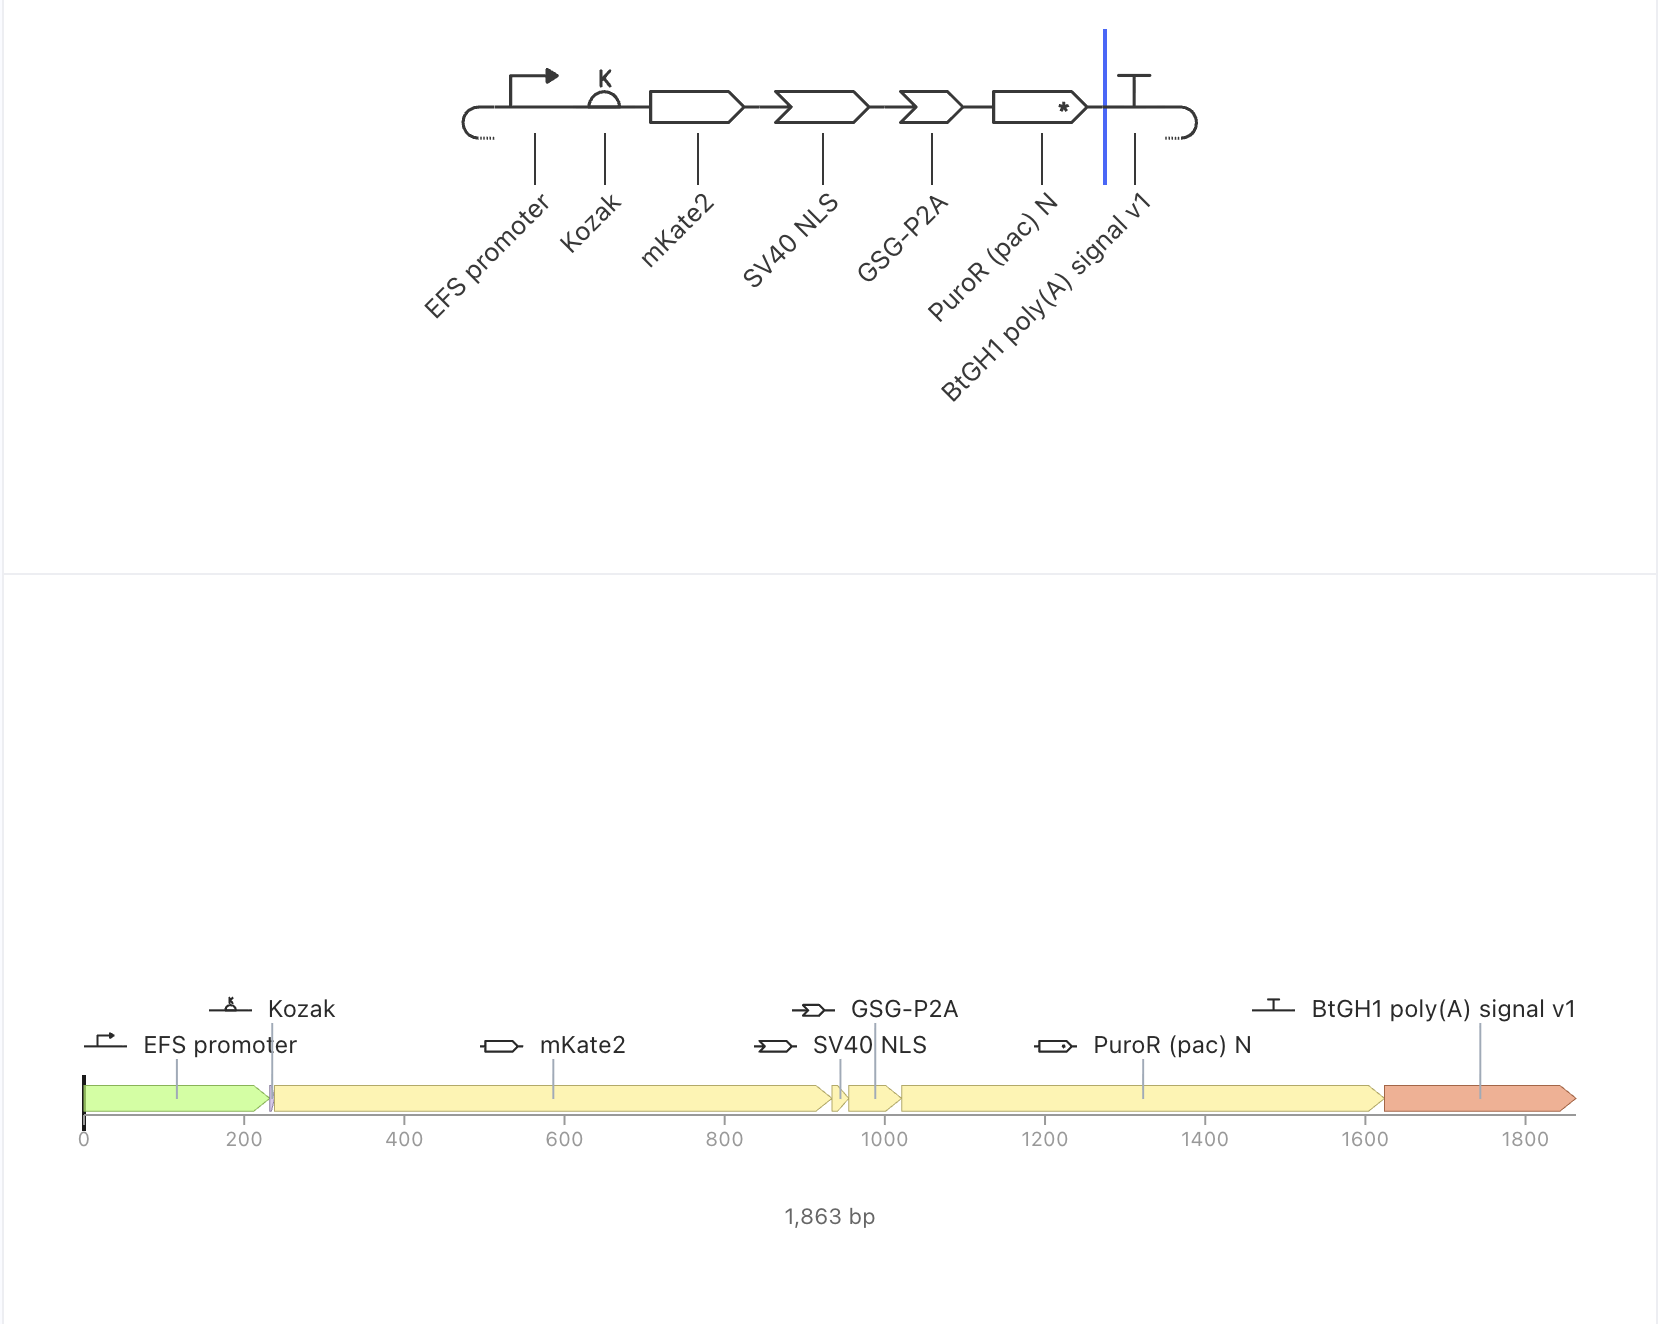
I joined the HTGAA 2026 workspace in Kernel and created the folder Povea-DLBCL-reporter, which holds six parts and one assembled construct, pLenti-EFS-mKate2NLS-P2A-Puro.
Part 1: Define your expression target
What molecule am I expressing?
My Homework #1 product is a tissue model rather than a molecule: standardized 3D DLBCL microtumors encapsulated in hydrogel for automated drug screening. The DNA that makes that product possible is therefore the DNA that makes it measurable. I am expressing two proteins from a single transcript:
mKate2, a monomeric far-red fluorescent protein, as a constitutive nuclear reporter
PAC (puromycin N-acetyltransferase), the selection marker that isolates a pure, stable reporter line
The readout bottleneck I identified in Homework #1 was automated imaging of cells inside a hydrogel. A constitutive fluorescent reporter lets every microtumor be segmented and quantified without endpoint dyes, which is what makes the screen automatable at all.
What is the sequence?
Element
Length
Source
mKate2
232 aa · 696 bp CDS (no stop)
Protein from FPbase DBBO8; Shcherbo et al. (2009) Biochem J 418:567–574. Derived from eqFP578 of the sea anemone Entacmaea quadricolor. Ex 588 / Em 633 nm.
PAC
199 aa · 600 bp CDS
UniProt P13249, pac gene of Streptomyces alboniger; DNA from GenBank/ENA M25346.1 (Lacalle et al. 1989, Gene 79:375–380)
Neither protein is a de novo design; both are standard reused parts. The mKate2 DNA, however, is not a copied sequence: I back-translated the FPbase protein using Homo sapiens codon preferences and verified computationally that it translates back to the FPbase protein exactly. This matters for Part 4, where it produces a deliberately different search result from PuroR.
What host or chassis?
SU-DHL-4, a human DLBCL cell line of the germinal-center B-cell (GCB) subtype — the same chassis proposed in Homework #1. Two properties of this host drive almost every part choice that follows:
It grows in suspension and is difficult to transfect chemically, so delivery is by third-generation self-inactivating (SIN) lentiviral transduction. This is why the backbone is a lentiviral transfer plasmid rather than a simple expression plasmid, and it is the constraint that recurs throughout Part 4.
It is a lymphoid cell, which is why the promoter is EF1α rather than CMV — CMV promoters are frequently silenced in hematopoietic lineages.
Where does the product need to go?
The nucleus, via a short SV40 NLS on the mKate2 C-terminus. Nothing is secreted, so there is no signal peptide.
The targeting decision is the one I would most defend. In a dense 3D microtumor of thousands of cells, a cytoplasmic reporter merges into a continuous mass that cannot be segmented into individual cells. Nuclei remain discrete, roughly spherical objects, which is what automated segmentation requires. Nuclear labelling also makes apoptotic nuclear fragmentation directly visible — and apoptosis is the endpoint the drug screen measures. PAC carries no targeting sequence and remains cytoplasmic, which is where it must be to acetylate puromycin.
Part 2: Design your genetic parts
Layer
Part
Type
Length
Source
Transcription start
EFS promoter
Promoter
232 bp
Short intron-less human EF1α promoter, pUltra/pLenti family
Translation start
Kozak
5’ UTR with Kozak
6 bp
Designed (consensus GCCACC)
Coding sequence 1
mKate2
CDS (+start −stop)
696 bp
FPbase DBBO8, back-translated for H. sapiens
Targeting
SV40 NLS
Peptide CDS (−start −stop)
21 bp
Designed (canonical SV40 NLS, PKKKRKV)
Linker
GSG-P2A
Peptide CDS (−start −stop)
66 bp
iGEM Registry BBa_K4094004; Kim et al. 2011 PLoS ONE 6:e18556
Coding sequence 2
PuroR (pac)
CDS (+start +stop)
603 bp
UniProt P13249 / ENA M25346.1
Transcription stop
BtGH1 poly(A)
3’ UTR
239 bp
Kernel library — bovine growth hormone poly(A) signal
One sentence of justification each
EFS promoter. Strong, constitutive, and resistant to silencing in hematopoietic cells, where CMV is frequently shut off; the short intron-less form was chosen over full-length EF1α to limit cargo size, since lentiviral titer falls as the insert grows.
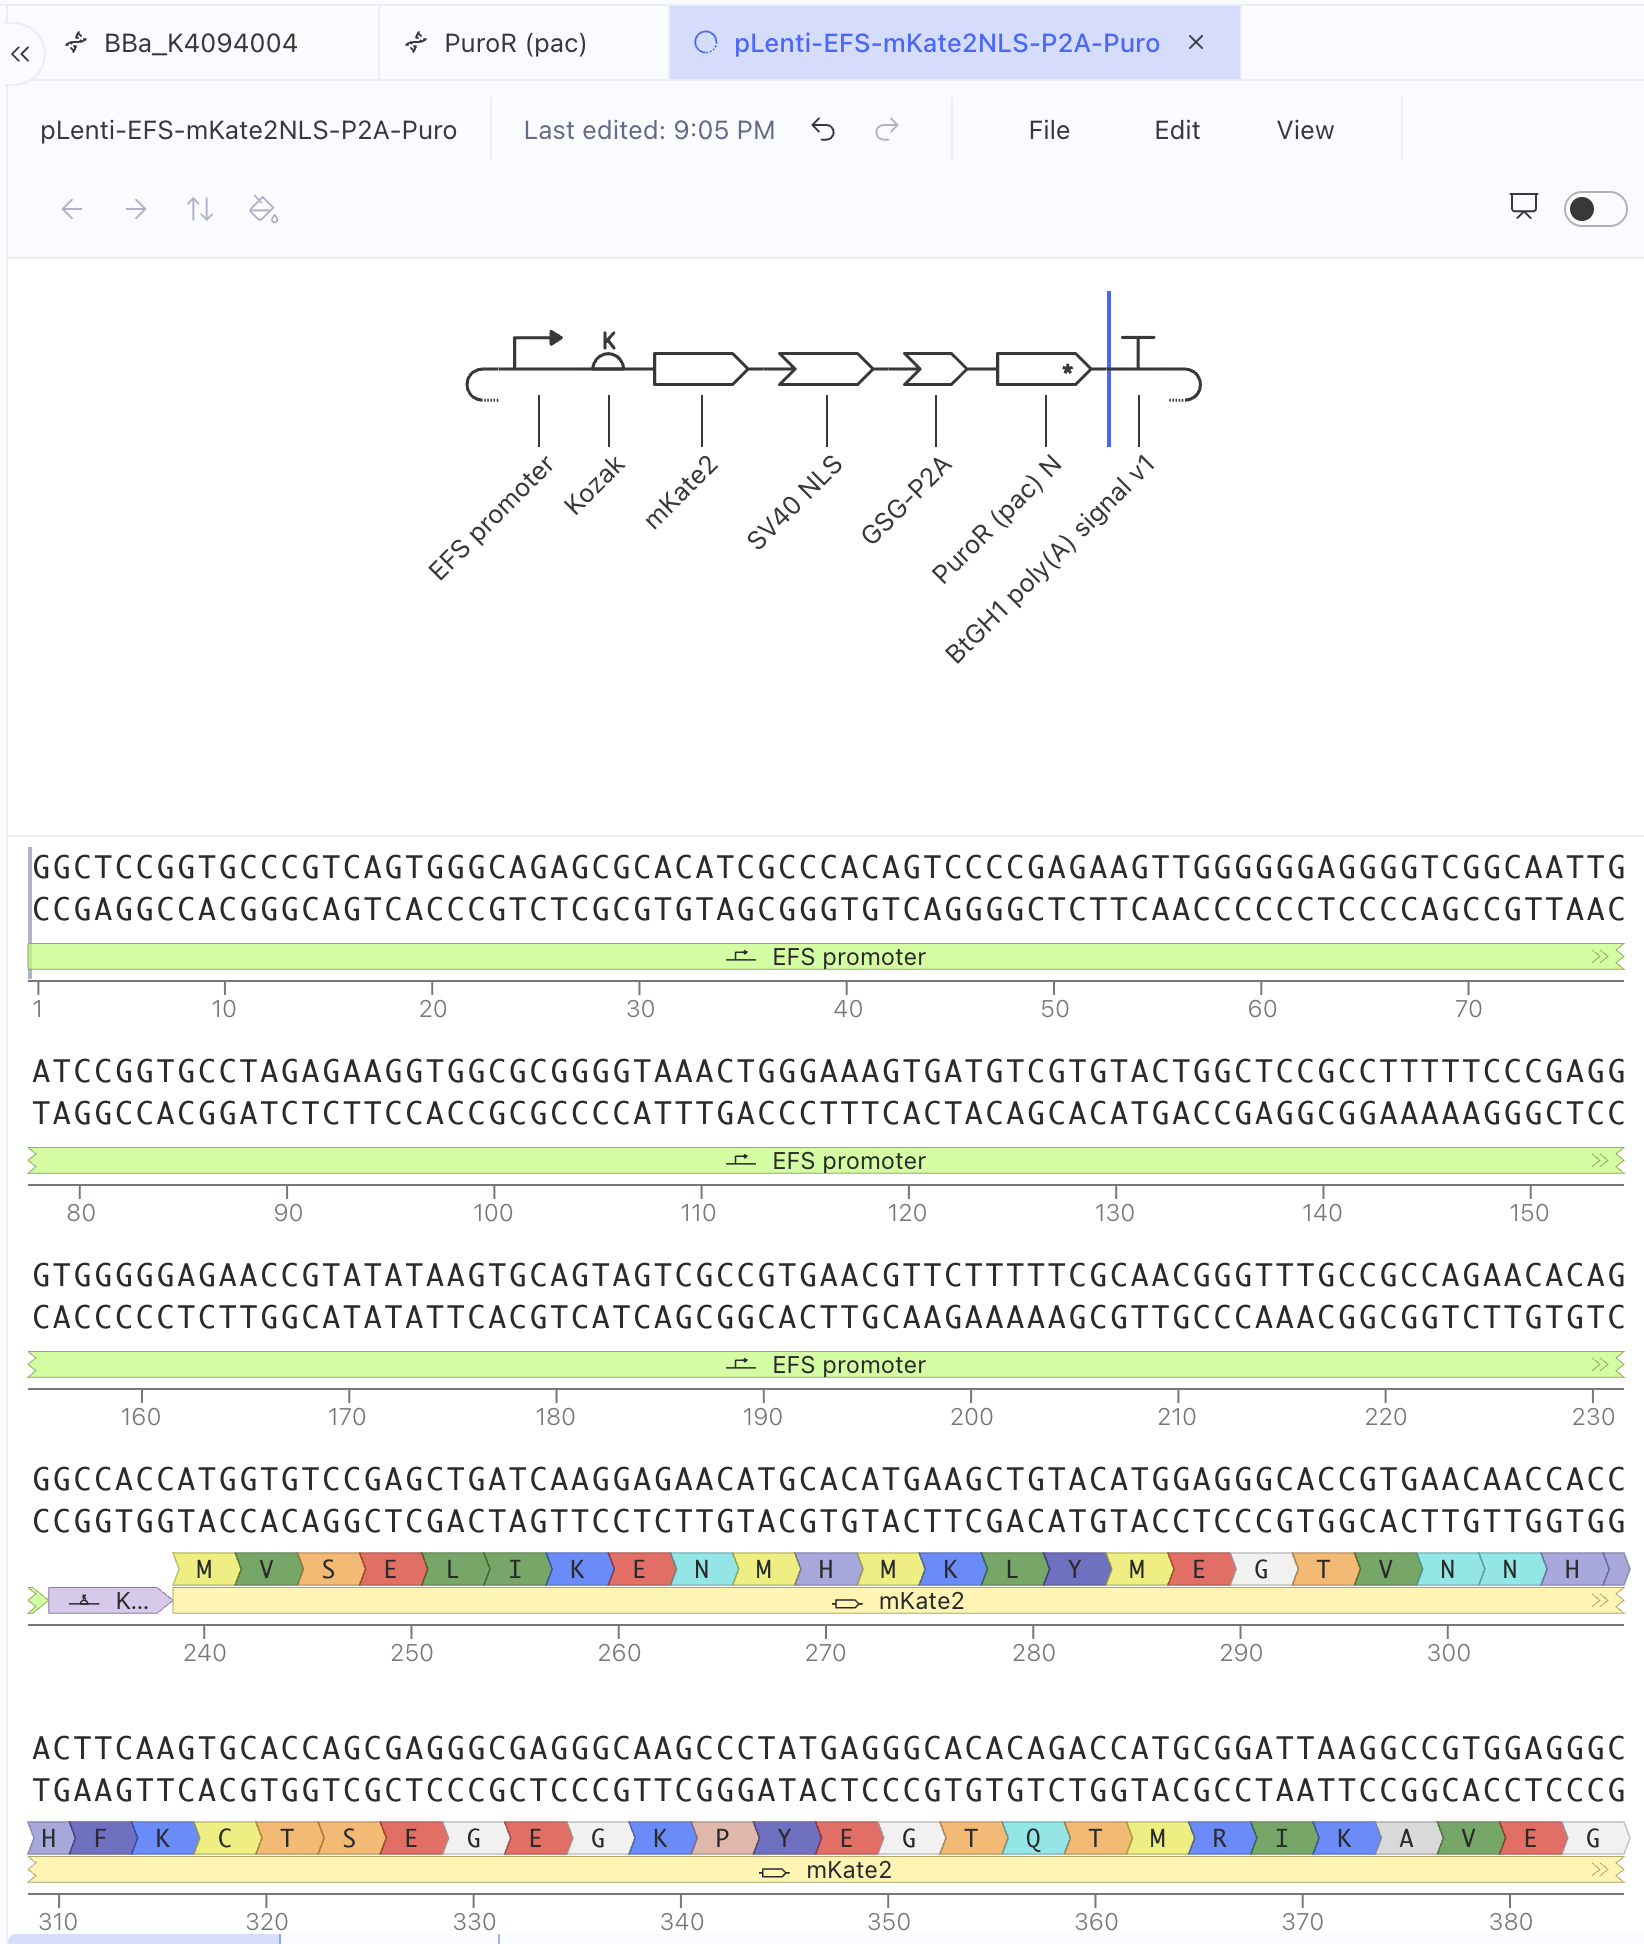
Kozak. The consensus GCCACC gives efficient, correct translation initiation; because the mKate2 CDS begins ATGGTG, the assembled context is GCCACCATGG, with a G at position +4 — the optimal configuration.
mKate2. Far-red emission (588/633 nm) avoids the green autofluorescence of hydrogel and culture medium; it is monomeric, so no aggregation artifacts in dense 3D aggregates; and unlike luciferase it needs no substrate added per read, which is what makes it compatible with an automated imaging pipeline.
SV40 NLS. Directs the reporter to the nucleus so cells appear as discrete segmentable objects in dense 3D tissue, and makes apoptotic nuclear fragmentation visible.
GSG-P2A. A single transcript yields mKate2-NLS and PuroR at fixed 1:1 stoichiometry, which is cleaner than an IRES, where the downstream cistron is expressed weakly and variably; the GSG linker improves cleavage efficiency.
PuroR. Placed downstream of the P2A, so every cell surviving puromycin selection must have translated the entire cassette, including the reporter — this guarantees a pure reporter line without needing a cell sorter.
BtGH1 poly(A). Supplies the transcription stop and polyadenylation signal required for a mammalian expression cassette. See Part 4 for why this element is correct for the checker but wrong for the real vector.
Backbone (reused, not designed)
A third-generation SIN lentiviral transfer plasmid of the pLenti/pUltra family (e.g. Addgene #17448). It provides the 5’ LTR, the ψ packaging signal, RRE, cPPT, and the ΔU3 self-inactivating 3’ LTR — whose R-U5 region supplies polyadenylation for the integrated provirus — plus a bacterial origin and AmpR for propagation in E. coli. Kernel’s parts library contains no lentiviral LTR sequence (searching “LTR” returns only unrelated Xenopus and Lactococcus proteins), so the backbone is described rather than assembled, following the assignment’s allowance to reuse an existing backbone and state what it provides.
A note on WPRE. I considered including the woodchuck hepatitis virus posttranscriptional regulatory element, which typically raises transgene expression 2–5 fold in lentiviral vectors, but omitted it. It is the only repetitive, structured viral element that would appear in the cassette and therefore the hardest to synthesize; it would add a second biosecurity flag; and the standard WPRE contains a partial WHV X ORF whose truncated product has raised oncogenicity questions — an unnecessary confounder in a cancer-biology reporter line. If reporter brightness proves insufficient, adding WPRE (preferably a WPRE3 variant with the X ORF disabled) is the first modification I would test.
Assembled length: 1,863 bp, cloned between the LTRs of the lentiviral backbone for a total transfer plasmid of roughly 9 kb.
Checks reported from Kernel
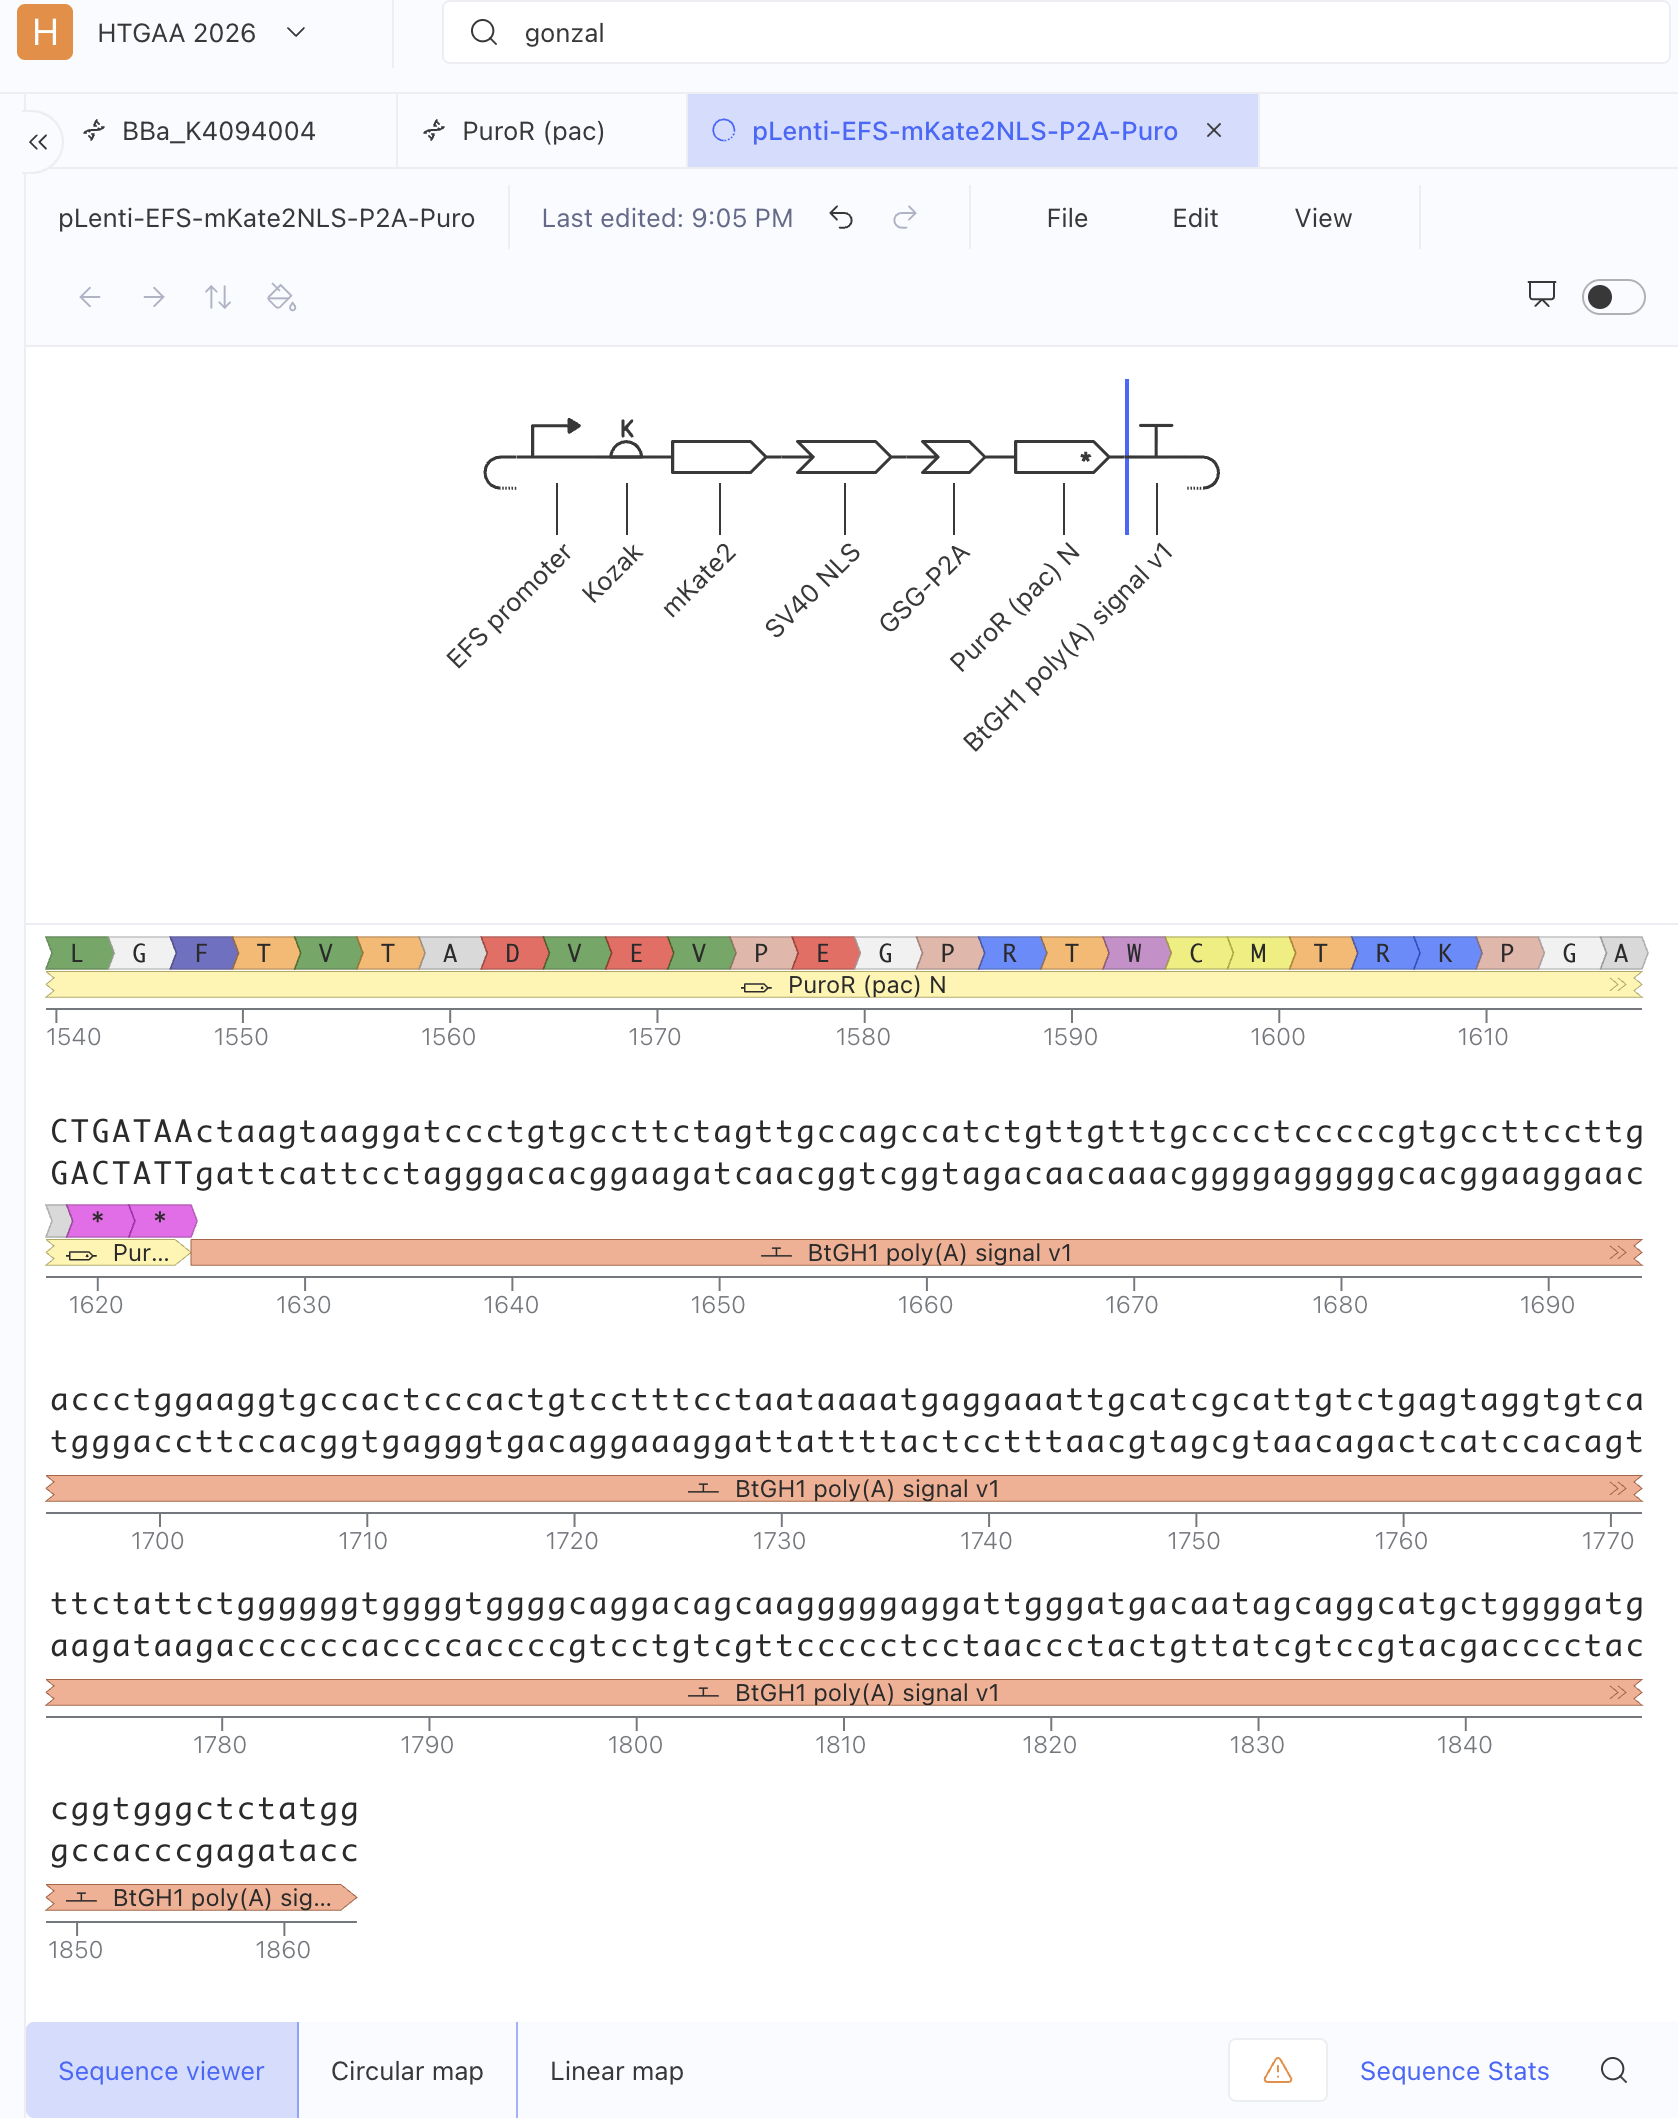
Reading frame intact. The ORF runs 1,386 bp from the Kozak ATG through the NLS and P2A to the PuroR stop — 462 codons, divisible by three.
Start and stop where expected. Translation begins at GCCACC ATG GTG TCC → M V S E L, and ends at TGATAA.
No accidental internal stops. Kernel’s sequence viewer shows continuous translation across all four coding elements, reading MVSELIKENMHM… through …LPSKLGHR (mKate2), then PKKKRKV (NLS), GSGATNFSLLKQAGDVEENPGP (P2A), and MTEYKPTVRL… through …PRTWCMTRKPGA (PAC).
Orientation confirmed on the rendered linear map: all seven elements sit in the intended order, all forward.
Two errors the assembly process caught
Building the construct surfaced two defects that were not visible while designing parts in isolation.
First, my Kozak part initially carried its own ATG (GCCACCATG) while the mKate2 CDS also began with ATG, producing a tandem ATGATG and a spurious N-terminal methionine. The reading frame survived — three extra bases is one codon — but the protein was wrong. I trimmed the Kozak part to GCCACC and let the CDS supply the start codon.
Second, and more interesting, my original design placed a bGH poly(A) inside the cassette in the forward orientation. In a lentiviral transfer plasmid this is a real error: an internal forward-orientation poly(A) prematurely terminates the full-length vector genomic RNA during packaging and sharply reduces titer. Third-generation vectors rely on the 3’ LTR instead. Part 4 describes how Kernel’s checker forced this question back open.
Part 4: Optimize and quality-check
Construct Checker
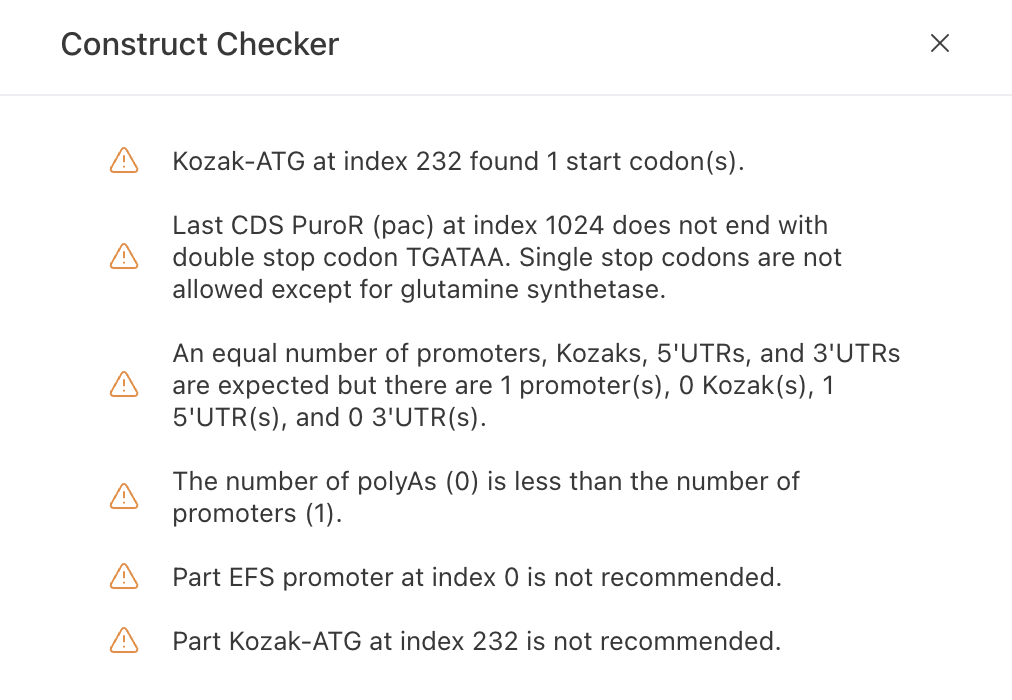
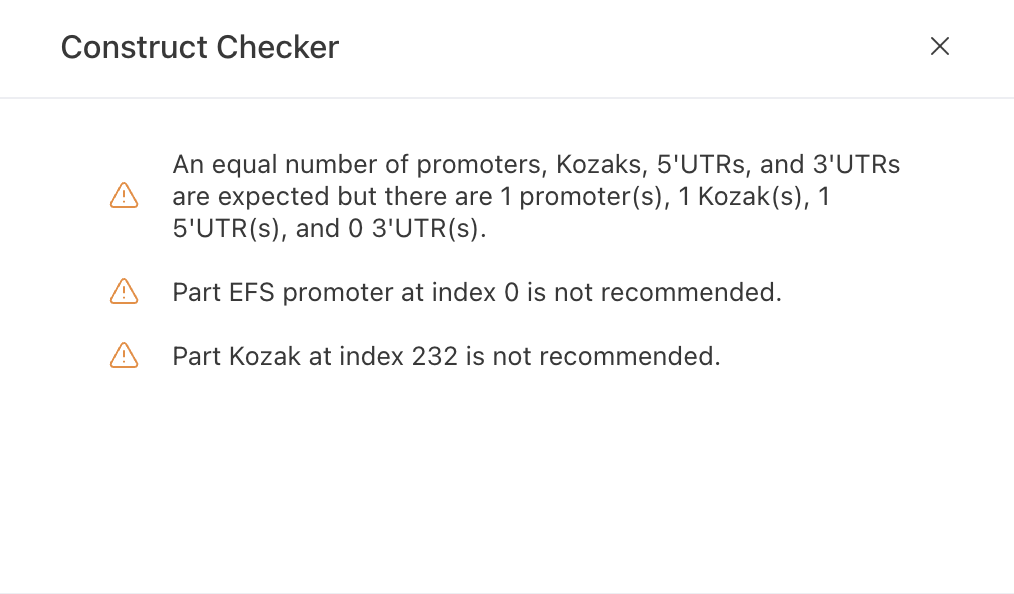
The first run returned six warnings. Three were real and I fixed them: the duplicated start codon described above; a PuroR CDS ending in a single TGA, which permits translational readthrough, extended to the double stop TGATAA; and the absence of any polyadenylation element, resolved by adding BtGH1 poly(A). The rerun returned three warnings.
I judged all three remaining warnings to be expected rather than defects. The checker requires an equal number of promoters, Kozaks, 5’UTRs and 3’UTRs, but that is a generic expression-cassette grammar rather than a biological requirement: a minimal mammalian cassette needs no discrete 3’UTR, and the bGH fragment already supplies untranslated sequence plus the AATAAA signal. Adding a 3’UTR purely to satisfy a counter would introduce an element I could not justify. The remaining two mark the EFS promoter and Kozak as “not recommended” simply because they are user-created rather than drawn from Kernel’s curated library; both are standard sequences, and the EFS matches the length of Kernel’s own “Short HsEef1a1 promoter” entry.
More importantly, the checker cannot see the vector context. It required a poly(A) signal, which I supplied, but in a third-generation lentiviral transfer plasmid an internal forward-orientation poly(A) truncates the vector genomic RNA during packaging. In the real build this element would be omitted or inverted, and polyadenylation would come from the R-U5 region of the SIN 3’ LTR. The checker’s rule is correct for a standard plasmid and wrong for this vector class — which is exactly why these tools inform a design rather than dictate it.
Codon optimization
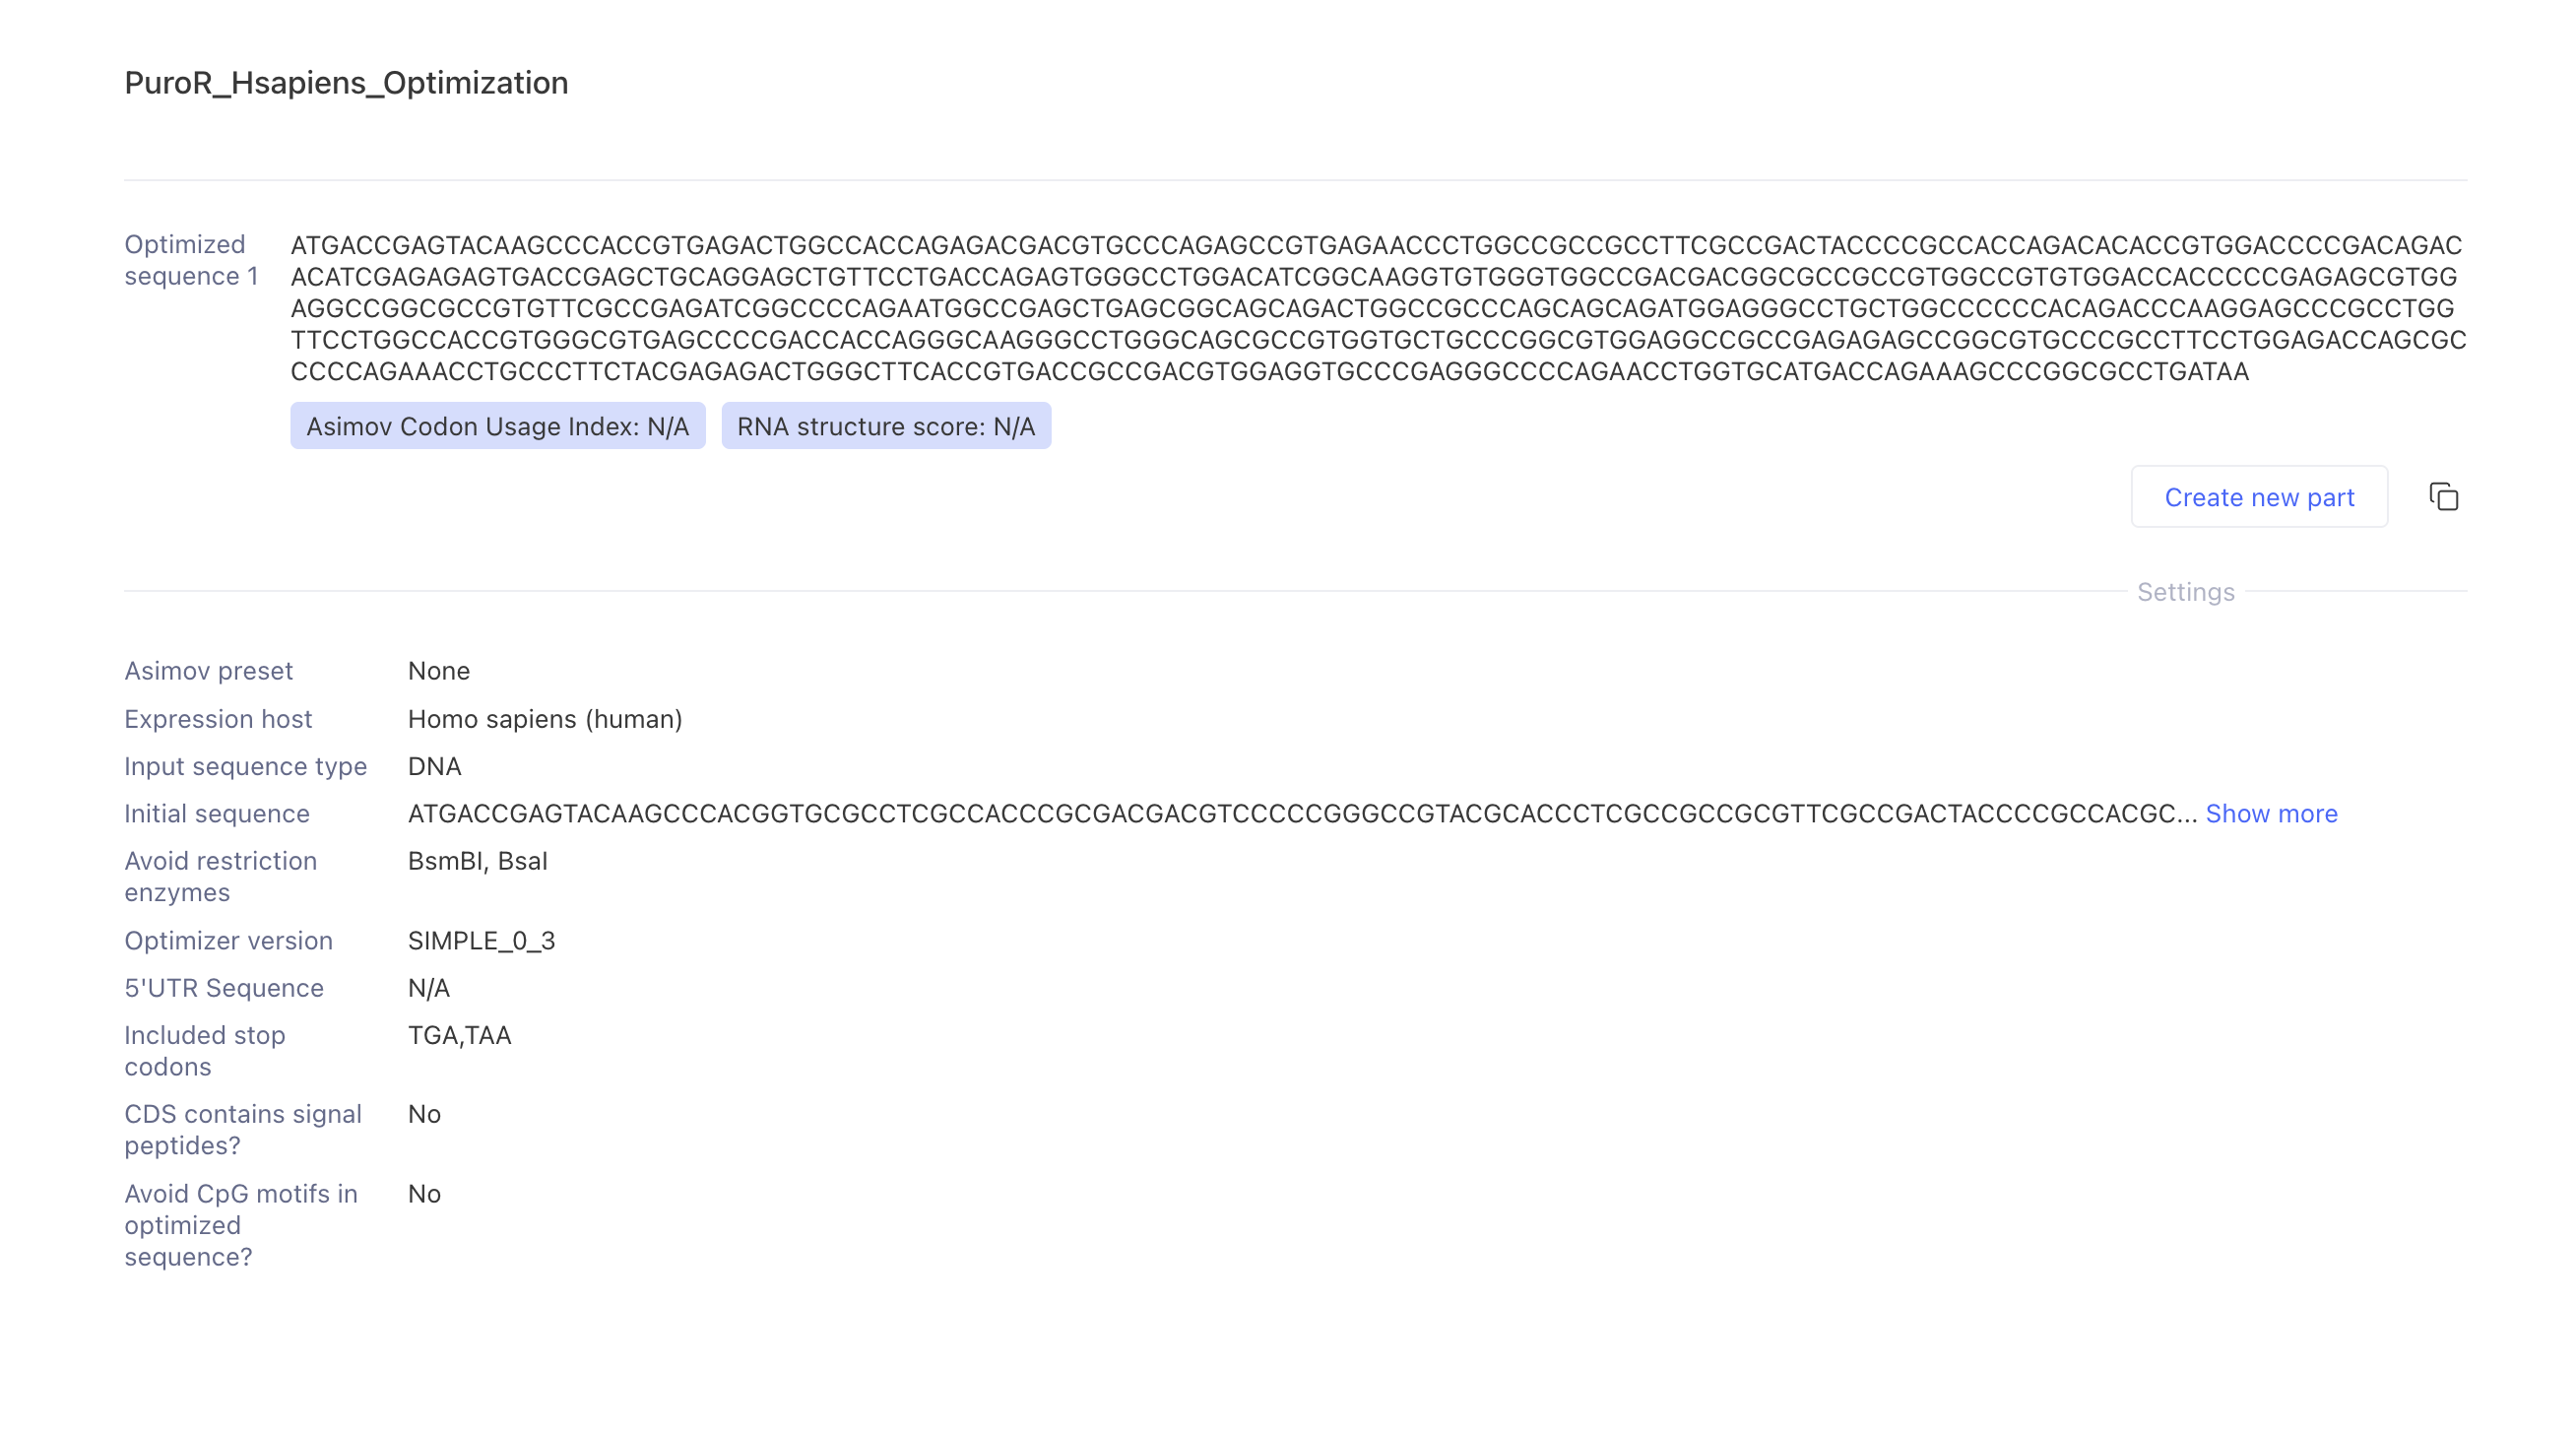
I optimized the PuroR CDS for Homo sapiens using Kernel’s Simple v0.3 optimizer, with BsmBI and BsaI as forbidden sites and TGA+TAA as included stop codons. The optimizer returned a 603 bp sequence encoding an identical 199 aa protein, confirming the recoding was synonymous, and correctly appended the second stop codon to give TGATAA.
I had expected GC content to fall sharply, since native pac comes from Streptomyces alboniger, a high-GC actinobacterium. It fell only from 73.3% to 69.8%, far outside my stated 45–60% target. Examining the amino acid composition explains why: PAC is 14% alanine, 11% valine, 8.5% proline and 8% glycine, and the preferred human codons for these residues (GCC, GTG, CCC, GGC) are themselves 2/3 to 3/3 GC. Eighty percent of PAC’s residues have a preferred human codon of at least 2/3 GC. If every residue used its single most-frequent human codon, GC would still be 70.4% — and the optimizer returned 69.8%, essentially that floor.
The useful conclusion is that two of my constraints are in direct conflict for this protein. Codon adaptation and GC targeting cannot both be satisfied, because amino acid composition sets a lower bound on GC that no synonymous recoding can cross. Lowering GC further would require deliberately choosing rare codons, defeating the purpose of optimization. For this cassette I would keep codon adaptation and drop the GC constraint, noting that high GC raises synthesis cost and difficulty rather than harming expression. Kernel reported the Asimov Codon Usage Index and RNA structure score as N/A for this optimizer version, so the GC figures above are my own calculation from the returned sequence.
Sequence search
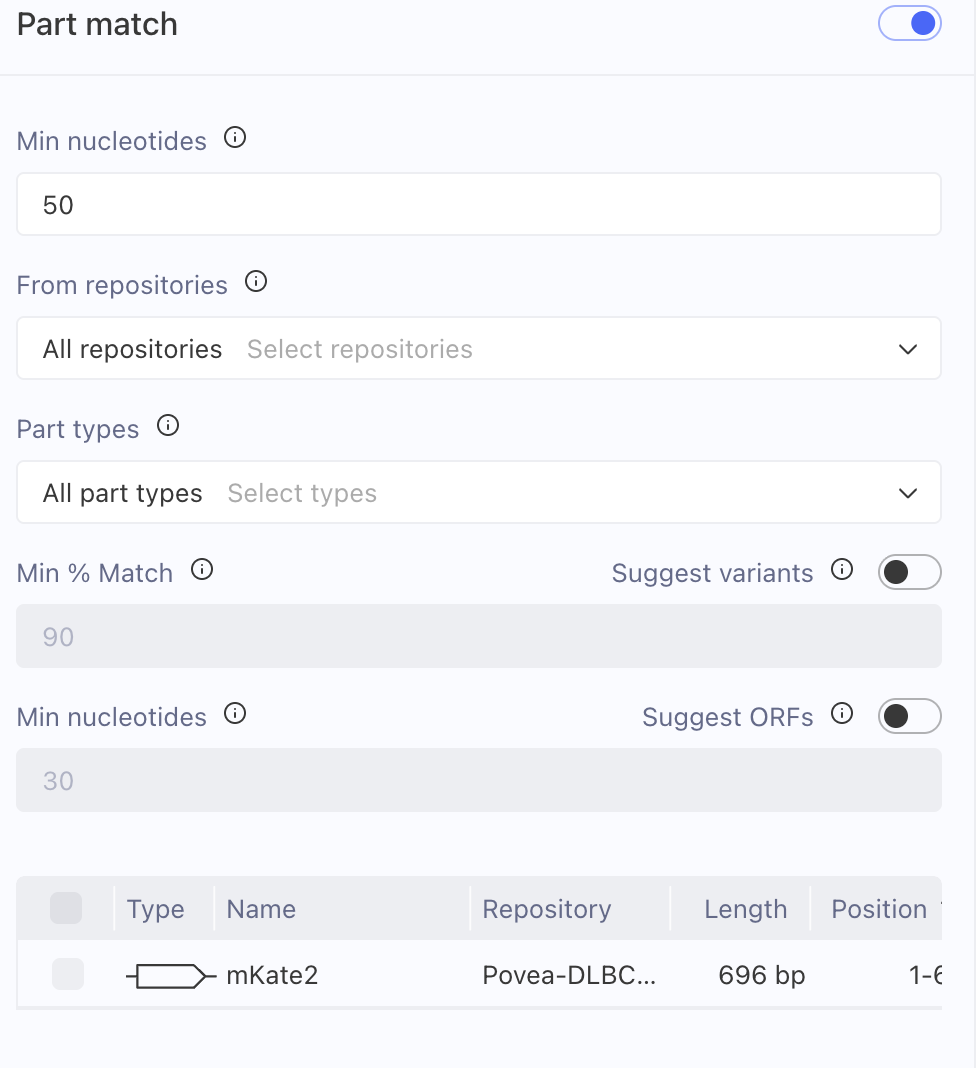
Kernel’s Toolbox offers no BLAST-style database search; it provides pairwise alignment and an automatic part-matching function that compares a sequence against Kernel’s repositories and the iGEM Registry. I used part matching as the closest available equivalent, searching all repositories and all part types. At the default 7-nucleotide threshold the search returns only noise — dozens of 7 bp coincidental hits to unrelated iGEM parts — so I raised the minimum match length to 50 nucleotides.
At that threshold the mKate2 CDS returned a single hit: itself, in my own repository. No external repository contains this sequence. That is the expected and correct result, because the CDS was back-translated from the FPbase DBBO8 protein using human codon preferences — novel at the nucleotide level while encoding a known protein whose closest natural relative is eqFP578 from Entacmaea quadricolor.
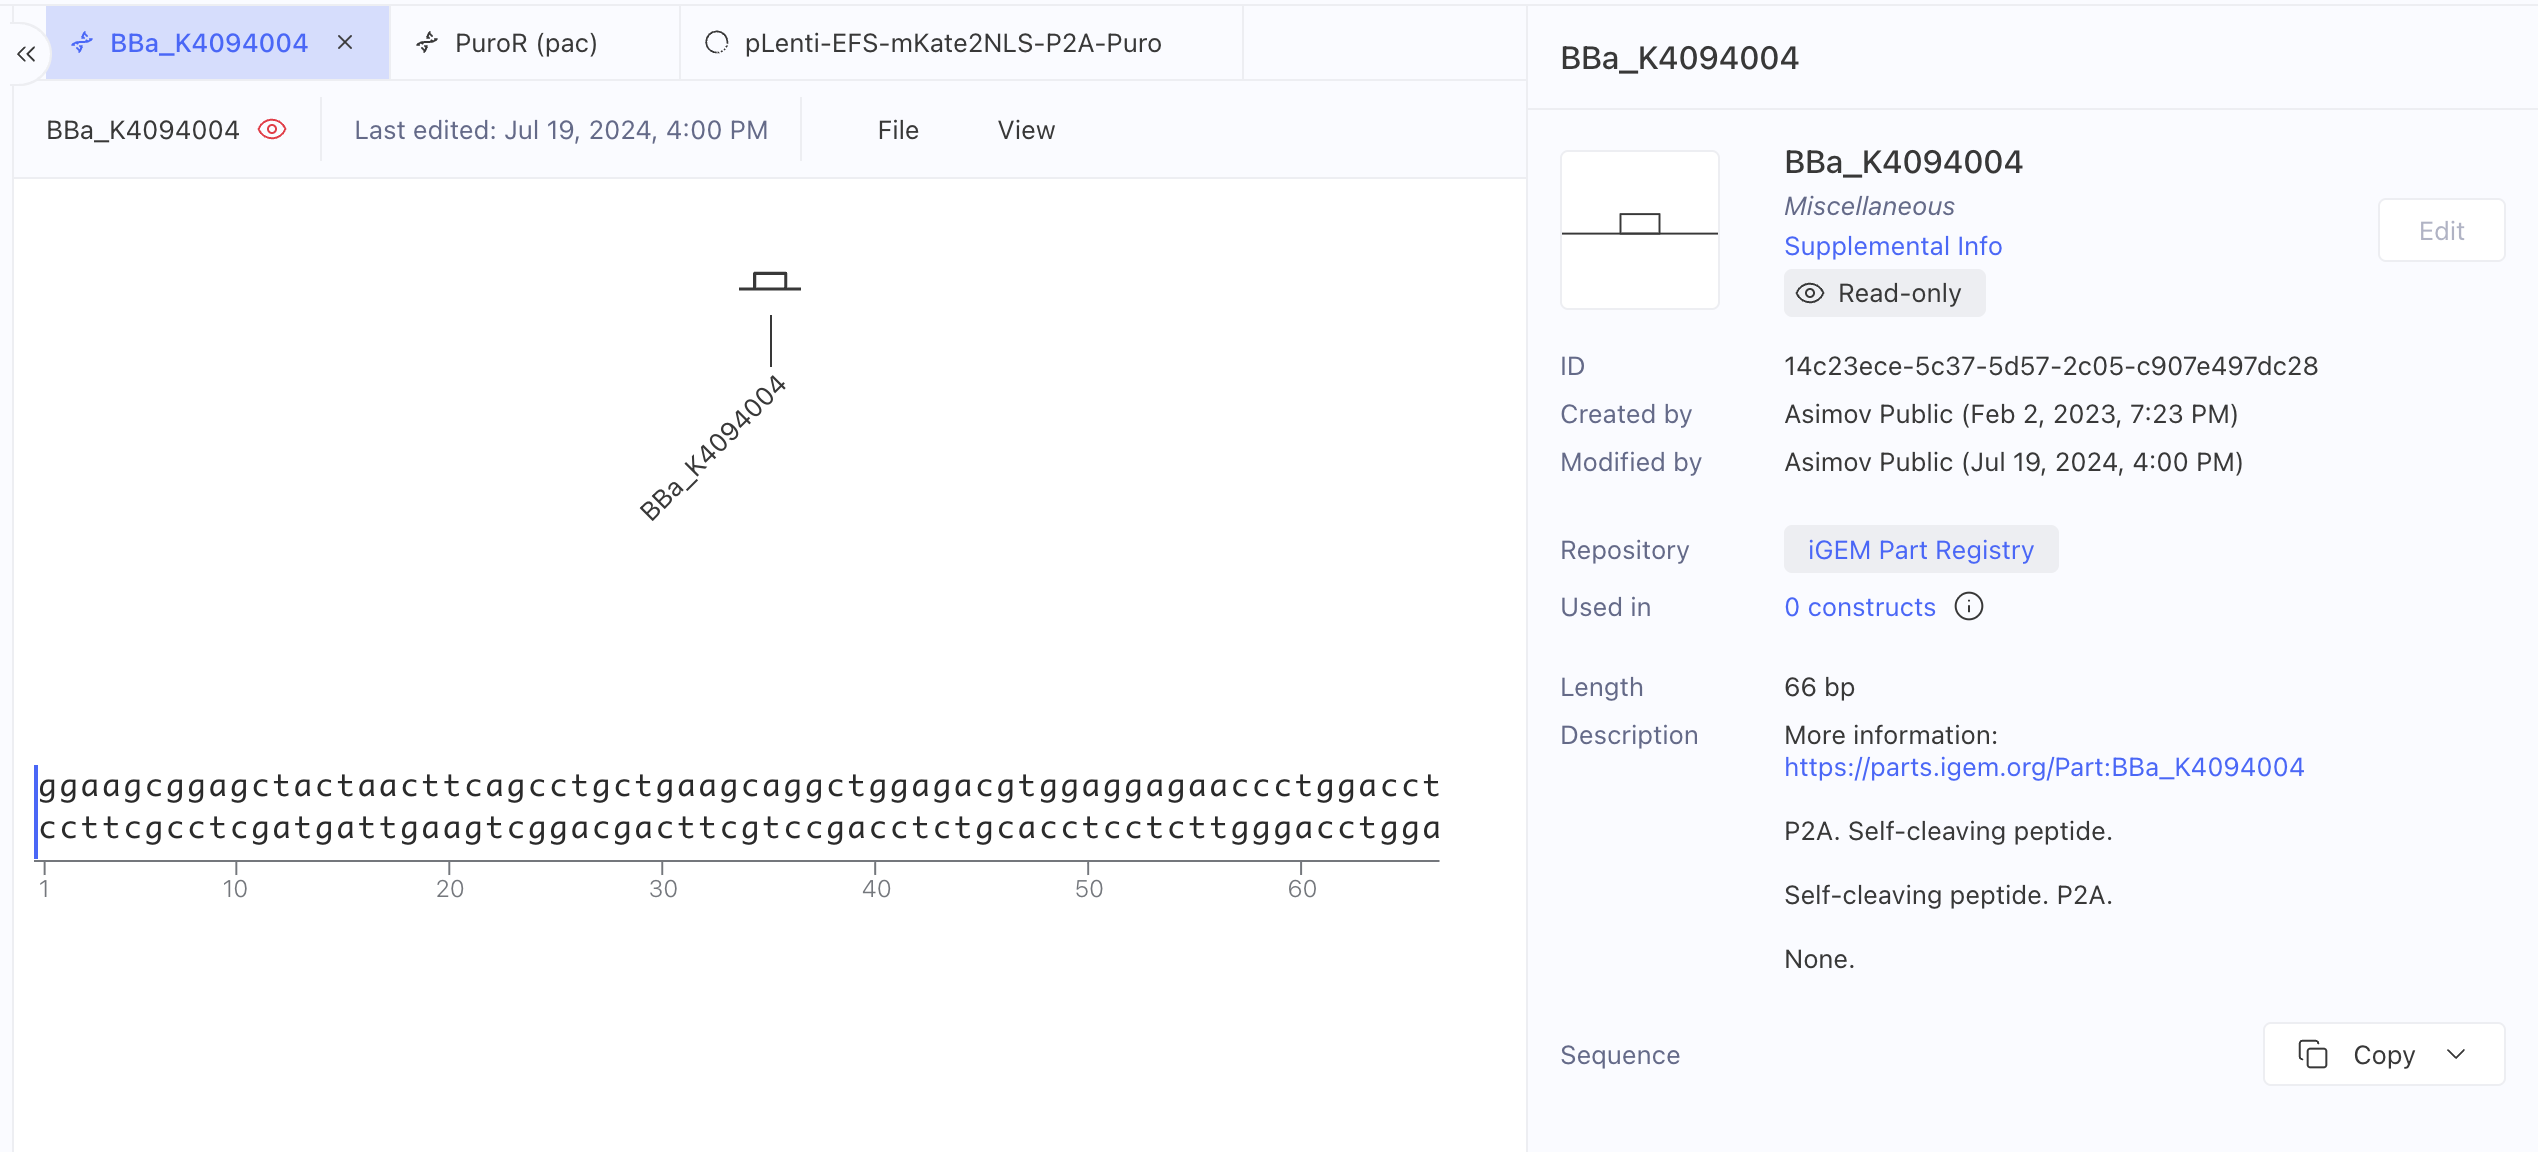
By contrast, when I created the GSG-P2A part, Kernel immediately reported an exact match to iGEM Registry part BBa_K4094004 (“P2A. Self-cleaving peptide.”, 66 bp), independently confirming it as the canonical sequence rather than a variant. That entry is read-only and typed “Miscellaneous,” so I created a properly typed copy as Peptide CDS to preserve Kernel’s reading-frame validation across the cassette.
Together these answer the question directly: one part of my construct is identical to a catalogued sequence, the other is synonymous-novel by design.
Biosecurity screen
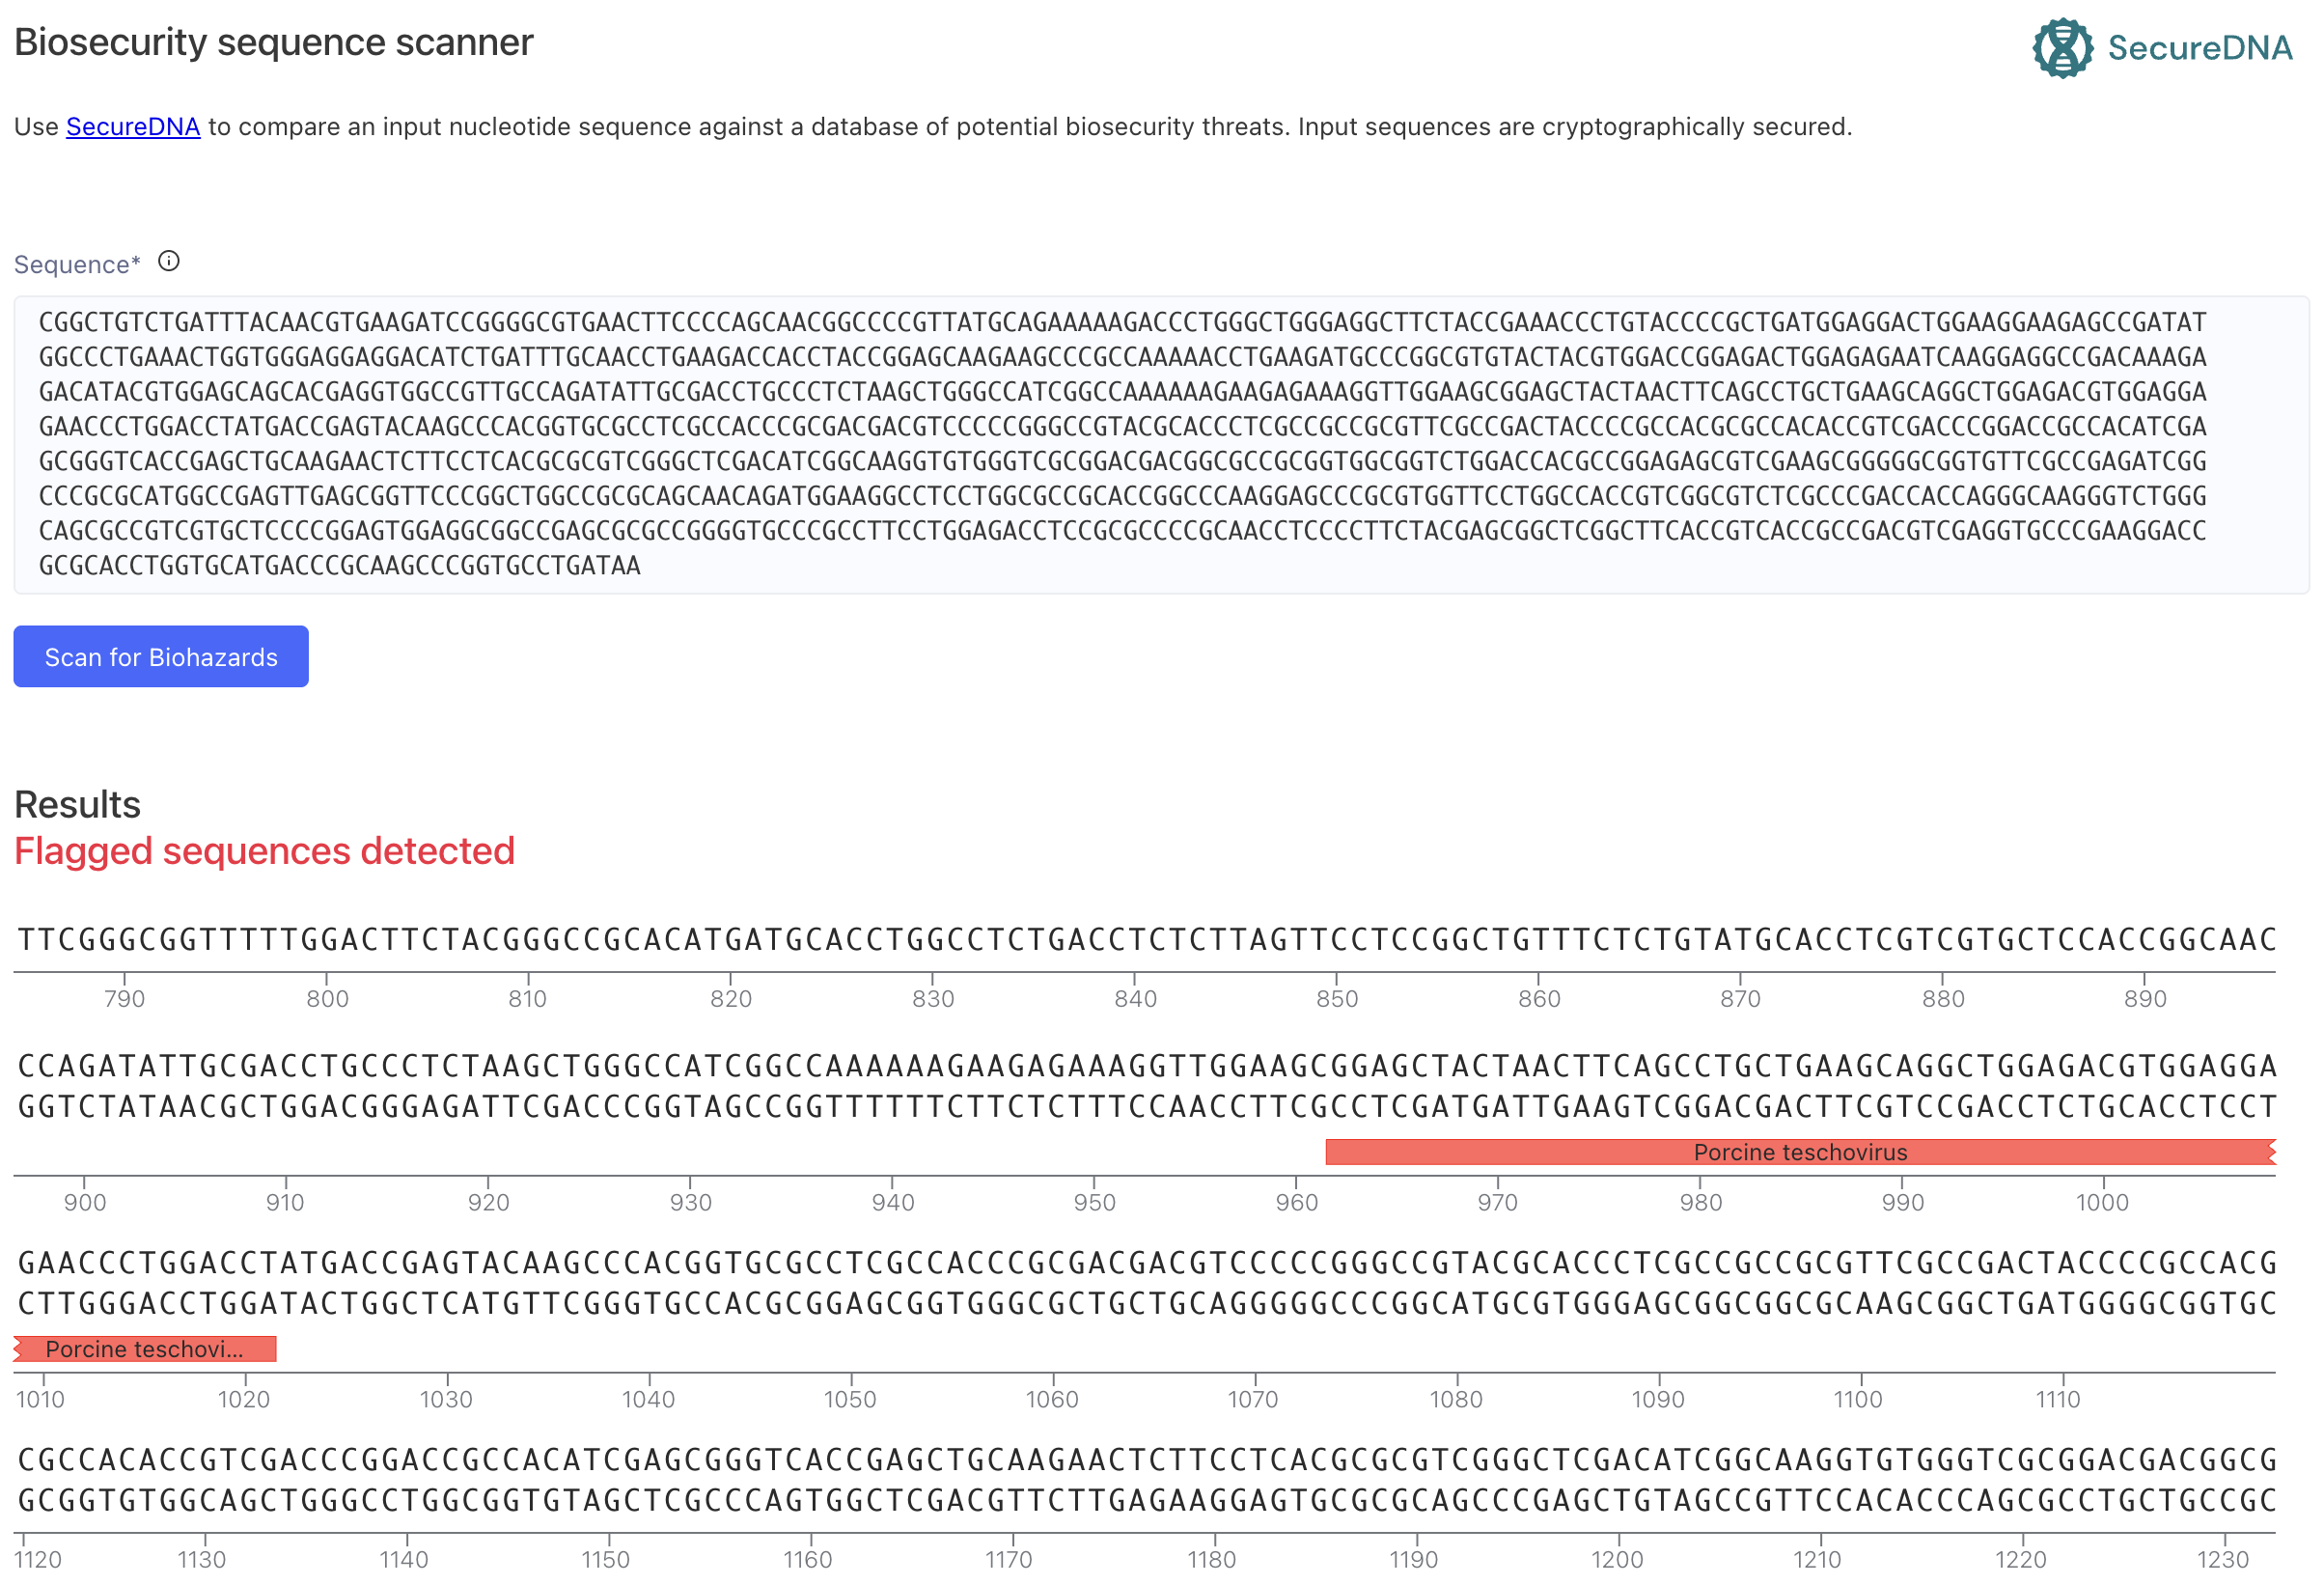
I scanned the assembled cassette with Kernel’s SecureDNA-based biosecurity sequence scanner, which compares an input sequence against a database of potential biosecurity threats. The scan returned one flagged region, spanning approximately positions 960–1021, identified as Porcine teschovirus.
This is expected by design and maps exactly onto the GSG-P2A part. The P2A self-cleaving peptide is derived from porcine teschovirus-1, a fact recorded in the part’s own description. The flagged region is 66 bp encoding a 22 amino acid peptide whose only function is to make the ribosome skip formation of a single peptide bond, releasing the upstream protein and continuing translation of the downstream one. It carries no replicative, infectious or pathogenic function of the parent virus, and porcine teschovirus is a swine pathogen with no human host range. P2A is among the most widely used parts in mammalian expression.
My response would be no change to the design. The correct handling is documentation rather than removal: the element’s viral origin is declared in the part record, the construct is handled at BSL-2 as standard for lentiviral work, and the flag would be explained in any synthesis order. This is a useful illustration of what a biosecurity screen does and does not tell you — it reports sequence provenance accurately, but risk assessment requires knowing what the matched fragment actually encodes. Notably, neither mKate2 nor PuroR triggered a flag, despite the latter being an antibiotic-resistance marker.
Part 5: From design to build
How would I build it?
One synthetic gene fragment, assembled into the cut backbone by Gibson assembly.
The cassette is 1,863 bp — comfortably within the roughly 3 kb capacity of a commercial gene fragment, so there is no need to split it. I would order it as a single sequence-verified double-stranded fragment with 20–40 bp homology arms matching the restriction-cut lentiviral backbone, then join the two in one isothermal reaction. Gibson assembly is the right method here because it is scarless, sequence-independent at the junctions, and joins fragments in a single step without intermediate subcloning (Gibson et al. 2009).
Ordering a fragment rather than building from raw oligos is the correct trade-off at this scale. Chip-synthesized oligo pools make DNA synthesis dramatically cheaper per base, but each oligo carries roughly one error per few hundred bases, so gene-length constructs assembled from pools require error correction — mismatch-binding enzymes that remove error-containing duplexes (Carr et al. 2004), or selective amplification of correct oligos from the pool (Kosuri et al. 2010). For a single 1.9 kb cassette, ordering a pre-assembled sequence-verified fragment shifts that burden to the vendor at negligible cost.
What does synthesis constrain?
My design contains one genuinely difficult region and one I removed.
PuroR at 69.8% GC is the hard part. High-GC sequences form stable secondary structures that stall polymerase during assembly PCR and cause synthesis failures or deletions. This is a direct consequence of the finding in Part 4: because PAC’s amino acid composition sets a GC floor near 70%, I cannot recode my way out of it. If the vendor rejected the fragment I would split the order at a lower-GC junction rather than compromise codon adaptation.
WPRE was the other candidate difficulty — a repetitive, structured viral element — and omitting it removed that problem entirely. The remaining elements are unremarkable: no long homopolymers (the longest run in mKate2 is 5 nt), no extreme local GC in the reporter, and no repeats.
Prototype vs. scale
These barely differ, and that is the interesting part. This construct is built exactly once. One Gibson assembly, one sequence-verified plasmid, one lentiviral production run, one transduction, one puromycin selection — and from then on the “manufacturing” is done by the cells themselves, copying the integrated provirus every division.
Scaling the Homework #1 screen from one 96-well plate to 52 plates of 384 wells scales cell expansion, not DNA synthesis. The DNA requirement is flat with respect to screen size. This is the sharpest contrast with Homework #1, where the bottleneck was biological throughput: here the genetic design is a one-time fixed cost, and the only thing that would send me back to DNA synthesis is a design change — a different promoter if EF1α silences, or adding WPRE if the signal is too dim.
Part 6: What don’t I know yet?
1. Will EFS drive sufficient expression in SU-DHL-4, and will it stay on?
Promoter silencing over weeks of culture would dim the reporter mid-screen and invalidate comparisons between early and late plates. How to find out: transduce, select, then track mKate2 mean fluorescence by flow cytometry weekly for four weeks. If it decays, test SFFV or CAG promoter variants — a change that would require re-ordering the promoter but not the rest of the cassette.
2. Is far-red signal detectable through the hydrogel at screen density?
Scattering and gel autofluorescence could bury the signal at 100–200 µm imaging depth, which would defeat the entire purpose of the construct. How to find out: encapsulate labelled cells in the actual hydrogel at screen density (5,000 cells per 10 µL) and measure signal-to-noise against 2D culture on the automated microscope. This is the assumption the whole design rests on and the first thing I would test.
3. Does the reporter line still behave like the parental line?
Lentiviral integration is semi-random, and puromycin selection plus constitutive reporter expression could alter growth rate or drug response — which would silently corrupt every 2D-vs-3D IC50 comparison the screen produces. How to find out: compare doubling time and doxorubicin dose-response curves for labelled versus parental SU-DHL-4. They must match within experimental error before the line is used for screening.
A fourth, smaller unknown: the SV40 NLS ends up internal rather than C-terminal after P2A cleavage, since the ~21 aa 2A remnant is appended downstream of it. The SV40 NLS is known to function internally, but I would confirm nuclear localization by microscopy before trusting the segmentation pipeline.
References
Carr, P. A. et al. (2004). Protein-mediated error correction for de novo DNA synthesis. Nucleic Acids Research 32:e162.
Gibson, D. G. et al. (2009). Enzymatic assembly of DNA molecules up to several hundred kilobases. Nature Methods 6:343–345.
Kim, J. H. et al. (2011). High cleavage efficiency of a 2A peptide derived from porcine teschovirus-1. PLoS ONE 6:e18556.
Kosuri, S. et al. (2010). Scalable gene synthesis by selective amplification of DNA pools from high-fidelity microchips. Nature Biotechnology 28:1295–1299.
Lacalle, R. A. et al. (1989). Molecular analysis of the pac gene encoding a puromycin N-acetyl transferase from Streptomyces alboniger. Gene 79:375–380.
Shcherbo, D. et al. (2009). Far-red fluorescent tags for protein imaging in living tissues. Biochemical Journal 418:567–574.
I used Claude Opus 5, and Kimi for an initial draft of the construct design.
Claude was used to review and correct that draft, to retrieve and verify sequences from primary databases (UniProt, ENA, FPbase), to back-translate the mKate2 CDS and verify it round-trips to the FPbase protein, to compute GC content and amino acid composition when Kernel returned N/A, and to interpret the outputs of Kernel’s tools. Representative prompts:
Corrections Claude made to the initial draft that I verified and adopted: mKate2 is 232 aa with Ex/Em 588/633 nm (the draft said 234 aa and 635 nm); the internal forward-orientation bGH poly(A) would collapse lentiviral titer; the reporter should be nuclear rather than cytoplasmic for 3D segmentation; and the cassette fits in one synthetic fragment rather than two.
Week 3 HW: Cell-free design
HTBAA Homework #3 — Cell-Free Reaction Design
Coopetition profile: Gonzalo Povea · sfGFP, PETase and Reteplase compositions submitted to coopetition.htgaa.org
A. Compare cell-free reaction compositions
A1. Why do potassium glutamate and magnesium glutamate concentrations differ between compositions? Which is more sensitive?
The two salts sit an order of magnitude apart — potassium glutamate around 200 mM, magnesium glutamate around 8–10 mM — because they do fundamentally different jobs.
Potassium glutamate is a bulk ionic adjustment. Its role is to set ionic strength so that proteins and nucleic acids behave as they would inside the E. coli cytoplasm. Glutamate is the counter-ion rather than chloride because chloride inhibits cell-free translation. The yield-versus-concentration curve is broad, so a shift of 20–30 mM produces only modest changes.
Magnesium glutamate is a fine adjustment and is by far the more sensitive. Mg²⁺ is not a bulk contributor but a specific structural and catalytic cofactor, required at three distinct points:
It holds the 30S and 50S ribosomal subunits associated. Below the optimum, ribosomes dissociate and translation collapses.
It chelates the phosphate groups of every NTP. The true substrate for RNA polymerase and the ribosome is the Mg–NTP complex, so magnesium is part of the substrate itself.
It is required by the polymerases and several accessory enzymes carried in the lysate.
Above the optimum it becomes inhibitory, over-stabilising mRNA secondary structure and tightening ribosome association past the point where subunits can cycle. The result is a narrow optimum with a sharp peak, where a 2–3 mM shift can change yield severalfold.
The most important consequence for reaction design is that the optimal magnesium concentration is not a universal constant — it is coupled to the rest of the recipe. NTPs sequester Mg²⁺ stoichiometrically, so a formulation with more NTPs needs more magnesium. Energy systems that release inorganic phosphate chelate and precipitate Mg²⁺ as the reaction proceeds, lowering the effective free concentration over time. This is why magnesium must be re-tuned whenever the energy system or nucleotide source changes.
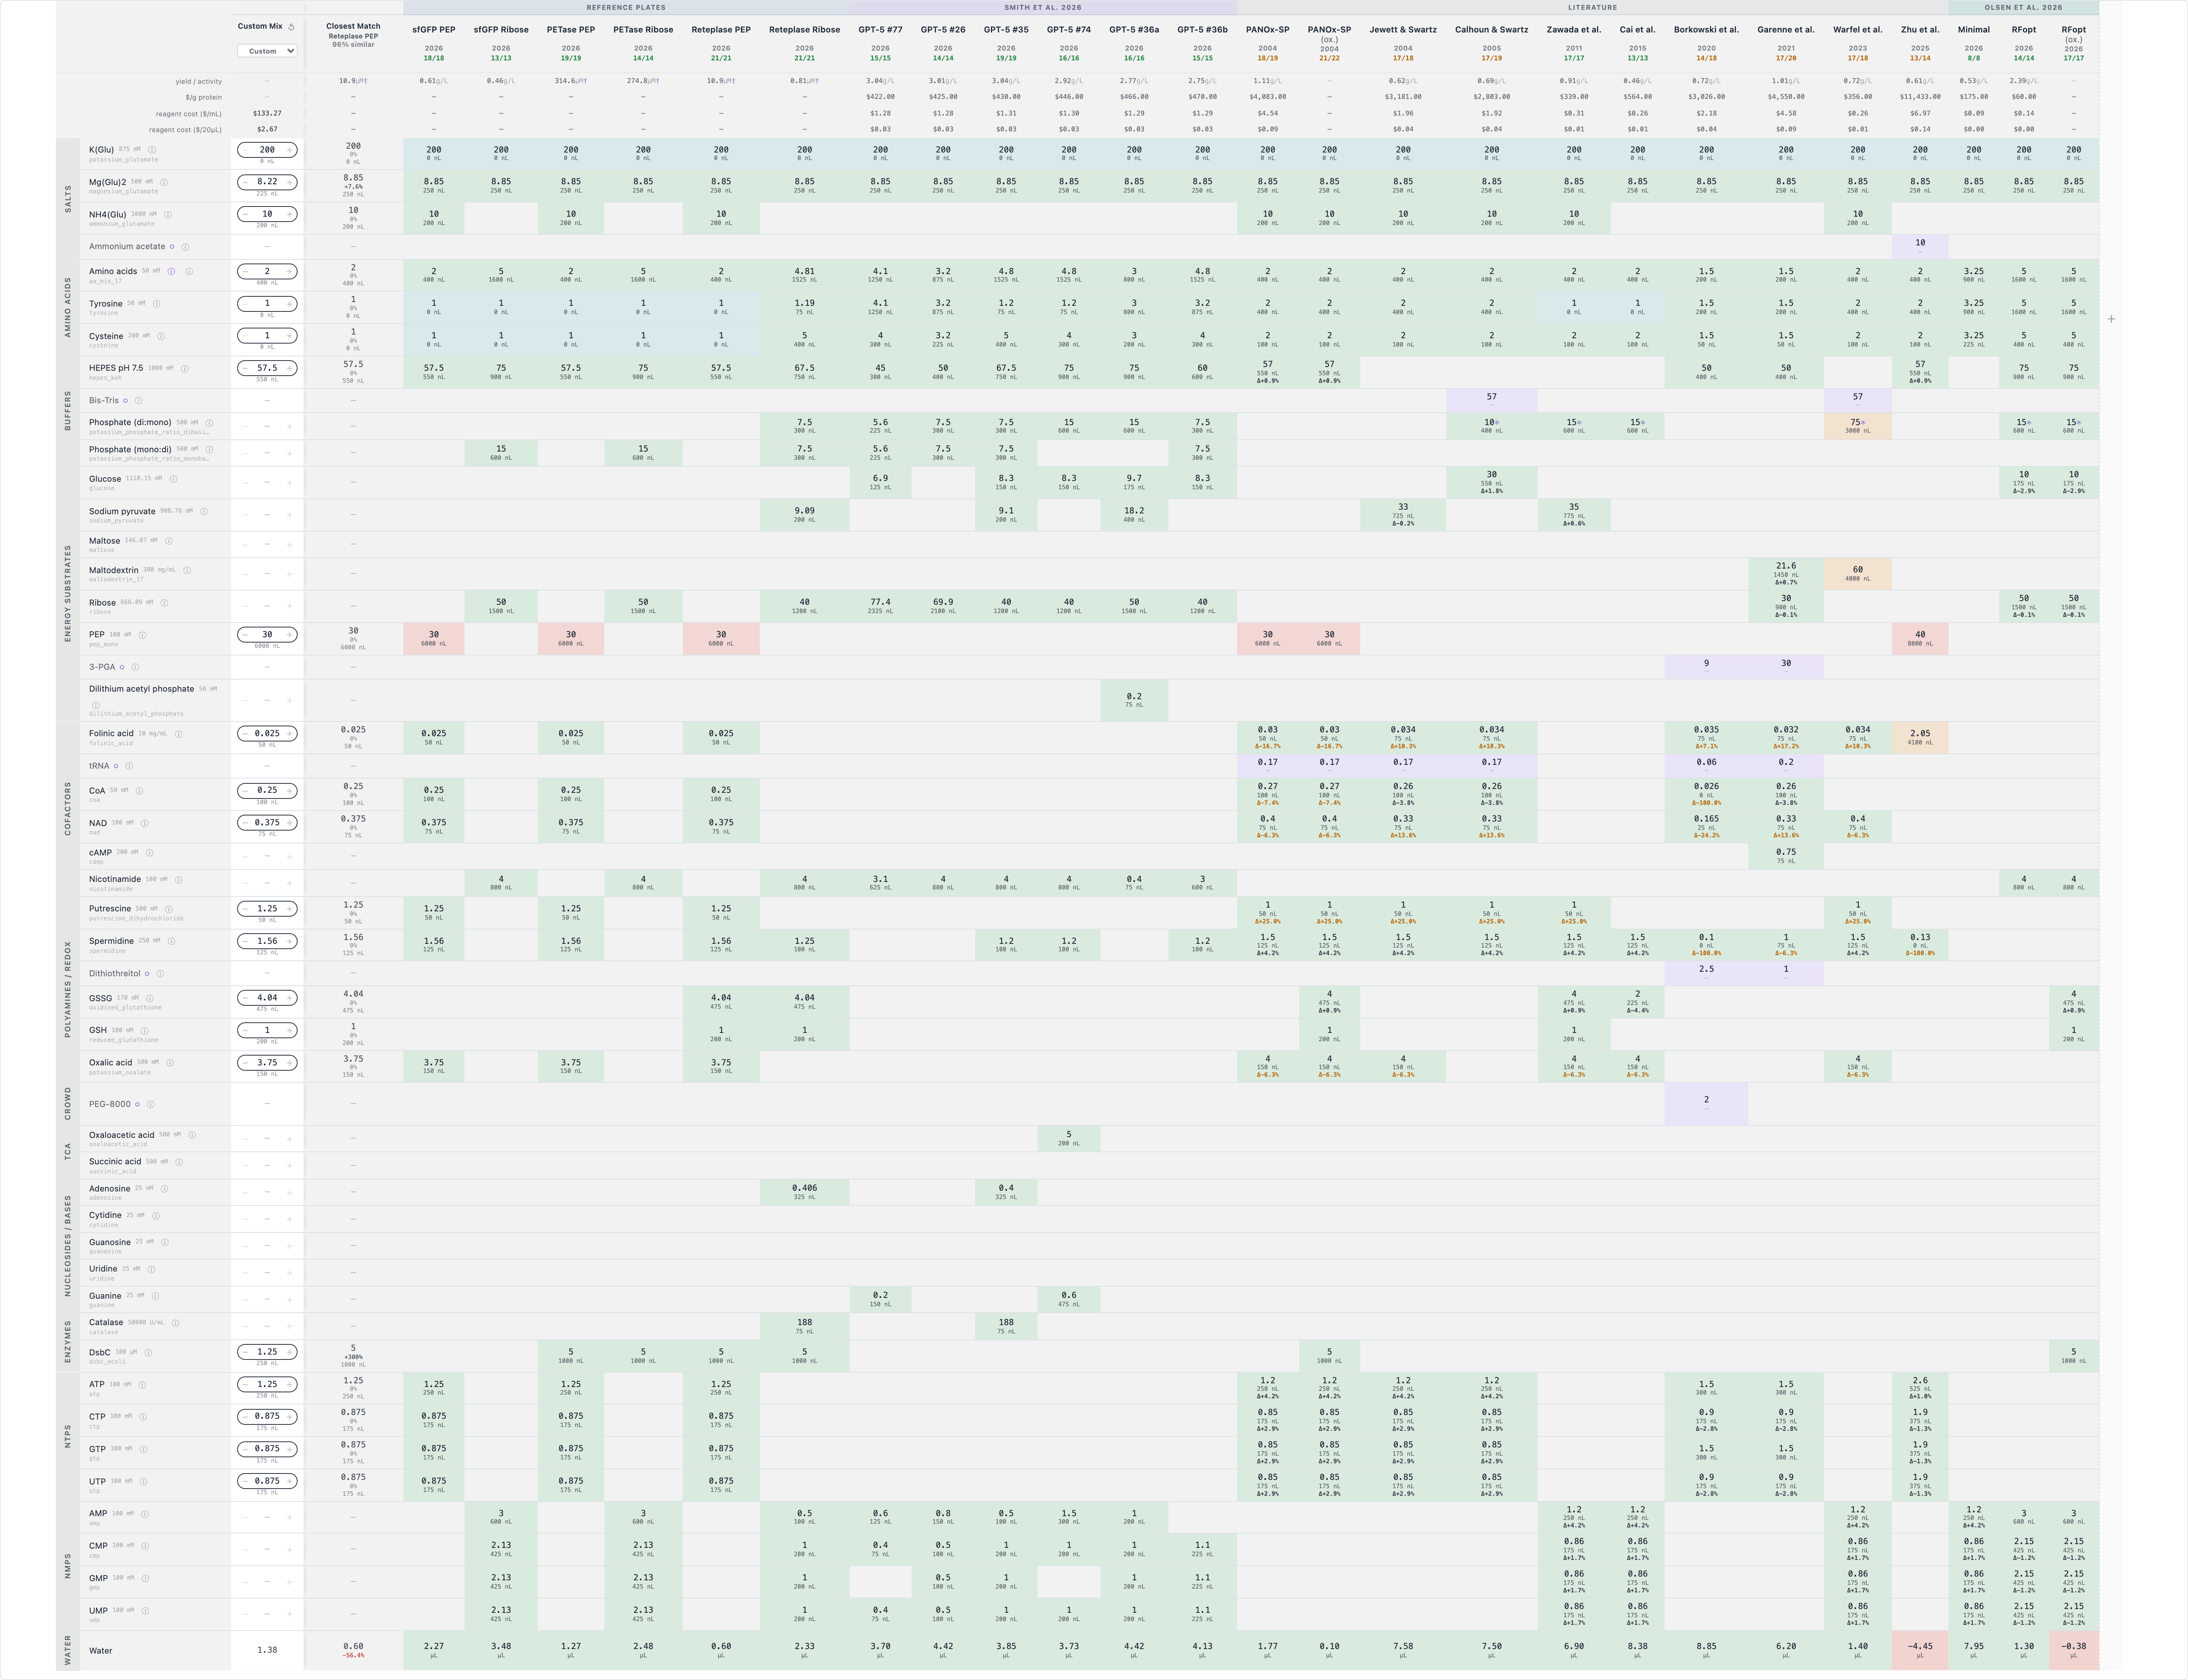
An empirical observation from the coopetition reagent set. Across all 25 reference formulations in the designer — PANOx-SP, Jewett & Swartz, Calhoun & Swartz, Zawada, Cai, Borkowski, Garenne, Warfel, Zhu, Minimal, RFopt and all six GPT-5 entries — potassium glutamate is 200 mM and magnesium glutamate is 8.85 mM without exception. Potassium glutamate shows 0 nL added in every case: all of it arrives in the fixed base buffer.
I tested this directly. My first sfGFP draft raised K(Glu) to 313 mM and lowered Mg(Glu)₂ to 6.97 mM. Raising potassium consumed 2,575 nL of the 11,000 nL variable budget — 23% of everything I had to spend — on a parameter that no published formulation varies, and potassium above roughly 200 mM is independently known to inhibit translation. I reverted both. The lesson is that these two salts are the wrong place to spend a constrained volume budget: the base buffer already places them at or near their plateau, and the variable budget is better spent on components that actually differentiate formulations.
A2. How does a PEP+NTP formulation differ from a Ribose+NMP formulation?
The difference is buy versus make. A PEP+NTP formulation purchases finished high-energy molecules; a Ribose+NMP formulation purchases cheap precursors and asks the lysate’s own metabolism to build them in situ.
PEP + NTP. The four nucleoside triphosphates are supplied directly and are immediately usable by RNA polymerase and the ribosome. Energy is regenerated from phosphoenolpyruvate: pyruvate kinase, already present in the lysate, transfers PEP’s phosphate to ADP to regenerate ATP. This is the classical approach used in PANOx-SP, which in this reagent set runs ATP at 1.25 mM, CTP/GTP/UTP at 0.875 mM each, and PEP at 30 mM.
Its advantages are speed and simplicity — no lag while the system builds a nucleotide pool, and high initial synthesis rates. Its disadvantages are cost and self-limitation:
Nucleoside triphosphates are among the most expensive reagents available: CTP $27.94/mL, UTP $37.85/mL, GTP $39.34/mL, against $0.53–1.27/mL for the corresponding monophosphates. GTP alone is roughly 74× the price of GMP.
PEP is consumed stoichiometrically, not catalytically: each molecule donates one phosphate and becomes pyruvate. Driving a reaction for hours therefore requires a large molar excess, and at 30 mM it occupies 6,000 nL — over half the entire variable budget.
Every phosphate transfer releases inorganic phosphate, which accumulates, chelates and precipitates Mg²⁺, and progressively inhibits the reaction. This is a principal reason PEP-driven reactions have short productive lifetimes.
Ribose + NMP. Nucleoside monophosphates are supplied instead, and the lysate’s retained kinases phosphorylate them in two steps, NMP → NDP → NTP. Energy comes from a non-phosphorylated catabolic substrate — ribose, maltodextrin or glucose — entering central metabolism and regenerating ATP by substrate-level phosphorylation.
This inverts the trade-offs. The reagents are dramatically cheaper, and because the energy substrate carries no phosphate there is no stoichiometric phosphate dump, so free magnesium stays closer to its optimum for longer. The costs are a slower start, since the system must first build its nucleotide pool, and greater dependence on the lysate retaining intact central metabolism — which makes performance more sensitive to lysate batch and preparation.
What the coopetition data actually show, and why it complicates the story. The reference plates pair each target with a PEP and a ribose version, and PEP wins all three:
Target
PEP
Ribose
sfGFP
0.61 g/L
0.46 g/L
PETase
314.6 µM
274.8 µM
Reteplase
10.9 µM
0.81 µM
Yet the best-performing formulation in the entire reference set, GPT-5 #77 at 3.04 g/L and $422/g, is ribose-based. Both facts are true, and the reconciliation is informative: the naive ribose reference plates appear to be PEP recipes with the energy system swapped and little else re-tuned, whereas #77 re-optimised around the substitution. It uses the highest ribose of any entry (77.4 mM), the lowest nucleotide supplementation (AMP 0.6, CMP 0.4, UMP 0.4 mM, and no GMP at all), and supplies guanine as a free base at 0.2 mM, leaning on the lysate’s salvage pathway rather than buying the nucleotide.
The conclusion I drew, and which shaped my own designs, is that substituting the energy system is not a drop-in change. It is only profitable when the nucleotide supply, magnesium and amino acid levels are re-optimised around it — and when it is not, as in the Reteplase Ribose plate, yield falls by 13-fold and no amount of reagent saving compensates.
A3. Comparing two published compositions
I compared PANOx-SP (Jewett & Swartz 2004), the long-standing reference formulation, with RFopt (Olsen et al. 2026), a deliberately cost-optimised formulation. All figures below are read directly from the coopetition designer rather than from the papers, so they are on a common basis. I include GPT-5 #77 (Smith et al. 2026) as a third point of comparison, since an AI-designed formulation turns out to beat both.
PANOx-SP (2004)
RFopt (2026)
GPT-5 #77 (2026)
Design goal
Maximise yield and reaction lifetime
Minimise cost per gram
AI-designed, cost-per-gram objective
Nucleotide source
ATP 1.25, CTP/GTP/UTP 0.875 mM
AMP 3, CMP/GMP/UMP 2.15 mM
AMP 0.6, CMP/UMP 0.4 mM, no GMP; guanine 0.2 mM
Energy substrate
PEP 30 mM
Ribose 50 mM, glucose 10 mM
Ribose 77.4 mM, glucose 6.9 mM
Amino acids
2 mM (Tyr 2, Cys 2)
5 mM (Tyr 5, Cys 5)
4.1 mM (Tyr 4.1, Cys 4)
Cofactors
Folinic acid 0.03, NAD 0.4, CoA 0.27 mM, tRNA, cAMP
Nicotinamide 4 mM
Nicotinamide 3.1 mM
Buffer
HEPES 57.5 mM
HEPES 75 mM, phosphate 15 mM
HEPES 45 mM, phosphate 5.6 + 5.6 mM
sfGFP yield
1.11 g/L
2.39 g/L
3.04 g/L
Cost per gram
$4,083
$60
$422
What the comparison shows. PANOx-SP supplies everything the reaction could need in ready-to-use form, including a generous excess of the most expensive species. It is robust and reproducible, which is why it remained the field reference for two decades, but almost its entire cost sits in two line items: PEP and the nucleoside triphosphates, together with CoA at $104/mL and NAD at $33/mL.
RFopt attacks exactly those line items and improves rather than sacrifices yield. The key insight is that the lysate is not merely a bag of ribosomes — it retains functional kinases and central metabolism, so it can be asked to manufacture its own NTPs from cheap monophosphates and to generate ATP from a sugar. The reagents removed were not providing irreplaceable function; they were providing convenience the lysate could supply itself. RFopt also replaces NAD with nicotinamide, its biosynthetic precursor, at a hundredth of the price, and drops CoA, folinic acid and tRNA entirely.
Three substitutions therefore account for almost the whole 68-fold cost reduction: NTPs → NMPs, PEP → ribose, and NAD/CoA → nicotinamide.
Why the AI formulation is interesting despite being more expensive per gram than RFopt. GPT-5 #77 produces the highest yield of any entry but costs $422/g against RFopt’s $60/g. The gap is not a design failure — it is an artifact of how the designer reports cost, discussed below, since #77’s figure includes the fixed lysate and DNA while RFopt’s appears not to. On the components the designer actually controls, #77 is the more aggressive of the two: it buys even fewer nucleotides than RFopt and pushes ribose 55% higher.
What I took from this for my own designs. First, the largest cost reductions come from substituting whole subsystems — energy source, nucleotide source, cofactor source — not from trimming individual components. Second, cheaper is not automatically worse: removing the phosphate burden improved cost and yield simultaneously, because phosphate accumulation was itself limiting. Third, once a formulation is already near the cost floor, further cost-cutting is pointless and yield becomes the only remaining lever — which is the principle behind all three of my submissions.
B. Design one reaction composition for each of the three proteins
B1. Published compositions
All three were built on a reference formulation rather than from scratch, so that each submission is a controlled test of a small number of changes rather than an untested recipe.
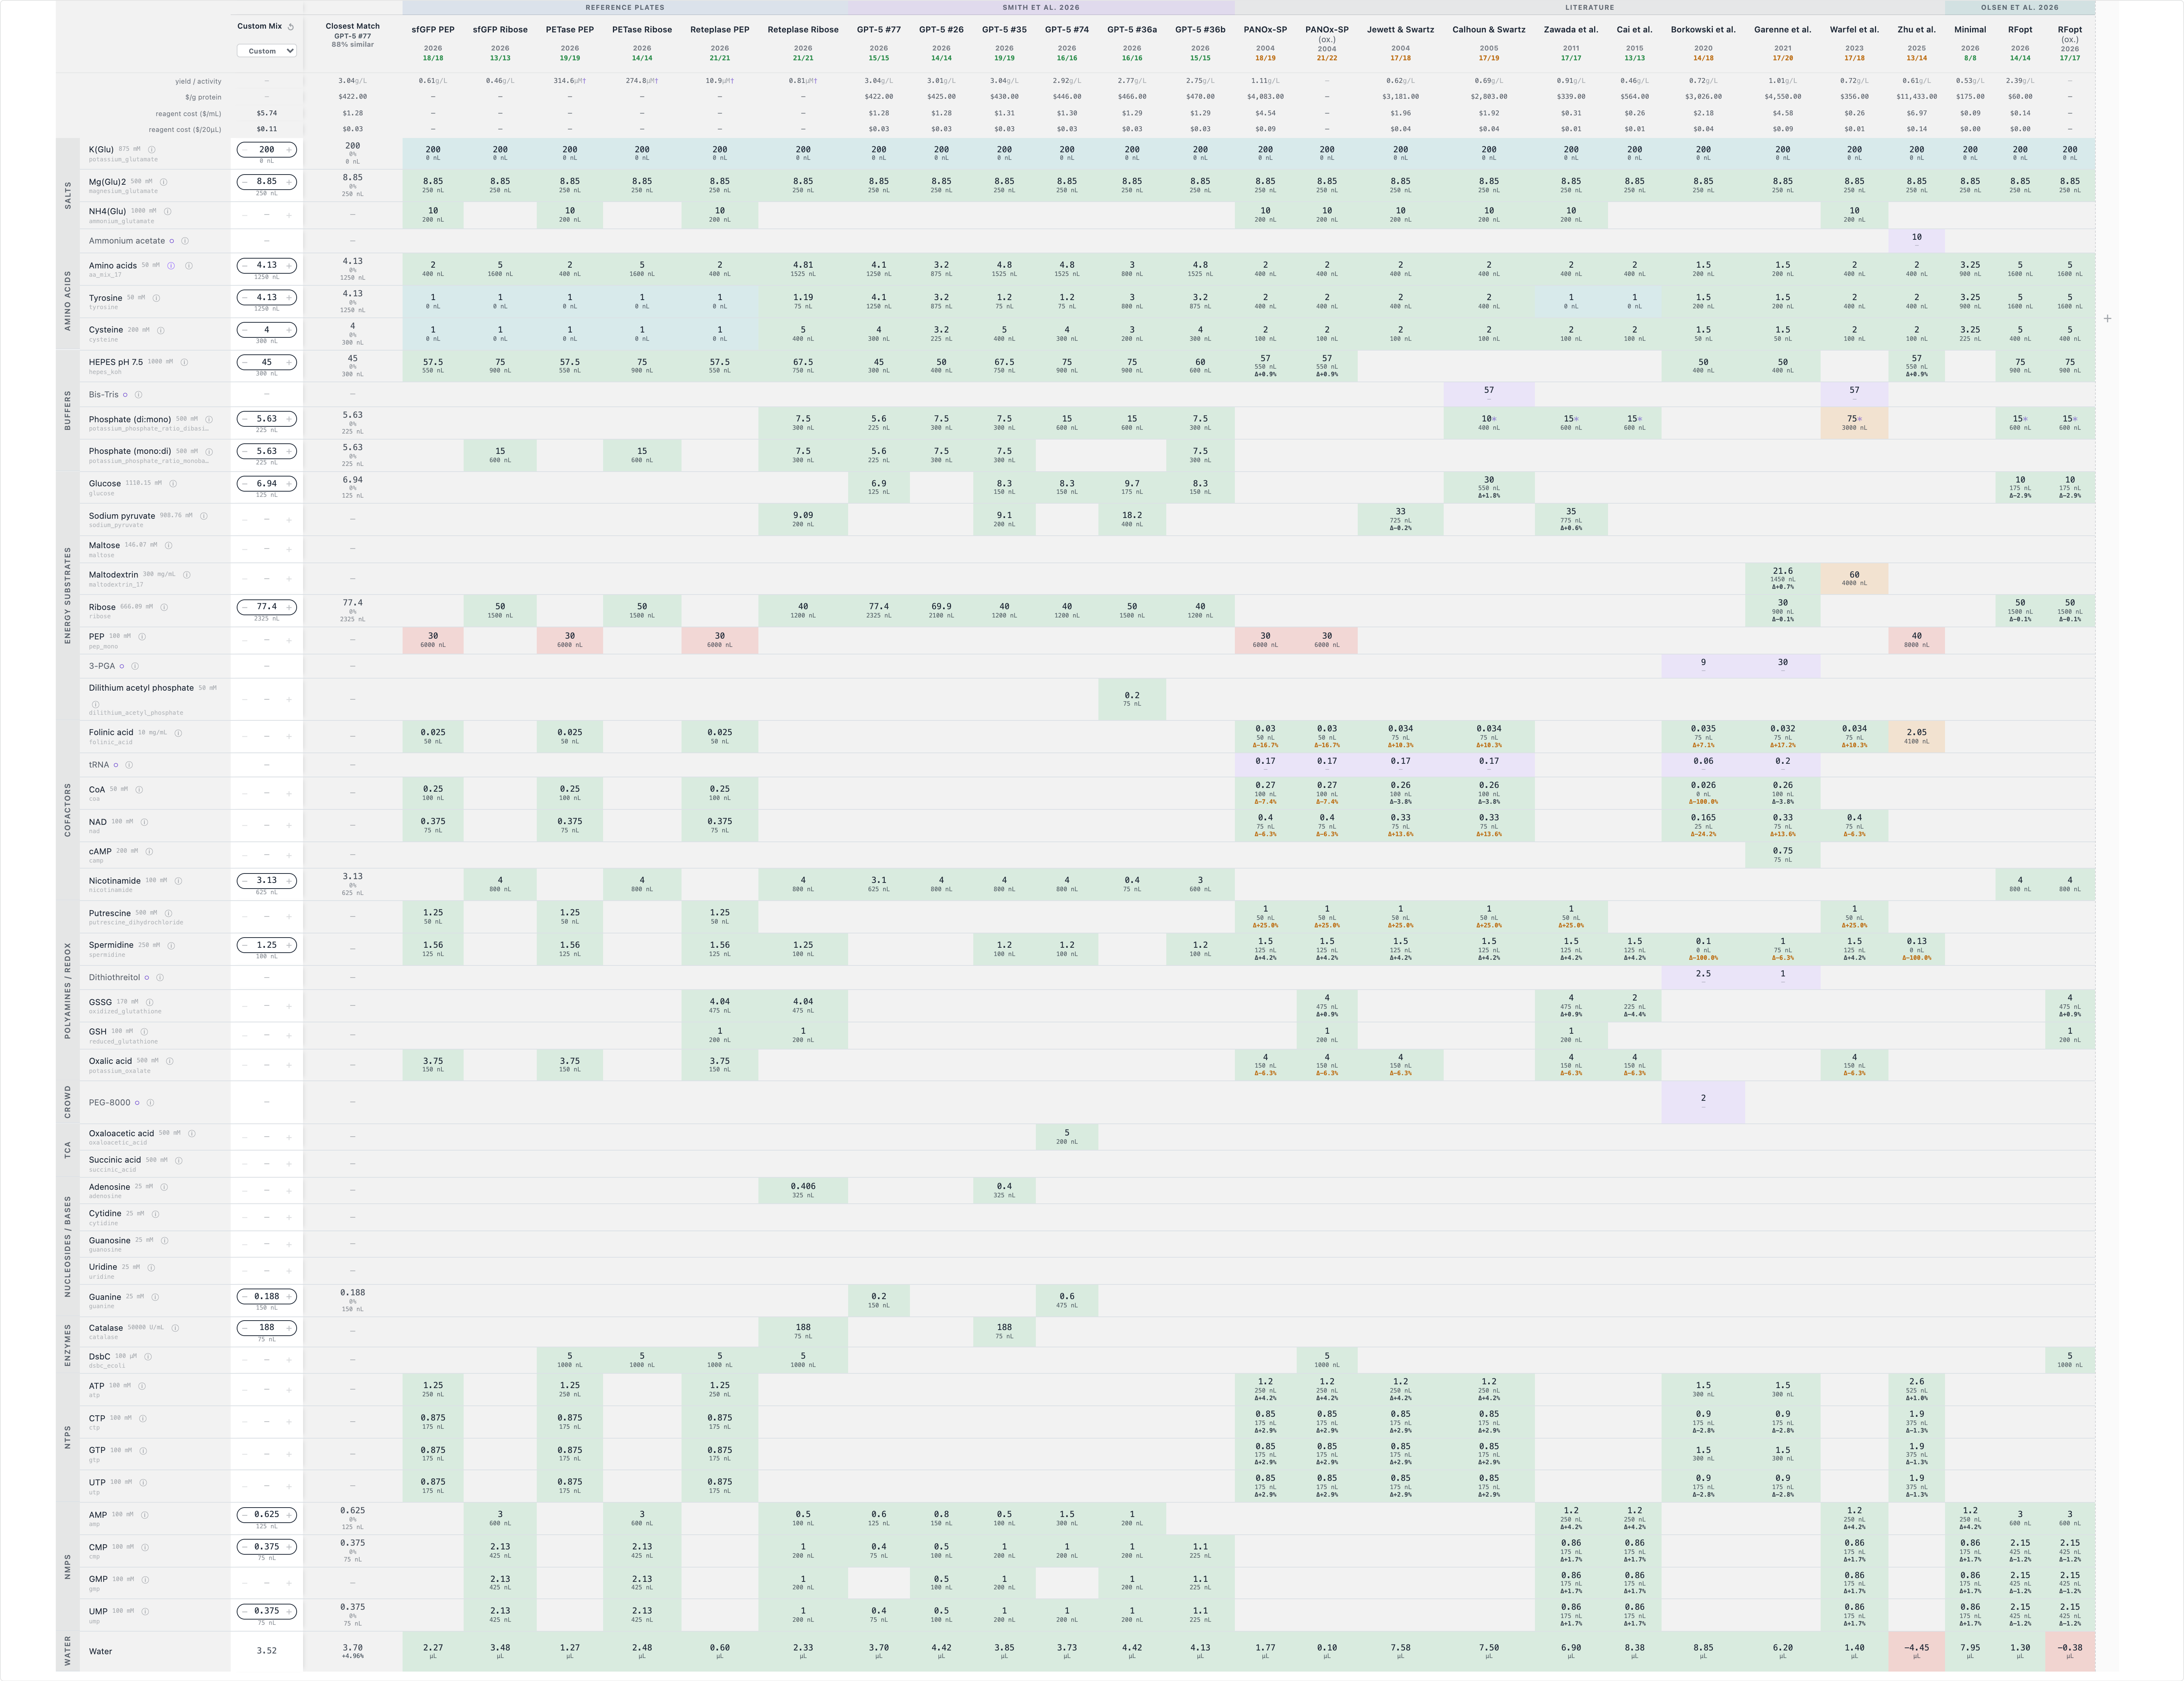
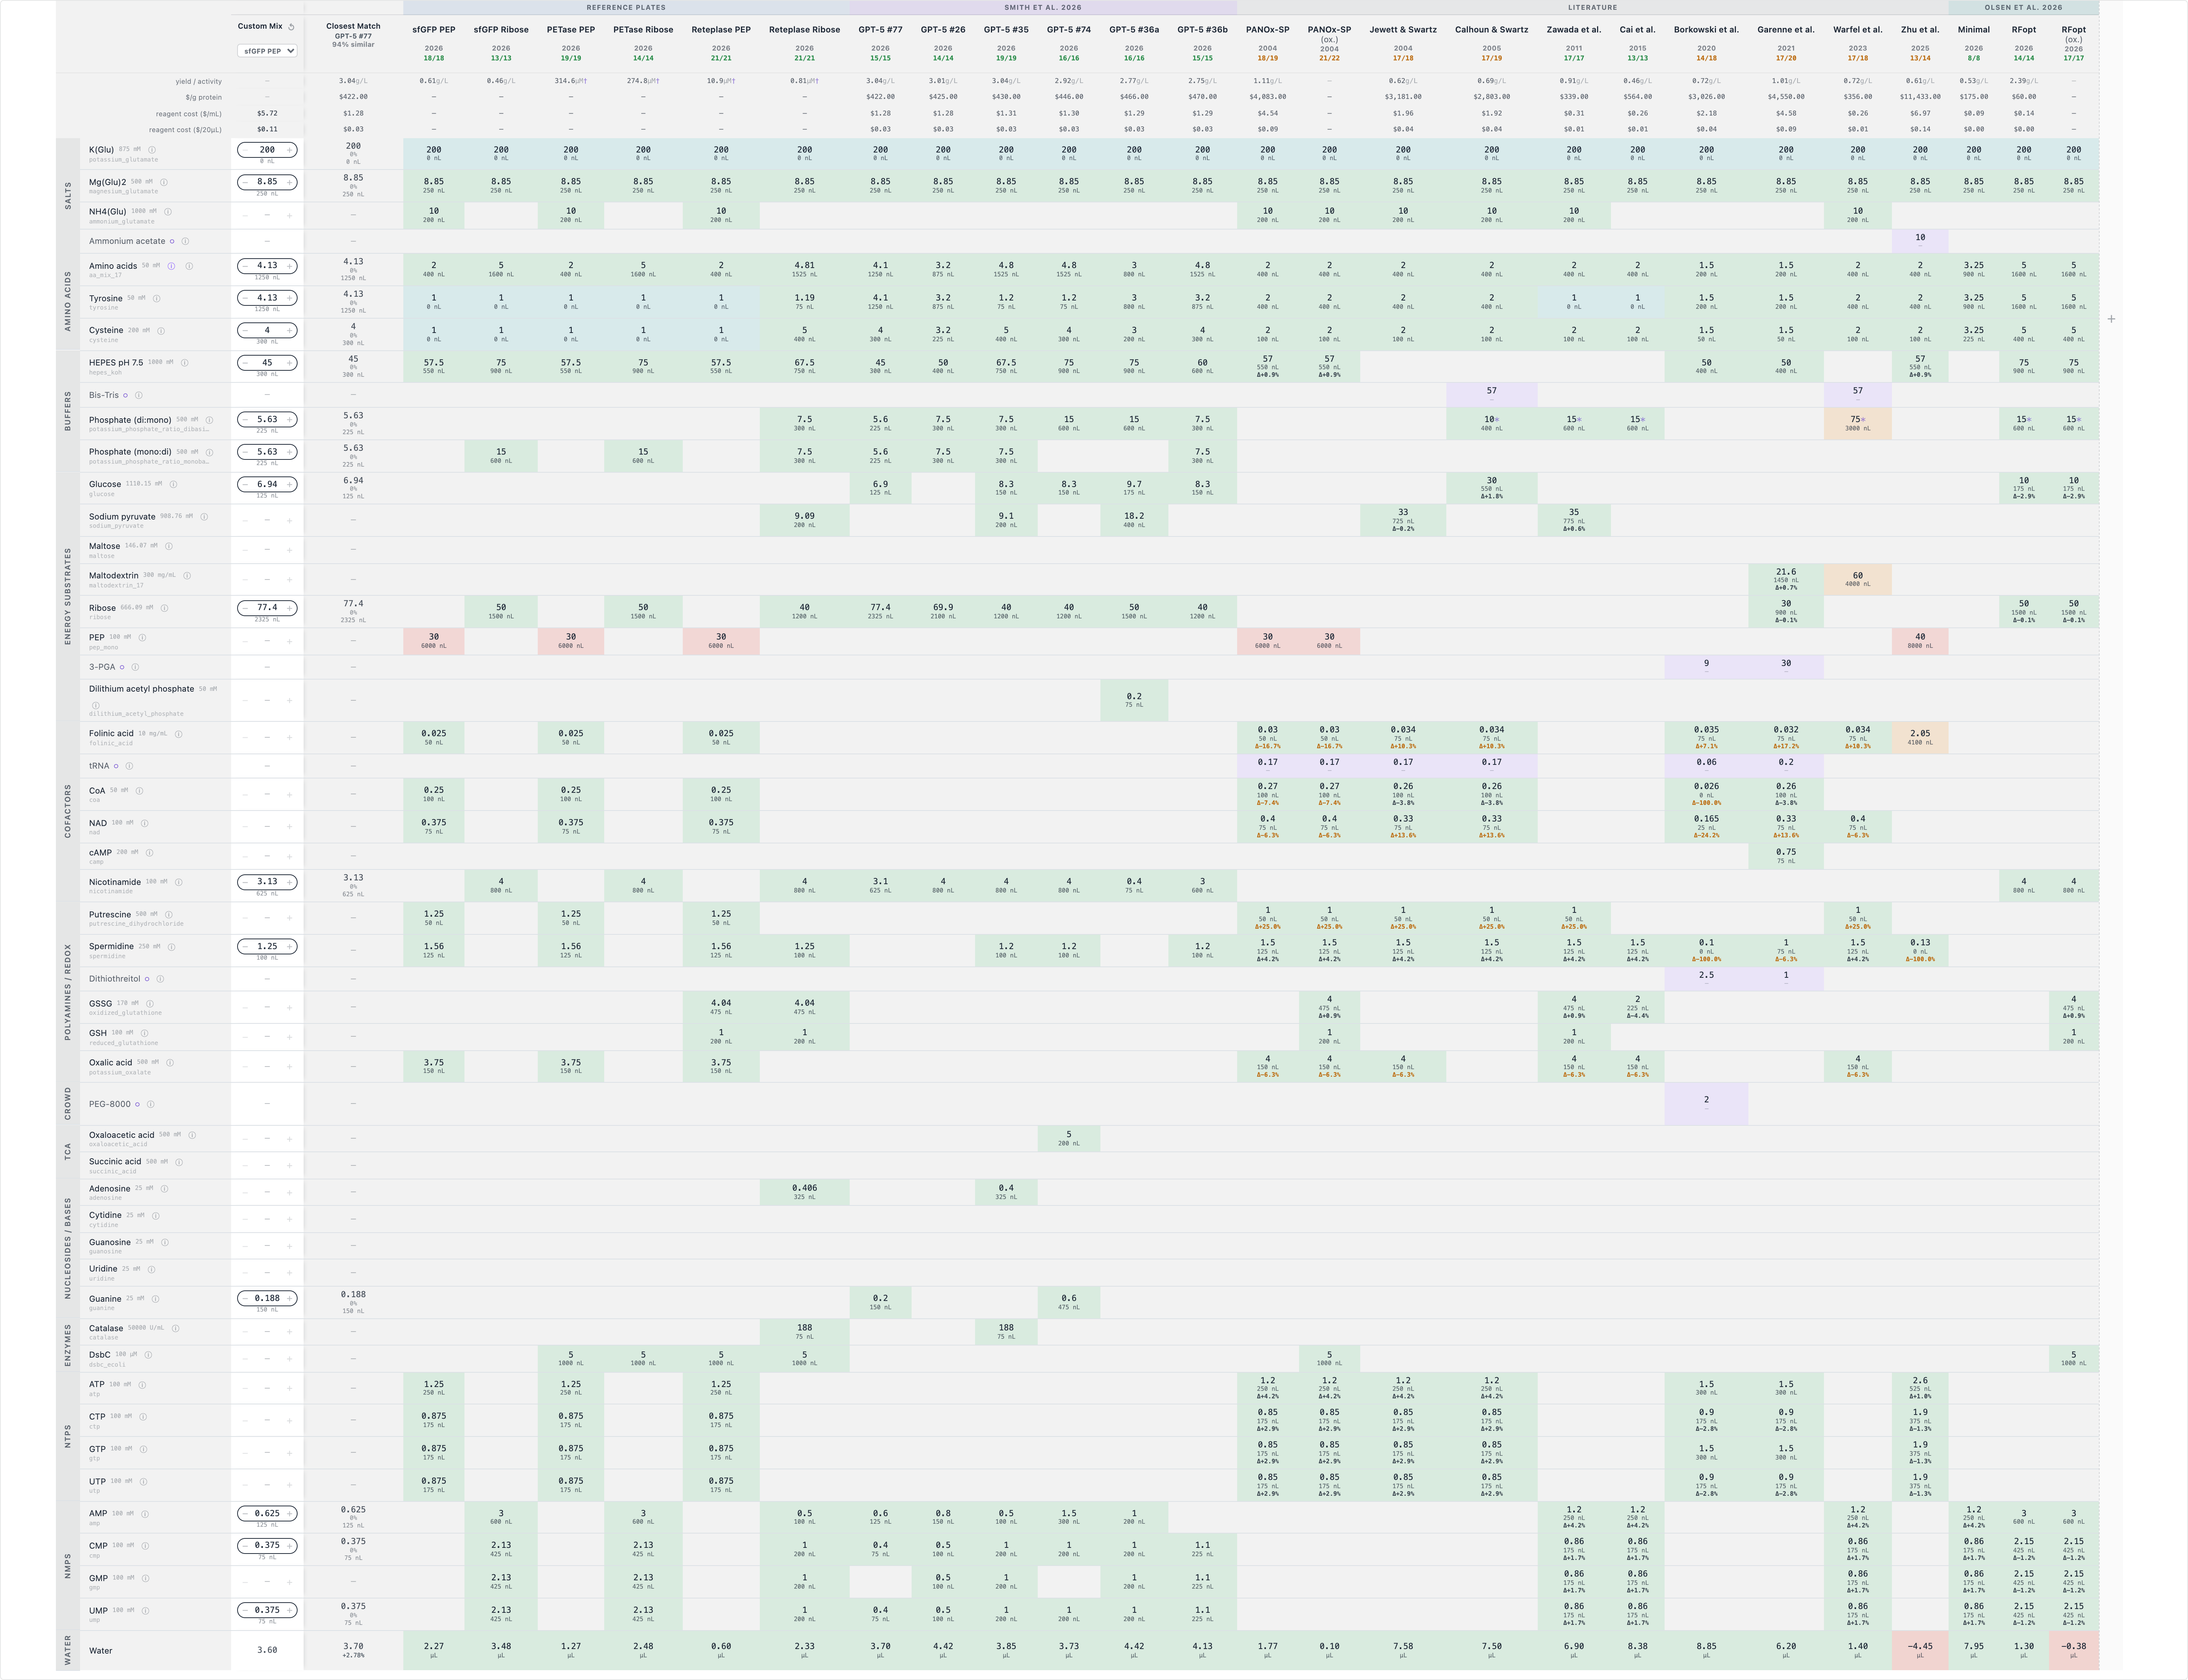
sfGFP
Click the image to open it full size — the composition table is wide and the inline view is not readable at full width.
Base: GPT-5 #77 (3.04 g/L, $422/g) — the best cost-per-gram entry in the reference set.
Reasoning. #77’s reagent cost is already near the floor. Working from the published price table, lysate, DNA template and base buffer together account for roughly $1.21/mL of its $1.28/mL, leaving about $0.04/mL for every variable component combined. There is essentially nothing left to cut, so yield is the only meaningful lever. I therefore kept the composition intact and added two components it omits.
Change
Value
Rationale
Catalase
188 U/mL
sfGFP chromophore maturation from Thr65-Tyr66-Gly67 is autocatalytic but strictly O₂-dependent, per the target’s own data sheet. Catalase liberates O₂ from hydrogen peroxide, and Olsen et al. (2026) report sfGFP rising from 2.4 to 3.7 g/L under oxygenation. GPT-5 #35 and the Reteplase Ribose plate both use exactly this level, so the dose is precedented; what is untested is catalase on the #77 background specifically.
Spermidine
1.25 mM
Polyamines stabilise ribosomes and mRNA secondary structure. #77 omits it, but #35, #74 and #36b use 1.2 mM and every classical formulation in the set uses 1–1.56 mM.
Deliberate omission: folinic acid. It has a clear mechanistic role in formyl-methionine initiation and appears in every PEP reference plate, but all six GPT-5 entries and all three ribose plates omit it. That pattern is consistent enough to suggest the lysate’s endogenous folate suffices under ribose-driven conditions, and I preferred to follow the data over the mechanism.
I also left amino acids and tyrosine at #77’s 4.1 mM rather than raising them to RFopt’s 5 mM, because #77 outperformed the entries that used higher amino acid levels (#35 and #74 both run 4.8 mM and score worse).
PETase (TfCut2)
Click to open full size.
Base: GPT-5 #77, with spermidine added and catalase omitted — catalase was included for sfGFP only because of the O₂-dependent chromophore step, which a hydrolase has no analogue for.
The substantive decision is omitting DsbC. Both PETase reference plates carry it at 5 µM. At $5,632/mL that is 1,000 nL costing $5.63 per reaction, roughly 98% of total reagent cost. The target data sheet states that TfCut2 folds under standard CFPS conditions, and a single disulfide bond (Cys274–Cys292) should not require a dedicated isomerase. Critically, no DsbC-free control exists anywhere in the reference set, so the reagent’s contribution to this target has never been measured.
This makes the submission informative either way. If activity holds without DsbC, cost per unit activity falls by about two orders of magnitude. If it collapses, that is a clean demonstration that DsbC is doing real work even on a single-disulfide protein — which would itself be worth knowing.
I left cysteine at 4 mM rather than raising it. Excess free cysteine is reducing, and would work against formation of the one disulfide this protein needs.
Reteplase
Click to open full size.
Base: Reteplase PEP (10.9 µM), not Reteplase Ribose (0.81 µM).
This is the one target where I abandoned the ribose strategy entirely. PEP outperforms ribose 13-fold here, and no reagent saving compensates for losing an order of magnitude of functional protein. The cost argument that drives the other two designs simply does not survive contact with the data on this target.
One change: DsbC from 5 µM to 1.25 µM.
The arithmetic is decisive. At $5,632/mL, DsbC is the most expensive reagent on the menu by roughly 50-fold and costs $5.63 of a ~$5.72 reaction. Converting the reference yield — 10.9 µM × 44,136 Da = 0.48 g/L — gives a specific cost near $585,000/g, against $422/g for sfGFP. Three orders of magnitude of that gap is attributable to a single reagent.
Cutting DsbC to a quarter reduces reaction cost to roughly a quarter. The bet is that if functional yield falls by less than 4-fold, cost per gram improves. Published effects of DsbC on disulfide-bonded proteins are typically in the 2–10× range, which places this test squarely in the informative band, and as with PETase no reduced-DsbC control exists in the reference set.
The structural answer, which this submission cannot test. The right long-term fix is not to buy less DsbC but to stop buying it: expressing DsbC in situ from a T7 helper plasmid would reduce its cost to approximately that of a second DNA template, about $2/mL rather than $5,632/mL. That is the subject of the optional Part C bonus question.
B2. Community Reagents
I upvoted FkpA (E. coli peptidyl-prolyl isomerase / chaperone), suggested by Xiangtao Shi, rather than proposing a new reagent.
How I decided. My own cost analysis pointed at the same target. Reteplase is where specific cost is decided in this study: DsbC at $5,632/mL is the most expensive reagent on the menu by roughly 50-fold, and at the reference 5 µM it accounts for about 98% of total reaction cost, putting that target near $585,000/g against $422/g for sfGFP. Any reagent that raises functional reteplase yield, or allows an equivalent result at a lower DsbC dose, moves the single biggest lever available in the entire reagent set.
I considered proposing DsbA instead, which is the missing half of the E. coli disulfide machinery: DsbC is an isomerase that reshuffles incorrectly paired cysteines after the fact, while DsbA is the oxidase that introduces the bonds in the first place. The menu currently offers only the correcting half.
I chose to back FkpA because it addresses a step that neither DsbC nor DsbA touches. FkpA carries peptidyl-prolyl isomerase activity, and cis–trans proline isomerisation is a classic rate-limiting step in protein folding that is entirely independent of disulfide chemistry. It also has general chaperone activity that suppresses aggregation of partially folded intermediates — a real risk for a 399-residue protein that must resolve 18 cysteines into 9 specific pairs.
The precedent is directly analogous. Groff et al. (2014) built a cell-free system for full-length immunoglobulins — multi-disulfide proteins with the same folding problem as reteplase — and found that purified FkpA reduced aggregation and acted together with DsbC to improve folding and assembly. That is a combination effect rather than a substitution, which is precisely why FkpA is worth testing on top of the existing DsbC rather than in place of it.
I confirmed access to the cfps-coopetition forum channel and posted the following optimisation idea:
One observation from the reference plates: the sfGFP target sheet states chromophore maturation is autocatalytic but strictly O₂-dependent, and Olsen et al. (2026) report sfGFP rising from 2.4 to 3.7 g/L under oxygenation. Catalase is already on the menu and liberates O₂ from H₂O₂, but none of the six GPT-5 entries use it on their best-performing background (#77). I added it at 188 U/mL — the level used by GPT-5 #35 and the Reteplase Ribose plate — on top of #77. It costs under $0.001 per well, so the downside is negligible and it should separate cleanly if the effect is real.
A note on the designer’s cost display
While building these compositions I could not reconcile the reagent cost the designer reported for a custom mix with the cost it reports for the reference plate that custom mix was copied from.
Recomputing GPT-5 #77 from the published price table reproduces its listed figure closely: lysate at 25% of reaction volume contributes $1.00/mL, the sfGFP template $0.19/mL, base buffer $0.02/mL, and all variable components together $0.04/mL, totalling $1.26/mL against the $1.28/mL displayed. The cost basis for the reference plates therefore appears to include the fixed components.
However, when I loaded GPT-5 #77 as a custom mix and changed only catalase and spermidine — components worth well under $0.001 per 20 µL reaction, at 98% similarity to the source — the displayed cost was $5.71/mL rather than $1.28/mL. Loading PANOx-SP as a custom mix produced $8.64/mL against $4.54/mL for the reference entry. Both discrepancies are close to $4.1–4.4/mL, near the unscaled lysate price of $4.00/mL, which suggests the custom column may be counting the lysate at full price rather than at its 25% share of the reaction.
Separately, the literature entries are not all on the same basis as each other: RFopt is listed at $0.14/mL, which cannot include a lysate contribution of $1.00/mL, whereas PANOx-SP at $4.54/mL clearly does.
I flag this rather than work around it, because cost per gram is the scoring metric and these differences are large enough to reorder the rankings. For my own designs I relied on the published price table rather than the displayed figure.
C. Asimov Kernel (optional)
Not attempted within the time available. For the record, the construct design differs from Homework #2 in that this is a prokaryotic T7 system rather than a eukaryotic one: the cassette would be T7 promoter → RBS → CDS → T7 terminator, with codon optimisation for E. coli rather than H. sapiens, replacing the EF1α promoter, Kozak sequence and poly(A) signal used previously.
For the bonus question — a T7 helper plasmid to improve functional reteplase yield — the design that follows from my cost analysis is to co-express the folding machinery rather than purchase it: DsbC together with general chaperones (GroEL/GroES or DnaK/DnaJ/GrpE), and, following the reasoning behind my Community Reagents vote, FkpA. The economic argument is stark: purified DsbC costs $5,632/mL and dominates the reteplase reaction, whereas a second DNA template costs roughly $2/mL. Producing the isomerase inside the reaction rather than buying it is the only change that attacks the cost problem at its root instead of trading yield against it.
References
Groff, D. et al. (2014). Engineering toward a bacterial “endoplasmic reticulum” for the rapid expression of immunoglobulin proteins. mAbs 6(3):671–678.
Jewett, M. C. & Swartz, J. R. (2004). Mimicking the Escherichia coli cytoplasmic environment activates long-lived and efficient cell-free protein synthesis. Biotechnology and Bioengineering 86(1):19–26.
Olsen, T. et al. (2026). Design-driven optimization of low-cost reagent formulations for reproducible and high-yielding cell-free gene expression. Nature Communications. https://www.nature.com/articles/s41467-026-69605-8
Smith, M. et al. (2026). AI-designed cell-free reaction compositions (GPT-5 entries, coopetition reference set).
Yin, G. & Swartz, J. R. (2004). Enhancing multiple disulfide bonded protein folding in a cell-free system. Biotechnology and Bioengineering.
Reagent prices and reference formulations: CFPS coopetition overview and guidelines, and the designer at coopetition.htgaa.org.
AI
I used Claude (Anthropic, Claude Opus 5) via claude.ai throughout.
Claude was used to work through the underlying biochemistry from a standing start, since cell-free systems were outside my background; to retrieve and verify figures from Olsen et al. (2026) and the Groff et al. (2014) reference against the primary sources; to compute reagent costs per reaction from the published price table, including the reconciliation of the designer’s displayed costs described above; and to analyse the reference plate data for patterns, which is how the ribose-versus-PEP tension in A2 and the amino-acid signature of GPT-5 #77 were identified. Representative prompts:
Claude’s analysis changed three decisions I would otherwise have made differently. It identified that my first draft’s raised potassium glutamate consumed 23% of the variable budget on a parameter no published formulation varies; it caught that PEP outperforms ribose on all three targets in the reference data, which reversed my plan to use a ribose-based formulation for reteplase; and it worked out that DsbC accounts for roughly 98% of reteplase reaction cost, which became the central argument of two of my three submissions.
Week 1 HW: Final Project Ideas
HTBAA Homework #1 – 3D Diffuse Large B-Cell Lymphoma (DLBCL) Microtumors for Drug Screening
(1) What would you like to biomanufacture and why?
I would like to biomanufacture standardized 3D microtumors of diffuse large B-cell lymphoma (DLBCL). Each microtumor consists of lymphoma cells encapsulated in a hydrogel that recreates key features of the lymph node environment. They are produced in multi-well plates so that many drugs and doses can be tested in parallel.
I believe this could be achieved by encapsulating commercially available DLBCL cell lines in a synthetic hydrogel functionalized with adhesion peptides, using 3D-printed molds and inserts to standardize each microtumor, and an automated liquid handler to dispense them reproducibly.
Part of the problem is how drugs are tested. Lymphoma cells are usually screened in 2D suspension culture, floating freely in medium. This ignores the lymph node microenvironment, where the extracellular matrix and adhesion signals activate survival pathways in lymphoma cells through integrin receptors. This phenomenon, known as cell adhesion-mediated drug resistance, means that 2D assays can overestimate drug efficacy. Tian et al. (2015) showed that integrin-binding hydrogels alter the proliferation and drug response of B-cell lymphoma cells compared with 2D culture, which suggests that a more realistic model could better identify drugs that will actually work.
My motivation is also personal: a close family member went through DLBCL. I am also based in Peru, where resources for biomedical research are limited and access to specialized equipment is difficult. Coming from biomedical engineering with experience in medical imaging, 3D printing, and design, this project is a way to enter cancer research using the skills I already have, while exploring how low-cost fabrication could make this type of research more feasible in resource-limited settings.
(2) What living system would you use?
The chassis would be mammalian cells, specifically commercially available human DLBCL cell lines such as SU-DHL-4 or OCI-Ly1. A human stromal cell line such as HS-5 could later be added to mimic the supportive cells of the lymph node.
The central process is cell encapsulation: lymphoma cells are mixed into a liquid hydrogel precursor, which is then solidified so that the gel forms around them and holds them in three dimensions. This approach suits DLBCL cells, which grow in suspension and do not naturally attach to scaffolds. Several hydrogels could be used, ranging from synthetic materials that can be precisely tuned and enriched with adhesion signals, to simpler and cheaper natural materials useful for early testing.
In broad terms, cells, culture medium, and hydrogel components go into the system. Inside the gel, the cells grow over a few days into small tumor-like aggregates, which are then exposed to different drugs. What comes out are 3D microtumors together with viability and imaging data that show how each drug affects the cancer cells.
This design rests on several assumptions. I use cell lines rather than patient cells because they are easier to obtain, more reproducible, and ethically simpler. I keep serum in the medium, although a serum-free formulation, like those discussed by Yap et al., would be a future improvement. Finally, I assume access to a laboratory with a biosafety cabinet and a CO₂ incubator through a collaboration.
(3) How could automation help you make it?
During prototyping, automation would combine three tools. The first is my Formlabs Form 4B resin printer. It would fabricate the custom hardware around them. This includes molds for casting agarose microwell arrays, in which suspension cells settle into uniform aggregates without ever touching the resin; rings that give each hydrogel droplet the same diameter and height; pillar lids with standard plate dimensions that allow gels to be transferred between plates; and adapters for the liquid handler and microscope. Parts in contact with cells would be printed in biocompatible BioMed resin, then washed, post-cured, leached, sterilized, and tested for cytotoxicity before use.
The second tool is an Opentrons liquid handler (OT-2 or Flex), which would automate the steps most prone to human error: dispensing the viscous cell-hydrogel mixture with identical volumes, preparing serial drug dilutions, and adding the viability reagent (CellTiter-Glo 3D, which measures ATP released by living cells). The third is automated microscopy combined with image analysis in Python, where my imaging background contributes most. Segmentation would measure microtumor size and shape as well as live/dead staining in every well.
The reason to automate these steps is reproducibility. Small differences in gel volume, cell number, or gel geometry could distort dose-response curves, and manual pipetting of hundreds of viscous droplets cannot be consistent.
flowchart TD
    subgraph A["A. Devices (Form 4B)"]
        A1["CAD design<br/>molds / inserts / adapters"] --> A2["Print in BioMed resin"]
        A2 --> A3["IPA wash + post-cure"]
        A3 --> A4["Leaching in PBS + sterilization"]
        A4 --> A5["Cytotoxicity test"]
    end
    subgraph B["B. Cells"]
        B1["Thaw DLBCL cell line"] --> B2["Suspension expansion<br/>~6 days"]
        B2 --> B3["Count and viability check"]
    end
    A5 --> C1
    B3 --> C1
    subgraph C["C. Encapsulation"]
        C1["Prepare hydrogel precursor<br/>+ adhesion peptide (RGD)"] --> C2["Mix cells with precursor"]
        C2 --> C3["Dispense with Opentrons<br/>10 µL per well"]
        C3 --> C4["Gelation<br/>chemical or light-triggered"]
        C4 --> C5["Add culture medium"]
    end
    C5 --> D["D. 3D maturation<br/>3 days, 37 °C, 5% CO₂"]
    D --> E["E. Drug treatment<br/>dilutions with Opentrons, 72 h"]
    E --> F["F. Readout<br/>automated imaging + CellTiter-Glo 3D"]
    F --> G["G. Analysis<br/>segmentation, dose-response curves, IC50<br/>2D vs 3D comparison"]
    G -.->|"Learn and redesign"| A1
    G -.->|"Adjust gel / cell density"| C1
The main output of the analysis is the IC50, the drug concentration that reduces viability by 50%. Comparing IC50 values between 2D and 3D cultures shows whether the hydrogel recovers the resistance that the lymph node environment confers.
(4) How much would you need to make, and how long would it take?
(a) How much?
I define a meaningful scale as a drug-repurposing screen of approved oncology drugs across a panel of DLBCL cell lines, large enough to produce a full dataset that could identify candidates for further study.
Parameter
Value
Source / assumption
Drugs
150
Similar to the NCI Approved Oncology Drugs set (~150–180 compounds)
Doses per drug
8
Standard dose-response design
Replicates
3
Statistical minimum
Cell lines
5
Covering the GCB and ABC molecular subtypes
Controls
+10%
Assumption (untreated and vehicle controls)
Cells per microtumor
5,000
Typical assumption for 3D models
Gel volume per well
10 µL
Assumption for 384-well plates
Each cell line requires 150 × 8 × 3 = 3,600 wells. Across five lines and including controls, the screen needs 3,600 × 5 × 1.1 ≈ 19,800 wells, equivalent to about 52 plates of 384 wells. At 5,000 cells per microtumor, this amounts to roughly 1 × 10⁸ cells (≈ 2 × 10⁷ per line) and about 200 mL of hydrogel. By comparison, a prototype on a single 96-well plate is about 200 times smaller, which explains why manual work is acceptable for prototyping while automation becomes essential at scale.
(b) How long?
Starting from a vial of about 2 × 10⁶ cells, each line must grow roughly 11-fold to reach 2.2 × 10⁷ cells (including a 10% margin). This requires log₂(11) ≈ 3.5 doublings, which at an assumed doubling time of ~40 hours takes about 6 days. At a typical density of 1 × 10⁶ cells/mL, each line needs about 22 mL of culture, or one to two T75 flasks, and all five lines can be expanded in parallel.
On a single Opentrons Flex, I estimate about 15 minutes per plate for seeding, 10 minutes for drug addition, and 10 minutes for the readout reagent. Across 52 plates this totals about 30 hours of robot time, or roughly four working days. Automated imaging at about one second per well adds around 6.5 minutes per plate, or about 6 hours overall. The biological steps, 3 days of 3D maturation followed by 3 days of drug exposure, overlap with seeding because plates are processed in staggered batches.
Altogether, the full screen would take about three weeks: 6 days of expansion, about 4 days of staggered seeding, 6 days of culture and treatment, and 1–2 days of readout and analysis. The bottleneck is biology rather than automation, so adding robots would barely shorten the timeline; faster-growing cells or shorter assays would have a much larger effect.
Prototyping and scale-up would look quite different. The prototype would use one cell line and one 96-well plate, Form 4B parts, and manual pipetting or an OT-2, taking about two weeks. It would test R-CHOP drugs in their active in vitro forms: doxorubicin, vincristine, 4-hydroperoxycyclophosphamide, and prednisolone, since cyclophosphamide and prednisone are prodrugs activated in the liver. Rituximab would be left for later, because it acts mainly through complement and immune cells that are absent from the gel. The full screen, in contrast, would run on a cloud lab or high-throughput platform with 384-well plates and commercial consumables.
(5) What don’t you know yet?
The first and most important unknown is whether the 3D model actually outperforms 2D culture. I do not yet know whether these microtumors reproduce clinically relevant drug resistance, or whether the difference from 2D is large enough to matter. To find out, I would compare 2D and 3D dose-response curves for the R-CHOP drugs and check them against published data for the same cell lines.
The second unknown concerns the Form 4B parts. Printed resin could release uncured residues that harm cells, and I do not know the smallest pillar or channel size I can print reliably. An extract cytotoxicity test based on ISO 10993-5 would address the first issue: printed parts are incubated in medium for 24 hours, cells are cultured in that medium, and their viability is compared with fresh medium. For resolution, I would print calibration parts with features of different sizes and measure how far they deviate from the CAD design.
The third unknown is whether robot-dispensed hydrogel can be made reproducible. Viscous gels may clog or gel inside pipette tips, and if gelation is too slow, cells sink before being trapped and lose their 3D distribution. I would measure the coefficient of variation in gel volume and cell number between wells, aiming for less than 15%, and compare fast chemical gelation (PEG-4MAL) with on-demand light-triggered gelation (GelMA), which allows more time for dispensing.
Beyond these three points, cell lines do not capture the diversity of real patients, and the model contains no immune cells. Later versions would need patient-derived cells and immune components to evaluate antibody therapies such as rituximab.
References
Tian, Y. F. et al. (2015). Integrin-specific hydrogels as adaptable tumor organoids for malignant B and T cell lymphomas. Biomaterials, 73, 110–119.
Yap, W. S., Choudhury, D. & Suntornnond, R. (2023). Towards biomanufacturing of cultured meat. Trends in Biotechnology, 41(3), 292–294.
Zhang, Y.-H. P., Sun, J. & Ma, Y. (2017). Biomanufacturing: history and perspective. J Ind Microbiol Biotechnol, 44, 773–784.
Figure 1: Ayda P (2022). Cell culture-fig.png. Wikimedia Commons.
AI
I used Claude (Anthropic, Claude Opus 5 model) through claude.ai. The main prompt, originally in Spanish, were:
“I need help to improve redaction to complete my homework. I am a biomedical engineer with experience in medical imaging and 3D printing… I want to research DLBCL… evaluate CAR-T vs. hydrogel encapsulation with microfluidics and, if they are too difficult, propose an alternative. Answer in markdown.”