See the nav bar on the left to look through my work for How To
Biomanufacture Almost Anything (Fall 2026)!
Subsections of ILKNUR ICKE — HTBAA Fall 2026
Week 1 HW: Final Project Ideas
Biomanufacturing Neural Organoids Toward Defined Functional Phenotypes
(1) What you would like to biomanufacture and why?
I would like to biomanufacture a biohybrid neural construct: a human cortical organoid grown inside an instrumented, skull-inspired microenvironment with integrated electrodes, perfusion, and programmable sensory input. The enclosure is a functional engineering abstraction that provides mechanical support, stable geometry, nutrient exchange, optical access, and a reproducible electrical interface to the developing tissue.
This project is motivated by a broader question: can we manufacture living neural tissue toward a desired function, rather than merely grow tissue and characterize whatever function emerges?
Cultured neural networks have demonstrated adaptive behavior when coupled to closed-loop virtual environments (Kagan et al., 2022). Building on this direction, Brainoware demonstrated reservoir computing with a human brain organoid coupled to a multielectrode interface (Cai et al., 2023). Subsequent work has rapidly advanced the surrounding enabling technologies for long-term 3D electrophysiology, automated culture, neuromodulation, and closed-loop learning (Yang et al., 2024; Voitiuk et al., 2025; Acha et al., 2026; Robbins et al., 2026).
A camera would not connect directly to the organoid as an artificial eye. Instead, a fixed encoder would convert simple visual stimuli into reproducible spatiotemporal electrical stimulation patterns delivered through the electrode interface. Electrical activity from the organoid would then be recorded and passed to a deliberately simple decoder, such as logistic regression. The key test is whether the living neural network transforms the input into a representation that becomes more separable after structured developmental experience than after random or no stimulation.
The same platform could later support applications beyond biological computing. Because it measures network excitability, synchrony, and response to stimulation over time, it could also become useful for developmental neuroscience, neurotoxicity studies, drug screening, and disorders of network dynamics such as epilepsy. I would treat epilepsy as a possible downstream application rather than the defining purpose of the first prototype.
(2) What living system would you use?
The biological manufacturing chassis would be human induced pluripotent stem cells (hiPSCs) differentiated toward a cortical neural lineage. The simplified biological process would be: hiPSCs -> embryoid-body-like aggregate -> neural progenitor tissue -> cortical organoid -> electrically active neural network.
The inputs would include hiPSCs, defined culture media, neural differentiation signals, extracellular-matrix support as needed, oxygen, controlled temperature and CO2, and a perfused nutrient environment. The cells would provide the self-organization process. The engineered device would provide the boundary conditions within which that self-organization occurs.
For a first implementation, I would use a standardized healthy cell line rather than a disease-specific line. Published cortical-organoid protocols commonly begin with approximately 9,000 pluripotent stem cells per aggregate in a 96-well low-attachment format; I use that value only as a back-of-the-envelope starting assumption for the scale calculation below (Pagliaro et al., 2023).
(3) How would you use automation?
Automation would operate at three levels: routine culture, continuous sensing, and closed-loop stimulation. At the prototype stage, a desktop liquid-handling platform such as an Opentrons system could automate media exchange, reagent addition, sampling, and plate-to-plate handling. A later version would replace repeated bulk media changes with programmable microfluidic perfusion inside each cranial-like chamber.
The second automation layer would measure the state of each construct. Environmental sensors would track variables such as temperature, pH, and oxygen. Imaging would track growth and morphology. The integrated electrodes would measure spontaneous activity, evoked responses, network bursts, and synchrony. These measurements would provide a longitudinal record of both biological health and neural network development.
The third layer would automate experience. A camera would observe a simple visual scene. Software would transform that scene into a fixed electrical encoding and deliver the resulting spatiotemporal pattern to selected electrodes. The system would then record the neural response.
The recorded neural response will be fed back to the stimulation controller, allowing subsequent stimulation patterns to adapt to the organoid’s evolving activity rather than following a fixed schedule. This creates a true closed-loop developmental environment in which the system can probe, reinforce, or modify stimulation based on measured functional responses over time.
Importantly, the decoder would remain intentionally simple so that task performance cannot be attributed mainly to a powerful software model around the organoid.
(4) How much would you need to make, and how long would it take?
4a. How much?
I would target 72 usable biohybrid neural constructs, divided into three groups of 24:
24 constructs receiving random stimulation matched for stimulation amount;
24 constructs receiving no sensory stimulation.
4b. How long?
For a first engineering estimate, I would assume approximately 60 days for neural differentiation and network maturation before the main functional test, followed by approximately 7 days of baseline recording and visual-discrimination experiments. Device preparation and cell seeding would require several additional days but could partially overlap with cell expansion and electrode fabrication. Therefore, I would estimate roughly 10 weeks for one complete manufacturing-and-test campaign after the instrumentation is available.
5. What don’t I know yet?
I am seeking a wet-lab partner with experience in cortical organoid culture, neural electrophysiology, or related tissue-engineering methods. Brain organoid manufacturing is not my primary area of expertise, so the biological feasibility, culture protocol, experimental scale, and quality-control criteria will need to be developed together with an experienced experimental group.
My contribution would focus on the system architecture: the closed-loop sensing and stimulation framework, experimental-control logic, computational analysis, functional readouts, and integration of the biological system with the intelligent-device platform. The wet-lab partner would provide the expertise needed to determine how the organoids should be produced, maintained, characterized, and safely interfaced with the stimulation and recording hardware.
An important early goal of the collaboration would be to translate the conceptual experiment into a biologically realistic protocol, including suitable organoid type and maturity, electrode-interface requirements, viability and quality-control measures, experimental duration, and the number of biological replicates required. The initial project could therefore begin with a small feasibility study before expanding to the larger comparative experiment described above.
I am particularly interested in partnering with a laboratory that sees value in studying whether controlled developmental experience and closed-loop stimulation can influence the emergence of reproducible functional phenotypes in neural tissue.
Given that, here are few initial unknowns I would need to explore:
Unknown 1: What functional specification should define a successful product?
A cortical organoid can produce electrical activity without performing useful information processing. I need to determine which metrics are meaningful: stimulus-response reproducibility, separability of two stimulus classes, temporal memory, plasticity, network synchrony, or another measure. The first project would likely use a simple visual discrimination benchmark and require performance above chance and above matched controls using the same fixed encoder and decoder.
Unknown 2: Can the bioelectronic enclosure measure and stimulate throughout development without changing the biology in an uncontrolled way?
The electrode geometry must provide stable signals while avoiding excessive mechanical stress, heating, electrochemical damage, or interference with nutrient and oxygen transport. KiriE demonstrates long-term conformal recording with preserved organoid architecture, and shell MEAs now demonstrate 3D neuromodulation, but neither result eliminates the need to test how enclosure geometry, perfusion, and chronic sensory stimulation interact during development (Yang et al., 2024; Acha et al., 2026).
Unknown 3: Can developmental inputs actually make function more reproducible?
The central hypothesis is that structured sensory experience can be treated as a manufacturing variable. That may be wrong. Differences between organoids may remain larger than the effect of the sensory curriculum, or the observed discrimination may arise mostly from the external decoder. The critical experiment is therefore a controlled comparison of structured stimulation, matched random stimulation, and no stimulation, while keeping the software encoder and decoder fixed.
Why this is a biomanufacturing problem
The central manufacturing idea is to expand the definition of a product specification for living neural tissue. In conventional organoid production, function is often measured after tissue has been generated. In this project, neural activity and response to controlled sensory inputs would become process measurements during development and, eventually, quality attributes of the manufactured construct. The long-term question is whether living neural systems can be manufactured toward function by controlling both their biochemical environment and their experience.
References
Acha, C., George, D., Diaz, L. C., et al. (2026). 3D neuromodulation in neural organoids with shell MEAs. Advanced Healthcare Materials, 15(11), e03773. https://doi.org/10.1002/adhm.202503773
Huang, Q., Tang, B., Romero, J. C., et al. (2022). Shell microelectrode arrays (MEAs) for brain organoids. Science Advances, 8(33), eabq5031. https://doi.org/10.1126/sciadv.abq5031
Kagan, B. J., Kitchen, A. C., Tran, N. T., et al. (2022). In vitro neurons learn and exhibit sentience when embodied in a simulated game-world. Neuron, 110(23), 3952-3969.e8. https://doi.org/10.1016/j.neuron.2022.09.001
Kopic, I., Dedousi, P., Schmidt, S., et al. (2024). Inkjet-printed 3D electrode arrays for recording signals from cortical organoids. Advanced Materials Technologies, 9(22), 2400645. https://doi.org/10.1002/admt.202400645
Pagliaro, A., Finger, R., Zoutendijk, I., et al. (2023). Temporal morphogen gradient-driven neural induction shapes single expanded neuroepithelium brain organoids with enhanced cortical identity. Nature Communications, 14, 7361. https://doi.org/10.1038/s41467-023-43141-1
Petzold, C. J., & Mukhopadhyay, A. (2025). From bench to biofactory: High-throughput technologies and automated workflows to accelerate biomanufacturing. Current Opinion in Biotechnology, 94, 103320. (Assigned course reading.)
Robbins, A., Schweiger, H. E., Hernandez, S., et al. (2026). Goal-directed learning in cortical organoids. Cell Reports, 45(2), 116984. https://doi.org/10.1016/j.celrep.2026.116984
Smirnova, L., Caffo, B. S., Gracias, D. H., et al. (2023). Organoid intelligence (OI): the new frontier in biocomputing and intelligence-in-a-dish. Frontiers in Science, 1, 1017235. https://doi.org/10.3389/fsci.2023.1017235
Voitiuk, K., Seiler, S. T., Pessoa de Melo, M., et al. (2025). A feedback-driven brain organoid platform enables automated maintenance and high-resolution neural activity monitoring. Internet of Things, 33, 101671. https://doi.org/10.1016/j.iot.2025.101671
Yang, X., Forro, C., Li, T. L., et al. (2024). Kirigami electronics for long-term electrophysiological recording of human neural organoids and assembloids. Nature Biotechnology, 42, 1836-1843. https://doi.org/10.1038/s41587-023-02081-3
AI use disclosure
I used OpenAI ChatGPT to brainstorm the concept, organize the response according to the homework questions, identify and compare relevant recent literature, and check the arithmetic in the back-of-the-envelope scale estimate. I reviewed and selected the final scientific assumptions, citations, and framing within the limitations of my knowledge in the field.
Representative prompt: “Help me draft HTBAA Homework #1 around a function-directed neural biomanufacturing system: human cortical organoids grown in an instrumented skull-inspired enclosure with integrated electrodes and camera-derived sensory stimulation. Keep epilepsy as a possible future application rather than the primary objective. Address what to make, the living system, automation, meaningful scale and timing, and the biggest technical unknowns.”
Representative literature prompt: “Find recent 2024-2026 peer-reviewed papers that are directly adjacent to this concept, especially work on 3D organoid electrodes, automated organoid culture, neural-organoid stimulation, and closed-loop learning. Distinguish what those papers demonstrate from what remains novel in the proposed biomanufacturing experiment.”
Week 2 HW: DNA Design
Exploratory optogenetic DNA design for cortical organoids
Ilknur Icke 29 September 2026
My HW1 organoid platform uses electrical stimulation and electrode recording as its baseline. For HW2, I designed a ChR2(H134R)–EYFP expression construct to explore an optional optical-input interface for the same cortical tissue. Adopting this interface would require a demonstrated experimental benefit. The saved V1 is a 6,225 bp circular reconstruction of Addgene plasmid #26973. Its sequence, assembly, codon-optimization comparison, sequence search, and safety screen have been checked in software. Expression and functional performance in organoids remain experimental questions.
Optogenetic design options considered
I considered four related genetic design options. Their labels identify questions about input delivery, expression timing, and activity-dependent gene expression. V1 is the only construct assembled and analyzed in Kernel. V2–V4 are ideas considered; they are not a required development sequence or a commitment for the final project.
V1 Reference optical input candidate. The hSyn promoter drives ChR2(H134R)–EYFP, providing a candidate blue-light input channel with a fluorescent expression readout. V1 asks whether a defined genetic module can make neurons optically addressable. This is the reference-based construct assembled and analyzed in Kernel. [2]
V2 Red-shifted input for three dimensional tissue. This proposal would replace the V1 actuator/reporter cassette with a red-shifted excitatory opsin such as ChrimsonR and a suitable reporter. It asks whether changing the optical input improves access and response uniformity across a 3D organoid. Any advantage over V1 would require measurement.
V3 Developmentally timed input. This proposal adds inducible control of opsin expression so that availability of the input channel can be studied at different maturation stages. The working architecture uses a TRE3G-controlled opsin cassette with the rtTA transactivator supplied by the host or a second cassette. Expression timing and background expression would need validation.
V4 Activity-responsive gene expression. This concept would connect neural activity to an activity-responsive regulatory element driving a reporter and, potentially later, a selected plasticity or developmental effector. It asks whether structured input can influence a lasting biological state. The regulatory sequence, output, and feedback behavior remain to be defined.
I selected V1 for this exploratory study because it has a traceable reference sequence and a manageable architecture. The final platform would adopt it only if testing justified the additional genetic and optical requirements. In the sequence comparisons, “baseline” means the unchanged Addgene reference; the platform baseline remains electrical stimulation. The codon-recoded sequence in Part 4 is a comparison within V1, not V2. V2–V4 have not been built or experimentally validated here.
Part 0 Kernel workspace
My work is in the HTGAA 2026 workspace, repository HTBAA26_Genspace, folder Ilknur Icke / HW2 / v1. I used the existing personal folder and retained the existing ChR2(H134R)-EYFP CDS part. Individual parts hold sequence and function records; the construct links them in their intended arrangement.
Connection to HW1. My HW1 project proposes manufacturing human cortical organoids toward defined functional phenotypes through controlled stimulation, recording, and culture conditions. Its baseline uses camera-derived electrical stimulation and electrode recording. HW2 explores a genetic optical-input alternative within that system. The design question is whether neurons could express a defined actuator to support controlled optical excitation. The larger manufactured product remains the organoid system, and electrical input remains the baseline unless a comparison establishes a reason to change it. [1]
Molecule and source. I selected the engineered humanized ChR2(H134R) protein fused at its C terminus to EYFP. The exact 1,662 bp CDS comes from Addgene #26973, full-sequence record 199313, bases 456–2117. It encodes 553 amino acids followed by a stop, including the source PAAAT linker. “Humanized” describes the engineered expression sequence, not a naturally occurring human gene. [2]
Host and destination. The intended expression host is neuronal cells within human iPSC-derived cortical organoids. Kernel’s selected host is Homo sapiens. The desired destination is the neuronal membrane, where ChR2 should mediate light-dependent electrical responses. EYFP supports expression and localization measurements. I retained the reference fusion without adding a secretion signal; membrane localization and activity will be tested rather than inferred from fluorescence alone.
Part 2 Genetic parts
All eight parts use exact segments of Addgene full-sequence record 199313. Each Kernel record contains its DNA, part type, source coordinates, and rationale. Coordinates below are 1-based and inclusive in the original source. The complete sequences are also preserved in the companion GenBank file and parts FASTA. [2]
Part
Kernel type
bp
Source bases
Reason for selection
hSyn promoter
Promoter
448
6190–6225; 1–412
Selects a neuronal expression context; its performance in the intended organoids remains to be measured.
5UTR-Kozak
5′ UTR with Kozak
43
413–455
Retains the reference upstream leader and the GCCACC sequence immediately before the CDS.
ChR2(H134R)–EYFP CDS
CDS with start and stop
1662
456–2117
Provides the intended optical actuator and fluorescent fusion, including ATG, PAAAT linker, and TAA.
CDS-WPRE junction
Miscellaneous
24
2118–2141
Preserves reference spacing after the stop codon; no separate regulatory role is assumed.
WPRE
3′ UTR
589
2142–2730
Retains the source posttranscriptional regulatory element as part of the baseline expression context.
WPRE-polyA junction
Miscellaneous
31
2731–2761
Preserves the reference junction before the polyadenylation region.
hGH polyA
Poly(A) signal
477
2762–3238
Provides the reference transcript 3′ processing context.
pAAV vector context
Backbone
2951
3239–6189
Retains both annotated AAV terminal repeats, bacterial replication and AmpR selection features, and intervening context.
Boundary and vector decisions
The promoter crosses the original plasmid origin, so its two annotated intervals are joined in the part record. The upstream part ends before ATG. The full Kozak annotation overlaps the first coding bases, which are included only in the CDS, avoiding duplication at the boundary. The upstream-part boundary is an operational design boundary, not a measured transcription start site.
The vector-context part is a composite region containing both terminal repeats and the bacterial backbone between them. Detailed annotations retain the individual features. The full plasmid length includes bacterial propagation sequences and must not be interpreted as the packaged AAV genome length. No new secretion tag or independent targeting sequence is added.
Part 3 Assembled construct
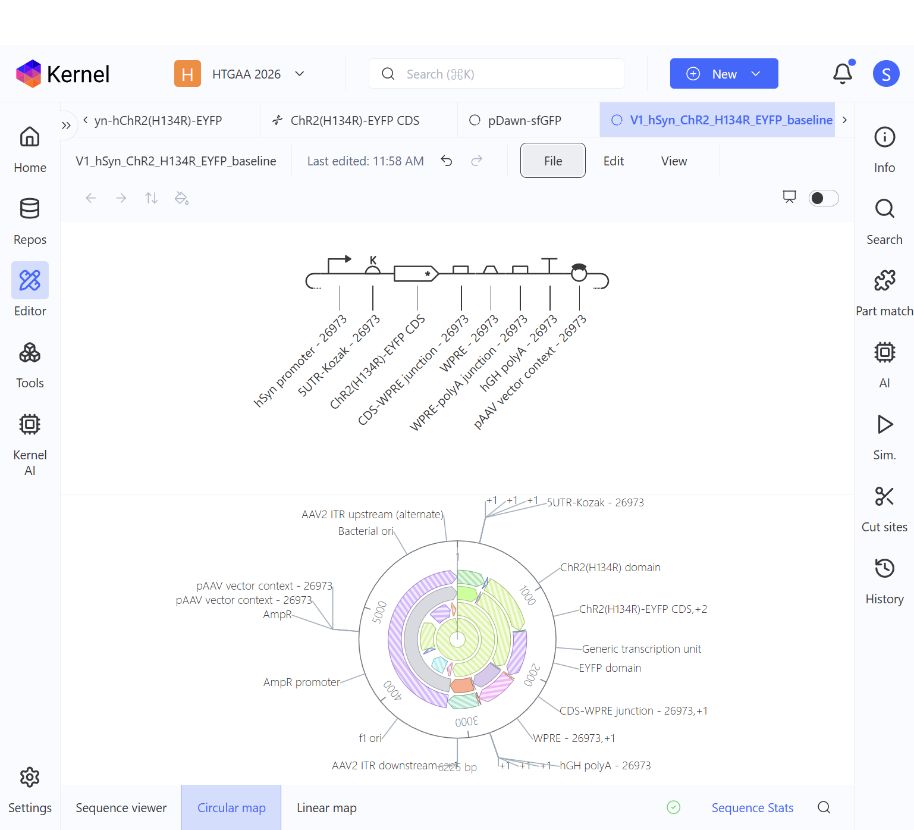
V1_hSyn_ChR2_H134R_EYFP_baseline contains the eight linked parts in the order shown below. The circular display origin is moved to source base 6190 to place hSyn first. Every source base is retained exactly once; the circular DNA sequence is unchanged.
The CDS occupies assembled bases 492–2153, starts with ATG, ends with TAA, has no internal stop codons, and retains R134 and the PAAAT linker. DNA copied back from Kernel matched the prepared 6,225 bp sequence exactly. The saved part links persisted after reload, and Kernel’s construct checker reported 0 errors and 0 warnings. The checker is separate from the SecureDNA screen in Part 4.
Figure 1. Saved Kernel schematic and circular map for V1. The schematic shows all eight linked parts; the bottom status area shows the construct-checker result. A screen capture is used because the raw schematic PNG export clipped its angled labels.
Part 4 Optimization and quality checks
Codon optimization
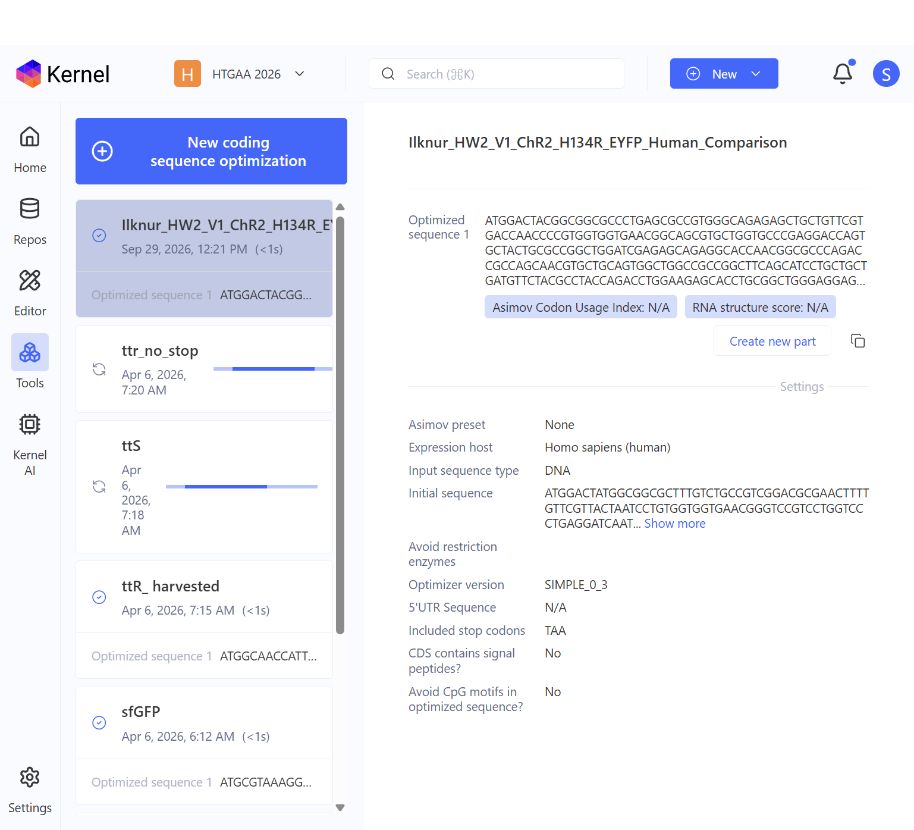
I ran Kernel SIMPLE_0_3 on the complete 1,662 bp CDS for Homo sapiens. Settings were no Asimov preset, no restriction-enzyme exclusions or additional avoided motifs, no 5′ UTR input, and no explicit GC target. Signal-peptide handling and CpG avoidance were off, and a single TAA stop was retained. The resulting DNA changed at 218 positions across 186 of 553 sense codons. Independent translation confirmed the same 553-amino-acid protein, with no internal stops. The metrics below were calculated from the actual input and output sequences. [3]
Measure
Source CDS
Optimized comparison
DNA length
1,662 bp
1,662 bp
Protein length excluding stop
553 aa
553 aa
GC content
57.04%
62.64%
Start and stop codons
ATG / TAA
ATG / TAA
Internal stops
0
0
Protein identity to source
Reference
100%
Codon preferences can influence expression in a host, but synonymous recoding alone does not establish a biological improvement. Kernel displayed N/A for both its Asimov Codon Usage Index and RNA structure score. I retained the source CDS in V1 and kept the recoded sequence as a separate candidate for an empirical comparison. Figure 2 records the completed run and settings. [3]
BLAST and sequence identity
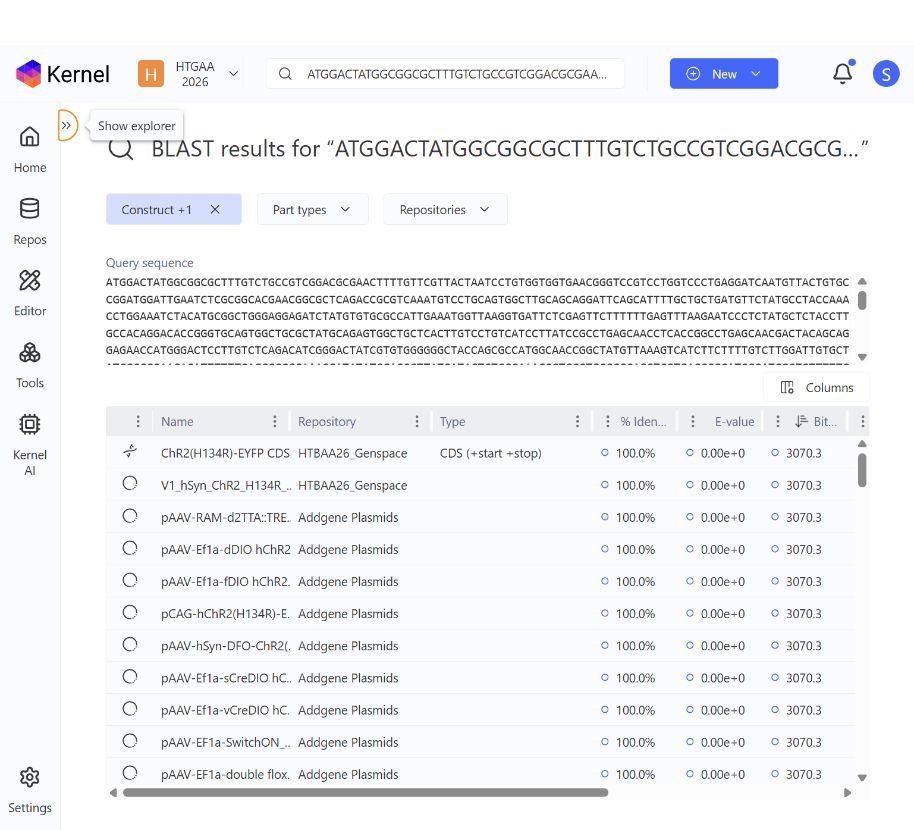
I searched the full baseline CDS against Kernel’s indexed constructs and parts, including Addgene Plasmids. The public pAAV-hSyn-hChR2(H134R)-EYFP reference was among several tied full-length matches: 100.0% identity, query bases 1–1662, subject bases 456–2117, bit score 3070.3, and displayed E-value 0.00e+0. This supports the identity and boundaries of the imported engineered fusion. It is an existing engineered sequence, not an unmodified natural gene or a newly invented CDS. The displayed E-value is limited by application precision. This was a search of Kernel’s indexed collections, not an exhaustive natural-genome or off-target analysis. Figure 3 shows representative results. [2]
Safety screen
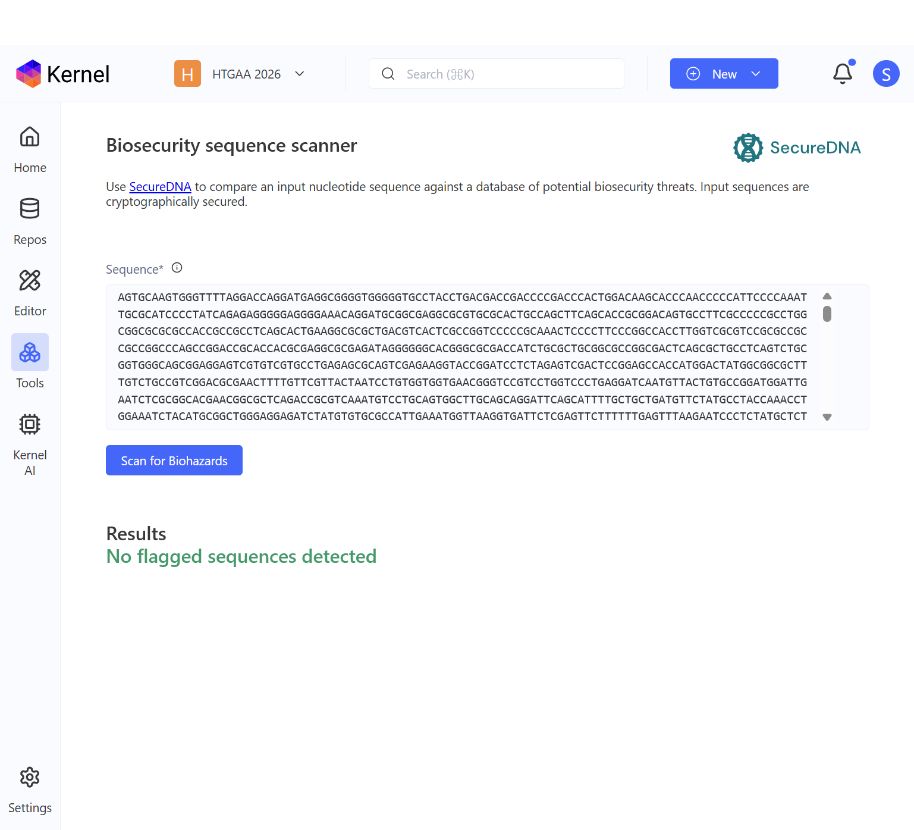
I screened the complete 6,225 bp baseline construct with Kernel’s SecureDNA tool. The submitted input matched the saved V1 exactly. The tool describes comparison against a database of potential biosecurity threats using cryptographically secured input. It returned “No flagged sequences detected.” That is the result for this sequence under the available screen; it does not establish cell health, delivery suitability, or experimental safety. The recoded comparison was not incorporated into this construct and was not part of this screen. Figure 4 records the result.
Part 5 From design to build
Build strategy
For the unchanged V1 prototype, I would obtain the existing Addgene #26973 reference plasmid through an appropriate laboratory and verify it against the saved sequence. Dividing the reference into reusable Kernel parts does not require resynthesizing every part. This is a direct route to the baseline whose sequence I analyzed. [2]
To test the recoded comparison, I would order its 1,662 bp CDS as sequence-verified synthetic DNA and replace the corresponding CDS in the existing vector context. The order would also need appropriate flanking assembly sequences, so its total length would exceed 1,662 bp. I would preserve the promoter, leader, WPRE, poly(A) region, and backbone, making synonymous CDS sequence the intended variable. Exact fragment boundaries and overlaps remain to be designed before ordering.
Gibson et al. describe assembly of overlapping DNA fragments through combined exonuclease, polymerase, and ligase activities. I would apply this principle to a small number of physical fragments for the CDS replacement. The eight Kernel parts are functional design modules and do not dictate eight separate synthesis or assembly fragments. [4]
Synthesis constraints and verification
The 448 bp hSyn promoter is 71.21% GC, calculated from the saved sequence. The CDS changes from 57.04% GC to 62.64% GC after recoding, and the vector contains annotated inverted terminal repeats. I would flag these GC-rich and repetitive regions for supplier review. These are sequence features requiring attention, not observed synthesis failures or vendor rejection results. I would preserve functional promoter and terminal-repeat sequences and reuse the existing context where possible.
If the recoded CDS cannot be supplied as one verified fragment, smaller fragments are a fallback after sequence review. I would verify the finished plasmid across the CDS, junctions, regulatory regions, and terminal repeats using methods that resolve those regions adequately.
Carr et al. used mismatch-binding MutS to reduce errors in synthetic DNA. Their result motivates treating synthesis fidelity separately from successful assembly. Error reduction can improve the input material, but final sequence verification is still needed. I would review the supplier’s documented quality checks rather than assume every provider uses this specific method. [5]
Prototype and scale
An optical-input pilot would use one verified reference and, if justified, one verified recoded comparison. Only if that pilot supported adopting optical input would I plan DNA or delivery-vector production at the scale of the HW1 experiment. That production would require documented identity, quality, and lot consistency. More organoids using the same design would require more material and consistent delivery, not a different synthetic gene for each organoid.
An oligo pool would add complexity to this small comparison; it could become useful for a future large library of distinct designs. Required DNA or delivery-vector quantity remains uncertain until delivery method, organoid stage, and pilot requirements are established. The 6,225 bp plasmid includes bacterial backbone sequence. Delivery selection and any later vector production require separate specifications; no serotype or vector-production process has been finalized here.
Part 6 Unknowns and proposed tests
Expression in the intended neurons
If V1 advances to an experimental pilot, delivery, maturation, and cell composition could produce variable hSyn-driven expression within the organoids. I would quantify the fraction of neuronal-marker-positive cells with EYFP signal, per-cell signal distribution, its location across depth, and its stability over time, alongside cell health. If signal is weak, measurements of delivery and transcript abundance would help distinguish failure to reach the cells from failure to express the cassette.
I would compare source and recoded CDS versions under matched conditions before adopting the optimized output. The unchanged protein sequence and higher GC content do not demonstrate an expression benefit. If an optical-input pilot revealed a need to control when the opsin is expressed, V3 would be an optional follow-up, requiring measurements of background expression and induction timing.
Membrane localization and useful light responses
EYFP fluorescence does not by itself prove functional channel activity. I would examine membrane-associated localization, measure light-evoked currents or firing in individual cells, and then use multielectrode-array recordings to assess organoid responses. The readouts would include response probability, latency, repeatability, and changes during repeated stimulation.
Controls would include V1-expressing tissue without stimulation and expression-negative tissue receiving the same light exposure. I would compare functional responses and health alongside fluorescence, rather than select the brightest construct automatically.
Reproducible input across a three dimensional organoid
Responses may vary with tissue depth and geometry even if individual cells express a functional opsin. Repeated illumination or sustained expression could also change baseline activity or tissue health. I would map expression and evoked responses by location, track their stability over time, and measure viability, spontaneous firing, and network-burst patterns before and after repeated stimulation.
Expression-negative/light-exposed and expression-positive/unstimulated controls would help separate optical exposure from construct-related effects. If the optical approach warranted further work but tissue access limited responses, V2 and illumination geometry would be possible comparisons. V3 would be considered separately if sustained expression proved limiting. Neither extension is assumed necessary for the organoid platform.
The HW1 comparison of structured, matched-random, and no stimulation can proceed with electrical input. V1 would merit adoption only if a comparison showed a useful benefit relative to the additional delivery and optical requirements. Demonstrating light-evoked responses alone would not establish improved organoid function. Acceptance criteria and replication would be set with an experimental collaborator. V4 remains an exploratory question about activity-responsive gene expression, outside the current implementation.
References and AI disclosure
[1] Icke, I. (2026). Week 1 HW Final Project Ideas. Biomanufacturing Neural Organoids Toward Defined Functional Phenotypes. HW1 project page
[2] Addgene. pAAV-hSyn-hChR2(H134R)-EYFP, plasmid #26973, deposited by Karl Deisseroth. Sequence source: Addgene full-sequence record 199313. Plasmid record
[3] Asimov Kernel. Codon Optimization documentation. Actual run settings and results are recorded in Part 4 and Figure 2. Kernel documentation
[4] Gibson, D. G., Young, L., Chuang, R.-Y., Venter, J. C., Hutchison, C. A. III, and Smith, H. O. (2009). Enzymatic assembly of DNA molecules up to several hundred kilobases. Nature Methods 6, 343–345. Assigned reading. doi:10.1038/nmeth.1318
[5] Carr, P. A., Park, J. S., Lee, Y.-J., Yu, T., Zhang, S., and Jacobson, J. M. (2004). Protein-mediated error correction for de novo DNA synthesis. Nucleic Acids Research 32, e162. Assigned reading. doi:10.1093/nar/gnh160
AI use
I used OpenAI ChatGPT and Codex to develop the V1–V4 design discussion, organize the homework, assist with Kernel and Addgene browser operations, calculate sequence comparisons, and draft this write-up.
Sequence and analysis records
The exact DNA is available in the linked Kernel construct and the companion V1_hSyn_ChR2_H134R_EYFP_baseline.gb and parts.fasta files. Part 4 metrics were independently calculated from the source and exported optimized CDS; the optimized sequence was not adopted into V1.
Run: Ilknur_HW2_V1_ChR2_H134R_EYFP_Human_Comparison. The completed tool output shows Homo sapiens, SIMPLE_0_3, a single TAA stop, and N/A for the displayed codon-usage and RNA-structure scores. GC percentages and change counts in Part 4 were computed independently.
Figure 2. Completed optimization run with the selected host and settings. The recoded CDS remains a separate comparison output.
Appendix Sequence search evidence
The query was the complete 1,662 bp baseline CDS. The screenshot shows representative top matches at 100.0% identity. The original pAAV-hSyn-hChR2(H134R)-EYFP reference was also present in the rendered results, with query bases 1–1662 and subject bases 456–2117; it is below the visible rows in this screenshot.
Figure 3. Kernel BLAST results for the baseline CDS. Several records share the highest score; this screenshot does not establish a total hit count.
Appendix Safety screening evidence
The screened sequence was the complete 6,225 bp saved V1 baseline. A local sequence comparison verified that the submitted input matched that construct exactly.
Figure 4. SecureDNA returned “No flagged sequences detected” for V1. This is a sequence-screening result, not a functional or experimental-safety assessment.
I initially submitted one reaction composition for each target: sfGFP, PETase/TfCut2 and Reteplase. My first round uses small changes to tested course references. After comparing the proposals with the published experiments, I decided to emphasize what each experiment could teach us, as well as its possible cost benefit. I then submitted a fourth design to test a different glutathione balance in the Reteplase reaction. Its recipe and experimental question are below.
Course action
Status
B1: required target designs
Three submitted: one per target
Additional Reteplase design
Submitted; glutathione-balance follow-up below
B2: community reagent
FkpA upvote confirmed
B3: discussion access
Confirmed
Experimental outcomes
No results for these candidates confirmed
Optional plasmid work
Deferred
The answers below were prepared with AI assistance and checked against the cited sources. Preparing the text does not replace being able to explain the reasoning at recitation. Assignment brief · Course builder.
A1 · Why do salt concentrations differ, and which is more sensitive?
Potassium and magnesium concentrations differ because each formulation creates a different chemical environment. Potassium helps support the ionic conditions needed for protein–nucleic acid interactions. Magnesium supports the translation machinery and binds nucleotides and other metabolites, so changing the energy system, nucleotide concentrations or lysate can change the magnesium requirement. Added magnesium is not the same as free magnesium.
In the PANOx-SP salt titration, magnesium was more sensitive over the concentrations tested: increasing magnesium glutamate from 20 to 24 mM reduced relative CAT expression from 1.00 to 0.73, whereas increasing potassium glutamate from 175 to 200 mM reduced it from 1.00 to 0.94. These are separate titrations with different concentration scales. They support adjusting magnesium carefully, rather than assuming a universal optimum. The Table II titration values exclude extract carryover; the extract supplies approximately another 3.3 mM magnesium and 14.4 mM potassium. Jewett & Swartz (2004), Table II and its footnotes, journal p. 22.
For a new reaction, I would retest magnesium when changing the energy or nucleotide formulation. The CAT experiment explains why this matters; it does not establish the optimum for sfGFP, TfCut2 or Reteplase.
A2 · How does PEP + NTP differ from ribose + NMP?
PEP + NTP starts with nucleotide triphosphates (ATP, CTP, GTP and UTP), which supply RNA building blocks; ATP and GTP also support energy-consuming steps. PEP provides a phosphate-containing energy substrate to help replenish ATP. With ribose + NMP, the starting nucleotides have one phosphate rather than three. The lysate must turn them into usable triphosphates, supported by its metabolism and the full energy mixture.
Olsen et al. (2026), Results and Figure 2, found sustained ATP in their optimized formulation without added ATP. That system was more sensitive to reaction geometry and oxygen supply. Their work shows that a cheaper nucleotide strategy can work, but a one-for-one ingredient swap would not recreate it (https://www.nature.com/articles/s41467-026-69605-8#Fig2).
I would first establish a PEP/NTP baseline and then compare a separately specified ribose/NMP formulation using the documented course stocks and base-buffer contributions. The comparison should use the same protein, lysate batch, vessel and assay. The useful economic result is cost per functional protein output, so lower reagent prices alone would not decide the winner.
A3 · Compare two published compositions
I compared PANOx-SP from Jewett and Swartz with Olsen’s RFopt. They both provide an E. coli extract with the materials needed to make protein, but they make different choices about how to supply energy and RNA building blocks.
Selected ingredient
PANOx-SP (2004)
RFopt (2026)
Magnesium glutamate
20 mM
8 mM
Potassium glutamate
175 mM
362 mM
Main listed energy substrates
PEP, 33 mM
Ribose, 50 mM; glucose, 10 mM
Supplied nucleotides
ATP, 1.2 mM; CTP/GTP/UTP, 0.85 mM each
AMP, 3 mM; CMP/GMP/UMP, 2.15 mM each
Amino-acid supply
2 mM each of 20 amino acids
5 mM each in the published amino-acid mixture
HEPES
0 mM in Table I
75 mM
Inorganic phosphate mixture
Not specified in the selected composition
15 mM total
Selected supporting ingredients
Spermidine, 1.5 mM; putrescine, 1 mM; sodium oxalate, 2.7 mM
Nicotinamide, 4 mM
Extract fraction
24% by volume
30% by volume
The numbers come from Jewett & Swartz (2004), Table I and Methods, PDF p. 2 and Olsen et al. (2026), Table 1, Methods and Supplementary Tables 1–2. This table focuses on the ingredients most relevant to the comparison; the cited papers contain the complete formulations. The salt entries above are the named formulation inputs. PANOx-SP also carries 3.3 mM magnesium acetate and 14.4 mM potassium acetate from the extract. A magnesium-glutamate value alone therefore does not describe all the magnesium in the reaction, and none of these values measures free magnesium.
PANOx-SP supplies RNA-ready triphosphates and uses PEP as an energy substrate. RFopt starts with monophosphates, which have fewer phosphate groups. The reaction’s metabolism must convert them into the triphosphates used for RNA production. Ribose, glucose and phosphate are parts of that whole system. I would not reproduce RFopt by swapping only PEP for ribose in an otherwise unchanged PANOx-SP reaction.
RFopt uses less magnesium glutamate and more potassium glutamate in the listed additions. That shows why an ingredient’s concentration should be considered with the rest of the mixture. Its higher HEPES concentration is another substantial change. PANOx-SP also includes NAD, coenzyme A, folinic acid and added tRNA in its Methods recipe. An ingredient absent from RFopt’s listed additions can still be present in the extract; absence from a recipe is not proof that the reaction never needs that molecule.
Olsen reports reagent costs of $143 per litre of reaction, or $60 per gram of sfGFP, for RFopt under the paper’s pricing and yield assumptions. Those prices exclude DNA and lysate. I cannot calculate a fair cost advantage over the 2004 PANOx-SP recipe without pricing both recipes on the same basis.
The experiments also differ: Jewett and Swartz used CAT and A19-derived extract at 37 °C, whereas Olsen’s standard experiments used sfGFP and a different extract at 30 °C for 20 hours. Their vessels and volumes also differ. I therefore conclude that RFopt offers a documented alternative way to supply nucleotides and energy, rather than claiming that this table proves which recipe will work best for the homework’s proteins.
These are the published formulations; the course’s PEP and ribose references use its own stocks, fixed inputs and experimental conditions. Olsen’s PANOx-SP comparison column also differs from the original 2004 recipe, so I do not use it to assign a modern price to the original formulation.
B1 · The initial three submitted designs
Each reaction totals 20,000 nL. It contains 5,000 nL lysate, 2,000 nL target DNA and 2,000 nL fixed base buffer. Reagent additions and water occupy the remaining 11,000 nL. Every transfer is a whole multiple of 25 nL.
The documented base buffer contributes 200 mM potassium glutamate, 2.6 mM magnesium glutamate, 30 mM HEPES and 1 mM of each of the 17 amino acids, plus tyrosine and cysteine. The concentrations below add the specified buffer contribution to the supplemental stock contribution. They do not measure free magnesium or all molecules carried in lysate. Recipes use PEP mono at 100 mM, not the separate 500 mM cyclohexylammonium stock. Course inventory and reference recipes.
Question: Does reducing magnesium increase functional sfGFP output in the glucose-free ribose/NMP formulation?
Change: Magnesium stock 225 → 175 nL; water 175 → 225 nL. Documented magnesium glutamate decreases from 8.225 to 6.975 mM.
Component
Stock
Volume (nL)
Documented concentration
Lysate (fixed)
Fixed course input
5,000
See fixed-input notes
DNA template (fixed)
Fixed course input
2,000
See fixed-input notes
Base buffer (fixed)
Fixed course input
2,000
See fixed-input notes
Potassium glutamate
875 mM
3,325
345.46875 mM
Magnesium glutamate
500 mM
175
6.975 mM
Amino acids (17; each)
50 mM each
1,600
5 mM each
HEPES-KOH (pH 7.5)
1,000 mM
900
75 mM
Phosphate (monobasic:dibasic 1.6:1)
500 mM
600
15 mM
Ribose
666.09 mM
1,500
49.95675 mM
Nicotinamide
100 mM
800
4 mM
AMP
100 mM
600
3 mM
CMP
100 mM
425
2.125 mM
GMP
100 mM
425
2.125 mM
UMP
100 mM
425
2.125 mM
Nuclease-free water
—
225
—
Total
20,000
What the previous experiments leave open. Magnesium had already been varied in the RFopt series. A prior 175 nL magnesium condition also contained different potassium, glucose and ribose additions. No exact match for this complete candidate was found in the currently published sfGFP control plate. This is a follow-up in a particular formulation, not a claim that magnesium optimization is new.
Planned comparison. Compare the candidate with the unchanged glucose-free reference on the same experimental run, using matched lysate, geometry and sfGFP maturation time. Include a no-DNA blank and a suitable fluorescence calibration; replicate each condition if the course run permits.
How I would interpret it. Higher calibrated fluorescence would support this lower-magnesium setting in the tested mixture. Lower fluorescence would favor retaining the reference amount. Neither outcome measures free magnesium or identifies whether transcription, translation, folding or maturation caused the difference.
Question: Can half the supplied DsbC dose retain useful TfCut2 activity?
Change: DsbC stock 1,000 → 500 nL (5 → 2.5 µM); water 1,225 → 1,725 nL. All other additions are unchanged.
Component
Stock
Volume (nL)
Documented concentration
Lysate (fixed)
Fixed course input
5,000
See fixed-input notes
DNA template (fixed)
Fixed course input
2,000
See fixed-input notes
Base buffer (fixed)
Fixed course input
2,000
See fixed-input notes
Magnesium glutamate
500 mM
300
10.1 mM
Ammonium glutamate
1,000 mM
200
10 mM
Amino acids (17; each)
50 mM each
400
2 mM each
HEPES-KOH (pH 7.5)
1,000 mM
550
57.5 mM
Phosphoenolpyruvate (PEP)
100 mM
6,000
30 mM
Folinic acid
10 mg/mL
50
0.025 mg/mL
Coenzyme A
50 mM
100
0.25 mM
NAD
100 mM
75
0.375 mM
Putrescine
500 mM
50
1.25 mM
Spermidine
250 mM
125
1.5625 mM
Potassium oxalate (site: Oxalic acid)
500 mM
150
3.75 mM
DsbC
100 µM
500
2.5 µM
ATP
100 mM
250
1.25 mM
CTP
100 mM
175
0.875 mM
GTP
100 mM
175
0.875 mM
UTP
100 mM
175
0.875 mM
Nuclease-free water
—
1,725
—
Total
20,000
What the previous experiments leave open. Every experimental well in the published PETase control plate contained 1,000 nL DsbC. The plate therefore does not answer whether 500 nL is sufficient in this PEP formulation.
Planned comparison. Compare 2.5 µM with the unchanged 5 µM reference in the same run. A later zero-DsbC arm would help establish whether the helper is needed at all. Use matched blanks, the course soluble-ester assay and the same assay handling. Match the DsbC carrier where possible.
How I would interpret it. Similar activity with less DsbC would support reducing that stock input. A substantial activity loss would argue against the cut. The DsbC line item is halved, but total reaction cost is not. Soluble-ester hydrolysis does not establish PET-plastic degradation or a protein mass yield.
Question: Can a 25% reduction in DsbC retain useful activity while the glutathione mixture is held fixed?
Change: DsbC stock 1,000 → 750 nL (5 → 3.75 µM); water 625 → 875 nL. GSSG remains 4.0375 mM and GSH remains 1 mM.
Component
Stock
Volume (nL)
Documented concentration
Lysate (fixed)
Fixed course input
5,000
See fixed-input notes
DNA template (fixed)
Fixed course input
2,000
See fixed-input notes
Base buffer (fixed)
Fixed course input
2,000
See fixed-input notes
Magnesium glutamate
500 mM
225
8.225 mM
Ammonium glutamate
1,000 mM
200
10 mM
Amino acids (17; each)
50 mM each
400
2 mM each
HEPES-KOH (pH 7.5)
1,000 mM
550
57.5 mM
Phosphoenolpyruvate (PEP)
100 mM
6,000
30 mM
Folinic acid
10 mg/mL
50
0.025 mg/mL
Coenzyme A
50 mM
100
0.25 mM
NAD
100 mM
75
0.375 mM
Putrescine
500 mM
50
1.25 mM
Spermidine
250 mM
125
1.5625 mM
GSSG (oxidized glutathione)
170 mM
475
4.0375 mM
GSH (reduced glutathione)
100 mM
200
1 mM
Potassium oxalate (site: Oxalic acid)
500 mM
150
3.75 mM
DsbC
100 µM
750
3.75 µM
ATP
100 mM
250
1.25 mM
CTP
100 mM
175
0.875 mM
GTP
100 mM
175
0.875 mM
UTP
100 mM
175
0.875 mM
Nuclease-free water
—
875
—
Total
20,000
What the previous experiments leave open. Every experimental well in the published Reteplase control plate retained 1,000 nL DsbC, 475 nL GSSG and 200 nL GSH. Neither reduced-DsbC candidate is present in that dataset.
Planned comparison. Compare 3.75 µM with the unchanged 5 µM reference in the same DSB-compatible lysate and run. Use the course IPR-AMC assay with matched no-DNA background and product calibration. Soluble target measurement and active-enzyme recovery controls would help interpret an activity difference.
How I would interpret it. Retained activity would support this smaller helper dose in the tested conditions. Lost activity could erase any reagent saving. The experiment does not establish therapeutic performance or demonstrate that all nine disulfides formed correctly.
No protein-output prediction is assigned to these recipes. The sfGFP assay can be calibrated to folded protein concentration; the PETase and Reteplase assays measure product formation or activity, which is not itself a protein mass. Reducing DsbC by 50% or 25% reduces that stock input by the corresponding fraction, not the total reaction cost by that fraction.
The draft guideline prices and live-site cost display are not reconciled. In particular, the live display changed the cost of identical fixed inputs with the selected reference, and PEP/oxalate pricing was unresolved in the local model. I therefore do not report those displays as validated total costs or claim a cost-per-gram improvement. That conclusion requires a consistent cost model and measured functional output.
What I changed in my approach
At first I selected conservative variations of the course references. That made the set easy to describe, but two proposals asked the same broad question about DsbC dose. A small change can still be informative: DsbC was held fixed in the published enzyme screens. I now make the question, comparison and interpretation explicit, and have submitted a fourth design to investigate a different redox question. More ingredients would not automatically mean more learning; one-factor tests can also miss interactions between ingredients.
The prior-test audit covered the currently published control plates: sfGFP_control_20260722-39-L, PETase_control_20260722-39-L, reteplase_control_20260730-DSB, with 312 experimental wells per target. It does not establish novelty across every historical experiment or other students’ proposals. Published course data.
Submitted October 6, 2026:ilknur_icke_2026-10-06_reteplase_pep_glutathione_balance_v1. The course site confirmed this as a separate fourth design; the original three submissions remain in place. No experimental results have been confirmed for this candidate.
Question: Does a less oxidized added glutathione mixture improve Reteplase activity when DsbC and the rest of the PEP reference are held fixed?
Component
Unchanged course reference
Submitted follow-up
GSSG stock, 170 mM
475 nL → 4.0375 mM
350 nL → 2.975 mM
GSH stock, 100 mM
200 nL → 1 mM
625 nL → 3.125 mM
DsbC stock, 100 µM
1,000 nL → 5 µM
1,000 nL → 5 µM
Water
625 nL
325 nL
Total reaction
20,000 nL
20,000 nL
The added glutathione-monomer equivalents are equal: [GSH] + 2[GSSG] = 9.075 mM in both mixtures. This holds the number of glutathione units fixed while redistributing reduced and oxidized forms; it does not hold solute-particle concentration fixed or determine actual redox potential. The alternative changes the GSSG and GSH stock additions together as one planned contrast. All other additions match the course reference.
I would compare this alternative directly with the unchanged reference in the same DSB-compatible lysate and run, with matched background, calibration and replication. Higher activity would support the alternative for the tested mixture. Lower activity would suggest that its more reduced input was unfavorable under those conditions. An unchanged result would not prove that redox conditions never matter. Additional soluble-target and assay-interference measurements would be needed to separate effects on protein production, folding, stability and measurement.
I upvoted the existing FkpA (E. coli chaperone) suggestion by Xiangtao Shi on October 6, 2026. The course site confirmed the vote; its button changed to “Remove your vote.”
I chose FkpA to investigate whether folding support beyond DsbC can improve active Reteplase production. Groff and colleagues added purified FkpA alongside DsbC in an E. coli cell-free antibody system and observed improved soluble protein and assembled IgG. That gives a reason to test complementary folding support, but it does not establish a benefit for Reteplase. Groff et al. (2014), Figures 3–4.
The proposed comparison is the unchanged Reteplase reference with and without FkpA, keeping DsbC, glutathione and other ingredients fixed and matching the additive’s carrier. Activity and, if available, soluble and total target protein would be measured. An additive-only assay control would help detect a direct effect on the readout. Increased activity alone would establish a formulation effect, not prove that proline isomerization was the limiting step.
FkpA is a community inventory suggestion. It is not included in any of the four submitted recipes. A usable stock concentration, reagent identifier, price and handling conditions would be needed before making a dispensing recipe.
B3 · Forum access
I can access the cfps-coopetition discussion channel. No bonus optimization post has been sent. One useful question for a later discussion is whether the reference and candidate can be run together with the same lysate batch and assay conditions, so their differences are easier to interpret.
C · Optional plasmid assignments
The optional T7-compatible expression plasmids and helper plasmid are deferred. No plasmid design, construction or laboratory validation is claimed.
AI assistance and prompts
I used Codex (OpenAI) to generate and compare simulated undergraduate, graduate, senior-scientist and wet-lab-expert perspectives, check sources and reaction arithmetic, and prepare this page. The perspective labels describe AI-generated examples, not human contributors. The examples were later revised together using the course inventory. I selected designs from three different examples and then shifted the emphasis toward unanswered experimental questions. Codex carried out the four recipe submissions and the FkpA upvote with my authorization. No new laboratory experiment or measured yield is claimed. Exact model versions were not recorded.
References
Jewett & Swartz (2004). Mimicking the Escherichia coli cytoplasmic environment activates long-lived and efficient cell-free protein synthesis.DOI: 10.1002/bit.20026. Tables I–II and Methods.
Olsen et al. (2026). Design-driven optimization of low-cost reagent formulations for reproducible and high-yielding cell-free gene expression.Published paper. Table 1, Figure 2, Methods and Supplementary Tables 1–2.
Groff et al. (2014). Engineering toward a bacterial “endoplasmic reticulum” for the rapid expression of immunoglobulin proteins.Full text. Figures 3–4; DOI: 10.4161/mabs.28172.