Mohammed Irfan — HTBAA Fall 2026
About me
Hello! My Name is Mohammed Irfan <3
Contact info
Homework, Labs, and Projects
See the nav bar on the left to look through my work for How To Biomanufacture Almost Anything (Fall 2026)!
Hello! My Name is Mohammed Irfan <3
See the nav bar on the left to look through my work for How To Biomanufacture Almost Anything (Fall 2026)!
I propose to biomanufacture Cardiovascular-Optimized Cultivated Beef, a cultivated meat product whose nutritional composition is intentionally engineered rather than simply reproducing that of conventional beef.
The goal is to produce beef with a more favorable fatty-acid profile, particularly a higher proportion of omega-3 polyunsaturated fatty acids (PUFAs), while also incorporating β-carotene as an antioxidant and potential provitamin A source.
Conventional livestock production gives us some ability to influence this composition through animal genetics, breeding, and diet, but these approaches are constrained by the biology of the whole animal. Cultivated meat presents a different possibility. Instead of raising an entire animal and accepting the resulting biochemical composition of its tissues, we can potentially engineer the cells responsible for producing the meat. This creates the possibility of treating meat as a programmable biological product. My motivation is therefore to explore whether metabolic engineering can be used not only to manufacture meat without raising an entire animal, but also to design the nutritional properties of the meat itself.
The eventual product would be intended for consumers who want to continue eating beef while seeking a product with an intentionally modified nutritional profile. I would envision it as a food designed to offer a potentially more favorable fatty-acid composition than conventional beef.
What makes this idea particularly interesting to me is that it goes beyond simply replacing conventional meat production with cell culture and combines cultivated meat, metabolic engineering, and automated biomanufacturing. The same general approach could eventually be extended beyond fatty acids and β-carotene to engineer other nutritional, sensory, or functional properties of meat. My long-term vision is therefore a manufacturing platform in which meat is not simply grown, but biologically programmed according to the properties we want the final food to have.
I would use genetically engineered bovine muscle progenitor cells as the living manufacturing system.
These cells would first be expanded in culture and then differentiated into muscle cells to produce cultivated beef.
The overall process can be represented as:
Engineered bovine cells → cell Proliferation → muscle differentiation → cultivated beef
I would introduce two main metabolic modules into the bovine cells.
The first module would contain an omega-3 desaturase such as FAT-1 from Caenorhabditis elegans. FAT-1 can convert several omega-6 fatty acids into their corresponding omega-3 fatty acids.
Conceptually:
Omega-6 PUFA → FAT-1 → corresponding omega-3 PUFA
The purpose of this modification would be to shift the fatty-acid composition of the cells toward a higher omega-3/omega-6 ratio.
FAT-1 alone would not necessarily produce large amounts of EPA or DHA. If specific long-chain omega-3 fatty acids were required, additional elongation and desaturation enzymes could be incorporated into the pathway.
The second module would introduce a β-carotene biosynthetic pathway using enzymes such as CrtB, CrtI, and CrtY.
In simplified form:
Cellular precursors → CrtB → phytoene → CrtI → lycopene → CrtY → β-carotene
This would allow the engineered cells to synthesize β-carotene internally rather than relying entirely on β-carotene supplied through the culture medium.
The β-carotene would potentially provide both nutritional value and antioxidant activity. This is particularly relevant because increasing the amount of unsaturated fatty acids could also increase the susceptibility of the resulting meat to lipid oxidation.
The major inputs to the system would be engineered bovine cells and cell-culture medium containing the nutrients required for cell growth and metabolism.
The cells would use these nutrients to proliferate, produce biomass, carry out the engineered metabolic reactions, and eventually differentiate into muscle tissue.
The desired outputs would therefore be:
At a high level:
flowchart TD
    A["Bovine Cells + Nutrients"] --> B["Cell Proliferation"]
    B --> C1["FAT-1 Pathway<br/>(Altered fatty-acid composition)"]
    B --> C2["CrtB / CrtI / CrtY Pathway<br/>(β-Carotene production)"]
    C1 --> D["Muscle Differentiation"]
    C2 --> D
D --> E["Cardiovascular-Optimized Cultivated Beef"]A major assumption is that these additional metabolic pathways can be introduced without substantially compromising the ability of the bovine cells to grow and differentiate.
The engineered pathways will require cellular resources and metabolic precursors that would otherwise be used for normal cell functions. Excessive expression could therefore create a metabolic burden, reduce growth rate, or interfere with muscle differentiation.
This would need to be experimentally tested by comparing engineered and unmodified bovine cells for growth rate, viability, differentiation capacity, fatty-acid composition, β-carotene production, and lipid oxidation.
The initial objective would therefore not be to immediately produce large quantities of meat, but to identify an engineered cell line that can maintain healthy growth while producing the desired nutritional changes.
I would use automation primarily during the development and optimization of the engineered bovine cell line.
A platform such as an Opentrons liquid-handling robot could automate cell seeding, media addition, reagent transfer, sampling, and preparation of multiple experimental conditions in parallel.
This would allow many combinations of genetic constructs, gene-expression levels, media compositions, and culture conditions to be tested simultaneously.
The main advantage of automation would be the ability to rapidly screen many engineered cell populations.
For example, different levels of FAT-1 expression could be tested to determine how strongly they alter the omega-3/omega-6 ratio while maintaining acceptable cell growth.
Similarly, different levels of β-carotene pathway expression could be tested to determine whether β-carotene production can be increased without creating excessive metabolic burden.
The resulting cell populations could be screened for:
Automation would make these experiments more reproducible and reduce the amount of manual laboratory work required.
The automation technology used during development would be different from the technology used for large-scale manufacturing.
At manufacturing scale, I would use automated stirred-tank bioreactors equipped with sensors and control systems.
These systems could continuously monitor and control parameters such as Temp, pH, DO etc
Automated sampling could also periodically collect small samples for measurements of fatty-acid composition, β-carotene concentration, cell growth, and product quality.
Ultimately, automation would allow the biological manufacturing process to move from manually optimized laboratory experiments toward a reproducible and scalable production system.
To define a meaningful manufacturing scale, I would target enough Cardiovascular-Optimized Cultivated Beef to supply the annual beef consumption of 10,000 people.
The USDA Economic Research Service projects U.S. beef availability at approximately 60.0 lb per person per year in 2026. I use this value as a proxy for annual beef consumption. USDA ERS
First, I convert this value to kilograms:
60.0 lb/person/year × 0.453592 kg/lb = 27.22 kg/person/year
For 10,000 people:
27.22 kg/person/year × 10,000 people = 272,200 kg/year
Therefore, my target manufacturing scale is approximately:
272,200 kg/year ≈ 272 tonnes/year
This calculation assumes that one kilogram of cultivated beef would replace one kilogram of conventional beef.
I would initially target a ground-meat-like cultivated beef product rather than a fully structured steak. This is important because current large-scale cultivated-meat models primarily describe the production of animal-cell biomass rather than fully structured whole cuts.
To estimate the infrastructure required, I use a 2026 process model by Brenner et al. The model describes a 20,000 L stirred-tank reactor operating at a maximum cell density of approximately 5 × 10⁷ cells/mL and producing approximately 2,000 kg of biomass per 30.7-day batch. Brenner et al., 2026
The approximate number of batches that one reactor could complete per year is:
(365 days) / (30.7 days/batch) = 11.89 batches/year
Therefore, the theoretical annual output of one reactor would be:
11.89 batches/year × 2,000 kg/batch
= 23,780 kg/reactor/year
or approximately 23.8 tonnes per reactor per year.
The same model reports a maximum biomass concentration of approximately 105 g/L.
For a 20,000 L reactor:
20,000 L × 105 g/L = 2,100,000 g
= 2,100 kg
This is consistent with the model’s approximately 2,000 kg biomass output per batch.
The theoretical number of reactors required to produce 272,200 kg/year is:
(272,200 kg/year) / (23,780 kg/reactor/year) = 11.45
Therefore, at least:
12 reactors
would be required under ideal continuous operation.
However, real facilities would require time for cleaning, sterilization, maintenance, reactor turnaround, and potential downtime.
To account for this, I would use approximately 13 parallel 20,000 L production reactors as the practical estimate.
This gives some additional production capacity rather than designing the facility to operate at exactly 100% of its theoretical capacity.
A single 20,000 L reactor would produce approximately 2,000 kg every 30.7 days.
If only one reactor were available, the number of batches required to produce the full annual target would be:
(272,200 kg) / (2,000 kg/batch) = 136.1 batches
The corresponding production time would be:
136.1 batches × 30.7 days/batch
= 4,178 days
or approximately:
11.4 years
This demonstrates why a single large reactor would not be sufficient for the proposed scale.
Instead, multiple reactors would operate in parallel. With approximately 13 reactors, production could be distributed across the reactors so that different batches are continuously entering, growing, harvesting, and undergoing downstream processing.
Under the simplified assumptions, this would provide enough capacity to produce approximately 272 tonnes of cultivated beef per year, corresponding to the annual beef consumption of 10,000 people.
Several assumptions are required for this back-of-the-envelope calculation.
Reactor performance: I assume that the engineered bovine cells can eventually achieve performance comparable to the cells represented in the published 20,000 L process model.
Batch productivity: I use approximately 2,000 kg of biomass per 30.7-day batch as the primary manufacturing benchmark.
Downtime: The theoretical calculation assumes continuous operation, while the practical estimate of 13 reactors provides some additional capacity for cleaning, maintenance, and other downtime.
Engineered-cell performance: The most important assumption is that introducing the FAT-1 and β-carotene pathways does not substantially reduce cell growth, viability, or differentiation efficiency.
The published process model itself does not represent every step required to manufacture a commercial steak. In particular, differentiation, tissue maturation, and structured tissue formation introduce additional engineering challenges.
This scale also illustrates why automation is important. Producing hundreds of tonnes of engineered cultivated meat would require automated monitoring, feeding, sampling, quality control, and coordination across many parallel bioreactors rather than relying on manual operation.
Sources:
Brenner et al. (2026) — Decoding cultured meat manufacturing: a full process model to identify scale-up bottlenecks.
This is the primary source for the 20,000 L reactor, 105 g/L biomass concentration, ~2,000 kg/batch, and 30.7-day production cycle.
https://www.frontiersin.org/journals/nutrition/articles/10.3389/fnut.2026.1844185/full
USDA Economic Research Service (2026) — Projected 60.0 lb/person/year beef availability.
https://ers.usda.gov/data-products/charts-of-note/114196
Risner et al. (2019) — Independent cultivated-meat bioprocess calculation estimating approximately $2.9 \times 10^{11}$ (2.9 × 10¹¹) muscle cells per kg of wet cultivated meat, useful as a sanity check on the enormous cell numbers involved.
https://www.frontiersin.org/journals/sustainable-food-systems/articles/10.3389/fsufs.2019.00044/full
There are several important technical uncertainties that would need to be resolved before this concept could become a practical manufacturing process.
The biggest unknown is how introducing the FAT-1 and β-carotene pathways will affect bovine cell growth and differentiation.
These pathways will consume cellular resources, metabolic precursors, and energy. This could create a metabolic burden and cause the cells to grow more slowly or differentiate less efficiently.
I would compare engineered and unmodified cells for growth rate, viability, and differentiation efficiency.
FAT-1 may shift the omega-6/omega-3 balance, but it may not produce high levels of specific long-chain omega-3 fatty acids such as EPA or DHA on its own.
Similarly, introducing CrtB, CrtI, and CrtY does not guarantee that enough β-carotene will accumulate.
I would therefore measure the omega-3/omega-6 ratio, individual fatty acids, β-carotene concentration, and lipid oxidation to determine whether the engineering produces the intended nutritional profile.
Performance in a small culture vessel may not translate directly to a large bioreactor.
Large-scale cultivation introduces challenges such as oxygen transfer, nutrient gradients, mixing, pH control, and waste accumulation.
The engineered cells would therefore need to be tested progressively from small cultures to larger bioreactors while monitoring their growth and metabolic performance.
Increasing unsaturated fatty acids could make the final product more susceptible to lipid oxidation.
Although β-carotene is intended to provide antioxidant protection, I do not yet know whether the amount produced would be sufficient.
This would need to be tested during processing, storage, and cooking.
The three most important questions are:
The first major experiment would therefore compare engineered and unmodified bovine cells under identical conditions.
If the engineered cells maintain similar growth and differentiation while producing more omega-3 PUFAs and β-carotene, the concept would have a strong foundation for further scale-up.
My work is located in the HTBAA 2026 workspace, in the repository Mohammed Irfan B under the folder HW_2
What molecule are we expressing?
My HW1 product beef muscle tissue enriched in omega-3 fatty acids and pre-loaded with β-carotene is not itself a single molecule we can express. Instead, we are engineering the bovine muscle progenitor cells to produce the enzymes that synthesize these two components. This gives us five target proteins, organized into two functional modules:
Module 1 — Omega-3 enrichment (1 enzyme):
Module 2 — β-carotene biosynthesis (4 enzymes, one pathway):
What is the sequence?
| Gene | Protein | Accession | Organism |
|---|---|---|---|
| fat-1 | ω-3 fatty acid desaturase | UniProt Q9NEQ0 | Caenorhabditis elegans |
| crtE | Geranylgeranyl pyrophosphate synthase | GeneBank BAA14124.1 | Pantoea ananatis |
| crtB | 15-cis-phytoene synthase | GeneBank BAA14128.2 | Pantoea ananatis |
| crtI | Phytoene desaturase | GeneBank BAA14127.1 | Pantoea ananatis |
| crtY | Lycopene β-cyclase | GeneBank BAA14126.1 | Pantoea ananatis |
What host or chassis?
Bovine (Bos taurus) muscle progenitor cells (satellite-cell derived), consistent with our HW1 cultivated meat platform. Kernel’s codon optimization tools do not include a Bos taurus table so I used GenSmart (GenScript), which does support Bos taurus.
Where does the product need to go?
My host is eukaryotic (bovine muscle progenitor cells), so I designed against the eukaryotic column of the parts table. My construct has two independent expression units — one for FAT-1, one for the four-gene β-carotene cassette — both carried on a single PiggyBac vector
Unit 1: FAT-1 (omega-3 desaturase)
| Layer | Part | Source | Justification |
|---|---|---|---|
| Promoter | EF1α | BBa_25GHPWMW │ https://registry.igem.org/parts/bba-25ghpwmw | I chose EF1α because it resists silencing over passage and stays active through both proliferation and differentiation, which matters since I need sustained expression as progenitor cells mature into muscle. |
| 5′ UTR / Kozak | Kozak consensus | GCCACC | - |
| CDS | fat-1 (+start, +stop) | UniProt Q9NEQ0 (C. elegans), codon-optimized for Bos taurus | This is my sole enzyme for the omega-3 module. |
| Targeting | None | — | |
| Terminator | Human BGH polyA | BBa_M50476 (from Kernal) | This cleanly ends the FAT-1 transcript and is a standard, well-characterized mammalian polyA signal. |
Unit 2 : β-carotene biosynthesis
| Layer | Part | Sequence / source | Justification |
|---|---|---|---|
| Promoter | CMV | BBa_26G9KUXQ │ https://registry.igem.org/parts/bba-26g9kuxq | The CMV promoter is a strong constitutive mammalian promoter that drives high-level transcription of downstream genes in a wide range of mammalian cells synthesis and risks recombination. |
| Kozak | Kozak consensus | GCCACC | - |
| CDS 1 | crtE (+start, -stop) | https://www.ncbi.nlm.nih.gov/nuccore/D90087.2/ | GGPP synthase — boosts the cell’s GGPP pool beyond what native prenylation (GGPS1) supplies, feeding the carotenoid pathway. |
| Linker 1 | P2A | BBa_K4877010 (from Kernal) | Self-cleaving peptide that lets one mRNA produce four separate proteins without a proteolytic cleavage step. |
| CDS 2 | crtB (-start, -stop) | UniProt A0ACE3JQ15, codon-optimized | Phytoene synthase — converts GGPP to phytoene. No independent start/stop; it continues the same open reading frame after the ribosome skip. |
| Linker 2 | T2A | BBa_K4877011 (from Kernal) | A second, sequence-distinct 2A, chosen deliberately different from P2A so the construct doesn’t contain two identical linker repeats. |
| CDS 3 | crtI (-start, -stop) | https://www.ncbi.nlm.nih.gov/nuccore/D90087.2/ | Phytoene desaturase — converts phytoene to lycopene. |
| Linker 3 | E2A | BBa_K4877012 | Keeps all three linkers in this chain non-identical, for the same repeat-avoidance reasoning as above. |
| CDS 4 | crtY (-start, +stop) | https://www.ncbi.nlm.nih.gov/nuccore/D90087.2/ | Lycopene β-cyclase — the final step, producing β-carotene. |
| Terminator | SV40 late polyA | BBa_K5316011 │ https://registry.igem.org/parts/bba-k5316011 | Ends this unit’s transcript. I used a different polyA from bGH (Unit 1) for the same repeat-avoidance reason as the promoters. |
Vector backbone (shared, not part of either expression unit)
| Layer | Part | Source | Justification |
|---|---|---|---|
| Backbone | ColE1 origin + AmpR | Existing PiggyBac donor vector | Needed only to propagate and select the plasmid in E. coli during cloning — this part never enters the bovine genome. |
| Flanking ITRs | PiggyBac 5′ and 3′ terminal repeats | 3’ : https://parts.igem.org/Part:BBa_K426004 4’: https://parts.igem.org/Part:BBa_K426001 | These are the transposase recognition sites; everything between them, including both expression units, gets excised and integrated into the Host genome . |
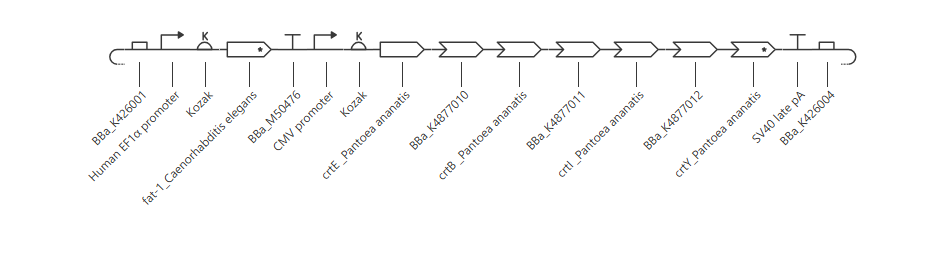
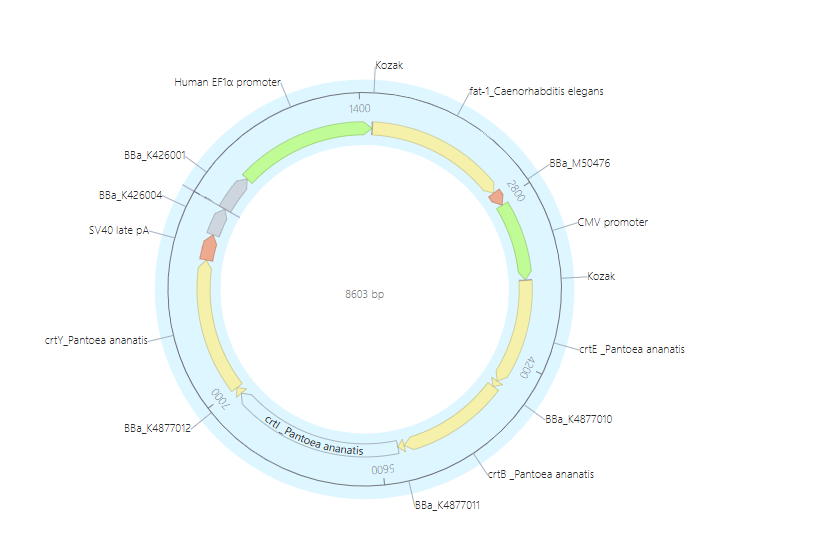
I assembled my construct, by joining the FAT-1 unit and the β-carotene unit together inside a single PiggyBac vector, flanked by the 5′ and 3′ terminal repeats. Both units run in the same direction, with the FAT-1 cassette first, followed by the four-gene crtE-2A-crtB-2A-crtI-2A-crtY cassette, all sitting inside a backbone that carries the origin of replication and ampicillin resistance needed to grow the plasmid in E. coli.
Before finalizing, I checked that the reading frame stays intact all the way through the β-carotene chain — one start codon at the beginning of crtE, one stop codon at the end of crtY, and no stray stops hiding at any of the three 2A junctions in between, since a stop codon there would have cut off translation early and left the downstream enzymes unmade. The FAT-1 cassette was simpler to check, since it’s a single self-contained gene with its own start and stop.
Linear View
Circular View
Codon optimization
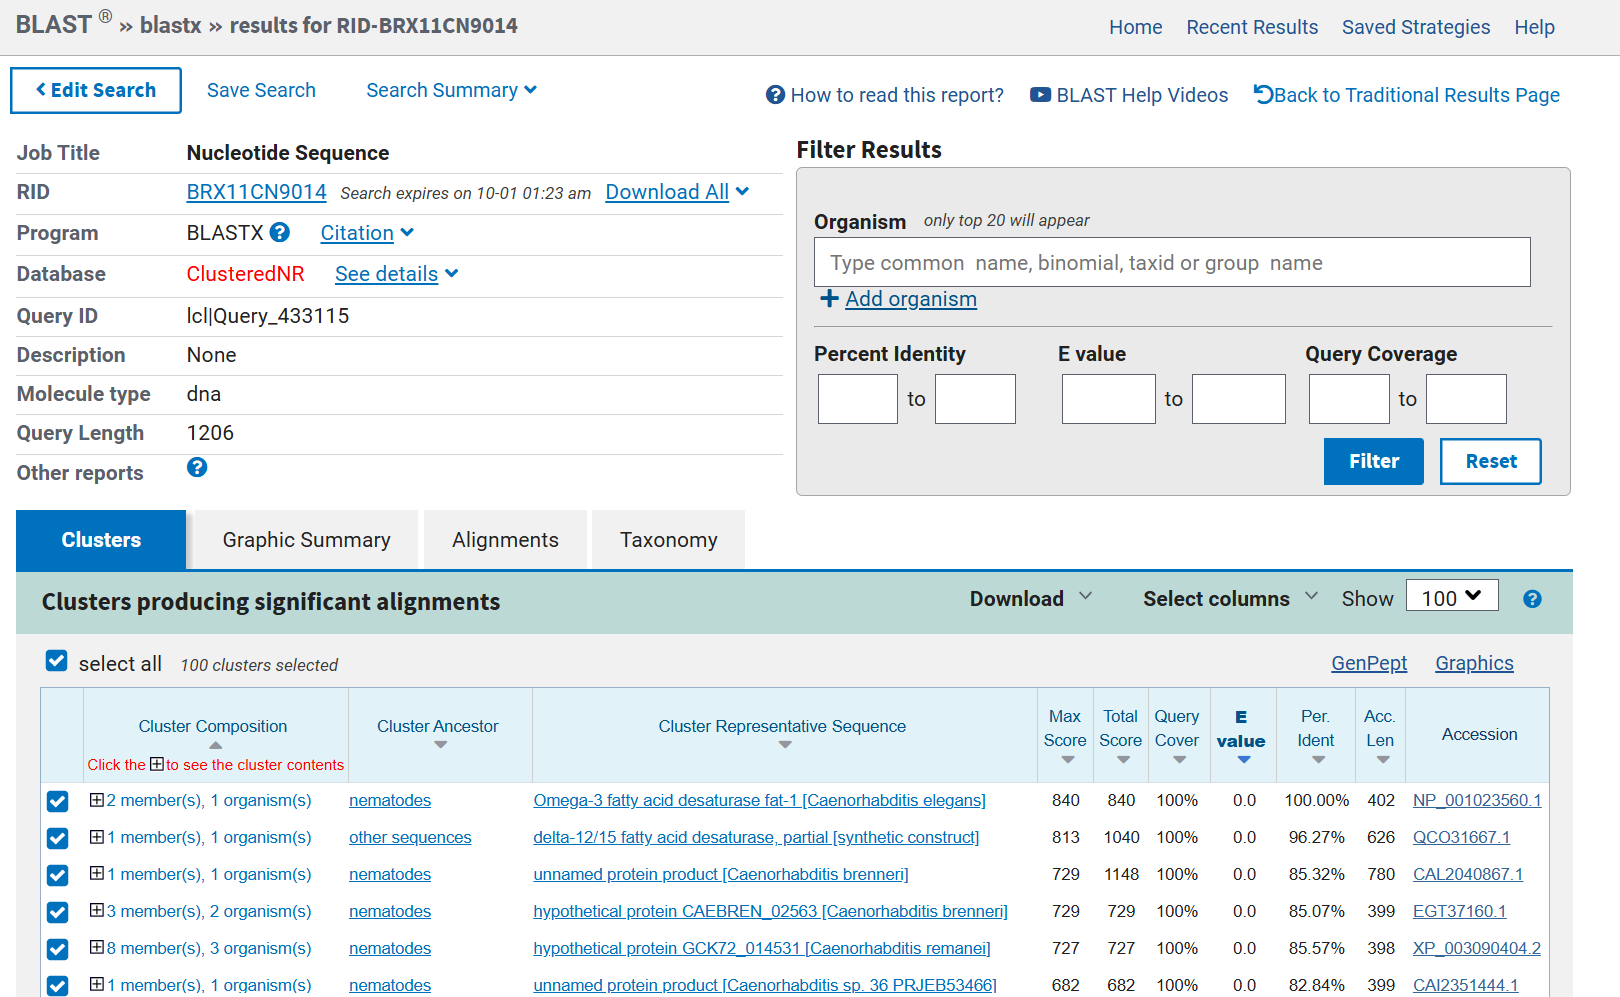
For codon optimization, I used GenScript’s GenSmart tool rather than Kernel’s built-in optimizer, because GenSmart offers Bos taurus directly as a host option, while Kernel did not have a bovine codon table available. I input the protein sequences for all five genes (fat-1, crtE, crtB, crtI, crtY), taken from their respective UniProt entries, rather than the native nucleotide sequences from C. elegans and P. ananatis. This was a deliberate choice: since my goal was bovine-optimized DNA, starting from the protein and letting GenSmart reverse-translate it directly against the Bos taurus codon table is more direct than optimizing the native bacterial/nematode DNA, which would carry over codon biases from the wrong organism as a starting point.
One consequence of this approach is that I don’t have a true “before” DNA sequence to compare against for GC content or length — there was no original bovine-context DNA sequence to begin with, only the source organism’s native gene, which isn’t a meaningful baseline for codon usage in a mammalian host. So rather than reporting a before/after GC-content shift, I’m reporting the output GC content of each optimized sequence directly:
Fat-1: 57.46%
crtE: 64.34%
crtB: 64.08%
crtI: 61.52%
crtY: 63.79%
All five stayed within or near the typical mammalian coding-sequence range (roughly 55-65% GC), which is what I’d expect from bovine-optimized output. Base pair length did not change relative to each protein’s amino acid count (length = 3 × number of residues, +3 for a stop codon where applicable), confirming the optimization only reassigned codons and did not insert or delete any coding content.
Fat-1
crtE
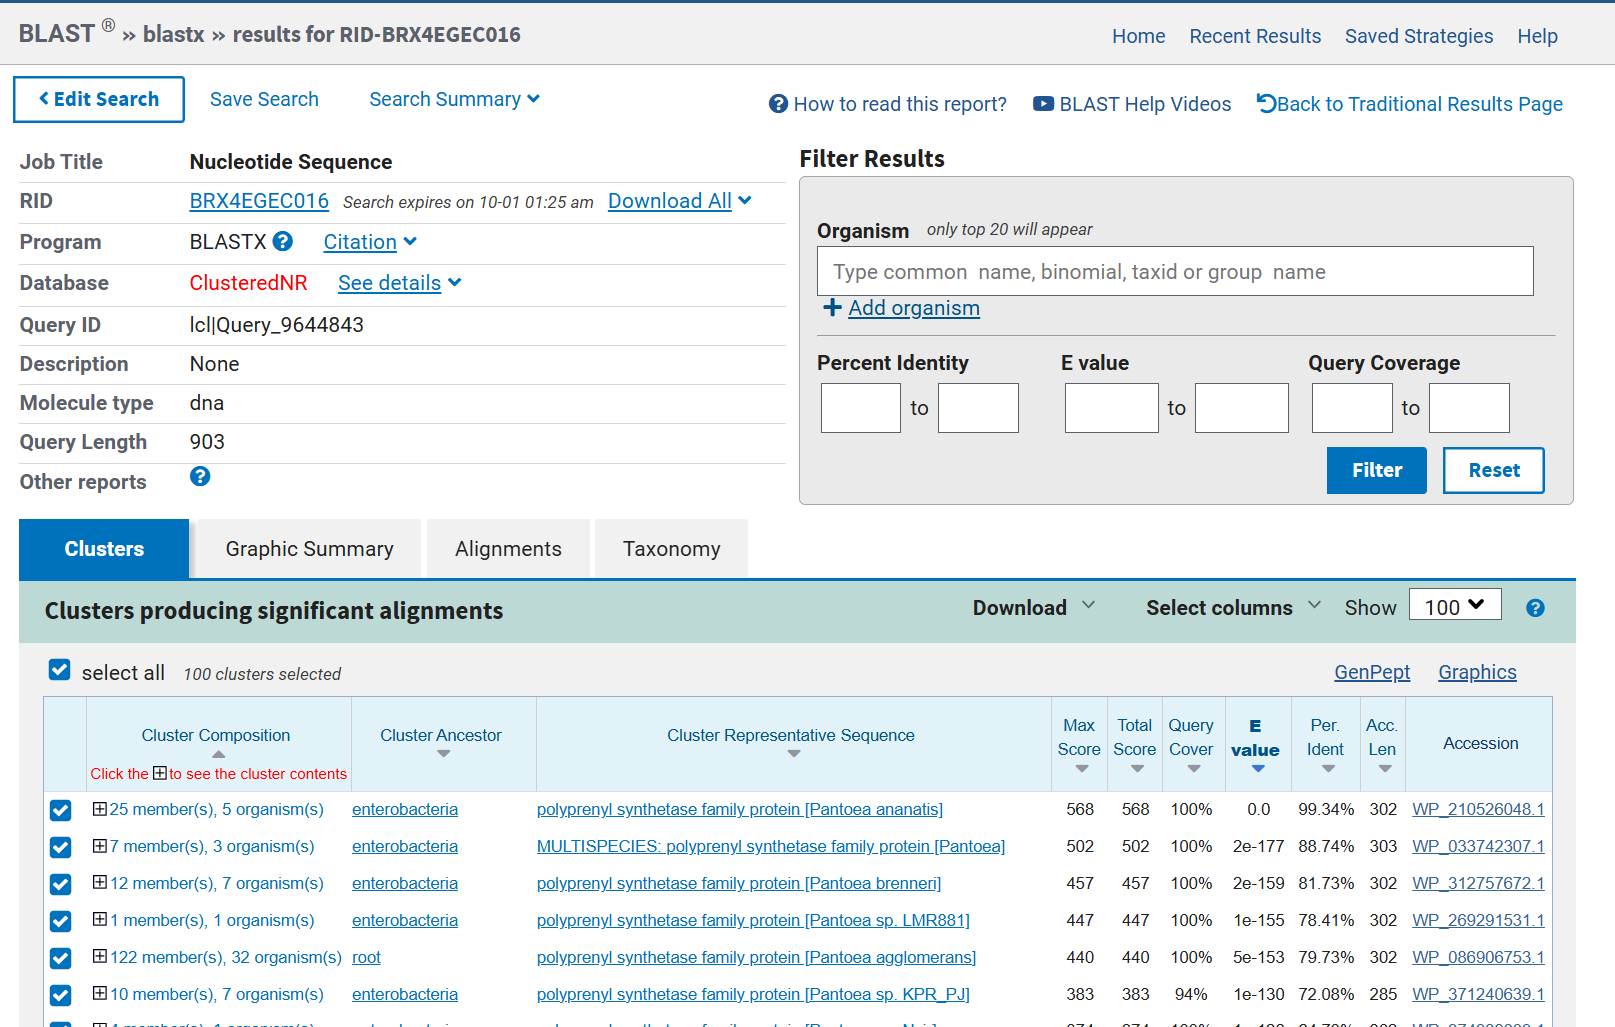
crtB
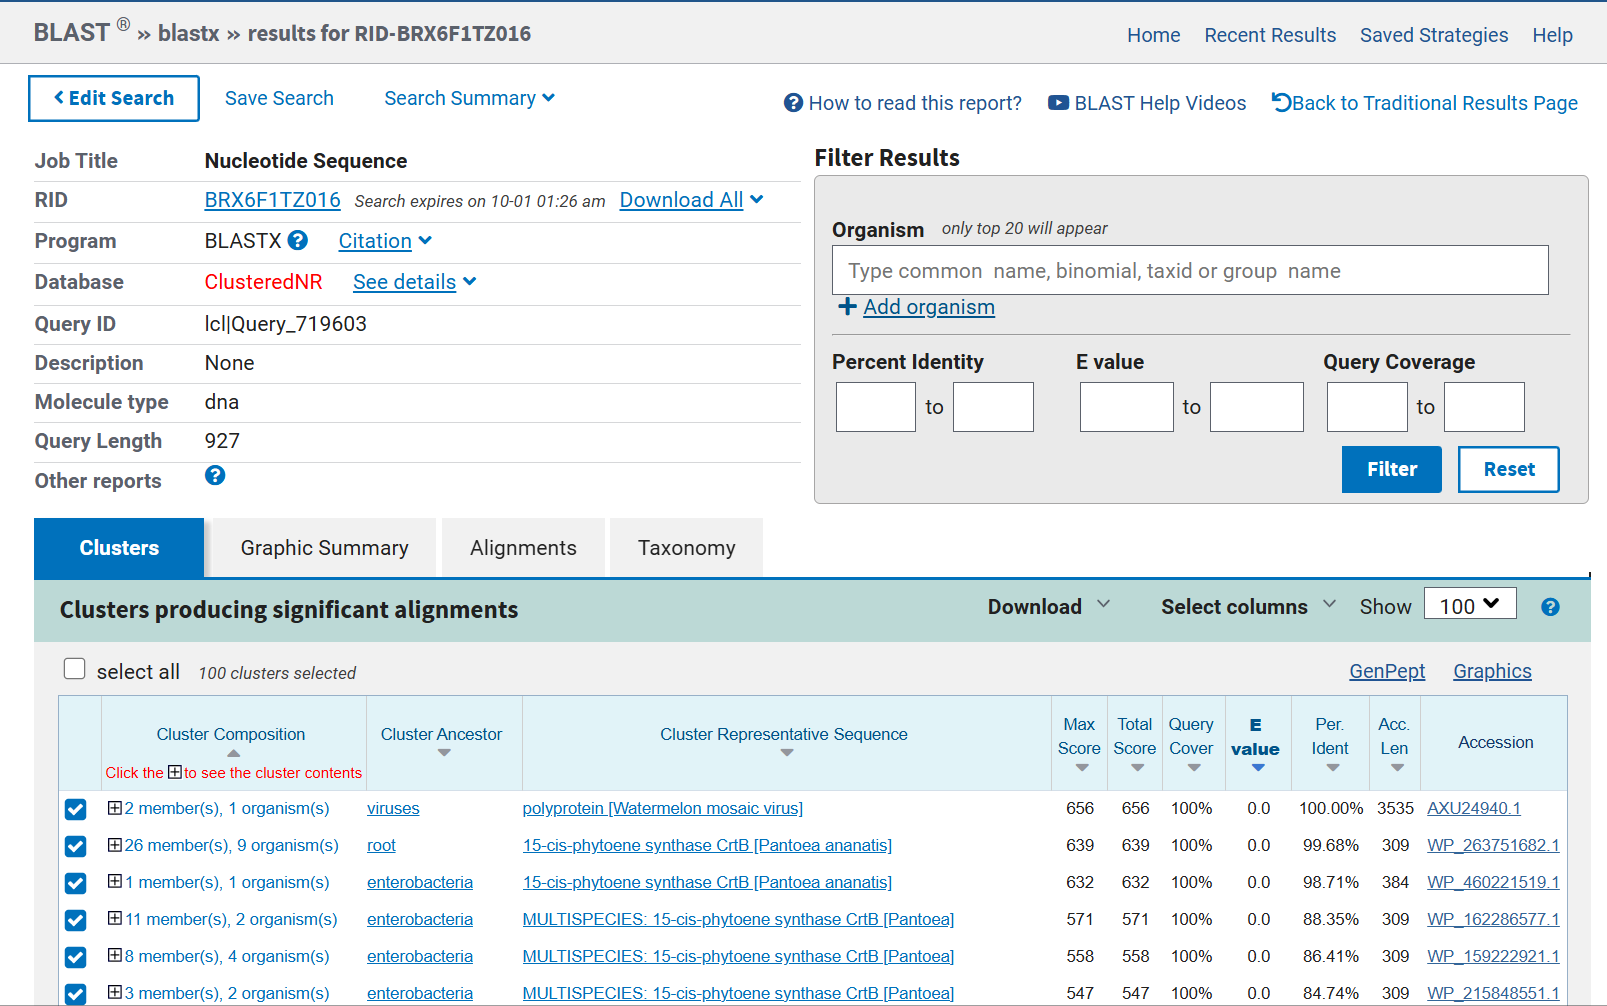
crtI
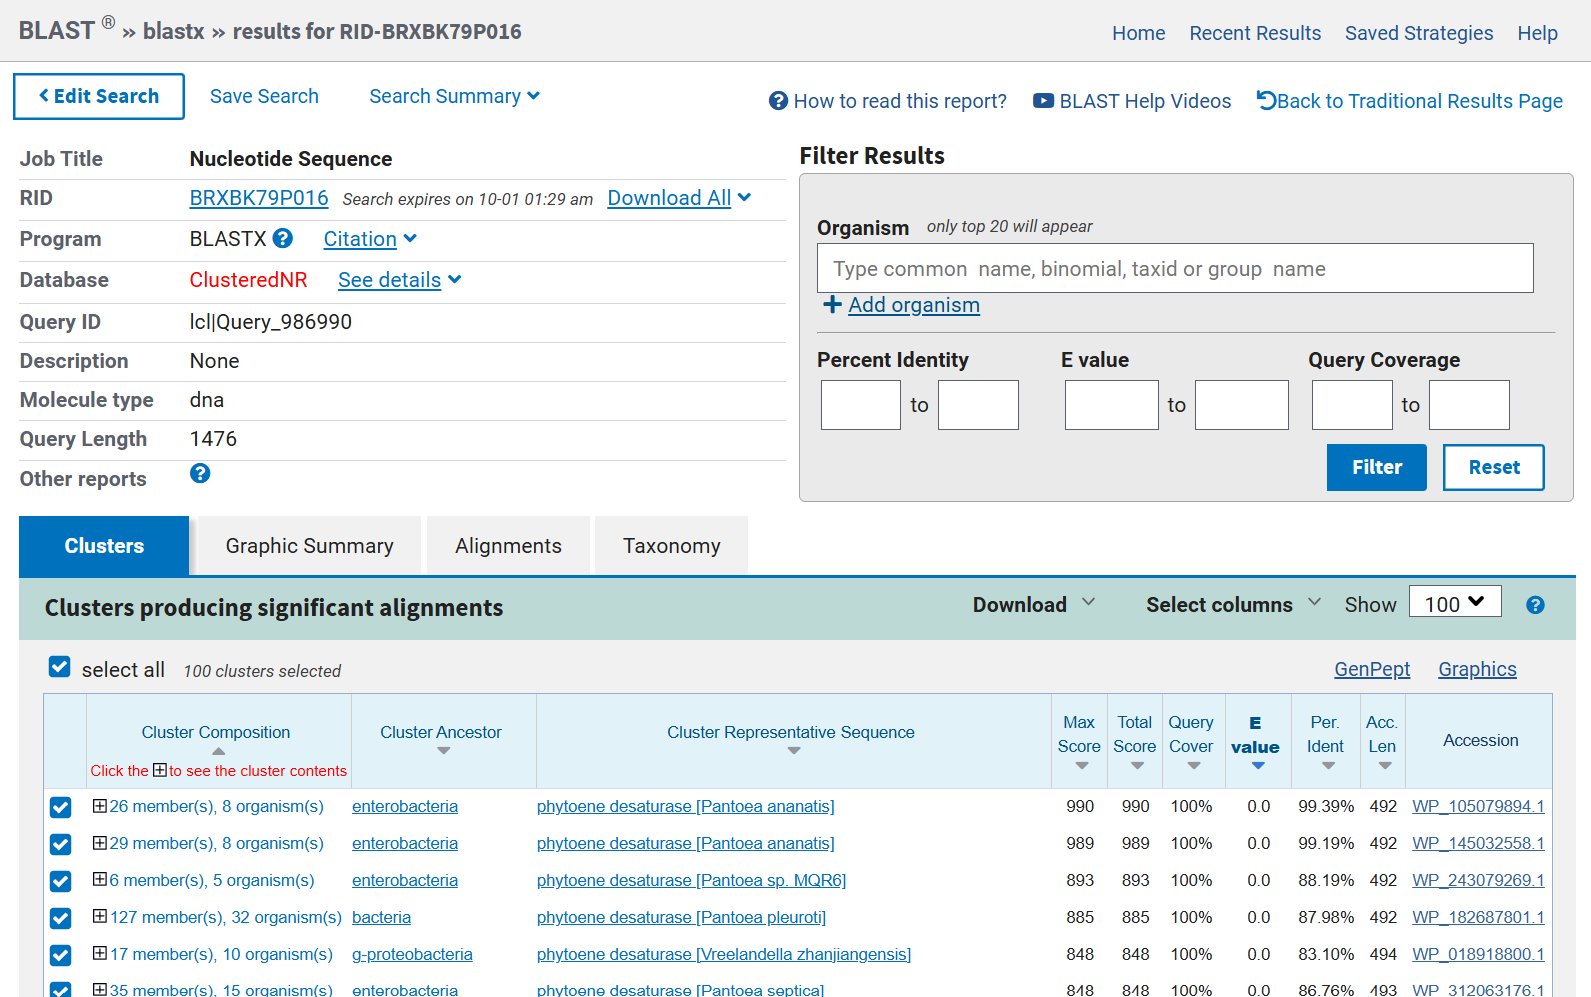
crtY
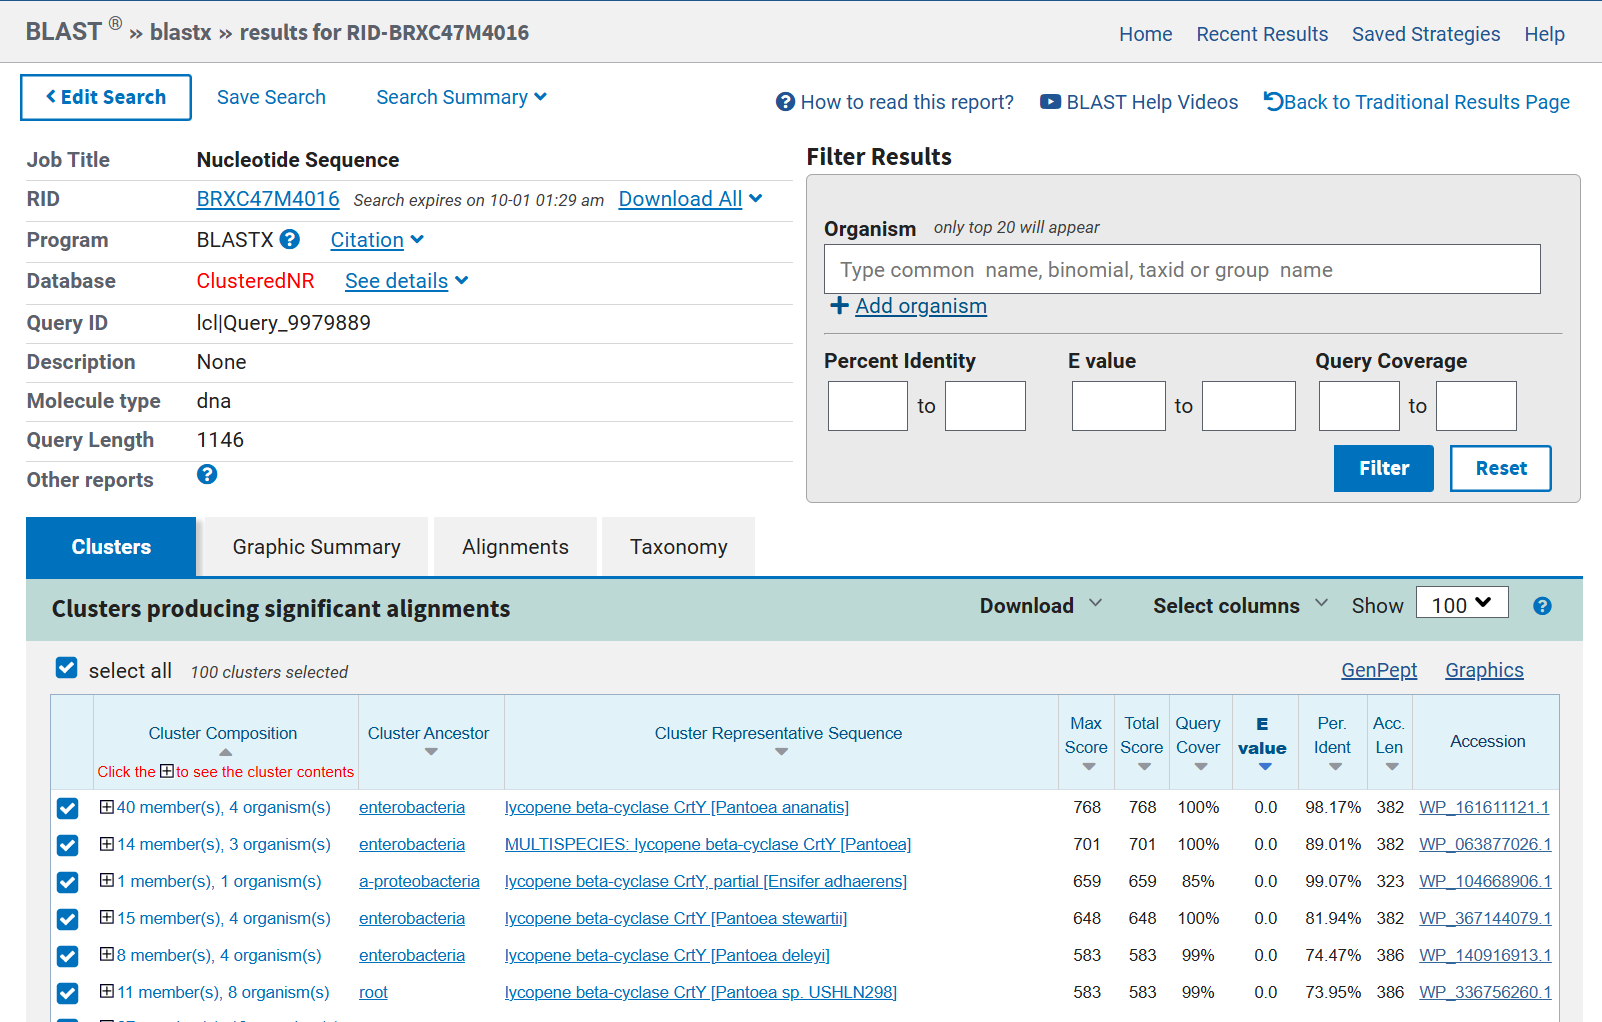
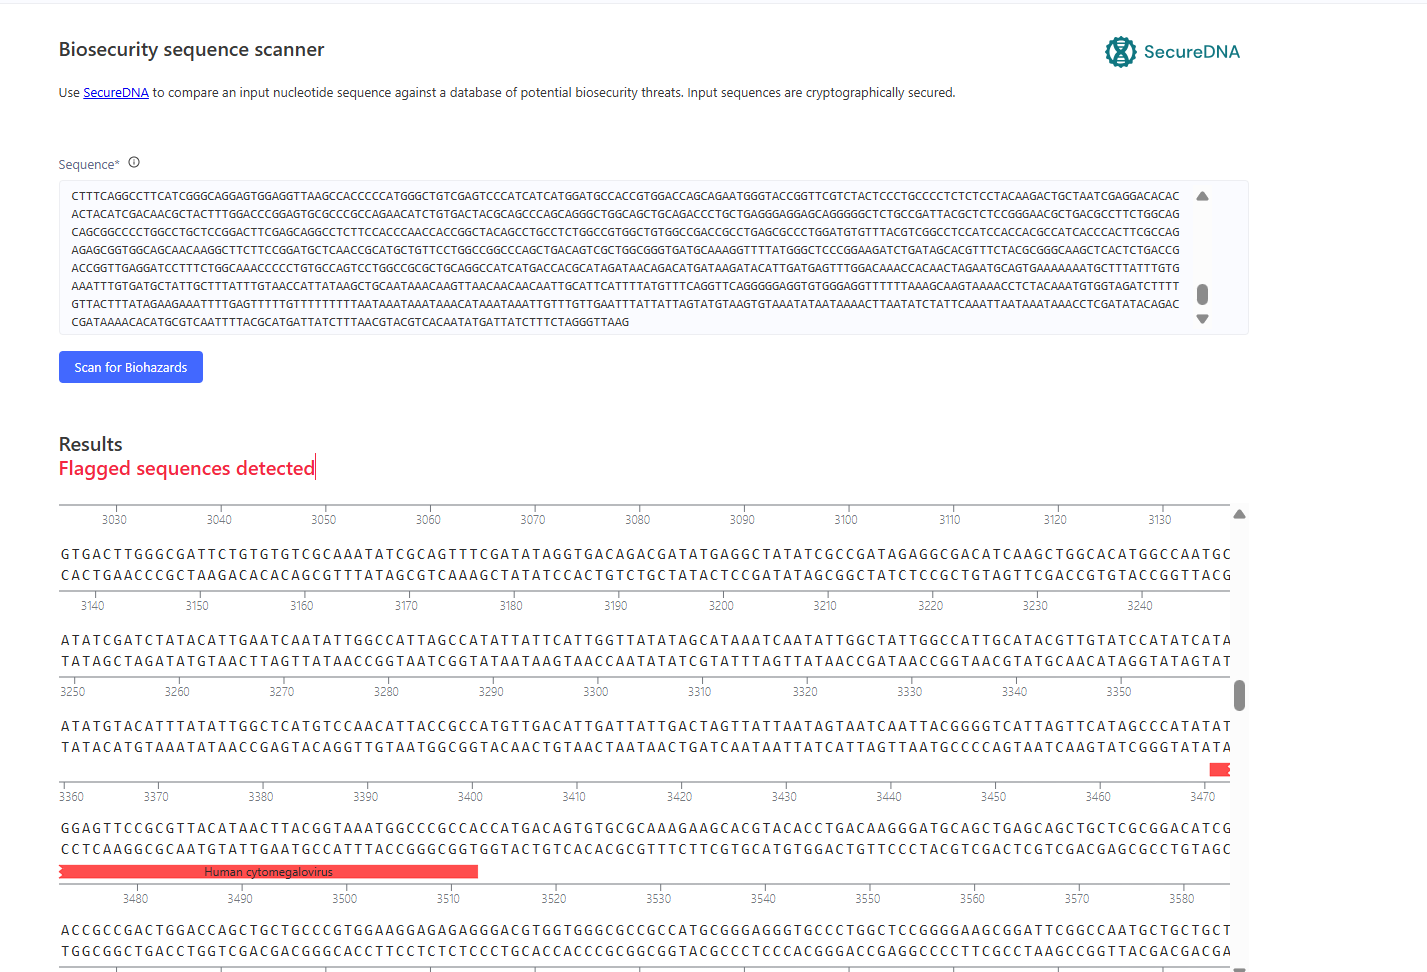
I screened my full construct (both expression units plus PiggyBac ITRs and PuroR cassette) using the SecureDNA Biosecurity Sequence Scanner. The scan returned “Flagged sequences detected”, with one hit annotated as Human cytomegalovirus at approximately positions 3,470-3,515 of the scanned sequence.
What the flag corresponds to: On inspection, the flagged region is the CMV immediate-early enhancer/promoter, which I had placed upstream of the β-carotene cassette (Unit 2). It is a non-coding regulatory element, not a viral gene encoding a virulence factor, toxin, or replication machinery. None of my coding sequences (fat-1, crtE, crtB, crtI, crtY, PuroR) were flagged. They encode a nematode desaturase, bacterial carotenoid enzymes, and a puromycin acetyltransferase.
Risk assessment: I think this is a low-risk flag. The CMV promoter is very widely used in mammalian expression vectors, and my construct contains no CMV structural or replication genes, so it can’t produce infectious virus.
How would I build it?
My construct is roughly 13 kb (about 10-11 kb between the ITRs plus the bacterial backbone). For the prototype I would order it as 4-6 synthetic DNA fragments (1-3 kb each) and assemble them into a PiggyBac backbone by Gibson or Golden Gate assembly. Ordering the full 13 kb as one clone is possible but costlier, slower, and more likely to fail on repeats and high-GC regions. A chip oligo pool would be overkill for a single construct. I would only use it later to screen variant libraries, such as promoter strengths to tune FAT-1 expression against metabolic burden.
What does synthesis constrain?
Three parts of my design may be hard to synthesize:
I would run a synthesis-feasibility check and re-optimize flagged windows with synonymous codons. Fragment-based assembly also confines any difficult region to one small fragment. Because synthesis has error rates, I would sequence-verify every assembled clone and pick a correct one rather than trust the pool.
Prototype vs. scale
The two differ, and that works in my favor. The HW1 target of ~272 tonnes/year is a cell scale, not a DNA scale. Because the construct integrates into the bovine genome via PiggyBac, I build and verify it once, at microgram scale.
Different roles → different optimal concentrations
Potassium glutamate is mainly an ionic-environment reagent. K⁺ is the dominant intracellular cation and glutamate the dominant anion in E. coli, so K-glutamate is used to recreate cytoplasmic ionic strength/osmolarity and support general enzyme and ribosome activity. Its response curve is broad: Jewett & Swartz found maximum protein production at 175 mM potassium glutamate, but the optimum sits on a fairly flat plateau, and yields were “nearly insensitive to ammonium glutamate concentrations between 0 and 100 mM.” In other words, you can be off by tens of mM and lose little activity.
Magnesium glutamate is a functional cofactor. Mg²⁺ is required for ribosome structure and translational fidelity, it forms the true substrate complex Mg-NTP, and it is needed by ATP-regenerating enzymes (e.g., pyruvate kinase). Crucially, Mg²⁺ is chelated by phosphorylated compounds — PEP, NTPs/NMPs, and the inorganic phosphate that accumulates during the reaction. So the “right” Mg-glutamate concentration depends on how much phosphorylated material a given formulation loads (a 33 mM PEP system has a very different Mg²⁺ demand than an NMP/ribose system).
Magnesium. Mg²⁺ has a narrow, bell-shaped optimum — too little stalls ribosomes and ATP regeneration; too much promotes misincorporation, nonspecific enzyme inhibition, and precipitation with phosphate/nucleotides.
This is why Mg-glutamate is the parameter labs re-titrate first when changing extract batches, DNA load, or energy system, whereas K-glutamate tolerates a much wider window (PANOx-SP uses 175 mM, RFopt ends up near ~362 mM — both work).
| Feature | PEP + NTP (e.g., PANOx-SP) | Ribose + NMP (e.g., RFopt) |
|---|---|---|
| Energy regeneration | PEP is a high-energy phosphate donor; pyruvate kinase converts PEP + ADP → pyruvate + ATP in one substrate-level step. Works anaerobically — PEP-driven synthesis is unaffected by oxygen availability and respiration inhibitors. | Ribose is a cheap, non-phosphorylated sugar; the extract’s own metabolism (pentose phosphate pathway → glycolysis → oxidative phosphorylation) regenerates ATP. RFopt starts with zero exogenous ATP yet sustains ~250 µM ATP for the whole reaction. |
| Nucleotide supply | NTPs added pre-made (1.2 mM ATP, 0.85 mM each GTP/UTP/CTP) — immediately available for transcription and translation. | Cheap NMPs are phosphorylated in situ by lysate kinases (NMP kinases, NDP kinase) using regenerated ATP. Salvage even works from bases: GMP can be replaced by guanine + ribose without losing yield. |
| Kinetics | Fast ATP spike within ~30 min, then ATP crashes to near zero by reaction end. | Slower ramp-up (metabolism must boot), but a sustained steady-state — longer-lived protein synthesis. |
| Phosphate burden | PEP hydrolysis liberates ~30+ mM Pi, which sequesters Mg²⁺ and eventually inhibits synthesis; PANOx mitigates this with oxalate. | Phosphate hovers at 10–15 mM, ~3× lower than PANOx-SP, because no phosphate is liberated from PEP. |
| Cost | PEP dominates cost: ~$2,000–3,000 per liter of reaction, >75% of all material costs. | Orders of magnitude cheaper; switching to NMPs + phosphate raised cost-efficiency ~340-fold in the Cytomim study ($0.004 vs $1.64 per mL for energy/nucleotides). |
| Robustness trade-off | Robust to oxygen limitation, vessel geometry, and lysate metabolic state. | Sensitive to oxygen transfer (surface-area-to-volume ratio) and to lysate concentration/quality — RFopt yields are “more sensitive to the amount of lysate added than using the PANOx-SP formulation.” |
In one sentence: PEP+NTP pays upfront for a fast, self-contained, oxygen-independent burst of synthesis, while ribose+NMP outsources ATP and NTP production to the extract’s own metabolism — far cheaper and longer-lived, but only if glycolysis, salvage pathways, and oxidative phosphorylation are active.
PANOx-SP — Jewett, M.C. & Swartz, J.R. (2004) Biotechnol. Bioeng. 86:19–26.
RFopt — Olsen, M.L. et al. (2026) Nature Communications (doi:10.1038/s41467-026-69605-8; screened >1,200 formulations via definitive screening designs).
| Component | PANOx-SP (2004) | RFopt (2026) |
|---|---|---|
| Energy source | 33 mM PEP | 50 mM ribose + 10 mM glucose |
| Nucleotides | 1.2 mM ATP + 0.85 mM each GTP/UTP/CTP | NMPs (AMP/CMP/GMP/UMP, 5 ≤ mM; GMP replaceable by guanine + ribose) |
| K-glutamate | 175 mM | ~362 mM |
| Mg-glutamate | 20 mM (incl. ~3.3 mM extract carryover) | 8 mM (re-titrated per lysate) |
| NH₄-glutamate | 10 mM | omitted |
| Buffer | none (HEPES deliberately removed) | 75 mM HEPES, pH 7.5 |
| Phosphate | not added (accumulates from PEP); 2.7 mM sodium oxalate to sequester Pi/Mg | 15 mM K-phosphate deliberately added (feeds salvage/energy metabolism) |
| Polyamines | 1.5 mM spermidine + 1 mM putrescine (replacing PEG) | screened out — not required |
| Cofactors / supplements | 0.33 mM NAD, 0.26 mM CoA, cAMP, 34 µg/mL folinic acid, 170 µg/mL E. coli tRNA, 100 µg/mL T7 RNAP | tRNA/CoA/NAD/folinic acid omitted (retained in non-dialyzed lysate); 4 mM nicotinamide as an NAD precursor |
| Yield / cost | ~1.3 g/L sfGFP; ~$4,672 per L of reaction | 2.4 ± 0.3 g/L sfGFP (87% higher than PANOx-SP); $133/L (~$55/g protein) — an 84–99% cost reduction; 3.7 ± 0.2 g/L with O₂ supplementation at 4-mL scale |
The design philosophies are 22 years apart.