Week 3 HW: Cell-Free Reaction Design
Homework 3: Cell-Free Reaction Design
Student: Naufal Tsabitul Azmi
Last updated: 8 October 2026 (WIB; evidence and documentation update)
Initial submission: 5 October 2026 (WIB)
Assignment due: 6 October 2026, as stated in the official HW3 handout.
I compared two published cell-free formulations and submitted three initial 20 µL CFPS design hypotheses: a magnesium adjustment for sfGFP, a modest DsbC reduction for TfCut2/PETase, and a modest DsbC increase for Reteplase. The save confirmations and target groupings were verified on the class Coopetition platform. I also upvoted a Community Reagent and verified access to the class discussion channel. I did not conduct laboratory experiments for this submission; no new protein yield, enzyme activity, or experimentally improved cost is claimed.
The objective is to reduce cost per functional protein output, which depends on both mixing cost and the amount of active product. The reactions use Ginkgo-supplied lysate and target DNA. PETase here is Thermobifida fusca cutinase 2 (TfCut2), and Reteplase requires a disulfide-compatible framework. My three designs are small changes from target-specific reference presets. Each proposed change is intended to be evaluated against its unchanged reference under matched assay conditions. No results from an experimental comparison of these designs were found in the evidence reviewed for this report. Official assignment and target framework.
Completion record
| Assignment component | Completion and evidence |
|---|---|
| A1: salt concentrations and sensitivity | Answered below with Jewett and Swartz Table II, including its concentration basis and limitations |
| A2: PEP + NTP versus ribose + NMP | Answered below with original PANOx-SP and RFopt sources |
| A3: two literature formulations | Full component comparison and experimental-context discussion below |
| B1: one initial composition per target | Three save confirmations and target groupings verified on 5 October 2026; record IDs and exact submitted inputs below |
| B2: Community Reagents | FkpA upvote verified on 5 October 2026: count 3 → 4 and “Remove your vote” displayed |
| B3: discussion access | cfps-coopetition forum access verified on 5 October 2026; no forum message posted |
| C: optional Asimov Kernel plasmid work | Not undertaken in this submission |
| Laboratory outcomes | No results for these designs were found in the reviewed evidence; their hypotheses remain unvalidated here |
| UI costing | Original paired estimates retained; PETase and Reteplase loaded-copy discrepancies observed on 8 October remain unresolved |
Evidence status as of 8 October 2026
“Verified” below refers to the specific document, input check, or platform readback. It does not mean that the reactions have been run or their performance validated.
| Evidence category | What this report can establish |
|---|---|
| Verified records and input checks | The three saved records remain traceable under their corresponding targets. The archived submitted inputs pass the documented 20,000 nL total, 25 nL dispensing-increment, fixed-component, and DNA-target checks. The public report and its three JSON files plus submission screenshot are accessible. |
| Supported by literature or the platform | The papers and class presets support formulation choices and folding considerations. Stock labels and the official buffer specification support nominal concentration calculations. UI prices support dated estimates only. The proposed benefits of magnesium and DsbC changes remain hypotheses; published yields and FkpA results belong to the cited authors and their experimental systems. |
| Not yet verified | Experimental yield or activity, improved cost per functional output, definitive costs of the saved records, community-wide uniqueness, plate allocation, laboratory execution, and a full supplementary/Source Data audit or raw-data reanalysis. |
The detailed process and decision log and the dated cost observations below distinguish submission evidence from these unresolved items.
A. Compare cell-free reaction compositions
A1. Potassium and magnesium glutamate
Assignment question: Why does the concentration of potassium glutamate and magnesium glutamate differ between compositions? Which is more sensitive?
Potassium and magnesium glutamate help establish the ionic environment in which cell-free transcription and translation operate. Their useful concentrations depend on the whole formulation, including the lysate, its carried-over salts, nucleotides, energy substrates, and metabolites that accumulate during the reaction. A concentration optimized for one system should therefore be re-evaluated when those conditions change. Jewett and Swartz explicitly reoptimized magnesium when replacing PEP with pyruvate because PEP has a stronger affinity for magnesium and the expected phosphate accumulation also changes. Jewett & Swartz, 2004, PDF pp. 4–5, Tables I–II.
Magnesium was more sensitive around the optimum tested in their PANOx-SP system. Increasing added magnesium glutamate from 20 to 24 and 28 mM reduced normalized total CAT expression from 1.00 to 0.73 and 0.39. Increasing potassium glutamate from 175 to 200 and 225 mM reduced the corresponding values from 1.00 to 0.94 and 0.92. The magnesium response was therefore sharper in this experiment. Potassium still mattered: at 100 mM potassium glutamate, the relative yield was only 0.63. This supports a formulation-specific sensitivity conclusion rather than a universal statement that potassium is unimportant.
| Solute varied individually | Added concentration, mM | Relative total CAT expression |
|---|---|---|
| Magnesium glutamate | 20 | 1.00 |
| Magnesium glutamate | 24 | 0.73 |
| Magnesium glutamate | 28 | 0.39 |
| Potassium glutamate | 175 | 1.00 |
| Potassium glutamate | 200 | 0.94 |
| Potassium glutamate | 225 | 0.92 |
These are the authors’ measurements from Table II, using 15-µL PANOx-SP reactions at 37°C for 3 h, with one solute varied at a time. The magnesium values are additions: approximately 3.3 mM magnesium was also carried over from the extract. Nominal added or total magnesium must not be confused with measured free Mg²⁺. The data concern CAT in the paper’s system and do not establish the optimum for sfGFP, TfCut2, or Reteplase. Jewett & Swartz, Table II, PDF p. 4.
Design implication: salt optimization should be considered together with the energy/nucleotide strategy and the defined contributions from the class base buffer, rather than copying a literature value as an additional stock concentration.
A2. PEP + NTP versus ribose + NMP
Assignment question: Explain how a PEP+NTP reaction formulation is different from a Ribose+NMP reaction formulation.
The original PANOx-SP formulation adds phosphoenolpyruvate (PEP) as a phosphorylated energy substrate and supplies nucleotide triphosphates: ATP, GTP, UTP, and CTP. These provide nucleotide building blocks and support the energy-demanding transcription/translation system. ATP regeneration is supported by the supplied energy substrate and the enzymes present in the extract. PEP-based reactions can accumulate phosphate and experience pH changes; these effects are part of the chemical environment that must be optimized. Jewett & Swartz, Methods and homeostasis discussion, PDF pp. 2, 5–6.
Olsen’s RFopt instead uses ribose, glucose, phosphate, nucleotide monophosphates (AMP, GMP, UMP, and CMP), and other supporting components. No exogenous NTPs are listed in baseline RFopt. The reaction still requires NTPs: it relies on the lysate’s metabolic and nucleotide-regeneration activities to supply them. Thus, “no added ATP” does not mean “no ATP is required,” and ribose alone is not a direct replacement for every function of NTPs. Olsen et al., Table 1 and Fig. 2, PDF pp. 3, 5.
| Aspect | Original PANOx-SP: PEP + NTP | RFopt: ribose + NMP |
|---|---|---|
| Added energy-related substrates | PEP, 33 mM | Ribose, 50 mM; glucose, 10 mM; phosphate, 15 mM |
| Added nucleotide form | ATP 1.2 mM; GTP/UTP/CTP 0.85 mM each | AMP 3 mM; GMP/UMP/CMP 2.15 mM each |
| ATP/NTP availability | Added NTPs plus regeneration supported by the energy system | Regeneration from the supplied substrates and endogenous lysate activities |
| Chemical interactions to consider | Magnesium binding, phosphate accumulation, and pH changes | Metabolic capacity, oxygen transfer, phosphate balance, and pH |
| Cost rationale | Phosphorylated energy substrates and NTPs can be substantial reagent expenses | Less expensive inputs can lower cost when functional output is maintained |
| Evidence needed for a new design | Functional yield and cost under the chosen conditions | Functional yield and cost under the chosen conditions |
In Olsen’s own comparison, RFopt generated ATP despite starting without added ATP and maintained ATP around 250 µM, while phosphate remained approximately 10–15 mM during the measured reaction. Its PEP-based comparator showed a different ATP/phosphate profile. These observations support the importance of sustained metabolism and homeostasis. They are results under Olsen’s conditions, and the comparator reported by Olsen is a different implementation from the original 2004 PANOx-SP recipe. Olsen et al., Fig. 2, PDF p. 5.
Design implication: a ribose/NMP strategy is a plausible cost-focused baseline, but its performance depends on the lysate and reaction environment. It must be adapted to the class inventory and evaluated using functional output, rather than assumed to work because it uses cheaper ingredients.
A3. Comparison of two literature formulations
Assignment question: Choose two cell-free reaction compositions from the literature, compare and contrast the choice of reagents and the concentration of reagents.
I compare the original PANOx-SP formulation reported by Jewett and Swartz (2004) with RFopt reported by Olsen et al. (2026). The first represents a PEP/NTP-based strategy; the second represents a later ribose/NMP-based strategy optimized for low reagent cost and high sfGFP production.
The comparison uses Jewett’s original Methods/Table I, rather than substituting the PANOx-SP comparator column printed in Olsen’s Table 1. Those reported implementations differ: for example, original PANOx-SP contains 175 mM potassium glutamate and 20 mM added magnesium glutamate, while Olsen’s comparator column lists 130 and 8 mM, respectively. Keeping the versions separate makes the concentration comparison traceable. Jewett, PDF p. 2, Olsen, PDF p. 3.
Reading the table: concentrations are nominal amounts in the assembled reaction, not stock concentrations or measurements of free ions. “Not added” means no exogenous addition is specified; it does not mean that the molecule is absent from the lysate. Values are mM unless another unit is shown.
| Component | Original PANOx-SP, J04 | RFopt, O26 |
|---|---|---|
| Potassium glutamate | 175 mM | 362 mM |
| Magnesium glutamate | 20 mM added | 8 mM listed |
| Ammonium glutamate | 10 mM | Not added |
| Magnesium acetate carried from extract | Approximately 3.3 mM | Final carryover not quantified in Table 1 |
| Potassium acetate carried from extract | Approximately 14.4 mM | Final carryover not quantified in Table 1 |
| HEPES | 0 added | 75 mM |
| PEP | 33 mM | Not added |
| Glucose | Not added | 10 mM |
| Ribose | Not added | 50 mM |
| Phosphate supplement | Not added | 15 mM |
| Nicotinamide | Not added | 4 mM |
| ATP | 1.2 mM | Not added |
| GTP, UTP, CTP | 0.85 mM each | Not added |
| AMP | Not added | 3 mM |
| GMP, UMP, CMP | Not added | 2.15 mM each |
| Each of the 20 standard amino acids | 2 mM | 5 mM |
| Spermidine | 1.5 mM | Not added |
| Putrescine | 1 mM | Not added |
| Sodium oxalate | 2.7 mM | Not added |
| NAD | 0.33 mM | Not added |
| Coenzyme A | 0.26 mM | Not added |
| Folinic acid | 34 µg/mL | Not added |
| Exogenous E. coli tRNA mixture | 170.6 µg/mL | Not added |
| Separate purified T7 RNA polymerase | 100 µg/mL | No separate addition specified |
| PEG-8000 | 0% w/v added | Not added |
| Lysate fraction | 24% v/v | 30% v/v for baseline experiments |
| Plasmid DNA mass concentration | 13.3 µg/mL | 13.3 ng/µL, equivalent to 13.3 µg/mL |
Jewett also reports extract contributions of approximately 2.4 mM Tris and 23.5 mM acetate. Original PANOx-SP therefore contains approximately 23.3 mM magnesium from its stated added glutamate salt plus extract carryover; this is not free Mg²⁺. RFopt’s Table 1 does not provide an equivalent quantified carryover correction. The class lysate fraction is fixed at 25%, so neither paper’s extract fraction can be transferred unchanged. Jewett, Methods/Table I, class specification.
Comparison and interpretation
Energy and nucleotide strategy. Original PANOx-SP uses PEP and externally added NTPs, whereas RFopt uses ribose/glucose/phosphate and NMPs. This changes the metabolic demands and the chemical environment, so the salt composition must also be considered.
Reagent choice and concentration. RFopt omits several separately supplied components listed in original PANOx-SP, including NAD, CoA, folinic acid, tRNA, and polyamines. At the same time, RFopt contains more potassium glutamate and amino acids, plus 75 mM HEPES. Low cost therefore does not mean reducing every concentration; it means choosing a productive combination and avoiding costs that do not improve the relevant output.
Experimental context. Jewett used CAT and an engineered K12-derived S30 extract at 37°C. Its Table II optimization used 15-µL reactions for 3 h, while other comparisons tracked reactions over 6 h. Olsen’s baseline RFopt measurements used sfGFP and BL21 Star (DE3) lysate, generally 15-µL reactions at 30°C for 20 h. Different proteins, lysates, temperatures, durations, and geometries prevent these literature results from being treated as a controlled head-to-head comparison of our two selected original recipes.
Results and cost scope. Olsen reports RFopt at 2.39 ± 0.28 g/L sfGFP, with reagent cost of USD 143 per liter of reaction and approximately USD 60 per gram of protein. These are the authors’ results and exclude lysate and DNA costs. Jewett’s original composition table does not supply the same modern costing basis, so I do not assign it a cost using Olsen’s differently composed comparator. The CAT expression measurements in Jewett and sfGFP measurements in Olsen should also retain their respective definitions and assay contexts. Olsen, Table 1, Jewett, Table II and Fig. 4.
Application to HW3. RFopt is a useful candidate baseline for a cost-focused design, but the class supplies fixed lysate, DNA, and base buffer. That base buffer already contributes salts, HEPES, and amino-acid components. Literature concentrations must therefore be converted into additions only after checking the actual inventory and those existing contributions. Reteplase also requires the prepared DSB framework and target-specific folding considerations; baseline RFopt is not the same formulation as oxidized RFopt. No published result above establishes that a new class composition will produce functional protein.
B. Design and participation
B1. One reaction composition for each target
Assignment: publish a first unique 20 µL CFPS composition for sfGFP, PETase, and Reteplase, and explain the reagents adjusted from the relevant categories. I designed one reagent perturbation from each target-specific preset and balanced the volume with water. These are proposed one-factor-at-a-time comparisons. No experimental evaluation of these proposals was found in the evidence reviewed for this report. Other energy substrates, building blocks, salts, cofactors, and redox components were retained from the corresponding reference unless explicitly changed below.
| Target | Starting preset | Submitted sample ID | Platform record ID |
|---|---|---|---|
| sfGFP | sfGFP Ribose | naufal_tsabitul_azmi_2026-10-05_sfgfp_mg76_v1 | 14sqepz2b15y1o0 |
| PETase/TfCut2 | PETase Ribose | naufal_tsabitul_azmi_2026-10-05_petase_dsbc45_v1 | ov0n7790fzd7f99 |
| Reteplase | Reteplase PEP | naufal_tsabitul_azmi_2026-10-05_reteplase_dsbc55_v1 | sfvi72kwto5mmc6 |
The three entries were saved and grouped under their corresponding targets in My Compositions. Each differs from its reference preset; I did not perform an exhaustive community-wide duplicate audit. The downloadable JSON files preserve the submitted inputs and are not raw server exports. Reloading a saved additive mix into Custom Mix can assign a new sample ID, reset metadata, and retain the currently selected DNA target, so that view alone does not verify a record’s saved target or final cost.
Archive qualification: the Submitted JSON files remain unchanged as historical inputs paired with the 5 October save evidence. Their comments contain the original cost estimates; the dated cost note below records subsequent unresolved display differences. The record links above open loaded copies and should be read with this limitation.
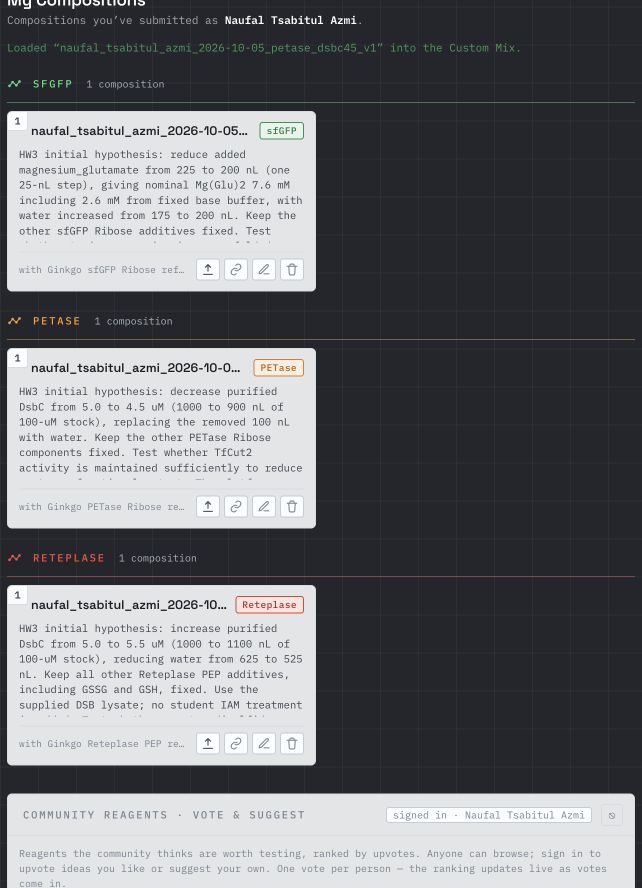
Download the submission-verification screenshot.
Volume, DNA-target, and local verification
All three reagent lists total exactly 20,000 nL. Every volume is a multiple of 25 nL. Each contains fixed base buffer 2000 nL, lysate 5000 nL, and exactly one target-matched DNA template 2000 nL; additives plus water total 11,000 nL. PETase/TfCut2 uses template_petase; Reteplase uses template_reteplase. The local JSON target keys were corrected to match the official specification.
Interface pitfall: loading a preset does not automatically switch the DNA/protein target. Check both the selected protein target and the exported template_* key before submission. A PETase or Reteplase preset can otherwise retain the previously selected sfGFP template. Matching fixed volume alone cannot detect this error.
Concentration basis
Stock labels for variable reagents come from the visible public DOM snapshot captured on 5 October 2026. DNA and base-buffer stock values come from the official specification. Nominal final concentration = stock concentration × reagent volume / 20,000 nL, plus any defined base-buffer contribution. The fixed buffer contributes HEPES 30 mM, potassium glutamate 200 mM, magnesium glutamate 2.6 mM, amino-acid mix 1 mM, and cysteine 1 mM. Tyrosine is represented within the base-buffer amino-acid contribution; the platform displays 1 mM tyrosine with no separate addition in these recipes. Listed amino-acid-mix levels are nominal mixture/per-component levels, not a sum across all amino acids. Base-buffer contributions are already included in affected table rows and must not be added twice. Unknown endogenous lysate contributions and free-ion concentrations are not determined by this calculation; potassium-glutamate concentration is not total potassium concentration. Folinic acid stays in mg/mL because that is the verified stock unit.
Cost estimates and unresolved display differences
The table preserves the paired UI estimates recorded on 5 October 2026, including the rounded costs visible immediately after the respective save confirmations. These estimates describe the reaction as mixed, not a full procurement or project budget. They do not represent a bottle purchase, minimum order, shipping, labor, capital, or complete downstream workflow. USD per 20 µL reaction is calculated as the displayed USD/mL × 0.020 mL; source values are rounded.
| Preset | Baseline USD/mL | Submitted-mix snapshot USD/mL | Baseline USD/20 µL | Submitted-mix snapshot USD/20 µL |
|---|---|---|---|---|
| sfGFP / sfGFP Ribose | $5.79 | $5.79 | $0.1158 | $0.1158 |
| PETase / PETase Ribose | $339.64 | $311.48 | $6.7928 | $6.2296 |
| Reteplase / Reteplase PEP | $344.46 | $372.62 | $6.8892 | $7.4524 |
Loaded-copy observations on 8 October 2026:
| Saved-record link used | Custom Mix copy USD/mL | Calculated USD/20 µL | Check in the editor |
|---|---|---|---|
PETase/TfCut2, ov0n7790fzd7f99 | $306.69 | $6.1338 | Display remained after selecting PETase and template_petase |
Reteplase, sfvi72kwto5mmc6 | $377.47 | $7.5494 | Display remained after selecting Reteplase and template_reteplase |
An earlier PETase reload had retained the editor’s then-current Reteplase template. The 8 October checks show that selecting the corresponding target and DNA template did not resolve the observed price differences. These loaded copies generated new sample IDs and reset metadata; they are not raw server exports. The cause remains unresolved, so these observations do not establish definitive costs for the saved records.
The 91.7% PETase and 108.2% Reteplase thresholds below remain conditional calculations from the original paired estimates. They have not been recalculated from loaded-copy prices because matching reference costs were not established in those checks. Neither experimental activity nor improved cost per functional output has been established. Final costing requires a reconciled, target-matched reference/design pair under the same pricing basis.
B1.1. sfGFP: one-step magnesium adjustment
Reference: sfGFP Ribose (sfGFP_R2PC_054).
Submitted sample ID: naufal_tsabitul_azmi_2026-10-05_sfgfp_mg76_v1. Platform record ID: 14sqepz2b15y1o0.
Change: Supplemental magnesium glutamate: 225 → 200 nL; water: 175 → 200 nL. Nominal final magnesium glutamate: 8.225 → 7.600 mM, including the fixed base-buffer contribution.
Hypothesis: A one-droplet reduction in supplemental magnesium may preserve or improve folded sfGFP production by changing the ionic environment of the ribose/NMP formulation. Magnesium is sensitive to formulation context, so the direction of any effect remains unknown. The direct salt saving is small; the primary test is functional output relative to reaction cost.
Risk: A small volume step can still move the reaction away from its magnesium optimum. Nominal magnesium concentration does not measure free Mg²⁺, and the optimum from another energy system or lysate cannot be assumed here.
Planned evaluation: Use endpoint sfGFP fluorescence with the appropriate protein standard curve and plate controls; compare with the unchanged sfGFP Ribose reference under the same conditions.
Conditional break-even: The UI rounds baseline and draft costs to the same $5.79/mL. At that displayed precision, functional sfGFP output must exceed baseline to improve cost per functional output; the tiny underlying salt saving is not resolved by this rounded display.
| Reagent | Stock | Volume (nL) | Nominal final concentration / fraction |
|---|---|---|---|
| 17-amino-acid mix | 50 mM | 1600 | 5 mM including base buffer |
| AMP | 100 mM | 600 | 3 mM |
| Base buffer [official specification] | 10× | 2000 | 1×; see concentration basis |
| CMP | 100 mM | 425 | 2.125 mM |
| GMP | 100 mM | 425 | 2.125 mM |
| HEPES-KOH, pH 7.5 | 1000 mM | 900 | 75 mM including base buffer |
| Potassium phosphate mix (mono:di) | 500 mM | 600 | 15 mM |
| Supplied lysate | 100% v/v | 5000 | 25% v/v |
| Magnesium glutamate | 500 mM | 200 | 7.6 mM including base buffer |
| Nicotinamide | 100 mM | 800 | 4 mM |
| Nuclease-free water | Not applicable | 200 | 0.2 µL top-up volume |
| Potassium glutamate | 875 mM | 3325 | 345.46875 mM including base buffer |
| Ribose | 666.09 mM | 1500 | 49.95675 mM |
| sfGFP DNA template [official specification] | 50 nM | 2000 | 5 nM nominal |
| UMP | 100 mM | 425 | 2.125 mM |
| TOTAL | 20000 | 20.000 µL |
Submitted input: sfGFP JSON.
B1.2. PETase/TfCut2: modest DsbC reduction
Reference: PETase Ribose (Cutinase_R2PC_054).
Submitted sample ID: naufal_tsabitul_azmi_2026-10-05_petase_dsbc45_v1. Platform record ID: ov0n7790fzd7f99.
Change: DsbC: 1000 → 900 nL of the displayed 100 µM stock, giving 5.0 → 4.5 µM; water: 225 → 325 nL. Other additives remain fixed.
Hypothesis: Reducing DsbC supplementation by 10% may retain enough folding assistance for TfCut2 while lowering reaction cost. Its single disulfide bond motivates a conservative dose test; it does not establish that DsbC is unnecessary.
Risk: Reduced folding assistance may lower active enzyme production more than the reagent saving can tolerate. The soluble p-nitrophenyl-ester assay measures esterase activity and does not directly demonstrate hydrolysis of solid PET.
Planned evaluation: Compare the initial PNP assay rate with the unchanged PETase Ribose reference, using consistent dilution, the linear assay range, standards, and controls. Product concentration is an activity proxy, not enzyme mass.
Conditional break-even, using the original paired UI snapshots: activity_new/activity_reference must exceed 0.91709, or about 91.7%, to improve cost per unit activity. A reduction in activity of roughly 8.3% would erase the estimated saving.
| Reagent | Stock | Volume (nL) | Nominal final concentration / fraction |
|---|---|---|---|
| 17-amino-acid mix | 50 mM | 1600 | 5 mM including base buffer |
| AMP | 100 mM | 600 | 3 mM |
| Base buffer [official specification] | 10× | 2000 | 1×; see concentration basis |
| CMP | 100 mM | 425 | 2.125 mM |
| DsbC | 100 µM | 900 | 4.5 µM |
| GMP | 100 mM | 425 | 2.125 mM |
| HEPES-KOH, pH 7.5 | 1000 mM | 900 | 75 mM including base buffer |
| Potassium phosphate mix (mono:di) | 500 mM | 600 | 15 mM |
| Supplied lysate | 100% v/v | 5000 | 25% v/v |
| Magnesium glutamate | 500 mM | 225 | 8.225 mM including base buffer |
| Nicotinamide | 100 mM | 800 | 4 mM |
| Nuclease-free water | Not applicable | 325 | 0.325 µL top-up volume |
| Potassium glutamate | 875 mM | 2275 | 299.53125 mM including base buffer |
| Ribose | 666.09 mM | 1500 | 49.95675 mM |
| UMP | 100 mM | 425 | 2.125 mM |
| PETase DNA template [official specification] | 50 nM | 2000 | 5 nM nominal |
| TOTAL | 20000 | 20.000 µL |
Submitted input: PETase JSON.
B1.3. Reteplase: modest DsbC increase
Reference: Reteplase PEP (Reteplase_R2PC_041).
Submitted sample ID: naufal_tsabitul_azmi_2026-10-05_reteplase_dsbc55_v1. Platform record ID: sfvi72kwto5mmc6.
Change: DsbC: 1000 → 1100 nL of the displayed 100 µM stock, giving 5.0 → 5.5 µM; water: 625 → 525 nL. GSSG and GSH remain fixed at nominal 4.0375 and 1.0 mM.
Hypothesis: A 10% increase in DsbC may improve disulfide isomerization and the functional fraction of Reteplase, which requires nine correctly paired disulfide bonds. The added folding helper increases reaction cost, so the hypothesis concerns cost per functional activity rather than cheaper mixing.
Risk: Extra DsbC may give little benefit or disturb the reaction; more folding helper does not guarantee correctly paired disulfides. Maintain the supplied DSB lysate and existing GSH/GSSG system. No student IAM treatment is included.
Planned evaluation: Compare the initial AMC-cleavage assay rate with the unchanged Reteplase PEP reference, using the defined assay window, elapsed time, standard curve, and controls. AMC concentration is a product/activity proxy, not Reteplase mass.
Conditional break-even, using the original paired UI snapshots: activity_new/activity_reference must exceed 1.08175, or about 108.2% of baseline, to improve cost per unit activity. The necessary gain is greater than approximately 8.2%.
| Reagent | Stock | Volume (nL) | Nominal final concentration / fraction |
|---|---|---|---|
| 17-amino-acid mix | 50 mM | 400 | 2 mM including base buffer |
| Ammonium glutamate | 1000 mM | 200 | 10 mM |
| ATP | 100 mM | 250 | 1.25 mM |
| Base buffer [official specification] | 10× | 2000 | 1×; see concentration basis |
| Coenzyme A | 50 mM | 100 | 0.25 mM |
| CTP | 100 mM | 175 | 0.875 mM |
| DsbC | 100 µM | 1100 | 5.5 µM |
| Folinic acid | 10 mg/mL | 50 | 0.025 mg/mL |
| GTP | 100 mM | 175 | 0.875 mM |
| HEPES-KOH, pH 7.5 | 1000 mM | 550 | 57.5 mM including base buffer |
| Supplied DSB lysate | 100% v/v | 5000 | 25% v/v |
| Magnesium glutamate | 500 mM | 225 | 8.225 mM including base buffer |
| NAD | 100 mM | 75 | 0.375 mM |
| Nuclease-free water | Not applicable | 525 | 0.525 µL top-up volume |
| Oxidized glutathione (GSSG) | 170 mM | 475 | 4.0375 mM |
| PEP, monopotassium stock | 100 mM | 6000 | 30 mM |
| Potassium oxalate (UI row: Oxalic acid) | 500 mM | 150 | 3.75 mM |
| Putrescine | 500 mM | 50 | 1.25 mM |
| Reduced glutathione (GSH) | 100 mM | 200 | 1 mM |
| Spermidine | 250 mM | 125 | 1.5625 mM |
| UTP | 100 mM | 175 | 0.875 mM |
| Reteplase DNA template [official specification] | 50 nM | 2000 | 5 nM nominal |
| TOTAL | 20000 | 20.000 µL |
Submitted input: Reteplase JSON.
B2. Community Reagent: FkpA
Assignment: contribute or upvote at least one reagent, explain why it was selected, and link relevant research. I selected an existing FkpA proposal because it tests folding assistance that complements the disulfide-isomerization strategy already used for Reteplase.
FkpA is worth testing as a complementary folding helper because Groff et al. (2014) found that purified FkpA improved antibody-chain solubility in E. coli cell-free synthesis and, together with DsbC, increased assembled IgG production. For HW3, I would test whether adding FkpA to the existing Reteplase DSB formulation increases functional activity sufficiently to justify its additional reagent cost. The study evaluated antibodies, so any benefit for Reteplase remains a hypothesis requiring target-specific activity and cost measurements. Groff et al. (2014), DOI 10.4161/mabs.28172.
Completion evidence: I upvoted FkpA on 5 October 2026. Readback showed “Remove your vote” and the displayed count increased from 3 to 4. FkpA is not present in these three submitted compositions. This records an upvote on an existing proposal; it does not claim a new reagent proposal or a published rationale comment.
B3. Access to the cfps-coopetition discussion
Assignment: visit the dedicated forum channel and ensure discussion access. I verified access to cfps-coopetition on 5 October 2026. Sending an optimization idea is a bonus in the handout. No forum message was posted for this submission.
C. Optional Asimov Kernel work
I did not undertake the optional T7-compatible plasmid construction or the bonus T7 helper-plasmid design in this submission. The three submitted reactions use the supplied target templates. This page makes no plasmid-design completion claim for HW3.
Process documentation and remaining questions
The working process was to read the official assignment and platform specification; compare the primary literature with its original concentration and cost definitions; inspect the available stocks and target-specific presets; make one change per design; balance the water volume; check fixed components, total volume, dispensing increments, and DNA-target identity; submit the three records; and read back the save confirmations and target groupings. Participation was documented by the FkpA upvote readback and forum access check.
The source and decision log is kept in the HW3 journal, the three-design documentation page, and the detailed process and decision log. The detailed log records 27 meaningful steps, 10 decisions, 10 source entries, and the submitted record IDs. These records preserve reasoning and limitations alongside the learning notes.
Two questions remain for subsequent work: reconcile the changing UI cost displays for loaded PETase and Reteplase recipes, and evaluate each hypothesis when controlled assay results become available. The break-even ratios above are calculations from paired UI estimates, not experimental findings. For PETase and Reteplase, PNP and AMC product measurements must retain their activity-proxy interpretation rather than being treated as grams of enzyme.
Recitation preparation
- Explain why magnesium sensitivity depends on the complete reaction formulation and distinguish added, nominal total, and free magnesium.
- Explain how a ribose/NMP reaction can require ATP/NTPs while adding no exogenous NTPs.
- Identify the original PANOx-SP and RFopt source versions and explain why their published outputs are not a controlled head-to-head comparison here.
- Describe the single variable changed in each submitted recipe and predict both possible benefits and failure modes.
- Show the 20,000 nL volume calculation, 25 nL increments, fixed components, and target-matched DNA templates.
- Explain the conditional 91.7% PETase and 108.2% Reteplase activity thresholds, together with the unresolved UI-cost limitation.
- Explain why FkpA’s antibody evidence motivates a Reteplase test without proving a benefit for that target.
AI assistance and prompts
AI client: Codex desktop. The specific AI model identifier was not captured in the preparation record. No trained yield-prediction model was built: these designs use literature-guided hypotheses, one-variable perturbations, volume/concentration arithmetic, and conditional cost/activity ratios. AI assisted with reading and extracting the supplied PDFs, explaining the concepts, comparing the literature, checking arithmetic, drafting the design hypotheses and documentation, and operating the authorized submission workflow. The reasoning and evidence need to be understood and explained by the student during recitation, as required by the assignment’s AI-use section.
Sources and downloadable evidence
- Official Homework 3 handout: assignment questions, target-specific folding requirements, assays, participation requirements, and AI disclosure.
- CFPS Coopetition specification: target templates, fixed reaction components, base-buffer contributions, Ginkgo preparation, and assay interpretation.
- Class Coopetition designer: reference compositions, visible stock concentrations, submitted-record readback, and UI estimates.
- Jewett, M. C., and Swartz, J. R. (2004). Mimicking the Escherichia coli cytoplasmic environment activates long-lived and efficient cell-free protein synthesis. Biotechnology and Bioengineering 86(1), 19–26. DOI 10.1002/bit.20026. Critical source locations: supplied PDF pp. 2 and 4–6; Tables I–II.
- Olsen et al. (2026). Design-driven optimization of low-cost reagent formulations for reproducible and high-yielding cell-free gene expression. Nature Communications, DOI 10.1038/s41467-026-69605-8. Critical source locations: supplied PDF pp. 2–7, Table 1, and Fig. 2.
- Groff et al. (2014). Engineering toward a bacterial “endoplasmic reticulum” for the rapid expression of immunoglobulin proteins. mAbs 6(3), 671–678. Primary paper, DOI 10.4161/mabs.28172. FkpA/DsbC evidence is from IgG experiments, principally Results and Figs. 3–5.
- Silverman, Karim, and Jewett (2020). Cell-free gene expression: an expanded repertoire of applications. Nature Reviews Genetics, DOI 10.1038/s41576-019-0186-3. Background reading on CFE, folding, and costs.
- Rasor et al. (2021). Toward sustainable, cell-free biomanufacturing. Current Opinion in Biotechnology, DOI 10.1016/j.copbio.2020.12.012. Background CFME principles; its nonprotein production context does not supply a direct recipe for these targets.
- Smith et al. (2026). Using a GPT-5-driven autonomous lab to optimize the cost and titer of cell-free protein synthesis. bioRxiv preprint, DOI 10.64898/2026.02.05.703998. Background reading on iterative automated optimization; labeled as a preprint.
- Submitted inputs: sfGFP JSON, PETase/TfCut2 JSON, and Reteplase JSON.
- Submission screenshot.
The supplied main PDFs and critical tables were checked. Supplementary and Source Data files were not included in the supplied reading folder and have not been fully audited or reanalysed for this report. Olsen’s article states that these materials are provided with the publication; this is a limitation of the reviewed source collection. Stock-preparation details not established by the main sources and raw-data reanalysis remain outside this report. Olsen, Data availability, PDF p. 12.
Literature results belong to their authors; the new work documented here consists of comparisons, hypotheses, locally checked compositions, and verified submission/participation records. The 8 October update clarifies evidence status and cost provenance; it adds no experimental results and does not change the three submitted compositions.