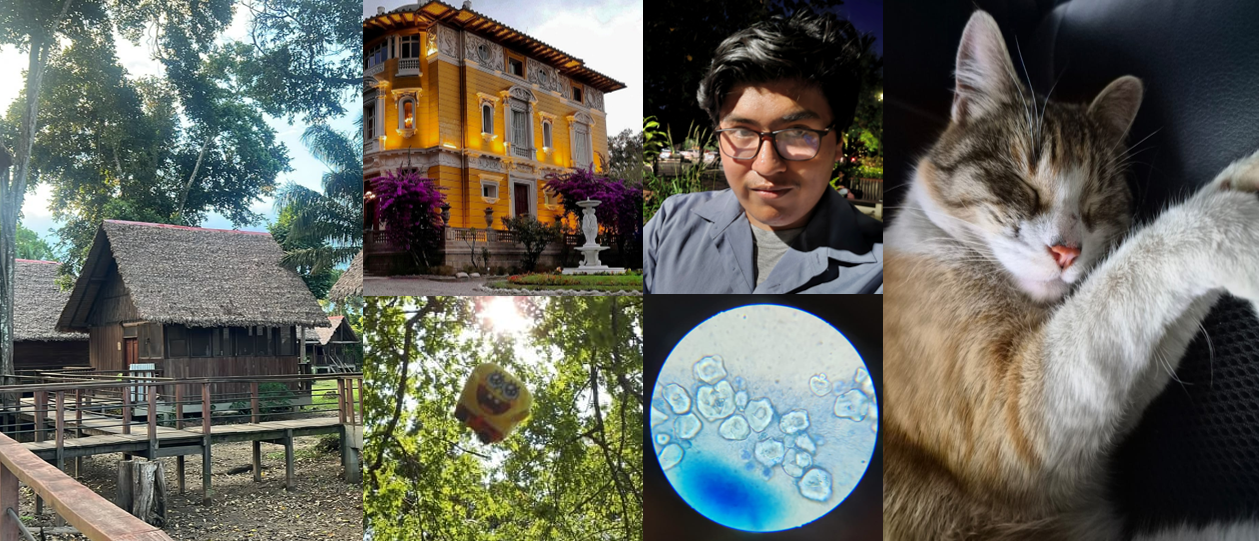
I’m Sergio, an undergraduate Bioengineering student from Bolivia with a strong interest in exploring how synthetic biology and emerging technologies can be applied to create innovative and regenerative solutions. I’m excited about HTGAA because it connects science, creativity, and real-world impact, which aligns with my curiosity for experimenting at the intersection of biology, design, and engineering. I’m looking forward to learning from this community and expanding both my technical skills and my perspective on what’s possible.
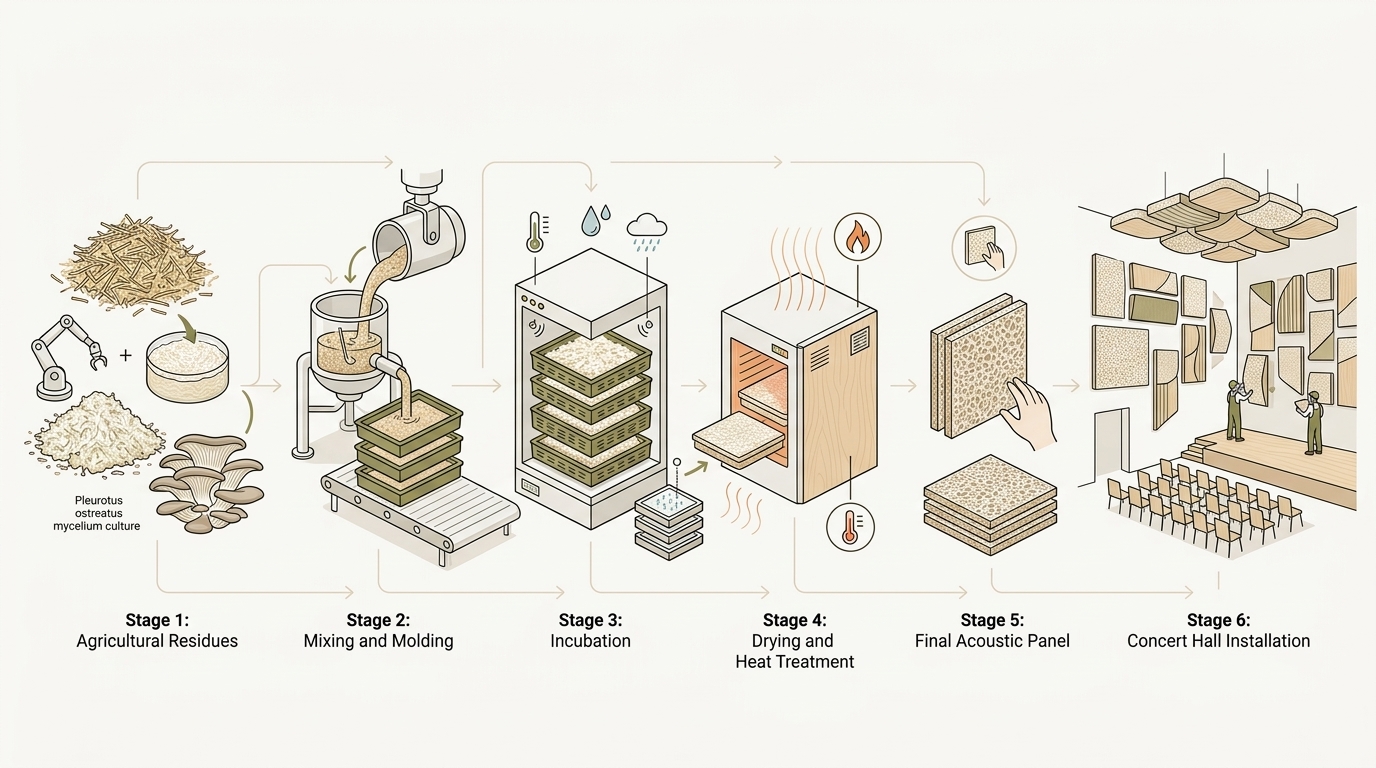
I want to biomanufacture custom-grown mycelium acoustic panels for concert halls, studios, and public buildings. The target product is a lightweight, shaped, sound-absorbing panel made from agricultural waste bound by fungal mycelium. The panel can be grown into custom geometries such as diffusers, clouds, and wall tiles, and then heat-treated to stop fungal growth.
I am interested in this because construction materials are often energy-intensive, petrochemical-based, or non-biodegradable. Mycelium composites can use agricultural byproducts, grow at room temperature, store carbon in the material, and be composted at end of life. For a concert hall, acoustic performance is critical; custom shapes can be grown rather than machined. The product is for architects, acoustic designers, and building occupants. It connects biology, design, and sustainability in a way that I find interesting and important.
2. What living system would I use?
Chassis: white-rot fungus such as Pleurotus ostreatus (oyster mushroom) mycelium. It is a eukaryotic filamentous fungus that grows on lignocellulosic waste.
Inputs:
Agricultural waste substrate: hemp hurd, straw, sawdust, or corn stover.
Fungal spawn (mycelium on grain or sawdust).
Water.
Optional natural binders or fire retardants such as clay or borax, if needed.
Process:
Pasteurize or sterilize the substrate.
Mix substrate with spawn and water.
Fill molds or trays shaped like the desired panel.
Incubate at about 25–30 °C for 2–4 weeks; fungal hyphae colonize and bind the substrate.
Remove from mold, dry, and heat-treat at about 70–80 °C to kill the fungus and prevent spores.
Finish or cut for acoustic mounting.
Output: a solid, porous, mycelium-bound composite panel.
Assumptions: the fungus is non-pathogenic, growth is contained, and the final material can meet fire and acoustic codes after testing.
3. How would I use automation?
I would combine the living system with automated environmental control and robotic handling, plus a desktop liquid-handling robot such as an Opentrons for R&D.
R&D automation: Use an Opentrons or a programmable microfluidics platform to screen substrate formulations, spawn ratios, nutrient supplements, and fungal strains in 24- or 96-well or small tray formats. This would automate inoculation, sampling, and measurement of growth rate, density, and contamination.
Manufacturing automation: Use automated mixing and filling stations, a robotic gantry or conveyor to move trays into climate-controlled incubation rooms, and sensors for temperature, humidity, CO₂, and moisture. Robotic harvesting and drying lines would reduce labor and contamination.
Why: mycelium growth is slow and sensitive to environment. Automation can maintain reproducible conditions, run many parallel batches, and optimize formulations faster than manual trials.
4. How much would I need to make, and how long would it take?
(a) How much?
Scale: acoustic treatment for one medium concert hall.
Assumptions:
Acoustic panel area needed: 1,000 m² (walls, ceiling clouds, diffusers).
Panel thickness: 0.05 m (5 cm).
Mycelium composite density: 200 kg/m³. This is an assumption based on typical low-density mycelium composites, which often range around 100–300 kg/m³. Verify with literature before final submission.
Calculation:
Volume = 1,000 m² × 0.05 m = 50 m³.
Mass = 50 m³ × 200 kg/m³ = 10,000 kg = 10 metric tons of finished panels.
Substrate and spawn:
Assume finished panel is about 90% substrate and 10% fungal biomass/binder by dry mass. So dry substrate ≈ 9,000 kg.
Spawn rate: 10% w/w of dry substrate = 900 kg spawn.
Water: substrate is mixed at about 65% moisture. Wet mass ≈ 9,000 / (1 - 0.65) ≈ 25,700 kg wet mixture. So about 26 tons of wet material to fill molds.
So the meaningful scale is roughly 10 tons of finished panels, requiring about 9 tons dry substrate, 0.9 ton spawn, and 26 tons wet mixture.
(b) How long?
Assumptions:
Each panel is 1 m² × 0.05 m and weighs about 10 kg. Need 1,000 panels.
Facility has 200 tray slots in parallel (small pilot factory).
If 200 panels grow in parallel:
Batches = 1,000 / 200 = 5 batches.
Time = 5 batches × 3 weeks = 15 weeks of incubation.
Add 1 week preparation/finishing = about 16 weeks.
With 1,000 parallel trays, time would be about 3 weeks incubation + 1 week = about 4 weeks.
Automation throughput:
Opentrons for R&D: can screen about 96 formulations per run, several runs per week.
Manufacturing: an automated filling line can fill about 200 trays/day; a robotic gantry can move trays continuously. The bottleneck is biological growth time, not liquid handling.
At scale, a factory with 1,000+ trays and automated climate control could produce about 10 tons per month.
5. What don’t I know yet?
Material performance: Will mycelium panels meet acoustic absorption coefficients, fire safety, moisture resistance, and mechanical strength required for a concert hall? I would need to measure impedance tube absorption, flame spread, and compressive strength.
Contamination and reproducibility: How stable is P. ostreatus growth at 10-ton scale? I would need to test contamination rates, sterilization/pasteurization methods, and batch-to-batch variability.
Scale-up economics: What is the actual yield, drying energy, labor, and cost per m² compared with conventional acoustic panels? I would need a pilot production run and techno-economic analysis.
References
Asin-Garcia, E., et al. (2025). A snapshot of biomanufacturing and the need for enabling research infrastructure. Trends in Biotechnology, 43(5), 1000–1014.
Petzold, C. J., & Mukhopadhyay, A. (2025). From bench to biofactory: High-throughput technologies and automated workflows to accelerate biomanufacturing. Current Opinion in Biotechnology, 94, 103320.
Yap, W. S., Choudhury, D., & Suntornnond, R. (2023). Towards biomanufacturing of cultured meat. Trends in Biotechnology, 41(3), 292–294. Used as general biomanufacturing context.
Additional assumptions from general mycelium composite literature; verify density and acoustic values before final submission.
I created the repository cuiza-mycelium-panels and the folder HTBAA_HW2_Sergio_Cuiza / Cuiza-mycelium-panels in the Kernel HTBAA 2026 workspace. This organization keeps all parts, sequences, and constructs for my project in one centralized location, making it easier to track versions and share work with collaborators.
Part 1: Expression Target (Rationale)
For this design exercise, I chose to express Annexin II, a eukaryotic protein.
Why this molecule? Annexin II is a calcium-dependent phospholipid-binding protein involved in membrane trafficking. While my original HW1 project focused on fungal mycelium panels, I used Annexin II as a placeholder CDS to practice the full genetic assembly workflow. It represents a typical eukaryotic gene of interest (GOI) that requires careful codon optimization and proper regulatory elements. Working with a eukaryotic protein also highlights the challenges of expressing non-native proteins in a prokaryotic host.
Sequence Source: NCBI accession M60769.1 (Xenopus laevis Annexin II mRNA).
Host/Chassis:E. coli was chosen because it is the most well-characterized chassis for biomanufacturing. It grows quickly (doubling time ~20 minutes), is cheap to culture, and has a vast library of available genetic parts.
Localization: Cytoplasm. Since Annexin II functions intracellularly, no signal peptide was added to the design. However, I acknowledge that eukaryotic proteins often require post-translational modifications that E. coli cannot provide.
Part 2: Genetic Parts (Justification)
Every genetic part was chosen to ensure stable maintenance and efficient transcription in the host.
Part Name
Type
Source / Justification
gpdA_promoter
Promoter
Constitutive strong promoter from Aspergillus nidulans (NCBI Z32524.1). It is a well-known fungal promoter used to drive high-level expression.
Annexin_II_CDS_optimized
CDS (+start +stop)
Codon-optimized Annexin II from Xenopus laevis (NCBI M60769.1). Codons were optimized for E. coli to ensure efficient translation.
T7_terminator
Terminator
Standard T7 terminator. It ensures efficient transcription termination, preventing read-through into the backbone and stabilizing the mRNA.
pUC19_backbone
Backbone
Standard E. coli cloning vector. It provides the AmpR selection marker (ampicillin resistance) to select for successful transformants, and the pBR322 origin of replication for high-copy plasmid propagation.
Assembly Logic: The parts were chosen to function together as a single expression cassette. The promoter drives transcription, the CDS is translated into protein, and the terminator ensures the RNA polymerase stops. The backbone allows the construct to replicate inside E. coli and provides a way to select only the bacteria that took up the plasmid.
Part 3: Assembled Construct
Construct Name:Annexin_II_expression_cassette
Order (5’ to 3’):gpdA_promoter → Annexin_II_CDS_optimized → T7_terminator → pUC19_backbone
How it was assembled: In Kernel, I created individual parts and then combined them into a single construct using the “Part match” tool. The parts were arranged in the natural 5’ to 3’ order of transcription. The reading frame was checked in the Sequence Viewer to ensure no internal stop codons were introduced, which would truncate the protein.
Figure 1. Schematic map of the construct generated in Kernel. The sequential order of elements is shown: promoter, optimized CDS, terminator, and backbone.
Figure 2. Circular map of the construct, showing the layout of the complete plasmid. The circular view helps visualize how the elements are connected in the physical DNA molecule.
Figure 3. Linear map of the construct, displaying the sequential arrangement of genetic elements from 5' to 3' without the circular distortion. This view is useful for verifying the exact order of parts.
Figure 4. Sequence viewer of the construct, where the reading frame integrity was verified. This ensures the start codon is in frame with the stop codon.
Part 4: Optimize and Quality-Check
1. Codon Optimization:
I ran Kernel’s codon optimization tool (Optimizer: SIMPLE_0_3) specifically for E. coli.
Why? Different organisms have different abundances of tRNAs. The original Xenopus laevis sequence uses codons that are rare in E. coli, which would cause ribosome stalling and low protein yield. The optimizer changed the DNA sequence to match E. coli’s preferred codons. It also included stop codons (TGA, TAA) and avoided the internal restriction site AbaB8342IV to facilitate future cloning steps.
Result: I saved the new sequence as Annexin_II_CDS_optimized and replaced the original CDS in the construct.
Figure 5. Codon optimization result. Kernel compared the initial sequence (Xenopus) with the optimized one (E. coli). Note the change in nucleotide sequence without altering the protein sequence.
2. Sequence Alignment (Quality Check):
I ran Kernel’s Pairwise Alignment tool to compare my optimized CDS (897 bp) against the original mRNA (1205 bp).
Result: The pairwise identity is 45% at the nucleotide level. This low percentage is expected and correct. Codon optimization intentionally changes the DNA letters (A, T, C, G) while keeping the amino acid sequence identical. The detected insertions/deletions correspond to the untranslated regions (UTRs) present in the original mRNA but absent in the synthetic CDS. The alignment confirms the integrity of the coding region. I have included three screenshots to show the full length of the alignment.
Figure 6. Pairwise alignment (Part 1). Initial view of the nucleotide sequence comparison.
Figure 7. Pairwise alignment (Part 2). Continuation of the alignment showing further nucleotide changes due to codon optimization.
Figure 8. Pairwise alignment (Part 3). Final section of the alignment. The translated protein remains identical to the original.
3. Safety Screen (Biosecurity):
I ran the Biosecurity Sequence Scanner (SecureDNA) on the full assembled construct.
Result: The scanner reported “No flagged sequences detected”. This confirms my construct does not contain any sequences associated with potential biosecurity threats. This is expected because the construct only contains standard regulatory elements (promoter, terminator, backbone) and a normal eukaryotic protein. The scanner checks against databases of regulated pathogens and toxins to ensure the sequence cannot be misused.
Figure 9. Biosecurity scan result (SecureDNA). No dangerous sequences were detected.
Part 5: From Design to Build
A sequence in software is not yet physical DNA. Here is a detailed breakdown of how I would build it, considering both prototyping and scale-up.
Prototype (One construct):
For a single test construct, I would order it as synthetic DNA from a vendor like Twist Bioscience or IDT. At ~4.5 kb, it is well within the standard synthesis limit (usually up to 5-10 kb). This is the fastest and most reliable method because it eliminates the need for multiple cloning steps.
Alternative: If I wanted to save money, I could use Gibson Assembly. This involves designing 20-40 bp overlapping sequences at the ends of the promoter, CDS, terminator, and backbone. The fragments are mixed with an exonuclease, polymerase, and ligase, which seamlessly join them. This is cost-effective for testing a single design and allows for easy swapping of parts.
Synthesis Constraints:
Synthesis has error rates, typically 1 error per 1,000-3,000 bp. My construct contains no highly repetitive sequences, which are notoriously hard to synthesize. However, if I had repeats, I would need to split the synthesis into smaller fragments or use codon variants to break the repeats without changing the protein.
Scale-up (Industrial Production):
If I needed to produce this construct at an industrial scale, I would use chip-based oligo synthesis (Tian et al., 2004). This technology synthesizes millions of oligonucleotides on a microchip in parallel.
Error Correction: Because chip synthesis has high error rates, I would use protein-mediated error correction (Carr et al., 2004). This involves using mismatch-binding proteins (like MutS) to bind to and remove incorrectly synthesized DNA, leaving only the perfect sequences. This allows for the parallel synthesis of thousands of variants, which is useful if I wanted to optimize the promoter or RBS further.
Citations:
Carr, P. A. et al. (2004). Protein-mediated error correction for de novo DNA synthesis. Nucleic Acids Research, 32, e162.
Gibson, D. G. et al. (2009). Enzymatic assembly of DNA molecules up to several hundred kilobases. Nature Methods, 6, 343–345.
Part 6: What don’t I know yet?
Even though the design is complete, there are still major biological risks and unknowns that would need experimental testing.
Promoter Compatibility (Major Flaw):
The Risk: I used the gpdA promoter (fungal) in an E. coli host. E. coli RNA polymerase will not recognize this promoter. This means the gene will not be transcribed, and no protein will be produced.
How to test: I would clone the CDS downstream of a T7 promoter (for BL21(DE3) cells) or a lac promoter (for standard strains). I would measure protein yield using SDS-PAGE or a fluorescent reporter.
Protein Folding and Solubility:
The Risk: Annexin II is a eukaryotic protein. It may not fold correctly in E. coli without specific chaperones, potentially forming inactive inclusion bodies (misfolded protein aggregates).
How to test: I would lyse the cells and run SDS-PAGE to see if the protein is in the soluble fraction or the pellet. If it’s in the pellet, I would try lowering the induction temperature (e.g., 16°C) or co-expressing chaperones (GroEL/ES).
Codon Optimization Sufficiency:
The Risk: While codon optimization improves translation, it does not guarantee high yield. Other factors like mRNA secondary structure can hinder ribosome binding.
How to test: I would measure protein levels via Western blot. If low, I would try different 5’ UTR sequences or a stronger RBS to improve translation initiation.
Plasmid Stability and Toxicity:
The Risk: Leaky expression of a foreign protein can be toxic to E. coli, causing the cells to lose the plasmid or die before induction.
How to test: I would use a tightly controlled promoter (like pET vectors with the lacI repressor) or a low-copy backbone to minimize basal expression. I would also check plasmid retention by plating on ampicillin plates.
AI Citation
AI client: DeepSeek.
Prompts used: Assisted with choosing genetic parts, formatting the Kernel workflow, centering images in Markdown, and drafting the write-up with biological justifications. All biological decisions and sequences were verified by me.
Week 3 HW: Cell-Free Reaction Design
Part A: Compare Cell-Free Reaction Compositions
1. Why do potassium glutamate and magnesium glutamate concentrations differ between compositions? Which is more sensitive?
Potassium glutamate and magnesium glutamate are both essential for cell-free protein synthesis (CFPS), but they serve different biochemical roles and their optimal concentrations depend on the formulation’s goals.
Potassium glutamate primarily maintains ionic strength and provides glutamate as the preferred anion. Glutamate is superior to chloride because it better mimics the E. coli cytoplasmic environment, supports long-lived protein synthesis, and can serve as a nitrogen source. Concentrations typically range from 80 mM to 200 mM. High concentrations (e.g., 200 mM in PANOx) support rapid, high-yield synthesis, while lower concentrations (e.g., 130 mM in Cytomim) are used when mimicking the cytoplasm or reducing cost.
Magnesium glutamate is a critical cofactor for T7 RNA polymerase, ribosome assembly, and nucleotide binding. It is required for the catalytic activity of many enzymes in transcription and translation. Magnesium concentration is highly sensitive: too little leads to inactive ribosomes and polymerase; too much causes non-specific binding and inhibition. Formulations often optimize magnesium separately (e.g., 1–6 mM) while keeping potassium glutamate fixed at a mean concentration.
Which is more sensitive? Magnesium is generally more sensitive. Small changes in Mg²⁺ (1–2 mM) can drastically alter transcription and translation efficiency. Potassium glutamate can be varied over a wider range (80–200 mM) with less dramatic effects, though it still influences yield. The literature notes that magnesium glutamate is often sequentially optimized, while potassium glutamate is set at a mean value, indicating that magnesium requires finer tuning.
Why concentrations differ: Different formulations have different objectives. PANOx maximizes yield and uses 200 mM potassium glutamate and 0 mM magnesium glutamate (relying on other magnesium sources). Cytomim aims to mimic the cytoplasmic environment and uses 130 mM potassium glutamate and 8 mM magnesium glutamate. Cost-optimized formulations may reduce both to lower reagent expenses.
2. Explain how a PEP+NTP reaction formulation is different from a Ribose+NMP reaction formulation.
A PEP+NTP formulation uses phosphoenolpyruvate (PEP) as the primary energy source and nucleotide triphosphates (NTPs: ATP, GTP, CTP, UTP) as direct building blocks for RNA synthesis.
PEP regenerates ATP from ADP via pyruvate kinase. It provides a high-energy phosphate bond, but its metabolism produces a rapid and sustained increase in inorganic phosphate, which can inhibit protein synthesis over time by precipitating magnesium and interfering with enzyme function.
NTPs are added directly, so they do not require phosphorylation. This is convenient but expensive because NTPs are costly to synthesize and purify.
A Ribose+NMP formulation, by contrast, would use ribose as a carbon and energy source and nucleotide monophosphates (NMPs) as precursors.
Ribose can enter glycolysis or the pentose phosphate pathway to generate ATP and reducing equivalents.
NMPs must be phosphorylated to NTPs, consuming ATP. This requires additional enzymatic steps (e.g., nucleoside monophosphate kinases, nucleoside diphosphate kinases). This approach is less common because it is less efficient and more complex, but it could reduce cost if NMPs are cheaper than NTPs.
In practice, most CFPS systems use NTPs directly or alternative energy sources like pyruvate, maltose, or maltodextrin. The term “Ribose+NMP” is not standard in the literature; it may refer to a hypothetical or specialized formulation. The key difference is that PEP+NTP provides energy and building blocks separately, while Ribose+NMP would rely on cellular metabolism to convert precursors into energy and nucleotides, potentially reducing reagent costs but increasing metabolic burden.
3. Choose two cell-free reaction compositions from the literature, compare and contrast the choice of reagents and the concentration of reagents.
I compare the PANOx system and the Cytomim system, both well-characterized in the literature.
Reagent
PANOx System
Cytomim System
Energy substrate
33 mM PEP
33 mM sodium pyruvate
Potassium glutamate
200 mM
130 mM
Magnesium glutamate
0 mM
8 mM
Ammonium glutamate
0 mM
10 mM
Buffering agent
57 mM HEPES-KOH
2.4 mM Tris
Other additives
2% PEG, 2.7 mM sodium oxalate
4 mM sodium oxalate
Comparison of energy substrates: PANOx uses PEP, which provides a burst of ATP but leads to phosphate accumulation and pH drop. Cytomim uses sodium pyruvate, which is metabolized more slowly, producing more stable pH and lower phosphate levels. This makes Cytomim better for long reactions.
Comparison of salts: PANOx relies on a very high potassium glutamate concentration (200 mM) and no magnesium glutamate. Cytomim balances potassium (130 mM) and magnesium (8 mM) glutamate to better mimic the cytoplasmic environment. It also includes ammonium glutamate (10 mM), which PANOx lacks.
Comparison of buffering: PANOx uses HEPES-KOH (57 mM) for buffering, while Cytomim uses Tris (2.4 mM). HEPES is a good buffer for CFPS but is more expensive. Tris is cheaper but can react with certain components.
Comparison of additives: PANOx includes 2% PEG, which can enhance protein folding and prevent aggregation. Cytomim includes a higher concentration of sodium oxalate (4 mM vs 2.7 mM), which may influence energy metabolism.
Contrast: The main differences stem from the choice of energy substrate. PANOx is optimized for high yield in short reactions, while Cytomim is designed for longer-lived reactions with better pH stability. The salt composition reflects these goals: PANOx uses high glutamate to support rapid synthesis, while Cytomim uses a more balanced salt profile to mimic the cytoplasm.
Part B: Design One Reaction Composition for Each Protein
Fixed Components (9,000 nL total)
Component
Volume (nL)
Notes
Lysate
5,000
25% of total reaction. Contains ribosomes, tRNAs, and enzymes. For Reteplase, use IAM-treated lysate from a Δgor strain.
DNA template
2,000
T7-promoter driven gene. The T7 RNA polymerase is supplied by the lysate.
Base buffer
2,000
Provided by the platform. Contains salts, buffers, and other essential components.
Total fixed
9,000
Variable Components (11,000 nL total)
Each variable component must be specified in multiples of 25 nL. The sum of all variable volumes must be exactly 11,000 nL. Any remaining volume is filled with nuclease-free water.
1. sfGFP – Reducing Condition
Reagent
Volume (nL)
Justification
Amino acid mix
2,000
Provides all 20 amino acids for protein synthesis.
ATP
500
Primary energy currency for transcription and translation.
GTP
500
Required for transcription initiation and elongation.
CTP
500
Substrate for mRNA synthesis.
UTP
500
Substrate for mRNA synthesis.
PEP
1,000
Regenerates ATP from ADP via pyruvate kinase.
Potassium glutamate
1,500
Maintains ionic strength and provides glutamate as the preferred anion.
Magnesium glutamate
500
Essential cofactor for T7 RNA polymerase and ribosomes.
HEPES-KOH
1,000
Maintains pH at ~7.5 for optimal enzyme activity.
Folinic acid
250
Cofactor for amino acid and nucleotide synthesis.
NAD
250
Redox cofactor for energy metabolism.
CoA
250
Cofactor for energy metabolism and fatty acid synthesis.
Spermidine
250
Stabilizes DNA and stimulates translation.
cAMP
250
Regulates gene expression and enhances transcription.
Brij-35
100
Non-ionic detergent that improves protein solubility.
DMSO
100
Solvent that improves solubility of reagents and may enhance folding.
Nuclease-free water
1,550
Fills to 11,000 nL.
Total variable
11,000
Justification: sfGFP is a robust, well-folded protein with no disulfide bonds. Its two cysteines remain as free thiols. A standard reducing environment with DTT in the lysate is sufficient. This composition provides ample energy, salts, and cofactors for high-yield expression. sfGFP serves as the baseline control to confirm the reaction is functioning.
2. PETase – Reducing Condition
Reagent
Volume (nL)
Justification
Same as sfGFP
11,000
PETase (TfCut2) contains one disulfide bond, but it remains compatible with reducing conditions.
Justification: PETase is a serine hydrolase from Thermobifida fusca with a catalytic triad (Ser170, Asp216, His248) and one disulfide bond. Unlike Reteplase, this single disulfide bond can form correctly in the presence of the lysate’s natural oxidoreductases. The reducing condition maintains free thiols and prevents aggregation. Using the same formulation as sfGFP reduces reagent inventory and simplifies the screening workflow. If PETase activity is low, a mild oxidizing condition with low GSSG could be tested.
3. Reteplase – Oxidizing / DSB Condition
Reagent
Volume (nL)
Justification
Amino acid mix
2,000
Building blocks for protein synthesis.
ATP
500
Energy for transcription and translation.
GTP
500
Energy and substrate for transcription.
CTP
500
Substrate for mRNA synthesis.
UTP
500
Substrate for mRNA synthesis.
PEP
1,000
Energy regeneration via phosphoenolpyruvate.
Potassium glutamate
1,500
Ionic strength and pH stabilization.
Magnesium glutamate
500
Essential cofactor for polymerases and ribosomes.
HEPES-KOH
1,000
Buffer to maintain pH.
Folinic acid
250
Cofactor for amino acid synthesis.
NAD
250
Redox cofactor.
CoA
250
Cofactor for energy metabolism.
Spermidine
250
Stabilizes DNA and stimulates translation.
cAMP
250
Regulates gene expression.
GSSG (oxidized glutathione)
500
Creates oxidizing environment for disulfide bond formation.
GSH (reduced glutathione)
500
Maintains redox balance and prevents over-oxidation.
DsbC
500
Disulfide-bond isomerase that rearranges incorrectly paired disulfide bonds.
Brij-35
100
Detergent to improve protein solubility.
DMSO
100
Solvent to improve solubility of reagents.
Nuclease-free water
50
Fills to 11,000 nL.
Total variable
11,000
Justification: Reteplase is a 355-amino-acid therapeutic derived from human tPA with nine disulfide bonds that must pair correctly for activity. It cannot fold in a reducing environment. Three modifications are required:
Modified lysate: Prepared without DTT, treated with iodoacetamide (IAM) to cap free thiols, then quenched with cysteine. This prevents the lysate from reducing newly formed disulfide bonds.
Redox buffer: GSSG/GSH in a controlled ratio to establish an oxidizing environment. The ratio can be tuned (e.g., 2:1, 4:1, 8:1) to optimize folding.
Folding helper: DsbC, a disulfide-bond isomerase, to rearrange incorrectly paired disulfide bonds. Lysate from a Δgor strain preserves the oxidizing environment.
Community Reagent Contribution
Reagent proposed: Trehalose
Rationale: Trehalose is a non-reducing disaccharide that stabilizes proteins and prevents aggregation. It acts as a chemical chaperone, helping proteins maintain solubility during translation and reducing inclusion body formation. For Reteplase, which is prone to misfolding, trehalose could improve the yield of active protein. It is cheap, safe, and compatible with CFPS. Literature suggests that trehalose can enhance CFPS yields by stabilizing the translation machinery and promoting proper folding.
How I decided: I looked for additives that improve folding of disulfide-bonded proteins. Trehalose is widely used in biopreservation and has been tested in CFPS. It is a low-cost reagent with high potential impact, especially for the DSB formulation required by Reteplase.
Example study: “Trehalose enhances cell-free protein synthesis by stabilizing the translation machinery” (verify exact citation).
Forum Participation
Post to CFPS coopetition forum:
Optimization idea for Reteplase: I’d like to share an idea for optimizing the CFPS formulation for Reteplase, which is the most challenging target due to its nine required disulfide bonds.
My proposal is to test a matrix of conditions specifically focused on improving the yield of correctly folded, active protein. Instead of testing a single variable, I suggest we screen a combination of the following factors:
Redox Buffer Ratio: Test a matrix of different GSSG:GSH ratios (e.g., 2:1, 4:1, and 8:1) to find the optimal oxidizing environment that favors disulfide bond formation without causing over-oxidation.
Folding Helper Concentration: Vary the concentration of the disulfide-bond isomerase DsbC (e.g., 0 nL, 250 nL, and 500 nL). DsbC is crucial for rearranging incorrectly paired disulfide bonds into their native, active conformation.
Incubation Temperature: Include a lower incubation temperature of 25°C in the screen, in addition to the standard 30°C. Slower translation and folding at a lower temperature can often improve the yield of complex, multi-disulfide-bonded proteins by reducing the formation of inactive inclusion bodies.
By testing these conditions in a combinatorial matrix, we can identify a formulation that significantly increases the yield of active Reteplase and provides a more robust, general strategy for producing other difficult-to-fold proteins in our CFPS system.
Looking forward to hearing your thoughts!
Part C: Asimov Kernel (Optional)
I built T7-compatible plasmids for cell-free expression of sfGFP, PETase, and Reteplase using Kernel. Each construct contains:
T7 promoter
RBS (BBa_B0034)
Codon-optimized CDS for E. coli
T7 terminator
pET backbone
Bonus helper plasmid: I designed a T7 helper plasmid co-expressing DsbC and chaperones GroEL/ES, DnaK/J/GrpE to improve folding of Reteplase. This plasmid can be added to the CFPS reaction to enhance disulfide bond formation and protein solubility.
AI Citation
AI client: DeepSeek Prompts used:
“Help me design CFPS compositions for sfGFP, PETase, and Reteplase, with volumes summing to 11,000 nL and biological justifications.”
“Write a forum post idea about optimizing Reteplase.”
“Generate the complete document in Markdown with tables and explanations.”
All biological decisions, volume calculations, and reagent choices were verified and adjusted by me.