Week 1 Homework - Biomanufactured Phage Particles With Enhanced Receptor and Host Specificity for Antibiotic Resistance
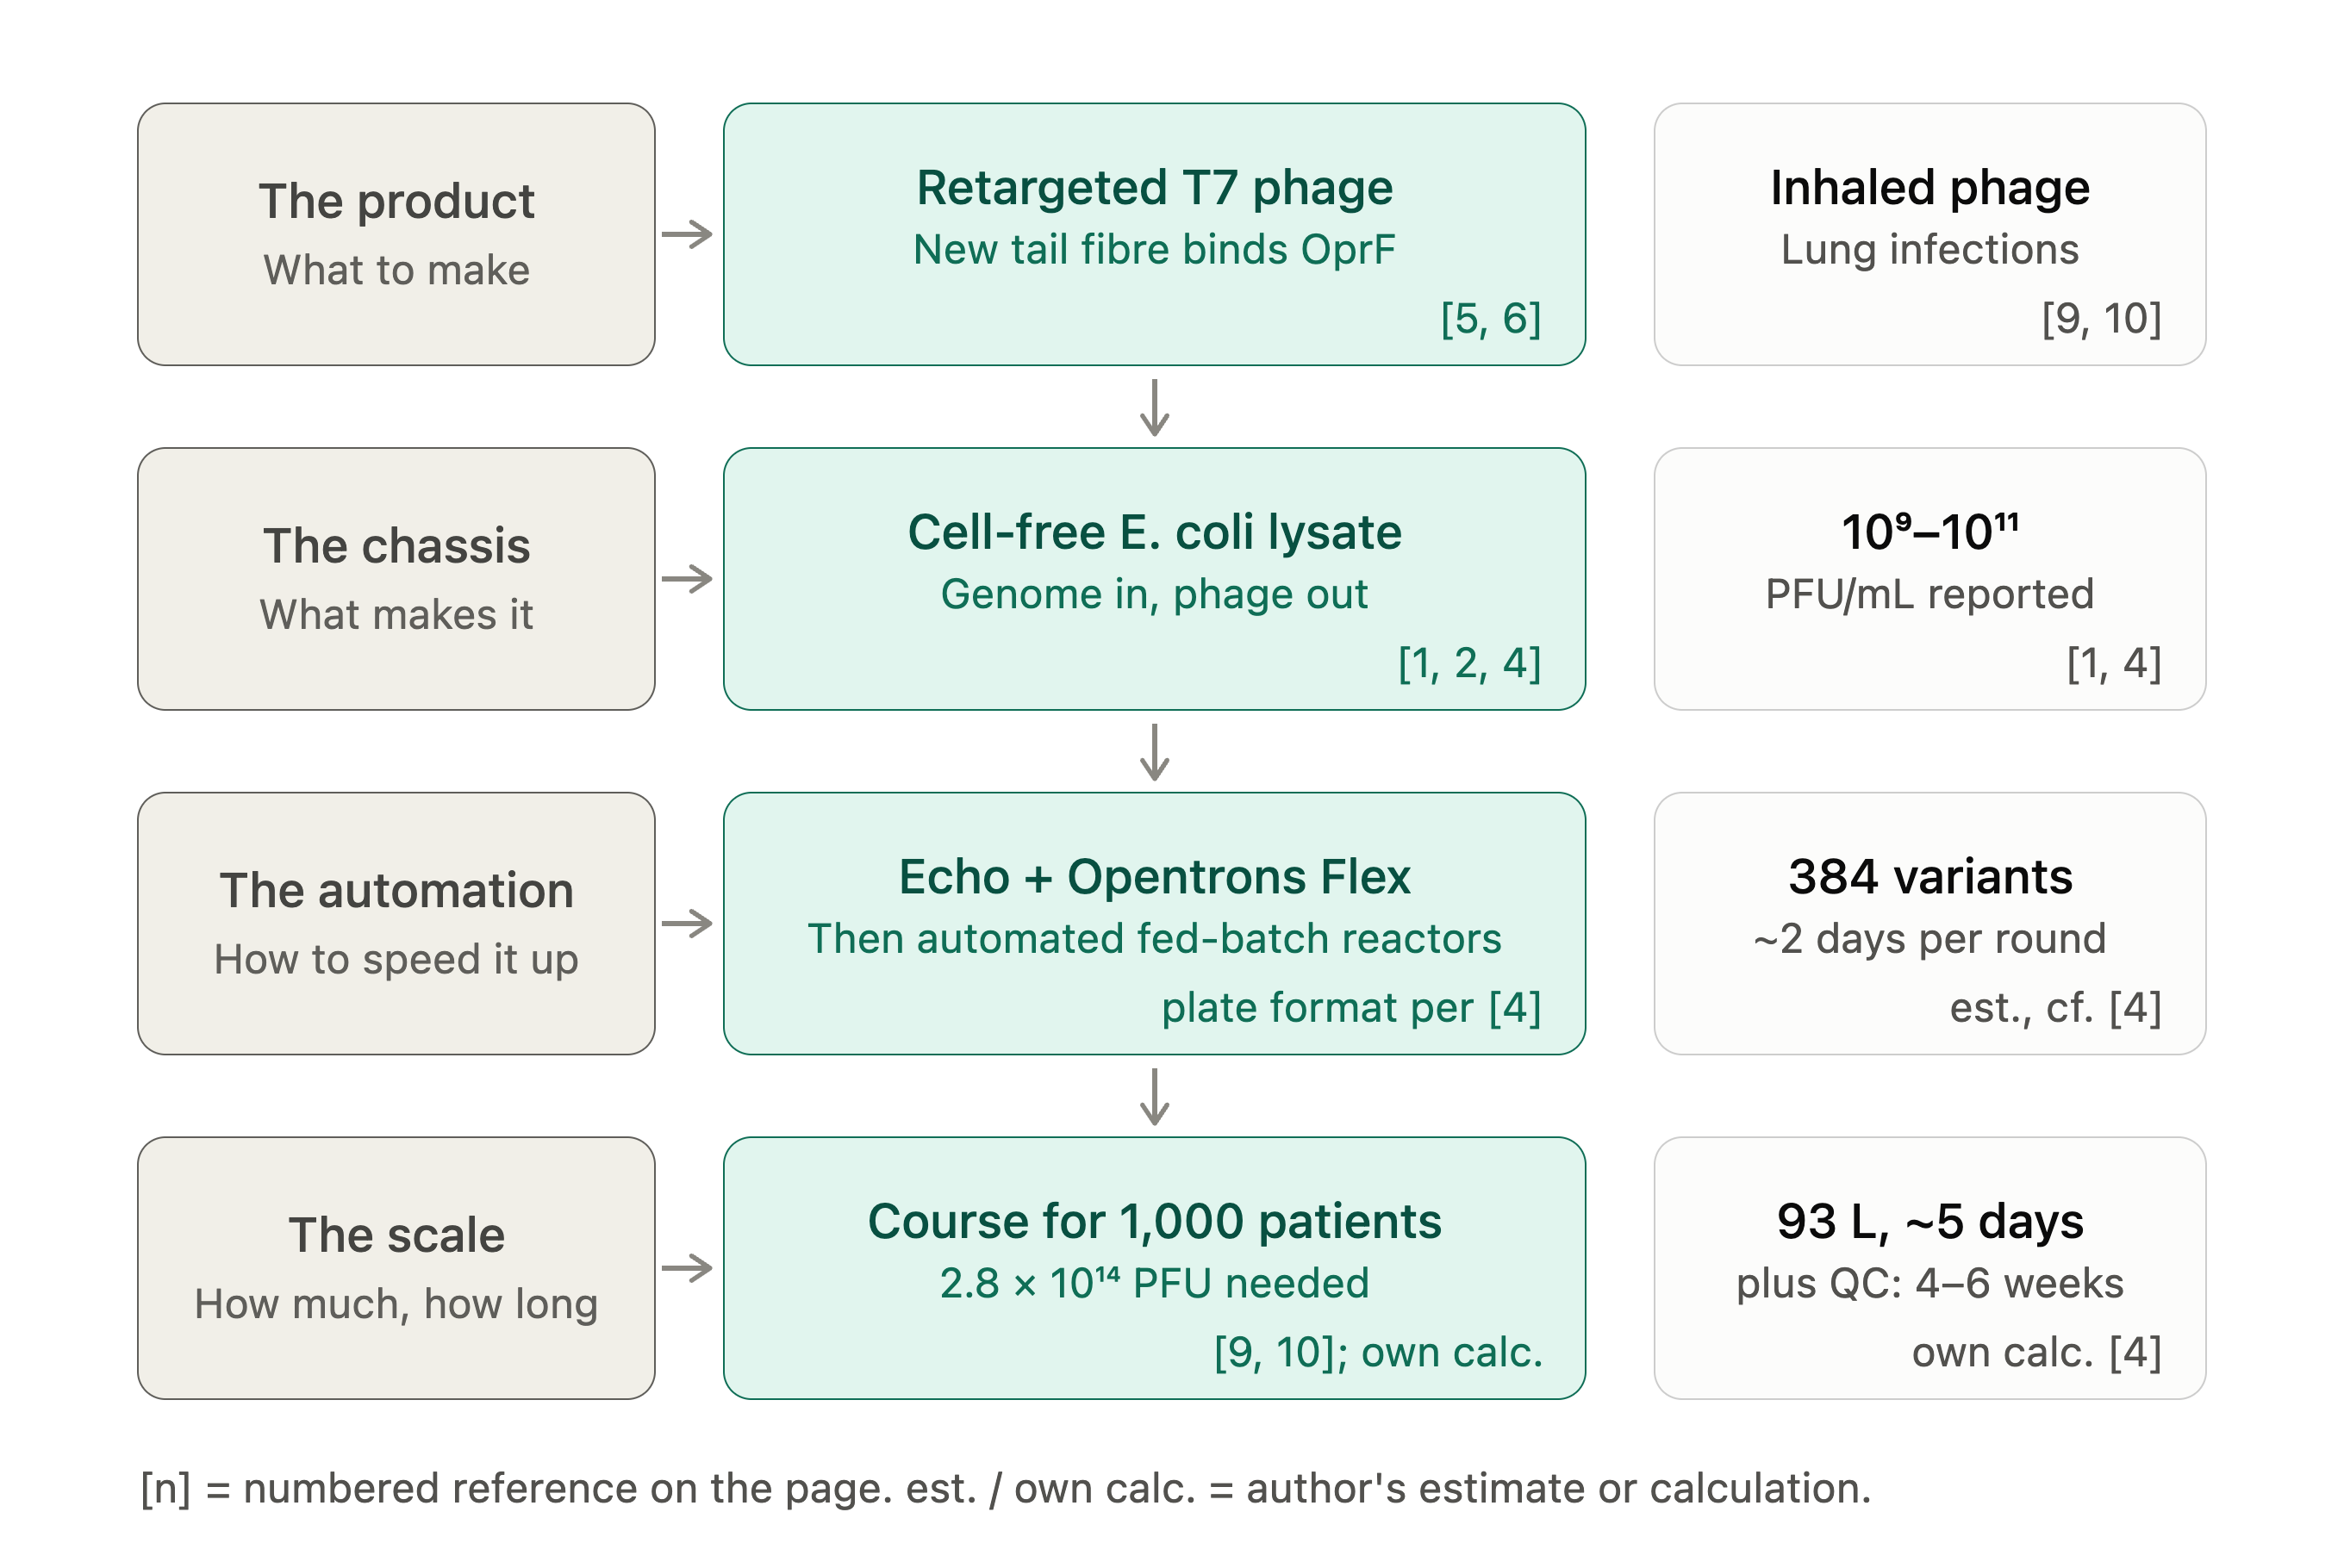
Figure 1. Overview of the proposed cell-free biomanufacturing route for retargeted T7 phage. Bracketed numbers refer to the References below; “est.” and “own calc.” mark the author’s estimates and calculations.
1. What I would like to biomanufacture, and why?
I would like to manufacture engineered bacteriophage particles, specifically T7 phage carrying a redesigned gp17 receptor-binding domain (RBD) that targets the outer-membrane protein OprF of Pseudomonas aeruginosa — as a therapeutic product.
The product is a purified, endotoxin-reduced suspension of infectious phage particles, formulated at a defined titre (plaque-forming units per millilitre) for nebulised or topical delivery. It is intended for people with chronic P. aeruginosa infection: cystic fibrosis and bronchiectasis patients with established airway colonisation, and burns or chronic-wound patients where the organism is multidrug-resistant.
My motivation is partly utilitarian and partly personal to the work I have already done. P. aeruginosa is on the WHO priority pathogens list, where carbapenem-resistant isolates are classed as high priority (BPPL 2024) [12], and these isolates leave very little left to prescribe. Phage therapy works, but almost every successful case to date has been artisanal: a clinician finds a matching phage in a collection, one patient at a time, over weeks (for example, the personalised aerosolised treatment reported in [9]). The bottleneck is not biology, it is manufacturing — we cannot yet make a specified phage quickly, safely, and reproducibly.
This connects directly to my existing computational work, where I redesigned the gp17 RBD of T7 to bind OprF using ProteinMPNN [13], ESM3 [14], and AlphaFold-Multimer [15], with a lead candidate (LC-0.36) predicted to improve interface confidence substantially over wild type. That work stops at a sequence on a screen. This proposal is the natural continuation: how do you actually turn a designed RBD sequence into doses? What makes it interesting to me is that the design step is now fast and the manufacturing step is not, so the manufacturing side is where the real leverage is.
A design note worth stating up front: T7 is a lytic phage with a short, well-characterised genome (~40 kb) [4], and its host range is dominated by the tail-fibre/RBD [4–6], which makes it unusually amenable to retargeting. I would also delete or inactivate any genes not required for lysis and assembly (a 35.8 kb T7 with three non-essential regions deleted has been made in cell-free reactions [4]), and would not carry antibiotic-resistance markers in the therapeutic construct.
2. What living system would I use?
Primary chassis: a cell-free protein synthesis (TXTL) system — E. coli lysate-based used to bootstrap whole infectious phage from purified genomic DNA.
This is the part of the proposal I think is genuinely interesting, and it is not hypothetical: T7, T4, and several other phages have been shown to self-assemble into infectious particles in E. coli cell extracts supplied only with their genome, an energy regeneration system, amino acids, and NTPs (the Noireaux group’s TXTL work is the key reference here [1–4]).
Inputs: (i) the engineered T7 genome, assembled from synthetic or PCR-amplified fragments with the redesigned gp17 RBD swapped in — by Gibson or yeast assembly, or by exonuclease III–based annealing, which unlike Gibson can be added directly to the cell-free reaction without clean-up [4]; (ii) E. coli S30-type lysate supplying ribosomes, tRNAs, and translation factors; (iii) an energy/substrate buffer — amino acids, NTPs, Mg²⁺/K⁺, and a phosphate-based energy regeneration system such as 3-PGA or creatine phosphate.
Process: the lysate’s endogenous RNA polymerase transcribes the T7 early genes from the phage’s own promoters; T7 RNAP is then produced and drives the middle and late genes, including capsid, scaffolding, tail, and tail-fibre proteins. Capsid assembly, genome packaging by the terminase, and tail attachment all occur spontaneously in the tube, because phage morphogenesis is self-assembling and requires no host membrane.
Output: infectious phage particles in a cell-free reaction, at reported titres on the order of 10⁹–10¹¹ PFU/mL [1, 4].
Why cell-free rather than infecting live E. coli? Three reasons, and they all bear on manufacturing. First, there is no living host, so there is no endotoxin-laden bacterial culture to remove and no risk of lysogeny or host-genome carryover — a major regulatory advantage for an injectable or inhaled product. Second, retargeted phage often cannot be propagated on its intended host (you do not want to culture P. aeruginosa at manufacturing scale) nor on E. coli (the redesigned RBD no longer binds E. coli LPS) — cell-free sidesteps this host-range trap entirely [4, 7], which is the single biggest practical obstacle to retargeted phage production. Third, the reaction is linear and additive: one genome sequence in, particles out, with no strain-construction step.
Assumptions I am making: that the redesigned RBD folds and trimerises correctly in a cell-free context; that cell-free titres reported for wild-type T7 hold approximately for the retargeted variant (they may not — see §5); and that a scaled reaction behaves like a scaled-up batch rather than requiring a fundamentally different format.
Secondary/backup chassis: a surrogate E. coli strain engineered to surface-display OprF, allowing conventional high-titre lytic propagation. Cheaper per particle, but reintroduces endotoxin and host-DNA removal burden.
3. How would I use automation?
I would use automation at two distinct stages, and they call for different technology.
(a) Prototyping — acoustic dispensing plus an Opentrons Flex for design-build-test cycling.
The computational pipeline gives me not one RBD but a ranked panel of perhaps 96–384 designs. The step that actually limits me is not designing them, it is testing them. I would automate:
Reaction assembly: nanolitre acoustic dispensing (Echo-style) to set up cell-free reactions in 384-well plates — each well a different RBD variant genome — at 5–10 µL per reaction [4], conserving lysate, which is the expensive reagent.
Screening readout: plate-reader kinetics on a fluorescent reporter encoded in the phage genome to confirm expression, followed by automated spotting of each well onto P. aeruginosa lawns (Opentrons Flex with a pipetting head) to score infectivity and host range.
Optimisation: the cell-free reaction composition itself (Mg²⁺, K⁺, energy source, DNA concentration) has a strong, non-obvious optimum per construct. This is a classic design-of-experiments problem, and I would run active-learning-driven DoE across the plate rather than one-factor-at-a-time.
This turns a design-build-test cycle from a week or more for in vivo phage engineering methods [4] to roughly two days per round, which is where most of the value sits.
(b) Manufacturing — automated fed-batch cell-free reactors with in-line monitoring.
At scale the format changes. Rather than thousands of wells, I would run litre-scale stirred cell-free reactions with automated feeding of energy substrates (cell-free reactions stall on phosphate depletion and pH drift, not on ribosome availability), automated sampling into an at-line plaque or qPCR titre assay, and automated tangential-flow filtration and chromatography for particle purification. This is also where a Cloud Lab or a CDMO-style automated suite would be used, because the process must be reproducible under a documented protocol, not just successful once.
The important point is that the prototyping automation and the manufacturing automation share almost nothing except the biology — and I think that gap is itself one of the main themes of this course.
4. How much, and how long?
(a) How much?
Scale I am defining: a full therapeutic course for 1,000 patients with chronic P. aeruginosa airway infection.
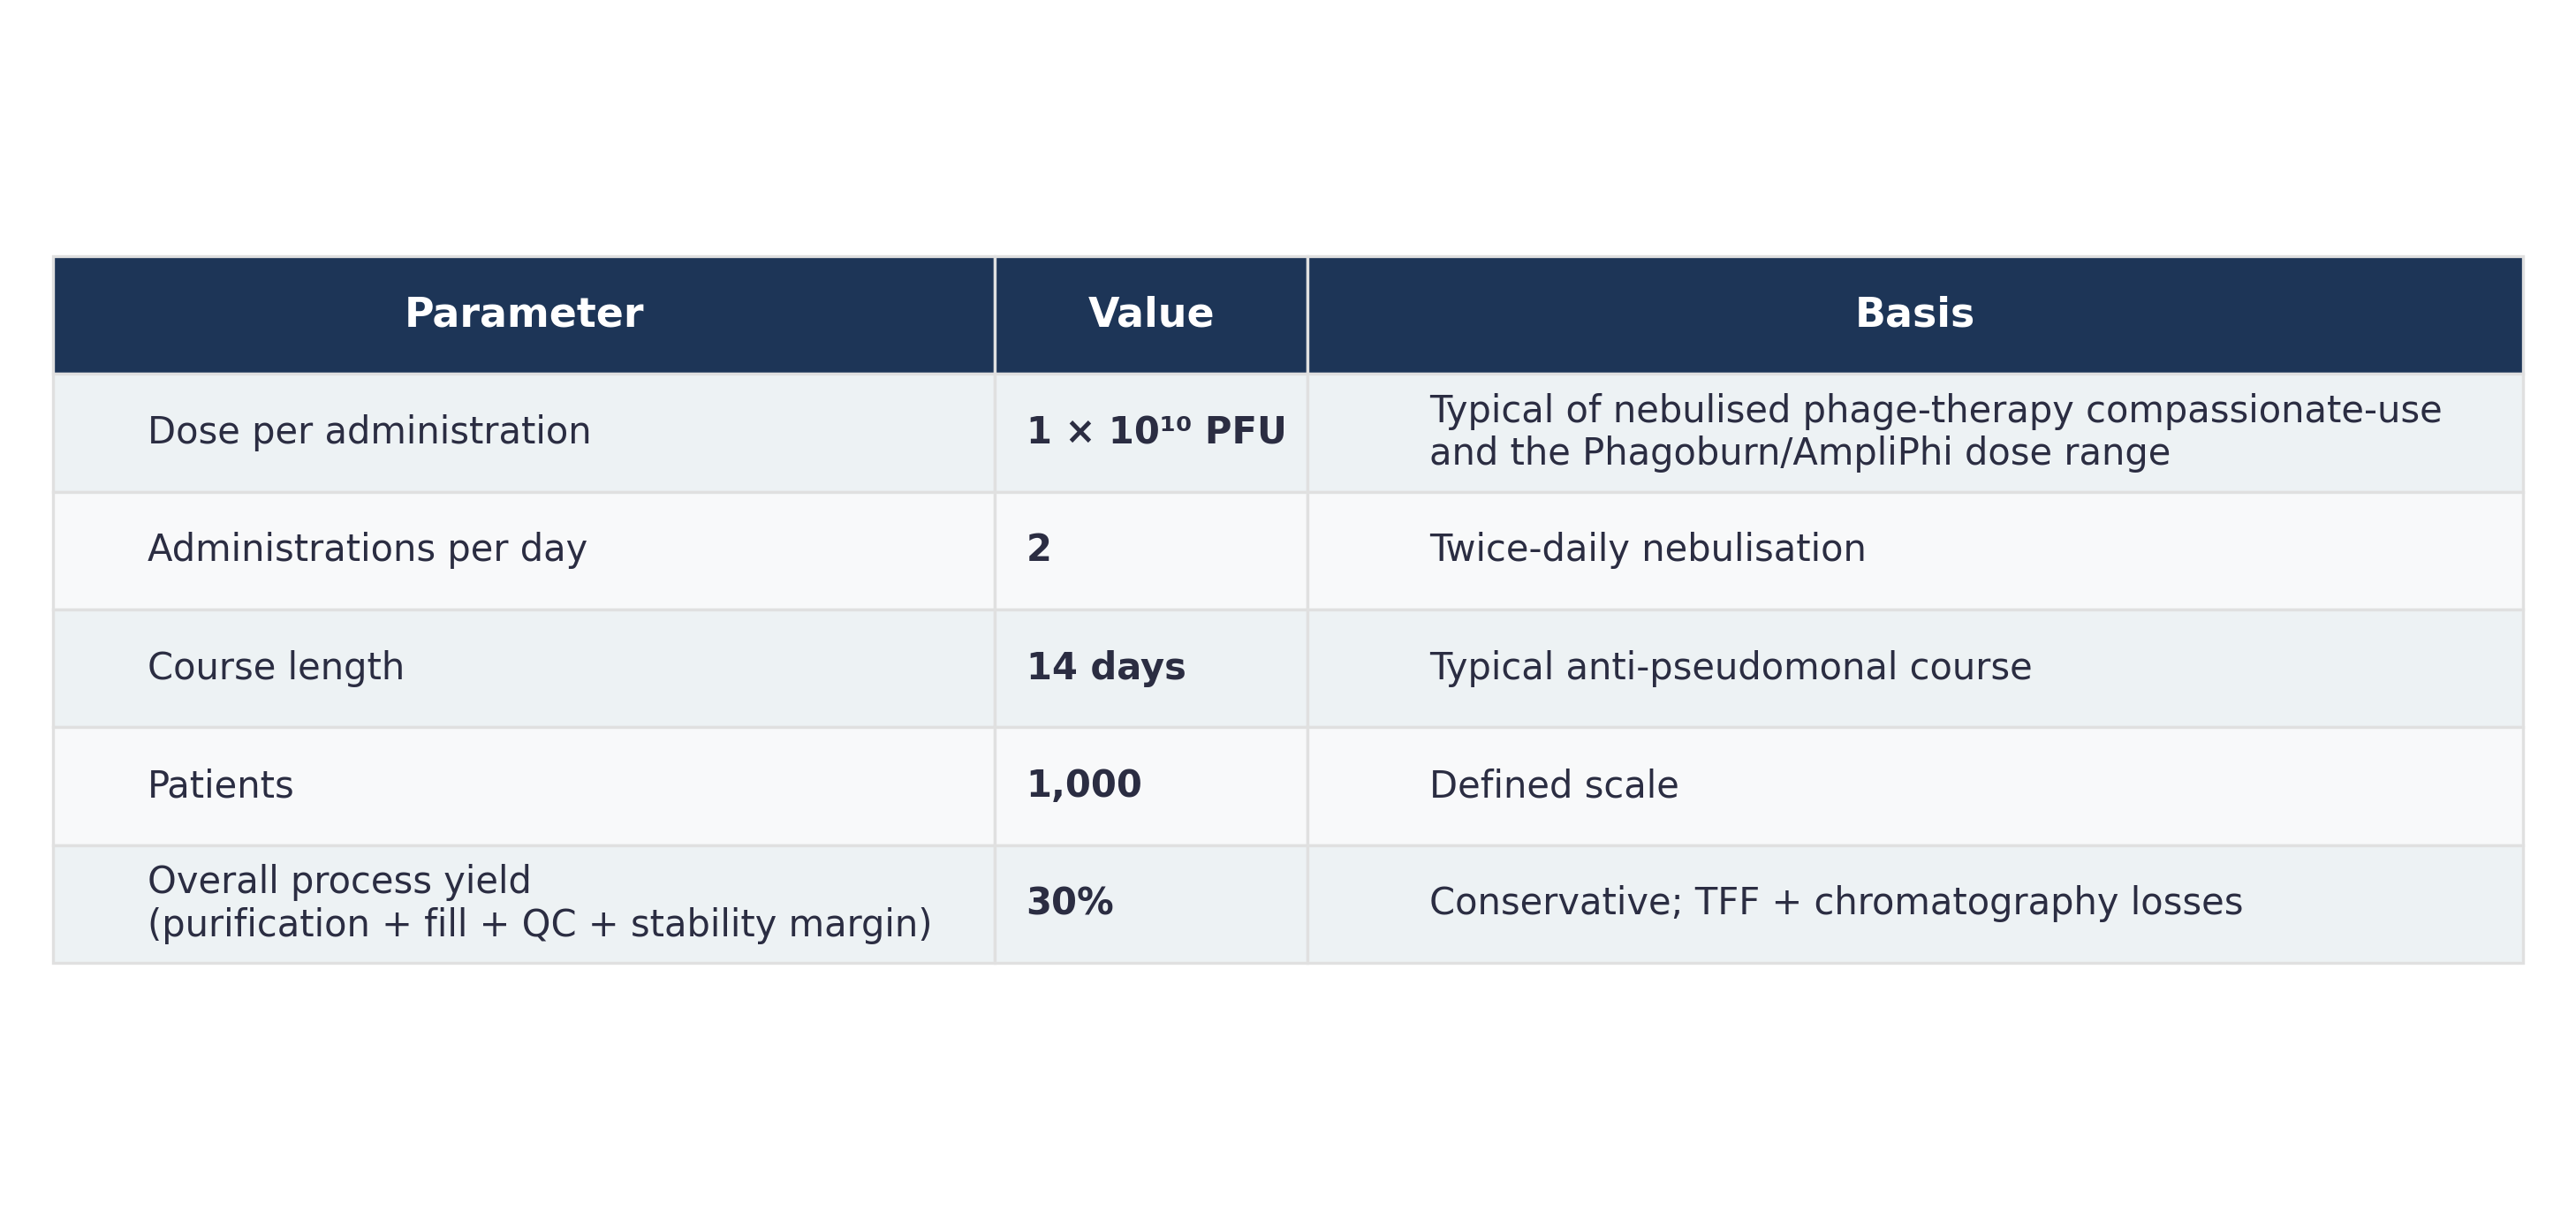
Assumptions (with sources noted):
Sources for the assumptions: the dose per patient sits above the 5 × 10⁹ PFU/day (five days) used in a published aerosol case [9] and follows a twice-daily nebulised schedule like that in a phase 1b/2a study [10]; the titre range comes from [1, 4]; the 30% overall yield and the patient number are my own assumptions.
Phage required per patient:
1 × 10¹⁰ PFU × 2 /day × 14 days = 2.8 × 10¹¹ PFU per course
For 1,000 patients:
2.8 × 10¹¹ × 1,000 = 2.8 × 10¹⁴ PFU
Correcting for 30% overall yield:
2.8 × 10¹⁴ / 0.30 ≈ 9.3 × 10¹⁴ PFU must be produced in the reactor
Converting to reaction volume, assuming a cell-free titre of 1 × 10¹⁰ PFU/mL (a deliberately conservative figure from the reported 10⁹–10¹¹ range [1, 4]):
9.3 × 10¹⁴ PFU ÷ 1 × 10¹⁰ PFU/mL = 9.3 × 10⁴ mL ≈ 93 litres of cell-free reaction
If the higher end of the reported range (10¹¹ PFU/mL) is achievable, this drops to ~9.3 L — which is the difference between a benchtop process and a plant, and is why titre is the number I care most about (§5).
(b) How long?
Per-batch time: a T7 cell-free reaction reaches plateau in roughly 6–8 hours at 29–30 °C (T7 reached its reported titre after about 3 hours at 29 °C in [4], so this is conservative). Adding reactor turnaround, clarification, TFF, and polishing chromatography, I will assume 24 hours per batch end-to-end, with purification of batch n overlapping the reaction of batch n+1.
Configuration: 4 × 5 L reactors run in parallel = 20 L of reaction per batch cycle.
93 L ÷ 20 L per cycle = ~4.7 → 5 batch cycles
5 cycles × 24 h = 120 hours ≈ 5 days of production
Adding genome assembly and QC release (sterility, endotoxin, titre, sequence identity), realistically 4–6 weeks from sequence to released doses, with the QC and release steps — not the biology — dominating the timeline.
Prototyping timeline, for contrast: 384 variants × 10 µL = 3.84 mL of total reaction volume (lysate is about a third of this [2]), one 8-hour reaction, one overnight plaque readout. One design-build-test round per ~48 hours. Roughly four orders of magnitude less material to test 384 designs than to treat 1,000 patients (3.84 mL versus 93 L) — which I think is the clearest illustration of why prototyping and manufacturing need different automation.
Sanity check:
93 L of cell-free reaction is large but not absurd — it is comparable to a mid-size pilot bioreactor batch, and it treats 1,000 patients for two weeks. Scaling to all ~100,000 people with CF worldwide (an estimated 105,000 are diagnosed [11]) would need ~9,300 L, at which point the lysate supply chain, not the phage biology, becomes the binding constraint.
5. What I don't know yet
Does the retargeted phage actually assemble and remain infectious — and at what titre? Every number in §4 scales inversely with titre, and the 10⁹–10¹¹ PFU/mL spread [1, 4] is two orders of magnitude, i.e. the difference between 9 L and 930 L. In the PHEIGES study, libraries of tail-fibre mutants gave lower titres than wild-type T7, and titre fell as mutation load rose [4], which is a first sign that retargeting may cost yield. The redesigned RBD must fold, trimerise, and be incorporated into the tail at wild-type-like efficiency; a design that binds OprF beautifully in an AlphaFold-Multimer model may still assemble poorly, or may bind so tightly that it fails to release and eject its genome. To determine: measure cell-free titre for the top designs directly, and separately measure adsorption rate constant and burst behaviour on P. aeruginosa — binding affinity and infectivity are not the same variable, and I have so far only optimised the first.
Cost and scalability of the lysate itself. Cell-free is elegant at 10 µL and potentially prohibitive at 93 L. The reactions in [4] were run at 1–10 µL, and I have not found litre-scale cell-free phage data. Lysate is currently the dominant cost and is produced by, ironically, growing and lysing large volumes of E. coli — so the endotoxin problem I claimed to avoid may simply move upstream into the lysate. To determine: cost per PFU in cell-free versus surrogate-host propagation, and residual endotoxin in the final product from the lysate route.
Resistance and regulatory identity. P. aeruginosa can downregulate or modify OprF, and a single-receptor phage invites escape mutants [8] — a cocktail of several RBD designs against different receptors is almost certainly the real product. But a cocktail multiplies the manufacturing and regulatory burden by its number of components, and current frameworks do not cleanly accommodate a product whose composition is meant to change per patient. To determine: escape frequency against single designs versus a cocktail in vitro, and which parts of the process must be re-validated when one component is swapped.
References
Shin, J., Jardine, P., & Noireaux, V. (2012). Genome replication, synthesis, and assembly of the bacteriophage T7 in a single cell-free reaction. ACS Synthetic Biology, 1(9), 408–413. https://doi.org/10.1021/sb300049p
Rustad, M., Eastlund, A., Marshall, R., Jardine, P., & Noireaux, V. (2017). Synthesis of infectious bacteriophages in an E. coli-based cell-free expression system. Journal of Visualized Experiments, 56144. https://doi.org/10.3791/56144
Rustad, M., Eastlund, A., Jardine, P., & Noireaux, V. (2018). Cell-free TXTL synthesis of infectious bacteriophage T4 in a single test tube reaction. Synthetic Biology, 3(1), ysy002. https://doi.org/10.1093/synbio/ysy002
Levrier, A., Karpathakis, I., Nash, B., Bowden, S. D., Lindner, A. B., & Noireaux, V. (2024). PHEIGES: all-cell-free phage synthesis and selection from engineered genomes. Nature Communications, 15, 2223. https://doi.org/10.1038/s41467-024-46585-1
Huss, P., Meger, A., Leander, M., Nishikawa, K., & Raman, S. (2021). Mapping the functional landscape of the receptor binding domain of T7 bacteriophage by deep mutational scanning. eLife, 10, e63775.
Garcia-Doval, C., & van Raaij, M. J. (2012). Structure of the receptor-binding carboxy-terminal domain of bacteriophage T7 tail fibers. Proceedings of the National Academy of Sciences, 109, 9390–9395.
Emslander, Q., Vogele, K., Braun, P., Stender, J., Willy, C., Joppich, M., Hammerl, J. A., Abele, M., Meng, C., Pichlmair, A., Ludwig, C., Bugert, J. J., Simmel, F. C., & Westmeyer, G. G. (2022). Cell-free production of personalized therapeutic phages targeting multidrug-resistant bacteria. Cell Chemical Biology, 29(9), 1434–1445.e7. https://doi.org/10.1016/j.chembiol.2022.06.003
Yehl, K., Lemire, S., Yang, A. C., Ando, H., Mimee, M., Torres, M. D. T., de la Fuente-Nunez, C., & Lu, T. K. (2019). Engineering phage host-range and suppressing bacterial resistance through phage tail fiber mutagenesis. Cell, 179, 459–469.e9.
Nebulized phage therapy for patients with cystic fibrosis with chronic Pseudomonas aeruginosa pulmonary infection: a phase 1b/2a randomized, double-blind, placebo-controlled, multicenter study [Conference abstract 2891]. https://www.ncbi.nlm.nih.gov/pmc/articles/PMC10678098/
Guo, J., Garratt, A., & Hill, A. (2022). Worldwide rates of diagnosis and effective treatment for cystic fibrosis. Journal of Cystic Fibrosis, 21, 456–462. https://pubmed.ncbi.nlm.nih.gov/35125294/
World Health Organization. (2024). WHO bacterial priority pathogens list, 2024: Bacterial pathogens of public health importance to guide research, development and strategies to prevent and control antimicrobial resistance. Geneva: WHO. https://www.who.int/publications/i/item/9789240093461
Dauparas, J., et al. (2022). Robust deep learning-based protein sequence design using ProteinMPNN. Science, 378, 49–56.
Hayes, T., et al. (2025). Simulating 500 million years of evolution with a language model. Science, 387, 850–858.
Karim, A. S., & Jewett, M. C. (2021). Toward sustainable, cell-free biomanufacturing. Current Opinion in Biotechnology, 69, 136–144. https://doi.org/10.1016/j.copbio.2020.12.012
Petzold, C. J., & Mukhopadhyay, A. (2025). From bench to biofactory: High-throughput technologies and automated workflows to accelerate biomanufacturing. Current Opinion in Biotechnology, 94, 103320. https://doi.org/10.1016/j.copbio.2025.103320
AI use
Claude (Anthropic, Claude Sonnet 5) was used to check this page against the assignment, to find and verify sources, to build the overview figure, and to insert in-text citations.
Week 2 HW: DNA Design
HTBAA Homework #2 — Genetic construct design
Part 0: Set up
Kernel access is still being sorted, so I’ve built this design in Benchling
in the meantime.
This it the T7 phage tail redesigned (Chain A and Chain B) with different constructs for each chain.
What I’m expressing. A protein: a soluble, engineered receptor-binding domain
(RBD) derived from the bacteriophage T7 tail fibre protein gp17, redesigned to bind
OprF on Pseudomonas aeruginosa. In the intact phage this domain sits at the tip of
the tail fibre and does the work of recognising the host surface; here I’m expressing
it on its own, as a binding reagent rather than as part of a virion.
Why this, given my HW1 proposal. My HW1 project was a platform matching
bioproducts and biologies to bioresidue feedstocks. Residue-fed fermentations are
among the least sterile inputs in industrial biomanufacturing, and Pseudomonas is
one of the organisms that does well in them. So this construct is a worked example of
something my platform would surface as a need rather than a product: a cheap,
specific detection and biocontrol reagent for contamination in residue-fed processes.
Sequence and provenance. The coding sequence is my own redesigned variant
(LC-0.36), derived from the C-terminal receptor-binding region of T7 gp17. The parent
sequence comes from the T7 tail fibre protein entry in UniProt.
Host.E. coli BL21(DE3). The parent protein is phage-derived and already native
to an E. coli context, the DE3 lysogen supplies T7 RNA polymerase for the promoter
I’ve chosen, and BL21 is protease-deficient (lon, ompT), which matters for a
small domain that would otherwise be chewed up. It is also the cheapest and fastest
route to the gram quantities a detection reagent would eventually need.
Localisation. Cytoplasmic and soluble, with an N-terminal His6 tag and a TEV
protease site for purification. I don’t need secretion — this protein is harvested
and purified, not exported — and keeping it cytoplasmic removes a whole layer of
signal-peptide and translocation risk from a design that already has enough
unknowns in it.
Part 2: Genetic parts
Layer
Part
Source
Why this part
Promoter
T7 promoter with lac operator (T7lac)
pET-28a(+)
Strong and genuinely inducible; the lacO keeps it tight before induction, which matters because isolated fibre domains are often poorly tolerated when expression leaks
RBS
T7 gene 10 leader (pET native)
pET-28a(+)
Very strong initiation, extremely well characterised in BL21(DE3), and already matched to this promoter
CDS
LC-0.36 RBD, codon-optimised
My design, from T7 gp17
The gene of interest
Tag
N-terminal His6 + TEV site (ENLYFQ↓G)
Designed
His6 for IMAC; I’ve swapped pET-28a’s native thrombin site for TEV because TEV is far more specific and leaves a single glycine behind rather than a longer scar
Terminator
T7 terminator
pET-28a(+)
Matched to the T7 system; gives a clean transcript end
Backbone
pET-28a(+)
Addgene / Novagen
pBR322 origin (medium copy), kanamycin resistance, and lacI on the plasmid so repression doesn’t depend on the host
I haven’t hand-designed the backbone. pET-28a gives me replication, selection,
lacI, and most of the expression furniture, which is a sensible thing to reuse.
One choice I’d defend rather than assume. The native pET RBS is strong, and
strong is not automatically right — if the protein turns out to aggregate, dialling
translation initiation down is one of the cleanest fixes available. I’ve checked
the predicted initiation rate with the Salis RBS Calculator so that I know what I’d
be tuning away from.
Part 3: Assembly
Order, 5’→3’, within the pET-28a backbone:
T7lac promoter → g10 RBS → ATG-His6 → TEV site → LC-0.36 RBD → stop → T7 terminator
Checks I ran on the assembled sequence:
Reading frame intact from the start codon through to the stop.
His6 and the TEV site in frame with the RBD, and the TEV site positioned so that
cleavage leaves the intended N-terminus.
No internal stop codons, particularly at the part junctions, which is where they
tend to appear.
Parts in the intended order and orientation on the rendered map.
Part 4: Optimisation and quality control
Codon optimisation. I optimised the RBD coding sequence for E. coli, applying
constraints to avoid NdeI and XhoI sites (both in the pET-28a cloning region) and to
keep GC content within a synthesisable window. Codon usage matters here because
E. coli tRNA pools are strongly skewed: rare codons such as AGG, AGA and CUA can
stall elongating ribosomes, and clusters of them are a common cause of truncated
product and low yield. Worth noting that I deliberately did not aggressively
optimise the first handful of codons — strong 5’ mRNA secondary structure suppresses
initiation, and a slightly “worse” codon choice there often expresses better.
Sequence search. I ran my CDS against the nucleotide and protein databases to
check that it is what I think it is, and to see how far my redesign has actually
drifted from the natural parent.
Safety screen. The screen checks a construct against sequences of concern -
homology to regulated pathogens and toxins, and to sequences flagged under
harmonised biosecurity screening protocols — and reports anything that matches.
Part 5: From design to build
How I’d build it. The cassette is short — the RBD plus tag and linker is well
under a kilobase, so I’d order it as a single synthetic DNA fragment and assemble it
into linearised pET-28a by Gibson assembly. Gibson et al. (2009) showed that
overlapping fragments can be joined isothermally in a single reaction, which removes
the restriction-site planning that would otherwise constrain my part choices, and at
this length there’s no reason to split it further.
What synthesis constrains. Chemical oligo synthesis carries a per-base error
rate, and errors accumulate with length, so the practical limit isn’t what can be
ordered but what can be ordered correctly. Carr et al. (2004) addressed exactly
this with protein-mediated error correction, using mismatch recognition to enrich for
correct products. My sequence is short enough that clone-and-sequence verification is
cheaper than error correction, but if the design carried strong secondary structure
or repeats I’d expect synthesis to struggle and would split it into shorter fragments.
Prototype versus scale. These genuinely diverge for me. Testing one RBD variant
is a single fragment and one Gibson reaction. But the actual design question which
of many RBD variants binds OprF best — is a library problem, and that’s where
Kosuri et al. (2010) becomes the relevant route: oligos synthesised on high-fidelity
microchips and selectively amplified from pools, which makes hundreds of variants
affordable in a way that individually ordered fragments never would be. So the
prototype is fragment-and-Gibson; the scale-up is chip-derived pools.
Part 6: What I don’t know yet
1. Whether the domain folds and binds outside the trimer. T7 tail fibres are
homotrimeric, and the receptor-binding tip may well depend on that trimeric context
to fold into a competent binding surface. Expressed as an isolated monomer, it could
fold into something inert. How I’d find out: SEC-MALS to establish the oligomeric
state of the purified protein, and binding measurement against purified OprF by BLI
or ELISA. Design variant if it fails: fuse a T4 fibritin foldon domain to force
trimerisation and re-test.
2. Whether it’s soluble at all in BL21. Phage structural proteins have a
well-earned reputation for inclusion bodies, and a strong T7 promoter with a strong
RBS is precisely the combination that drives aggregation. How I’d find out:
small-scale expression trial, SDS-PAGE of soluble versus insoluble fractions.
Variants to try: induction at 18°C, lower IPTG, a weaker RBS, or a SUMO or MBP
solubility fusion.
3. Whether it’s specific enough to be useful. A detection reagent for a
residue-fed fermentation has to distinguish P. aeruginosa from whatever else is
growing in an unsterile agricultural feedstock. Binding OprF in a clean assay and
binding it in that background are different claims. How I’d find out: a binding
panel against related Pseudomonas species and against the mixed community from an
actual residue-derived culture.
The honest summary is that the first of these would be the real bet. If the isolated domain
doesn’t fold, everything downstream changes, and I’d know within one expression trial
and one binding assay.
AI use
References
Gibson, D. G. et al. Nature Methods6, 343–345 (2009).
Carr, P. A. et al. Nucleic Acids Research32, e162 (2004).
Kosuri, S. et al. Nature Biotechnology28, 1295–1299 (2010).
Week 3 HW: Designing a Cell-Free Reaction Composition
CFPS coopetition homework: reaction design for sfGFP, PETase and Reteplase
A. Compare cell-free reaction compositions
A1. Why do potassium glutamate and magnesium glutamate differ between compositions, and which is more sensitive?
The best salt levels are not a fixed property of a recipe. They depend on everything else in the tube, which is why two good formulations can end up with quite different numbers.
Three things move the optimum. The first is the lysate. Extract is made in its own buffer, so it brings Mg and K into the reaction before anything is added. One Swartz-lab description puts this at roughly 3.3 mM Mg and 14.4 mM K in the finished reaction (US 7,338,789, the Jewett & Swartz Cytomim patent), and it shifts with lysate lot and with how much lysate is used. The second is the energy chemistry. Mg2+ is bound by ATP and other nucleotides, by phosphate, and by PEP, so changing the nucleotide or phosphate load changes how much magnesium is actually free. In PEP systems the PEP is partly broken down to inorganic phosphate, and phosphate accumulation from PEP breakdown has been argued to inhibit synthesis, plausibly in part by tying up free magnesium (Jewett & Swartz 2004). Ribose/NMP systems run at a lower phosphate level, around 10 to 15 mM (Olsen et al. 2026). The third is the lysate amount: Olsen et al. had to re-find the best Mg and phosphate for each new lysate batch and for each lysate concentration they tried.
Magnesium is the more sensitive of the two, and there are a few places where you can see it:
Olsen et al. re-optimized Mg (together with phosphate) for every new lysate batch; they did not describe doing that for K-glutamate.
In the AI-designed compositions in Smith et al. (2026, Table 2), total Mg(Glu)2 stays inside a narrow 7.0 to 8.8 mM band, while K-glutamate spreads from 273 to 313 mM.
The same pattern is built into this coopetition’s own six 2026 reference formulations: Mg sits between 8.2 and 10.1 mM in all of them, while K(Glu) ranges from 200 to 345 mM.
It also shows up in the dispensing arithmetic for our setup: one 25 nL step of the 0.5 M Mg-glutamate stock changes the reaction by 0.625 mM, which matters when the whole optimum is around 8 mM, while one 25 nL step of the 0.875 M K-glutamate stock adds about 1.1 mM on top of the 200 mM that the base buffer already supplies.
The likely reason is that Mg2+ is divalent and binds RNA, ribosomes and nucleotides tightly, so too little starves transcription and translation and too much pushes things toward precipitation and aggregation, while K+ mostly sets ionic strength and is tolerated over a much wider range. That mechanistic explanation is general background, not something I took from one specific paper.
One consequence for my designs: in my first submission (the PEP reference) I left K at the base-buffer 200 mM and only moved Mg. After tabulating the validated ribose/NMP formulations — RF_opt at 362 mM, the coopetition’s ribose references at 273 to 345 mM, the AI top designs at 273 to 313 mM — I changed my mind and added K-glutamate to match each protein’s reference level. K-glutamate costs $0.070/mL, so being wrong costs me about $0.0002 per reaction; being low might cost titer.
A2. How a PEP + NTP formulation differs from a ribose + NMP formulation
In a PEP + NTP system such as PANOx-SP, the lysate is handed finished nucleotides (ATP, GTP, CTP, UTP) and a high-energy phosphate donor, PEP, at around 30 mM. Pyruvate kinase in the lysate moves the phosphate from PEP onto ADP to make ATP again. It is fast — Olsen et al. saw an ATP surge within 30 minutes — but it is wasteful. PEP is also cleaved by phosphatases, so free phosphate builds up (about three times higher than in the ribose/NMP system), and ATP is close to zero by the end of the run. It is also expensive: PEP-based formulations cost upward of $4,000 per liter of reaction in reagents, and Olsen et al. put the phosphorylated energy substrates at over 75% of all material costs.
In a ribose + NMP system (Olsen’s RF_opt), the lysate is handed nucleoside monophosphates (AMP, CMP, GMP, UMP) and a cheap sugar. No NTPs and no phosphorylated energy donor are added. The lysate’s own kinases build the NTPs, and the lysate’s metabolism supplies the energy to phosphorylate them. In Olsen’s data the ATP level reaches a similar peak within 30 minutes without any added ATP and then holds near 250 µM for the whole reaction. Reagents cost about $133 per liter, and the reagent share of total material cost falls from over 75% to under 4%. The trade-offs are that this system depends more on oxygen (a 100% O2 feed raised yield by 45% in their bioreactor, which is part of why 2 mL tubes beat 384-well plates), it is more sensitive to the reaction geometry and lysate amount, and the NMPs only dissolve up to about 5 mM in total (Olsen capped them there to avoid precipitates, and added them last). Smith et al. found that partial replacement of NMPs with cheaper nucleosides or bases works for some nucleotides (AMP with adenosine; GMP with guanine plus ribose) but not for CMP or UMP.
PEP + NTP (PANOx-SP)
Ribose + NMP (RF_opt)
Nucleotide supply
ATP 1.2 mM; GTP/UTP/CTP about 0.85 mM each, added as triphosphates
AMP 3 mM; CMP, GMP, UMP 2.15 mM each, added as monophosphates; lysate kinases make the NTPs
Energy source
PEP, about 30 mM, regenerates ATP through pyruvate kinase
Ribose (50 mM) plus the lysate’s own metabolism
Phosphate
High, rises as PEP is hydrolysed
About 10 to 15 mM through the run
ATP over time
Early surge, near zero by the end
Similar level at 30 min, then held around 250 µM
Extra cofactors
NAD, CoA, tRNA, folinic acid, oxalate
Dropped; nicotinamide is used instead (my reading: it is the cheap precursor for the lysate to make NAD)
Reagent cost
Upward of $4,000/L ($4,513/L in Olsen Table 1)
$133/L
A3. Two formulations compared: PANOx-SP (Jewett & Swartz 2004) and RF_opt (Olsen et al. 2026), with the AI-designed set for context
PANOx-SP numbers below are as listed in Olsen et al. (2026) Table 1; note that published PANOx-SP protocols vary between labs (for example Mg-glutamate is reported anywhere from 8 to 16 mM). RF_opt numbers come from Olsen et al. (2026) Table 1, cross-checked against the SOTA column of Smith et al. (2026) Table 2.
Component
PANOx-SP
RF_opt
AI-designed (Smith 2026, range across six compositions)
Energy
PEP 30 mM
Ribose 50 mM
Ribose 40 to 77 mM
Nucleotides
ATP 1.2 mM; GTP, UTP, CTP 0.85 mM each
AMP 3 mM; CMP, GMP, UMP 2.15 mM each
AMP 0.5 to 1.5; CMP 0.4 to 1.1; GMP 0 to 1.1; UMP 0.4 to 1.1 mM
Mg glutamate
8 mM
8 mM
7.0 to 8.8 mM
K glutamate
130 mM (plus 10 mM ammonium glutamate)
362 mM (plus 10 mM ammonium glutamate)
273.2 to 312.6 mM
Buffer
57 mM HEPES pH 7.5
75 mM HEPES-KOH pH 7.5
45 to 75 mM HEPES-KOH
Phosphate
None added (PEP releases it)
15 mM potassium phosphate (monobasic:dibasic mix, adjusted to pH 7)
K-phosphate 5.6 to 15 mM; Step 5 data favored 5 to 10 mM
Cofactors
NAD 0.33 mM, CoA 0.26 mM, folinic acid 34 µg/mL, tRNA 170.6 µg/mL
Nicotinamide 4 mM
Nicotinamide 0.4 to 4 mM
Polyamines
Spermidine 1.5 mM, putrescine 1 mM
None in the Table 2 column
Spermidine 1.2 mM in 3 of 6 designs
Amino acids
2 mM each
5 mM (plus Tyr 5, Cys 5)
3.0 to 4.8 mM (Tyr 1.2 to 4.1; Cys 3.2 to 5)
Lysate
30% v/v (as tested by Olsen)
30% v/v
25% v/v
Performance
Highest yield of the eight older formulations Olsen tested (1.11 ± 0.13 g/L in their hands); $3,760/g, $4,513/L reagents
2.4 ± 0.3 g/L sfGFP; $133/L reagents; $55/g reagents-only in the preprint (updated to $60/g in the published version, per Smith et al.)
Lowest total cost: $422/g all-in vs $698/g SOTA; best composition 3.04 g/L in 2 mL tubes and 0.72 g/L in 384-well plates (vs 2.39 and 0.25 for SOTA)
What stands out is how little the first two have in common apart from the salts. PANOx-SP is a give-the-lysate-everything recipe: finished NTPs, a phosphorylated energy donor, three cofactors, tRNA and two polyamines. RF_opt gives the lysate raw materials (NMPs and ribose) and relies on the lysate to build the rest, which removes the expensive items. The salts moved with it: HEPES went up and phosphate was deliberately set, which fits a system that drifts in pH more easily (Olsen et al. saw the pH of RF_opt fall below 7.0 when glutathione was added, and fixed it by using HEPES at pH 7.5).
The AI-designed set kept the ribose/NMP idea and pushed it further: NMPs roughly 2 to 5 times lower than RF_opt with more ribose, adenosine and guanine standing in for part of AMP and GMP, and spermidine added back (their Step 5 median titer was 0.253 g/L with spermidine and 0.131 without). One caution when comparing numbers: Olsen et al. optimized reagent cost only, while Smith et al. optimized total cost per gram including lysate and DNA, which exceed 90% of the cost in the SOTA formulation. So $55 to 60/g (reagents only) and $422/g (all-in) are not the same quantity.
B. My three reaction designs
How I approached the design
Three things drove the choices. First, the cost math. My first submission was essentially the coopetition’s sfGFP PEP reference (a PANOx-SP-style recipe). Priced with the Ginkgo reagent table it comes to $0.0702 per 20 µL reaction (about $3,510/L): PEP alone is $0.0132, the four NTPs together are $0.0188, CoA is $0.0104 and NAD is $0.0025 — about 64% of the reaction cost sits in those six items, and at 2.4 g/L that works out to roughly $1,460/g, two times the $698/g SOTA. That exercise is what convinced me to drop NTPs, CoA, NAD and PEP entirely. In the new designs, lysate (5 µL at $4.00/mL, so $0.020) and DNA (about $0.004) make up about 93% of the reaction cost, and everything else together is under $0.002. So cost per gram is mostly lysate cost divided by titer: cheap reagents that raise titer are close to free, and anything priced like the NTPs is not worth it (1 µL of GTP at $39.34/mL costs $0.039, nearly twice the lysate in the whole reaction).
Second, I started from published ground (RF_opt and the top designs in Smith et al.) and from the coopetition’s own validated 2026 reference formulations, then made changes specific to each protein.
Third, I worked around the fixed parts. The base buffer already supplies 30 mM HEPES-KOH pH 7.5, 200 mM K-glutamate, 2.6 mM Mg-glutamate, 1 mM each of 18 amino acids (including tyrosine) and 1 mM cysteine, and the lysate is fixed at 5 µL, so everything below sits on top of that. All volumes are multiples of 25 nL and, with water, the variable part sums to 11,000 nL (20,000 nL total). Final concentrations are stock × volume / 20,000 nL. I checked every design with a short script: totals exactly 20,000 nL, all steps multiples of 25 nL, total NMP below the 5 mM precipitation cap.
B1. sfGFP (reducing regime)
Reagent (stock)
Volume (nL)
Final in reaction
Why
HEPES-KOH pH 7.5 (1 M)
900
+45 mM (75 mM total)
Buffer; Smith et al. saw median titer 0.177 g/L with added HEPES vs 0.057 g/L without
Potassium glutamate (0.875 M)
3325
+145.5 mM (345.5 mM total)
Matches the validated sfGFP ribose reference; AI top designs sit at 273 to 313 mM, RF_opt at 362 mM
Magnesium glutamate (0.5 M)
225
+5.6 mM (8.2 mM total)
Middle of the AI 7.0 to 8.8 mM band; matches all sfGFP references
Potassium phosphate 1.6:1 mono:di (0.5 M)
300
7.5 mM
Smith et al.: 5 to 10 mM gave strong titers, none or >25 mM gave almost none
Ribose (100 g/L, ~0.67 M)
1200
~40 mM
Lets the lysate build NTPs from NMPs (Olsen et al.); low end of the AI 40 to 77 mM range
AMP, CMP, GMP, UMP (0.1 M each)
200 each (800 total)
1.0 mM each
NMPs instead of NTPs; 4 mM total, under the 5 mM precipitation cap Olsen et al. used
Nicotinamide (0.1 M)
800
4 mM
In RF_opt and 5 of 6 Smith top designs; effectively free ($0.002/mL)
Spermidine (0.25 M)
100
1.25 mM
Smith et al.: median titer 0.253 with vs 0.131 without
Glucose (200 g/L, ~1.1 M)
175
~9.7 mM
Glucose and phosphate work together (Calhoun & Swartz 2005); glucose appears in 4 of 6 Smith top designs
17 amino acid mix (50 mM each)
400
+1 mM each (2 mM total)
See the arithmetic below
Tyrosine pH 12 (50 mM)
200
+0.5 mM (1.5 mM total)
Same
Nuclease-free water
2575
n/a
Brings the variable part to 11,000 nL
The amino acid arithmetic: at about 3 g/L, sfGFP (27 kDa, ~240 residues) is roughly 110 µM, which consumes about 27 mM of amino acid residues. The base buffer supplies about 19 mM of free amino acids (1 mM each of 18 amino acids plus 1 mM cysteine), so it would run short at the titers we are hoping for. The AI-designed compositions run their amino acids higher (3 to 4.8 mM); I stayed lower because the mix is one of the few items with a real volume cost, but this is a knob to scan later.
Estimated cost is $0.0257 per 20 µL reaction (about $1,285/L) including lysate, DNA and base buffer — versus $0.0266 for the coopetition’s own sfGFP ribose reference and $0.0702 for my PEP submission. At $1,285/L I need about 1.8 g/L to match the $698/g SOTA and about 3.0 g/L to match the $422/g that Smith’s best composition reached in tubes. Plate geometry will likely give lower titers than tubes (Smith et al. saw 0.72 vs 3.04 g/L for their most balanced composition), so I expect the 384-well numbers to look worse than the tube numbers.
{"sample_id":"tammy-10-06_sfgfp_v2","sample_type":"experimental","reagent_list":{"lysate":5000,"template_sfgfp":2000,"base_buffer":2000,"potassium_glutamate":3325,"magnesium_glutamate":225,"hepes_koh":900,"potassium_phosphate_mono_di":300,"ribose":1200,"amp":200,"cmp":200,"gmp":200,"ump":200,"nicotinamide":800,"spermidine":100,"glucose":175,"amino_acid_mix_17":400,"tyrosine":200,"nuclease_free_water":2575},"metadata":{"ai_model":"Claude (Anthropic) - literature checking and volume/cost arithmetic","protein_target":"sfGFP","acknowledgements":"HTBAA team Zulip discussion","comments":"Ribose/NMP chassis, ~$0.0257/rxn vs $0.0702 for my PEP reference submission."}}
B2. PETase / TfCut2 (reducing regime, one disulfide)
TfCut2 sits in the same DTT-containing regime as sfGFP, so I kept the same chassis and changed a few things on purpose.
Reagent (stock)
Volume (nL)
Final in reaction
Why
HEPES-KOH pH 7.5 (1 M)
900
+45 mM (75 mM total)
As for sfGFP
Potassium glutamate (0.875 M)
2275
+99.5 mM (299.5 mM total)
Matches the PETase ribose reference
Magnesium glutamate (0.5 M)
225
+5.6 mM (8.2 mM total)
As for sfGFP
Potassium phosphate 1.6:1 mono:di (0.5 M)
300
7.5 mM
As for sfGFP
Ribose (100 g/L)
1200
~40 mM
As for sfGFP
AMP, CMP, GMP, UMP (0.1 M each)
200 each
1.0 mM each
As for sfGFP (4 mM NMP total)
Nicotinamide (0.1 M)
800
4 mM
As for sfGFP
Spermidine (0.25 M)
100
1.25 mM
As for sfGFP
Glucose (200 g/L)
175
~9.7 mM
As for sfGFP
17 amino acid mix (50 mM each)
500
+1.25 mM each (2.25 mM total)
TfCut2 is slightly larger than sfGFP (~260 vs ~240 residues in the active enzyme)
Tyrosine pH 12 (50 mM)
200
+0.5 mM
Same
Oxidized glutathione (0.17 M)
75
0.64 mM
Low-dose oxidant as a bet for the single disulfide
Nuclease-free water
3450
n/a
Two honest notes on this design. First, the GSSG is the part I am least sure about. The standard lysate carries DTT, so the glutathione may simply be reduced and do nothing, and I would not be surprised by that. It costs about $0.00005 per reaction, so it is a cheap test of whether a gentle redox nudge helps the one disulfide form. Second, the coopetition’s own PETase reference formulations include 5 µM DsbC — at $5,632/mL that is $5.63 per reaction, more than 200 times everything else in the reaction combined, so I deliberately left it out. If PETase activity comes back poor, low-dose DsbC (0.25 to 0.5 µM) is my first fallback experiment.
Estimated cost is $0.0260 per reaction (about $1,300/L). Because the PETase assay is activity-based and measured after a 10 minute 60 °C step that should knock out the lysate’s own esterases, an enzyme that is stable at 60 °C matters — which is part of why I propose calcium in B5.
{"sample_id":"tammy-10-06_petase_v2","sample_type":"experimental","reagent_list":{"lysate":5000,"template_petase":2000,"base_buffer":2000,"potassium_glutamate":2275,"magnesium_glutamate":225,"hepes_koh":900,"potassium_phosphate_mono_di":300,"ribose":1200,"amp":200,"cmp":200,"gmp":200,"ump":200,"nicotinamide":800,"spermidine":100,"glucose":175,"amino_acid_mix_17":500,"tyrosine":200,"gssg":75,"nuclease_free_water":3450},"metadata":{"ai_model":"Claude (Anthropic) - literature checking and volume/cost arithmetic","protein_target":"PETase","acknowledgements":"HTBAA team Zulip discussion","comments":"Ribose/NMP chassis + 0.64 mM GSSG bet; skips the reference's 5 uM DsbC ($5.63/rxn) for cost."}}
B3. Reteplase (oxidizing / DSB regime)
Reteplase has nine disulfide bonds, so it needs the oxidizing setup described in the Ginkgo overview: DSB lysate (no DTT, iodoacetamide-treated, cysteine-quenched), a glutathione redox pair, and DsbC. One practical note: the guidelines say Ginkgo prepares the DSB lysate in separate reagent plates “for future use in reteplase CFPS reactions”, so I read the fixed 5,000 nL lysate slot as being filled with DSB lysate automatically for reteplase plates — I will confirm on the submission page whether the JSON takes the standard lysate field or a separate DSB lysate entry.
Reagent (stock)
Volume (nL)
Final in reaction
Why
HEPES-KOH pH 7.5 (1 M)
1200
+60 mM (90 mM total)
Olsen et al. found glutathione drops the pH of a ribose/NMP reaction below 7.0; their fix was HEPES at pH 7.5 (which our stock already is), and Smith et al. saw added HEPES raise titer, so I stay at the top of the range
Potassium glutamate (0.875 M)
1675
+73.3 mM (273.3 mM total)
Matches the reteplase ribose reference
Magnesium glutamate (0.5 M)
250
+6.25 mM (8.85 mM total)
Matches the reteplase ribose reference
Potassium phosphate 1.6:1 di:mono (0.5 M)
300
7.5 mM
Dibasic-rich mix, against the acidification risk
Ribose (100 g/L)
1200
~40 mM
As for the other two
AMP, CMP, GMP, UMP (0.1 M each)
200 each
1.0 mM each
4 mM NMP total, under the 5 mM cap
Nicotinamide (0.1 M)
800
4 mM
As for the other two
Spermidine (0.25 M)
100
1.25 mM
As for the other two; Yin & Swartz also found polyamines helpful for disulfide proteins
17 amino acid mix (50 mM each)
500
+1.25 mM each
Large protein (355 aa, ~39 kDa)
Tyrosine pH 12 (50 mM)
200
+0.5 mM
Same
Cysteine (0.2 M)
200
+2 mM (3 mM total)
Reteplase has 18 cysteines per molecule; at ~80 µM product that is ~1.4 mM of cysteine consumed, more than the 1 mM the base buffer gives. The reference uses 5 mM total; I went lower to keep the redox tilted oxidizing
Oxidized glutathione (0.17 M)
475
4.04 mM
Oxidizing environment
Reduced glutathione (0.1 M)
200
1.0 mM
4:1 GSSG:GSH, the ratio used by Yin & Swartz (2004), Kim & Swartz (2003) and Olsen et al. for disulfide proteins
DsbC (100 µM)
100
0.5 µM
Isomerase for the nine disulfides; see cost note
Nuclease-free water
3000
n/a
A few deliberate omissions. I left glucose out because glucose metabolism can acidify the reaction and I am already working against a pH drop from glutathione — that is my own reasoning rather than something I found tested. I also left out the sodium pyruvate, adenosine and catalase that appear in the reteplase ribose reference (it is essentially Smith’s composition 1793122_35 plus the DSB components); those are my round-two tests rather than part of the base design.
The DsbC dose is the whole cost story for this protein. At $5,632/mL, 100 nL of DsbC is $0.563 per reaction — about 95% of the roughly $0.59 total and 28 times the lysate cost. The reference formulations use 5 µM, ten times my dose, which would be $5.63 per reaction (about $283,000/L); Yin & Swartz (2004) used 75 µg/mL, about 3 µM. DsbC is catalytic (it shuffles disulfides rather than being consumed stoichiometrically), so a sub-micromolar dose is plausible, but this is a genuine risk and the dose-response in B4 is my highest-value experiment for this protein. Reteplase plates also run only 10 hours at 30 °C before the cold and ambient holds, against 20 hours for sfGFP and PETase, so the ribose/NMP system’s fast ATP start (within about 30 minutes in Olsen et al.) is useful here.
Estimated cost is $0.590 per reaction (about $29,500/L). For scale: if active reteplase comes out at the ~60 µg/mL that Yin & Swartz reached for vtPA, that is about $490,000/g at my 0.5 µM DsbC — and about $4.7 million/g at the reference’s 5 µM. Folding yield and the DsbC dose are basically the whole game for this protein.
{"sample_id":"tammy-10-06_reteplase_v2","sample_type":"experimental","reagent_list":{"lysate":5000,"template_reteplase":2000,"base_buffer":2000,"potassium_glutamate":1675,"magnesium_glutamate":250,"hepes_koh":1200,"potassium_phosphate_di_mono":300,"ribose":1200,"amp":200,"cmp":200,"gmp":200,"ump":200,"nicotinamide":800,"spermidine":100,"amino_acid_mix_17":500,"tyrosine":200,"cysteine":200,"gssg":475,"gsh":200,"dsbc":100,"nuclease_free_water":3000},"metadata":{"ai_model":"Claude (Anthropic) - literature checking and volume/cost arithmetic","protein_target":"Reteplase","acknowledgements":"HTBAA team Zulip discussion (DsbC dose-response idea, glutathione redox pair)","comments":"Oxidizing regime: 4:1 GSSG:GSH, DsbC 0.5 uM (10x below reference for cost), 90 mM HEPES, +2 mM cysteine, no glucose."}}
(Key names above follow the export format of my first submission JSON; I will double-check the exact keys for the phosphate mixes, glutathione and DsbC against the submission form, which validates them automatically.)
B4. What I would test next (draft experiments)
Each 384-well plate holds 80 unique compositions in quadruplicate, so each plan below fits on one plate with room to spare.
sfGFP plate — Mg × phosphate grid plus one-factor tweaks. The two settings Olsen et al. had to re-tune for every lysate are Mg and phosphate, so: total Mg at 6.5, 8.2, 10 and 12 mM (150, 225, 300, 375 nL of the 0.5 M stock) crossed with phosphate at 0, 5, 7.5 and 10 mM (0, 200, 300, 400 nL) on my B1 chassis = 16 designs. Then one-factor rows on the best cell: K-glutamate at 200 / 280 / 345 mM total; spermidine 0 / 1.25 mM; NMP total 2 / 4 / 5 mM; glucose 0 / 9.7 mM; ribose 40 / 50 / 77 mM. Readout is direct fluorescence, so this plate also calibrates how far the plate format is from tubes.
PETase plate — redox and DsbC. My B2 chassis with: GSSG at 0 / 0.64 / 2 mM; DsbC at 0 / 0.25 / 0.5 µM (kept low on purpose for cost); and the reference PETase ribose composition as a positive benchmark. If calcium chloride gets added to the inventory (B5), repeat the best condition with CaCl2 at 0.5 / 1 / 2 mM and check whether the 60 °C assay step leaves more active enzyme.
Reteplase plate — DsbC dose-response crossed with redox ratio. DsbC at 0, 0.25, 0.5, 1, 2.5 and 5 µM crossed with GSSG:GSH at 4:1 (4.04:1 mM), 2:1 and 8:1 = 18 designs, plus added-cysteine at 0 / 2 / 4 mM on the best cell, plus HEPES at 75 vs 90 mM total. The DsbC row alone spans $0 to $5.63 per reaction, so this plate directly measures the price of folding.
B5. Community reagent proposal: calcium chloride
My proposal is calcium chloride as a 100 mM aqueous stock (calcium acetate would be a fine alternative). TfCut2 has a calcium binding site, and adding Ca2+ or Mg2+ raised the thermostability of the Thermobifida fusca polyester hydrolases, enabling PET degradation closer to the glass transition temperature (Then et al. 2015); the calcium binding site residues in TfCut2 are characterized structurally (Roth et al. 2014, PDB 4CG1), and engineering a disulfide into that calcium site made the enzyme calcium-independent and more thermostable, with wild-type TfCut2 melting at about 70 °C (Then et al. 2016). Our assay heats the reaction to 60 °C for 10 minutes, which TfCut2 should survive, but not by a huge margin, so extra stability could protect the signal. Mg is already on the menu, but Mg is dictated by what translation needs, so a separate calcium knob would let us stabilize the enzyme without moving the Mg optimum.
How I picked it: I went through the menu and saw that Mg is the only divalent metal, read the TfCut2 structure and stability papers (Roth et al. 2014; Then et al. 2015; Then et al. 2016), and chose the one additive with direct evidence for this exact enzyme that is also cheap and easy to buy. The main risk is that calcium can precipitate with phosphate and nucleotides, so I would test 0.5 to 2 mM and keep phosphate at or below 7.5 mM. I have not seen data on how calcium affects translation in this lysate. [Add: I submitted / upvoted this on the Community Reagents page on (date).]
I also upvoted Skp (already proposed by another team): Yin & Swartz (2004) found that 300 µg/mL Skp raised the solubility of cell-free-made vtPA (reteplase) by 60 to 70% and brought active yield to about 60 µg/mL, while PDI, DsbA, GroEL/GroES and DnaK/DnaJ/GrpE gave no significant benefit in the same system.
DsbC is about 95% of my reteplase reaction cost, so a dose-response across plates (0 to 5 µM) is probably the highest-value experiment for that protein. It may also be worth asking whether a cheaper source of isomerase activity (for example lysate from a DsbC-overexpressing strain, or in-house purified DsbC) could be added to the reagent inventory.
Use of AI
I used Claude (Anthropic) to break down the Ginkgo coopetition document and the reference papers, create figures and help do some mathematical calculations.
Jewett, M. C., & Swartz, J. R. (2004). Mimicking the Escherichia coli cytoplasmic environment activates long-lived and efficient cell-free protein synthesis. Biotechnology and Bioengineering, 86(1), 19–26. https://doi.org/10.1002/bit.20026
Jewett, M. C., & Swartz, J. R. (2008). Methods of in vitro protein synthesis. US Patent 7,338,789 B2.
Calhoun, K. A., & Swartz, J. R. (2005). Energizing cell-free protein synthesis with glucose metabolism. Biotechnology and Bioengineering, 90(5), 606–613.
Kim, D.-M., & Swartz, J. R. (2003). Efficient production of a bioactive, multiple disulfide-bonded protein using modified extracts of Escherichia coli. Biotechnology and Bioengineering, 81(2). https://doi.org/10.1002/bit.10865
Yin, G., & Swartz, J. R. (2004). Enhancing multiple disulfide bonded protein folding in a cell-free system. Biotechnology and Bioengineering, 86(2), 188–195. https://doi.org/10.1002/bit.10827
Then, J., et al. (2015). Ca2+ and Mg2+ binding site engineering increases the degradation of polyethylene terephthalate films by polyester hydrolases from Thermobifida fusca. Biotechnology Journal, 10(4), 592–598. https://doi.org/10.1002/biot.201400620
Then, J., et al. (2016). A disulfide bridge in the calcium binding site of a polyester hydrolase increases its thermal stability and activity against polyethylene terephthalate. FEBS Open Bio, 6(5). https://doi.org/10.1002/2211-5463.12053
Roth, C., et al. (2014). Structural and functional studies on a thermostable polyethylene terephthalate degrading hydrolase from Thermobifida fusca. Applied Microbiology and Biotechnology, 98. https://doi.org/10.1007/s00253-014-5672-0
Silverman, A. D., Karim, A. S., & Jewett, M. C. (2020). Cell-free gene expression: an expanded repertoire of applications. Nature Reviews Genetics, 21, 151–170. https://doi.org/10.1038/s41576-019-0186-3