Hi, I’m Xiangtao Shi, graduate student in Molecular Machines group @ MIT Media Lab. I studied Biomedical Engineering with a minor in Finance at SUSTech, and I’m now joining the Giga Printer project to work on machines and chips for DNA synthesis.
My previous research is on DNA data storage and microfluidics. The idea is pretty cool: DNA is nature’s storage medium, so why not use it to store photos and music too? I also worked on microfluidics, making tiny chips for biological testing and drug delivery.
Outside the lab, I play percussion and have the chance to performe at Vienna’s Golden Hall with my school’s orchestra! I also enjoy ultimate frisbee and badminton, so count me in if you’re organizing a game.
See the nav bar on the left to look through my work for How To
Biomanufacture Almost Anything (Fall 2026)!
Subsections of <Xiangtao Shi> — HTBAA Fall 2026
Week 1 HW: Final Project Ideas
For your first homework, propose and describe one idea for something you would like to biomanufacture. This could be medicine, material, food, energy, an art, design, or architectural artifact, or beyond. Draw from your own background and interests for inspiration.
What you would like to biomanufacture and why?
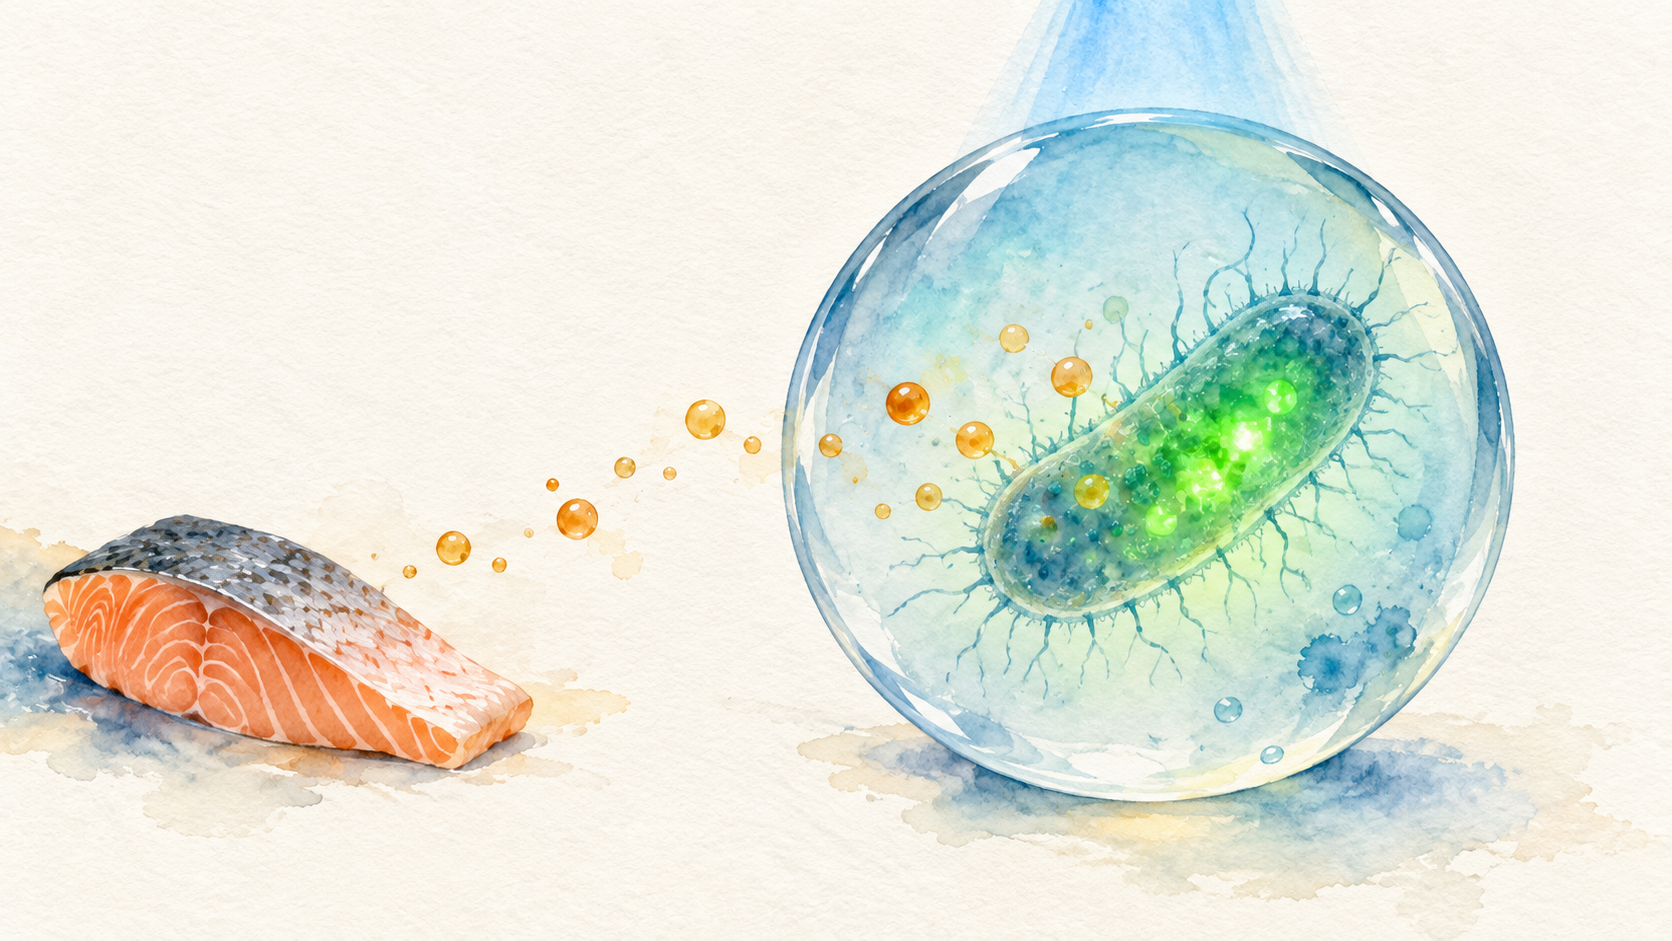
I would like to make a biosensor that gives a visible indication of the foods condition. The idea comes from a problem I have encountered since moving from China to the United States. Ordering food here is less convenient and more expensive than I am used to, so I usually cook for myself. To save time, I often prepare several meals at once. However, when I take a container out of the refrigerator a few days later, I am sometimes unsure whether I should still eat it. Therefore, I want to biomanufacture a biosensor to help with that decision.
After looking some papers, I think histamine is a good starting target in susceptible food. As I understand it, microbial activity during spoilage can convert amino acids into biogenic amines through decarboxylation. For example, histidine becomes histamine, lysine becomes cadaverine, ornithine becomes putrescine, and tyrosine becomes tyramine. These compounds can be harmful at elevated concentrations, and detecting them could help assess the condition of food.
I found several possible ways to detect these amines. One uses enzymes: certain enzymes like diamine oxidase (DAO) oxidize histamine, and this reaction can be coupled to a color change. Another uses aptamers, which are short, single-stranded DNA or RNA molecules that fold into three-dimensional shapes and bind their targets with high affinity and specificity. An aptamer-based sensor may need a fluorescent label or gold nanoparticles to produce a readable signal (referenece). For this project, I would like to engineer a microorganism as a whole-cell biosensor (WCB). As histamine or another target amine increases in the sample, a responsive transcription factor would trigger green fluorescent protein (GFP) expression or produce something with color, producing a signal that could be read qualitatively or measured quantitatively.
Given the volume of fresh fish and meat packaged for retail sale in the United States and the World (reference), I think there could be a practical use for this kind of sensor. Food waste and foodborne illness are also part of my motivation.
What living system would you use?
I found a related study that uses Pseudomonas putida as the host for a histamine biosensor (reference). I could also try Escherichia coli because it has a broad set of genetic tools and well-established engineering methods. Histamine uptake could be a limitation, though, so I may need to introduce a transporter. I am also interested in testing extremophiles, since they may differ in how they take up these amines (reference).
For the prototype, I plan to use aqueous extracts of fish or prepared meals as the input samples.
The proposed sequence is following. A biogenic amine enters the cell through transportprotein and binds to a transcription factor, changing its conformation and how it interacts with regulatory DNA. This allows RNA polymerase to initiate transcription, followed by translation of GFP. The output would be green fluorescence intensity. I see this amplification through gene expression as a potential advantage over the enzyme- and aptamer-based approaches I considered.
I would like to explore a few additional designs. One is to expand detection to cadaverine, tyramine, putrescine or other indicators. Another is to introduce logic gates. For example, a strong color change could occur only when both histamine and putrescine exceed proposed safety thresholds, with the aim of reducing false positives. I would also like to investigate whether the microorganisms could metabolize and remove these compounds while detecting them.
How would you use automation?
For construction and screening, microfluidics could allow me to encapsulate and incubate individual cells and increase screening throughput. A liquid-handling robot such as Opentrons could automate repetitive steps. Connecting these tools into a coordinated workflow could form the basis of a cloud lab. Much of this work is repetitive and time-consuming, which is why automation would be useful. It could also improve the consistency and accuracy of liquid handling while allowing me to test more variants.
I could also use tools such as AlphaFold to guide changes to the transcription factor’s ligand-binding pocket. I am interested in combining AI with synthetic biology to make the design of bacterial sensors more efficient (reference).
How much would you need to make, and how long would it take?
How much?
Biomass per test
Assuming a 100 µL reaction at OD600 = 0.5:
0.1 mL × 0.5 OD × 0.3 mg DCW/(OD·mL) = 0.015 mg DCW
I would budget 0.1 mg dry cell weight (DCW) per test, allowing roughly a sevenfold margin for processing losses and quality control.
The pilot assumes individual testing, using the sampling example in this reference.
Fermentation volume
Assuming a yield of 50 g DCW/L and doubling the volume to allow for recovery losses:
(30 g ÷ 50 g/L) × 2 = 1.2 L of culture
A 2 L fermenter could therefore supply the estimated pilot biomass.
Cost
Assuming batch production, my estimate is $0.10 to $0.50 per test. Freeze-drying, dispensing, packaging, and QC may cost more than growing the cells.
How long?
Prototype: about one semester.
I would start with a small set of constructs, then test the sensor in food extracts and develop a stable formulation.
Manufacturing: about one week for cell production and processing.
Dispensing, packaging, and QC would determine the full production timeline and may require dedicated equipment.
Each assay: about 1.5 to 2 hours.
This could suit laboratory batch testing. A household version would need a faster result, so I would begin with laboratory use.
What don’t you know yet?
My first concern is the food matrix effect. Could salt, low pH, proteases, or lipids in fish extracts damage the cells, quench GFP fluorescence, or alter promoter activity during the assay? I would measure how the signal responds to different sample concentrations and check cell survival rates.
Readability by eye is a separate problem because GFP requires excitation light. I would therefore also explore a colorimetric or pigment-based reporter. Options include lacZ with an added substrate or a pigment biosynthesis pathway (reference).
Another concern is shelf life and survival after freeze-drying. Cell instability and limited shelf life are common constraints for whole-cell sensors. I would explore accelerated aging estimates and compare freeze-drying with other preservation methods.
Finally, I still have a lot to learn about synthetic biology, including how to design DNA constructs and engineer bacterial systems for our purpose (reference). And that’s why I’m in this course.
AI use
I used AI tools, including GPT, Gemini, and Claude, to brainstorm ideas, find literature, generate images and develop preliminary estimates.
Week 2 HW: DNA Design
My HW1 project explores a whole-cell biosensor for histamine in food. For this assignment, I built a first candidate DNA design in Kernel: a PhinD-controlled GFP reporter on a pPROBE-NT-derived plasmid, with E. coli as the intended chassis.
Part 0: Kernel setup
My construct, Shi-Food Biosensor, is stored directly in the Xiangtao repository in the HTBAA 2026 workspace.
Part 1: Expression target
The expressed product is a GFP, a green fluorescent protein. Its fluorescence provides an output that could be measured if the upstream regulatory region responds to histamine. The original coding sequence is 717 nucleotides, including an ATG start codon and a TAG stop codon, and encodes 238 amino acids. It comes from pPROBE-NT, GenBank AF286453.1, positions 4066–4782. The corresponding protein sequence is AAG29454.1.
I chose E. coli for this first design.
GFP is intended to remain in the cytoplasm. I have not added a secretion signal.
Part 2: Genetic parts and sequence sources
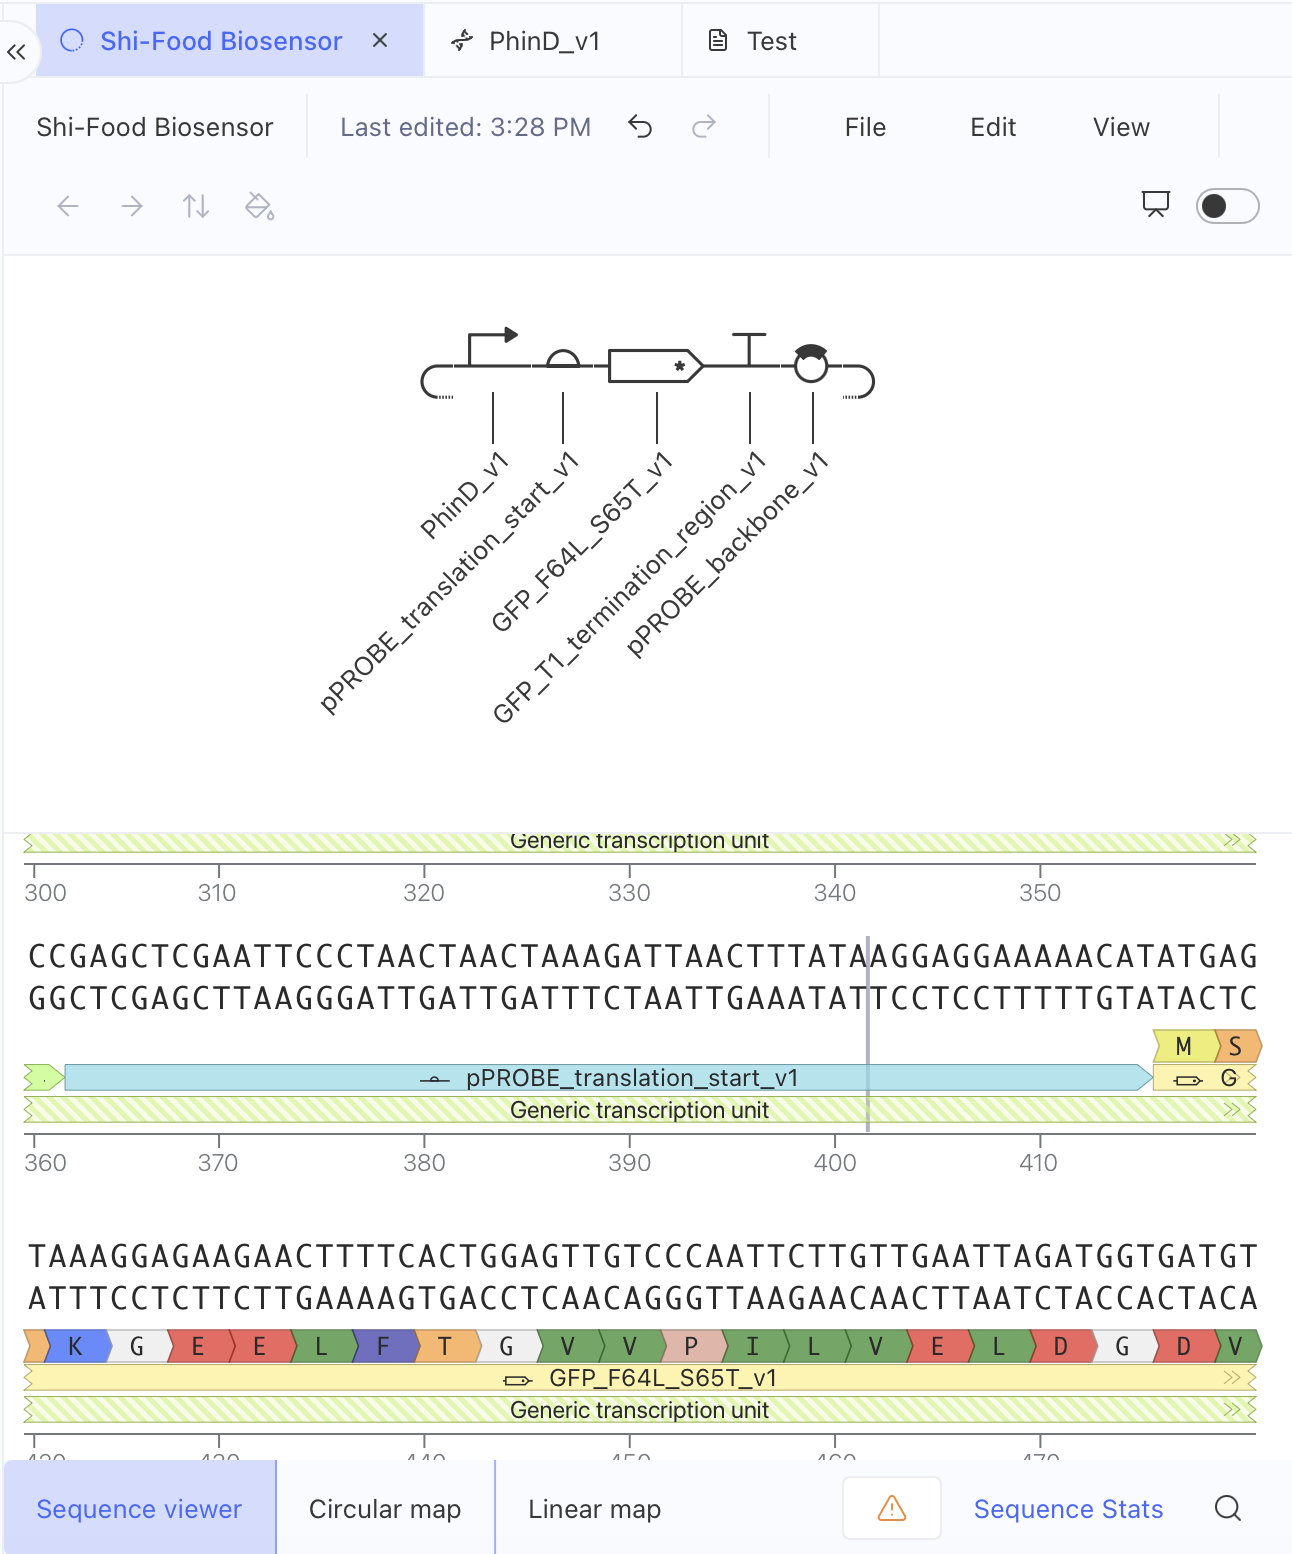
I divided the construct into five parts. These are the actual part names used in my first draft Kernel design.
Provides the candidate transcriptional control region from the histamine-biosensor study.
pPROBE_translation_start_v1
RBS-containing translation-start region; 53 bp
AF286453.1:4013–4065
Retains the vector junction, ribosome binding site and spacer before GFP. This preserves the original bacterial translation context without adding a second RBS.
GFP_F64L_S65T_v1
Coding Sequence (CDS, +start +stop); 717 bp
AF286453.1:4066–4782
Encodes the fluorescent output.
GFP_T1_termination_region_v1
Terminator-containing region; 182 bp
AF286453.1:4783–4964
Contains a short linker and the downstream rrnB T1 terminator, which helps reduce transcriptional readthrough beyond GFP.
pPROBE_backbone_v1
Vector backbone DNA; 5840 bp
AF286453.1:4965–6807, followed by positions 1–3997
Retains the pBBR1 replication system, kanamycin-resistance selection marker, four upstream T1 terminators and other vector sequences.
Part 3: Assembled construct
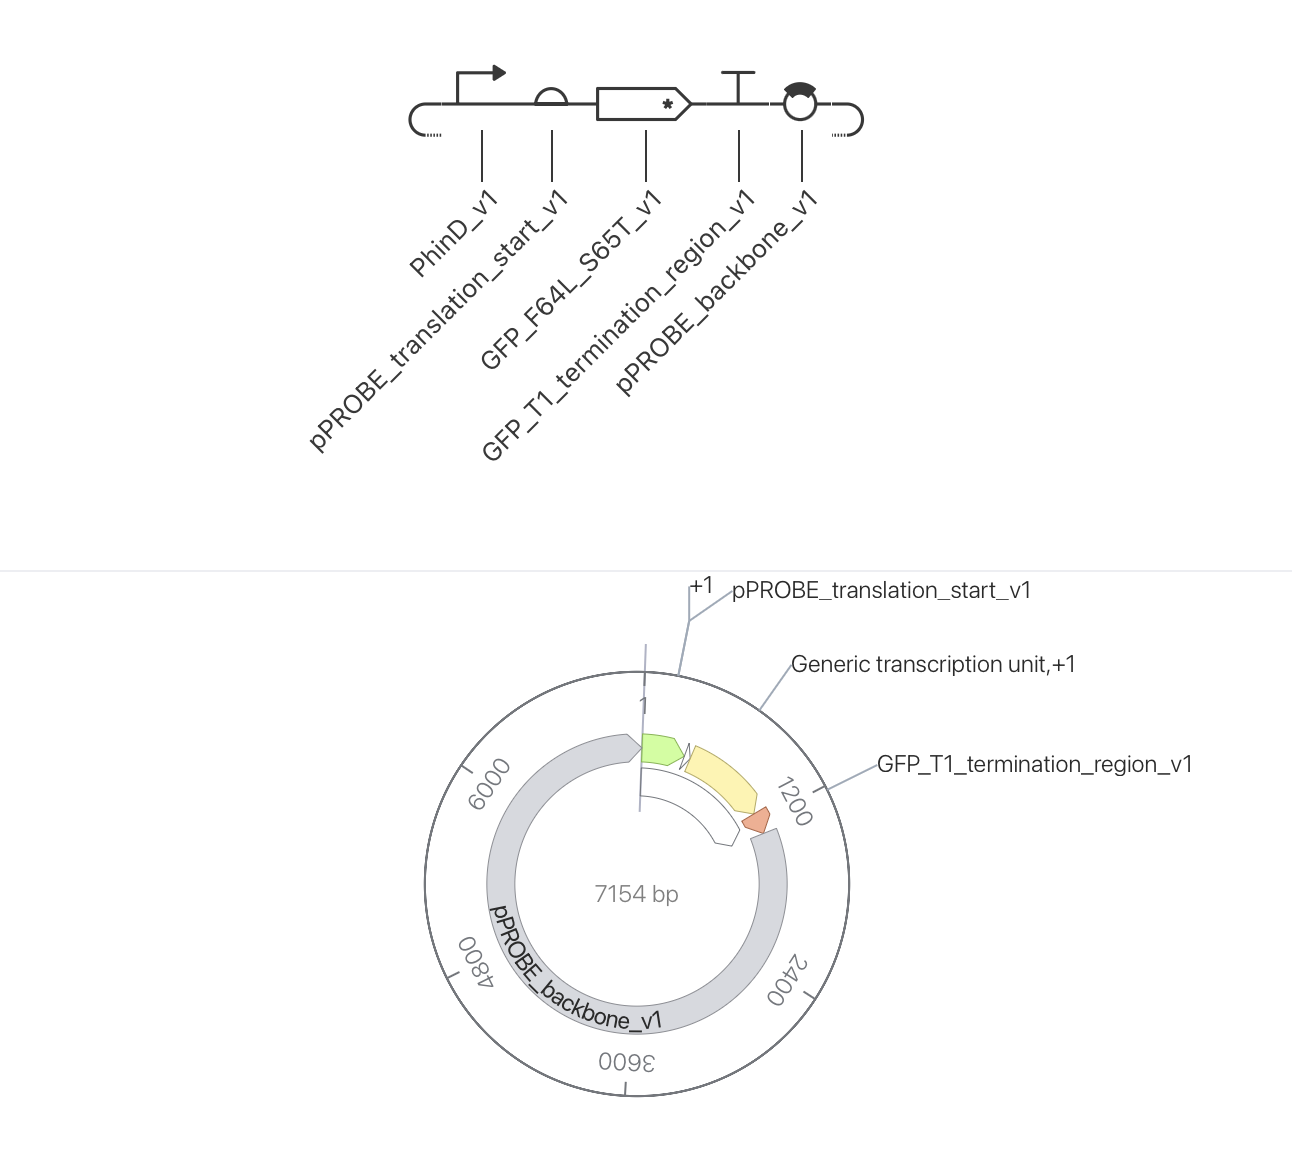
The figure below shows the assembled circular plasmid in Kernel.
Figure 1. The construct in Kernel showing the five parts.
Figure 2. The assembled circular plasmid.
The five part lengths total 7154 bp, matching the Kernel map.
Part 4: Optimization and quality checks
Codon optimization
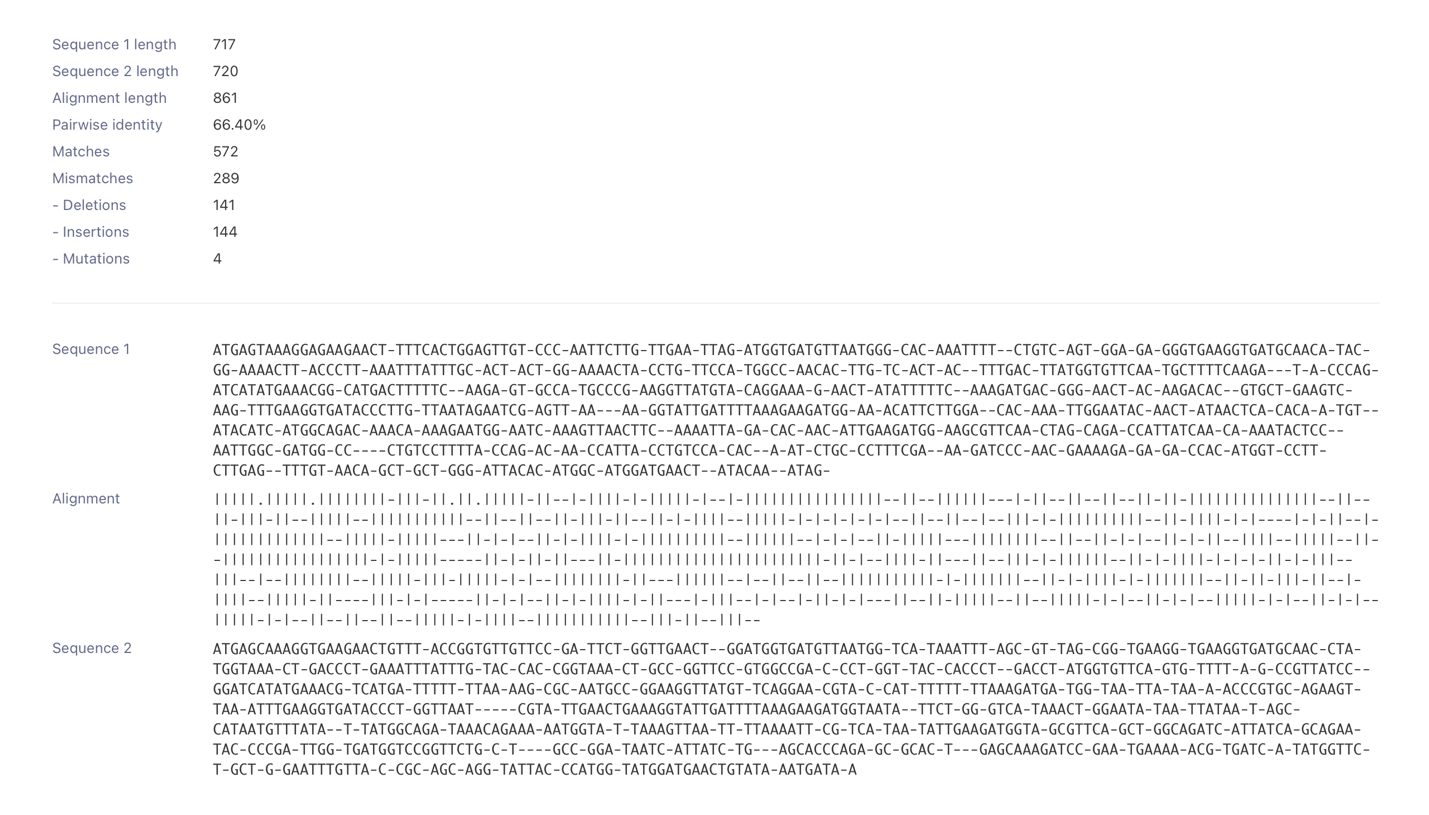
I used Kernel’s Coding Sequence Optimization tool with Algorithm version Simple v0.3 (default) and Expression organism E. coli. The selected stop-codon option replaced the original TAG with TGA and appended TAA. The resulting sequence is 720 nt.
Using Sequence Alignment tool, it counted 137 changed amino-acid-coding codons and 156 nucleotide substitutions, all synonymous. For example, AGT changed to AGC, while still encoding serine. The comparison retained the 238-amino-acid GFP sequence. It replaced TAG with TGA and added TAA. I noted a small GC increase too.
Figure 3. Sequence 1 is the original CDS; Sequence 2 is the optimized comparison version.
Codon optimization changes synonymous codon choices for the selected host, while preserving the protein sequence. It may affect expression, but improved fluorescence still needs experimental testing.
Sequence search
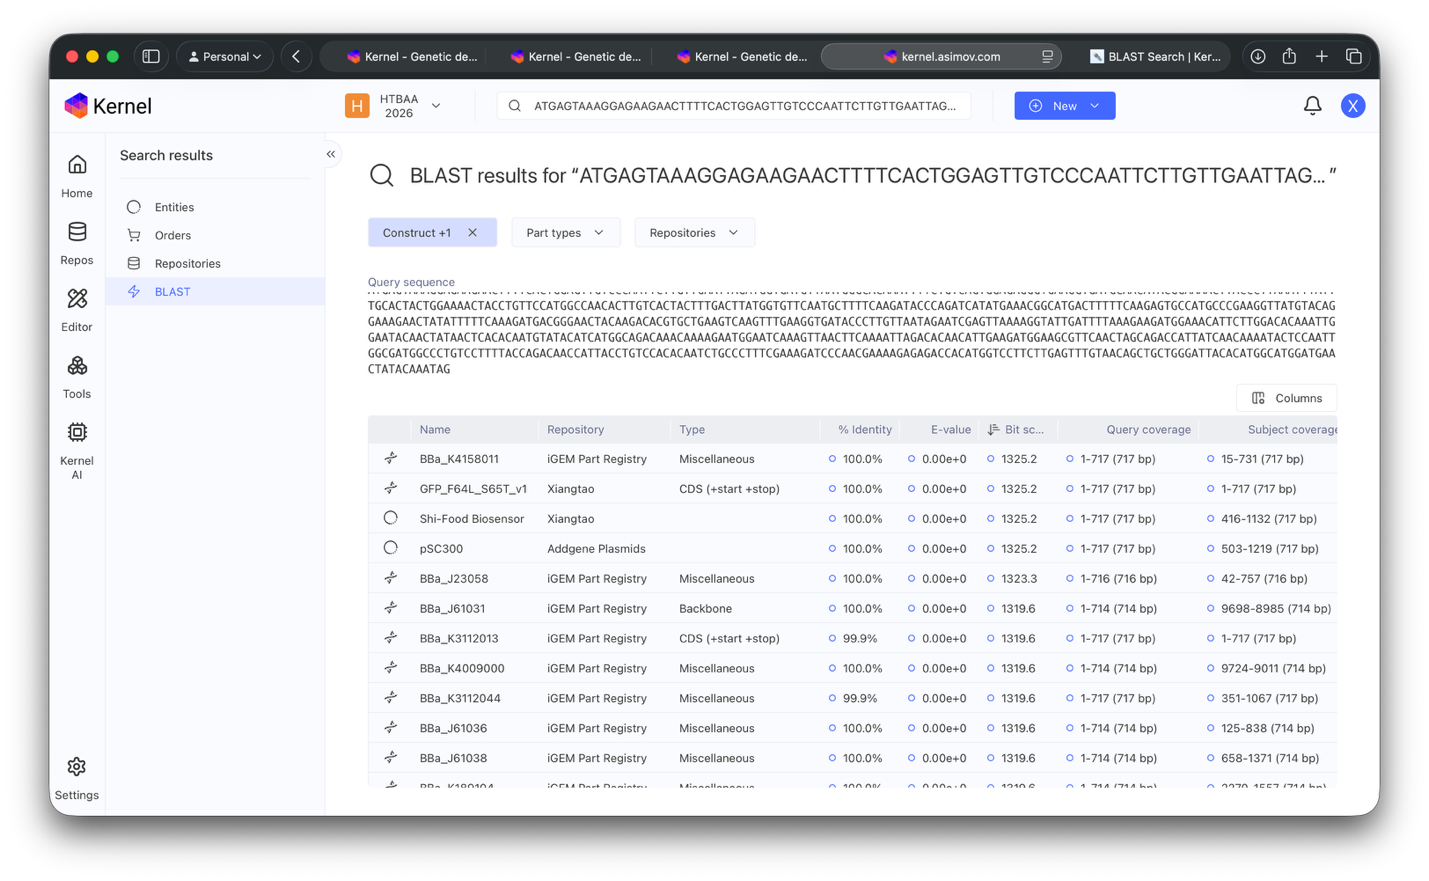
I searched the original 717-nt GFP CDS using Kernel BLAST. The closest matches included BBa_K4158011 in the iGEM Part Registry and pSC300 in Addgene Plasmids, both with 100% identity and complete 717-nt coverage. These results support its identity as a known engineered GFP F64L/S65T variant.
Figure 4. The original GFP CDS matches known reporter sequences.
SecureDNA screen
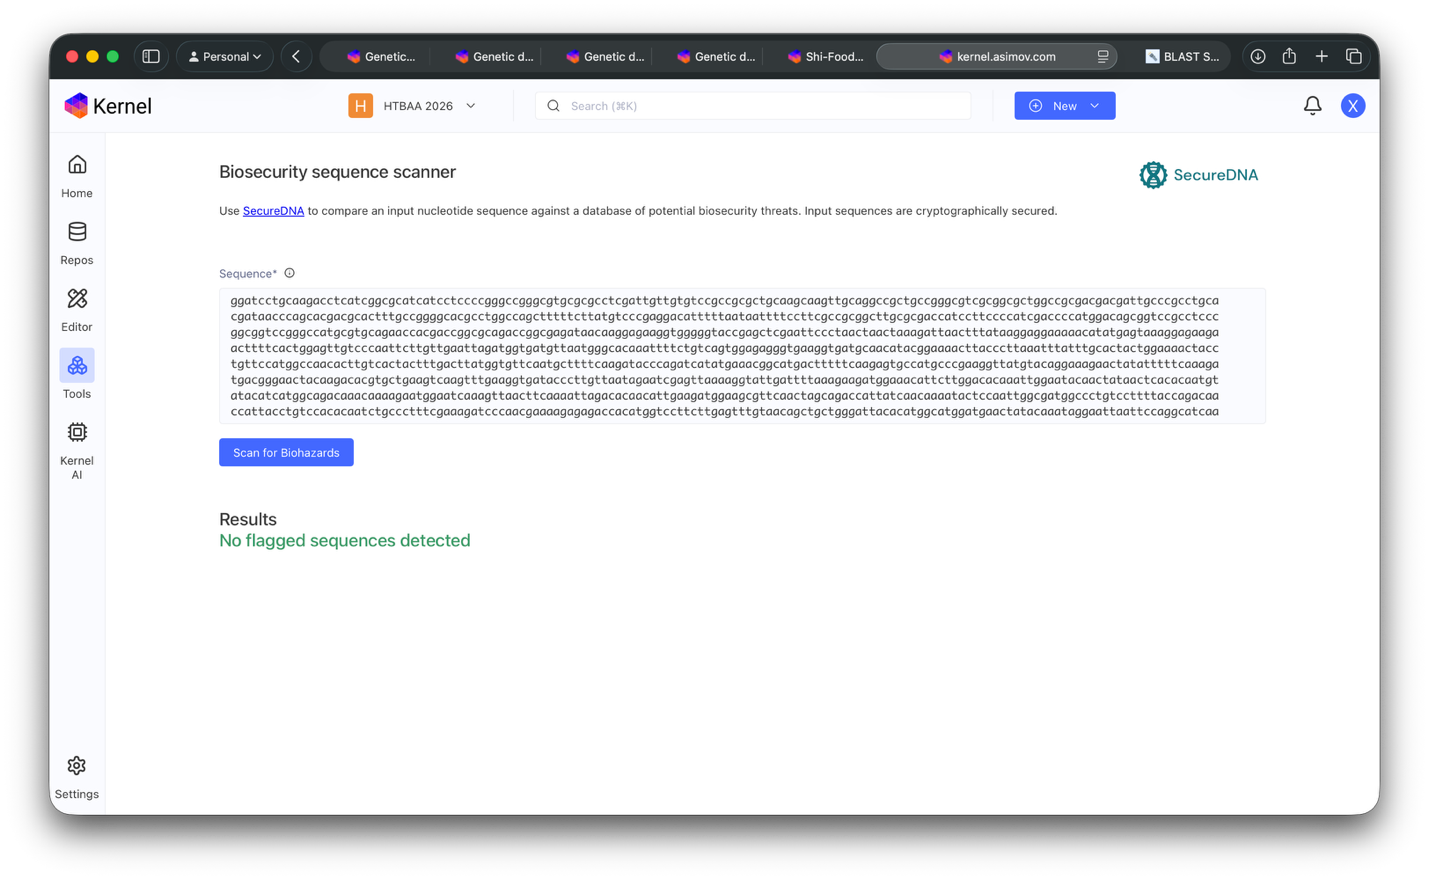
I screened the original 717-nt GFP CDS and the whole construct using SecureDNA in Kernel. The tool checks submitted sequence against a database of potential biosecurity hazards. It reported “No flagged sequences detected.”
Figure 5. The construct-level SecureDNA result recorded in Kernel.
Part 5: From design to build
For a first prototype, I would reuse a pPROBE-NT vector and insert the 350-bp PhinD regulatory fragment upstream of GFP using BamHI/KpnI restriction cloning. The two added 6-bp sites provide cloning junctions and help control the insert’s orientation. Reusing the vector would reduce the amount of new DNA to order. If suitable vector material is unavailable, I would consider assembling synthetic fragments using Gibson assembly. This approach requires designed overlaps between fragments, rather than BamHI/KpnI sites. (reference)
Synthesis quality depends on both sequence and length. I would review GC content and repeats before ordering. Error correction can reduce synthesis errors, but we still need to confirm the assembled sequence. (reference)
After obtaining a verified plasmid, PCR could provide additional DNA for construction, while propagating plasmid-bearing cells could provide plasmid stocks. I would keep frozen stocks of a verified clone for later batches. At larger scale, I would also check plasmid retention and consistent fluorescence response across batches. (reference)
Part 6: Remaining unknowns
Will PhinD respond to histamine in E. coli? This is the largest uncertainty. In PAO1, histamine metabolism produces ImAA, which activates the regulatory protein HinK and promotes transcription from PhinD. My construct contains the PhinD-GFP reporter module but does not add HinK or the associated histamine-metabolism genes. I would compare fluorescence with and without histamine. If the response is weak, I would reconsider the host or sensing module.
Does the optimized CDS improve the reporter? Codon choices are host-specific, and many synonymous sequences can encode the same protein. I would compare the original and optimized GFP in otherwise identical constructs, measuring fluorescence, growth and background expression. This would test whether the software’s preferred codons improve this particular design.
Can I read the signal reliably in food samples? GFP is expected to remain intracellular in the current design. I would first measure whole-cell fluorescence with a plate reader or fluorescence microscope, then compare buffer and food-matrix samples to assess background fluorescence and interference. Secretion would require a new design.
AI assistance
I used Codex to help locate sequence sources, explain part functions and organize the design.
Week 3 HW: Cell-Free Reaction Design
A. Compare cell-free reaction compositions
Potassium glutamate and magnesium glutamate
Why do their concentrations differ between compositions? Which is more sensitive?
Potassium glutamate contributes to the ionic environment and supplies glutamate. Potassium is essential for translation. Glutamate replaces chloride as the counter-ion because chloride may inhibit some CFPS enzymes. Magnesium glutamate supplies Mg²⁺ for ribosomes, nucleic-acid interactions and enzyme activity. Magnesium holds ribosomes together and keeps tRNAs folded correctly. Potassium glutamate and magnesium glutamate concentrations differ between compositions because they have different functions and their optimal levels depend on the whole reaction formulation.
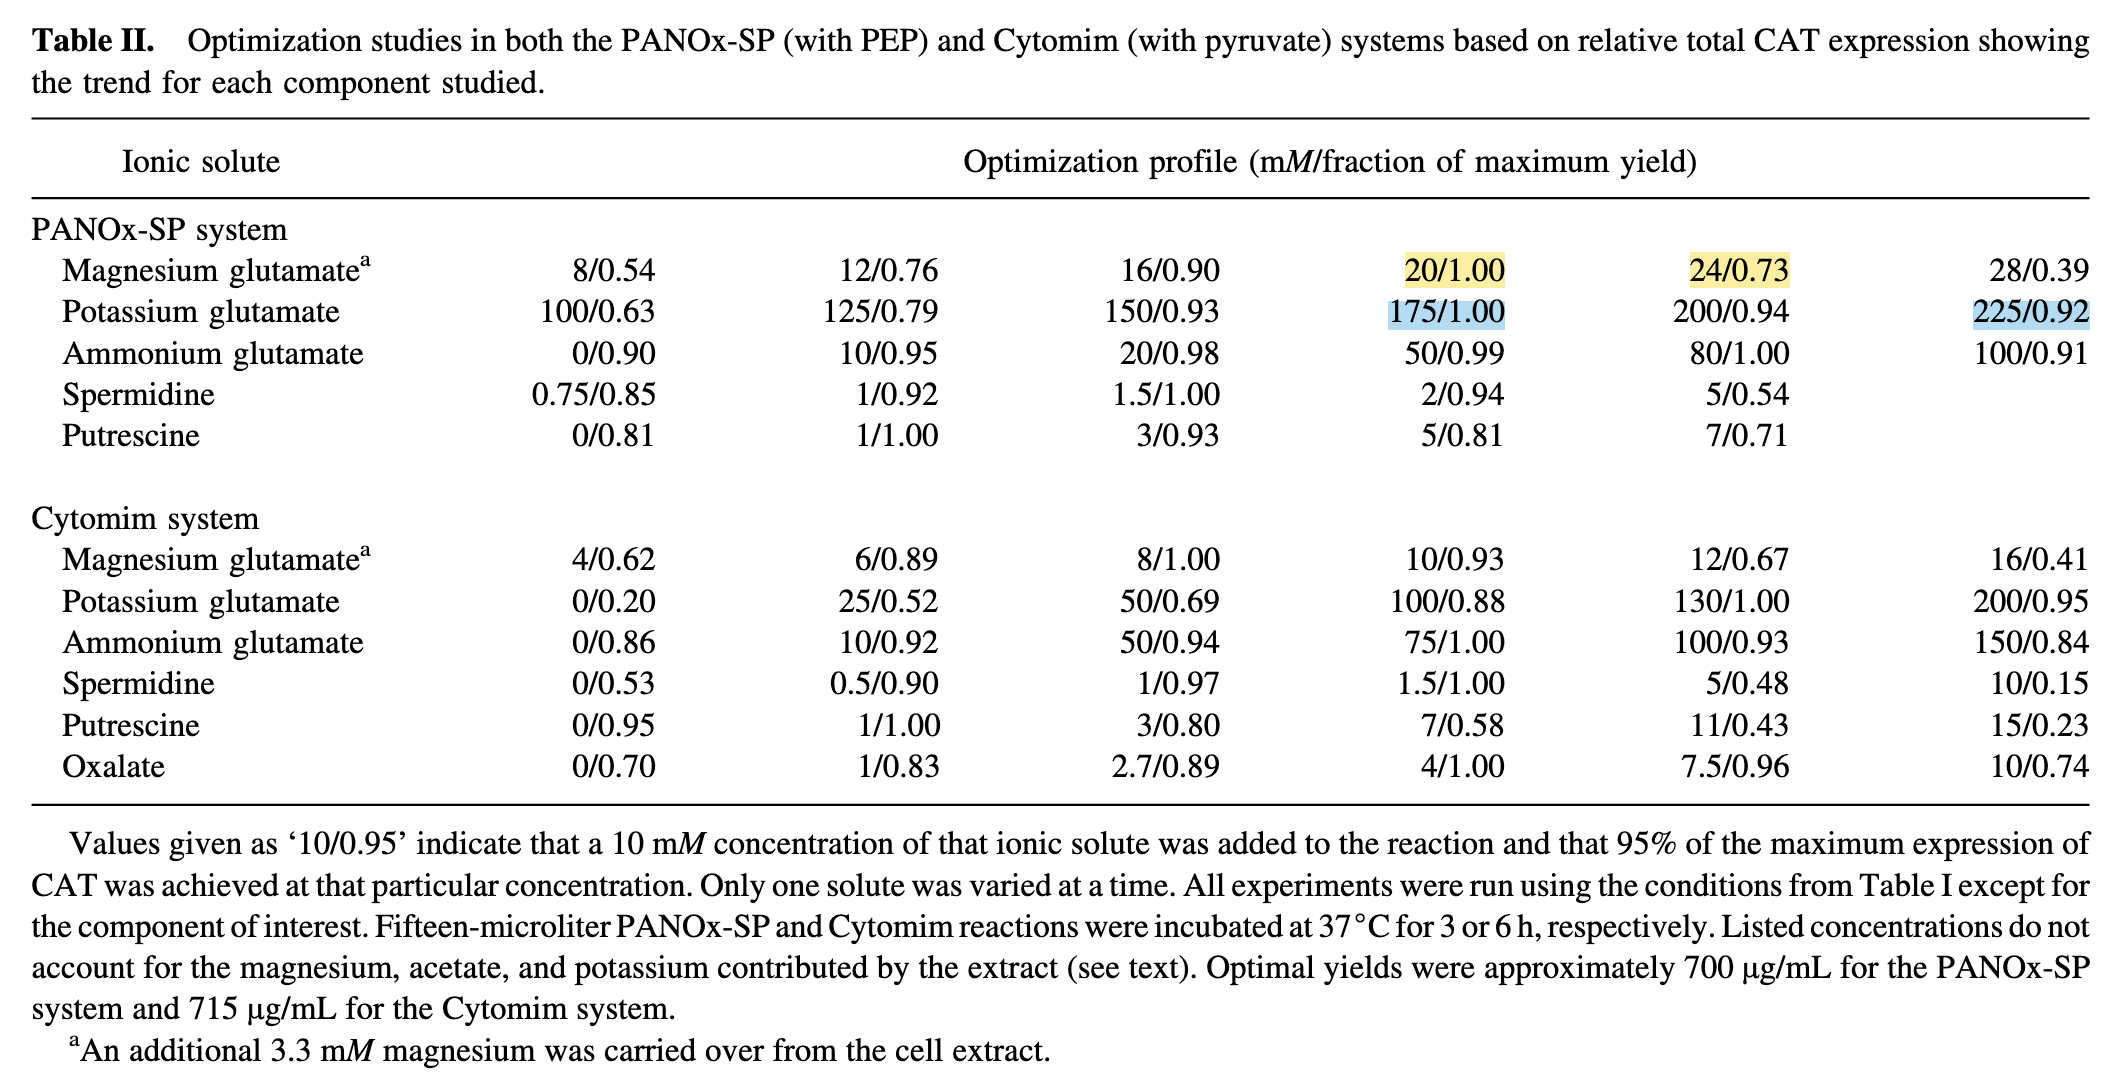
I guess magnesium glutamate is more sensitive. In Jewett and Swartz’s PANOx-SP experiments, raising added magnesium glutamate from 20 to 24 mM reduced relative yield from 1.00 to 0.73. Raising potassium glutamate from 175 to 225 mM retained 0.92 of the yield. That suggests a narrower magnesium window in this particular system. The course website also describes magnesium as one of the most sensitive CFPS optimization parameters: too little stalls translation, while too much can cause aggregation.
Figure 1. Ionic-solute optimization in the PANOx-SP and Cytomim systems, from Jewett and Swartz (2004). The highlighted values show the magnesium and potassium comparisons discussed above.
PEP+NTP versus Ribose+NMP
How do the two reaction formulations differ?
PEP is phosphoenolpyruvate, an energy substrate used to regenerate ATP. NTPs are nucleoside triphosphates: ATP, CTP, GTP and UTP. RNA polymerase uses them to make mRNA directly.
A Ribose + NMP formulation supplies ribose and less expensive nucleoside monophosphates, such as AMP, CMP, GMP, and UMP. Enzymes in the lysate generate the required NTPs through metabolism and phosphorylation, which is needed for transcription. Olsen et al.’s RFopt formulation also contains glucose, so its energy supply depends on several components working together.
Both formulations require NTPs. The main difference is how these molecules are supplied and maintained. Ribose+NMP can reduce reagent costs, although it may need more time.
Comparing PANOx-SP and RFopt
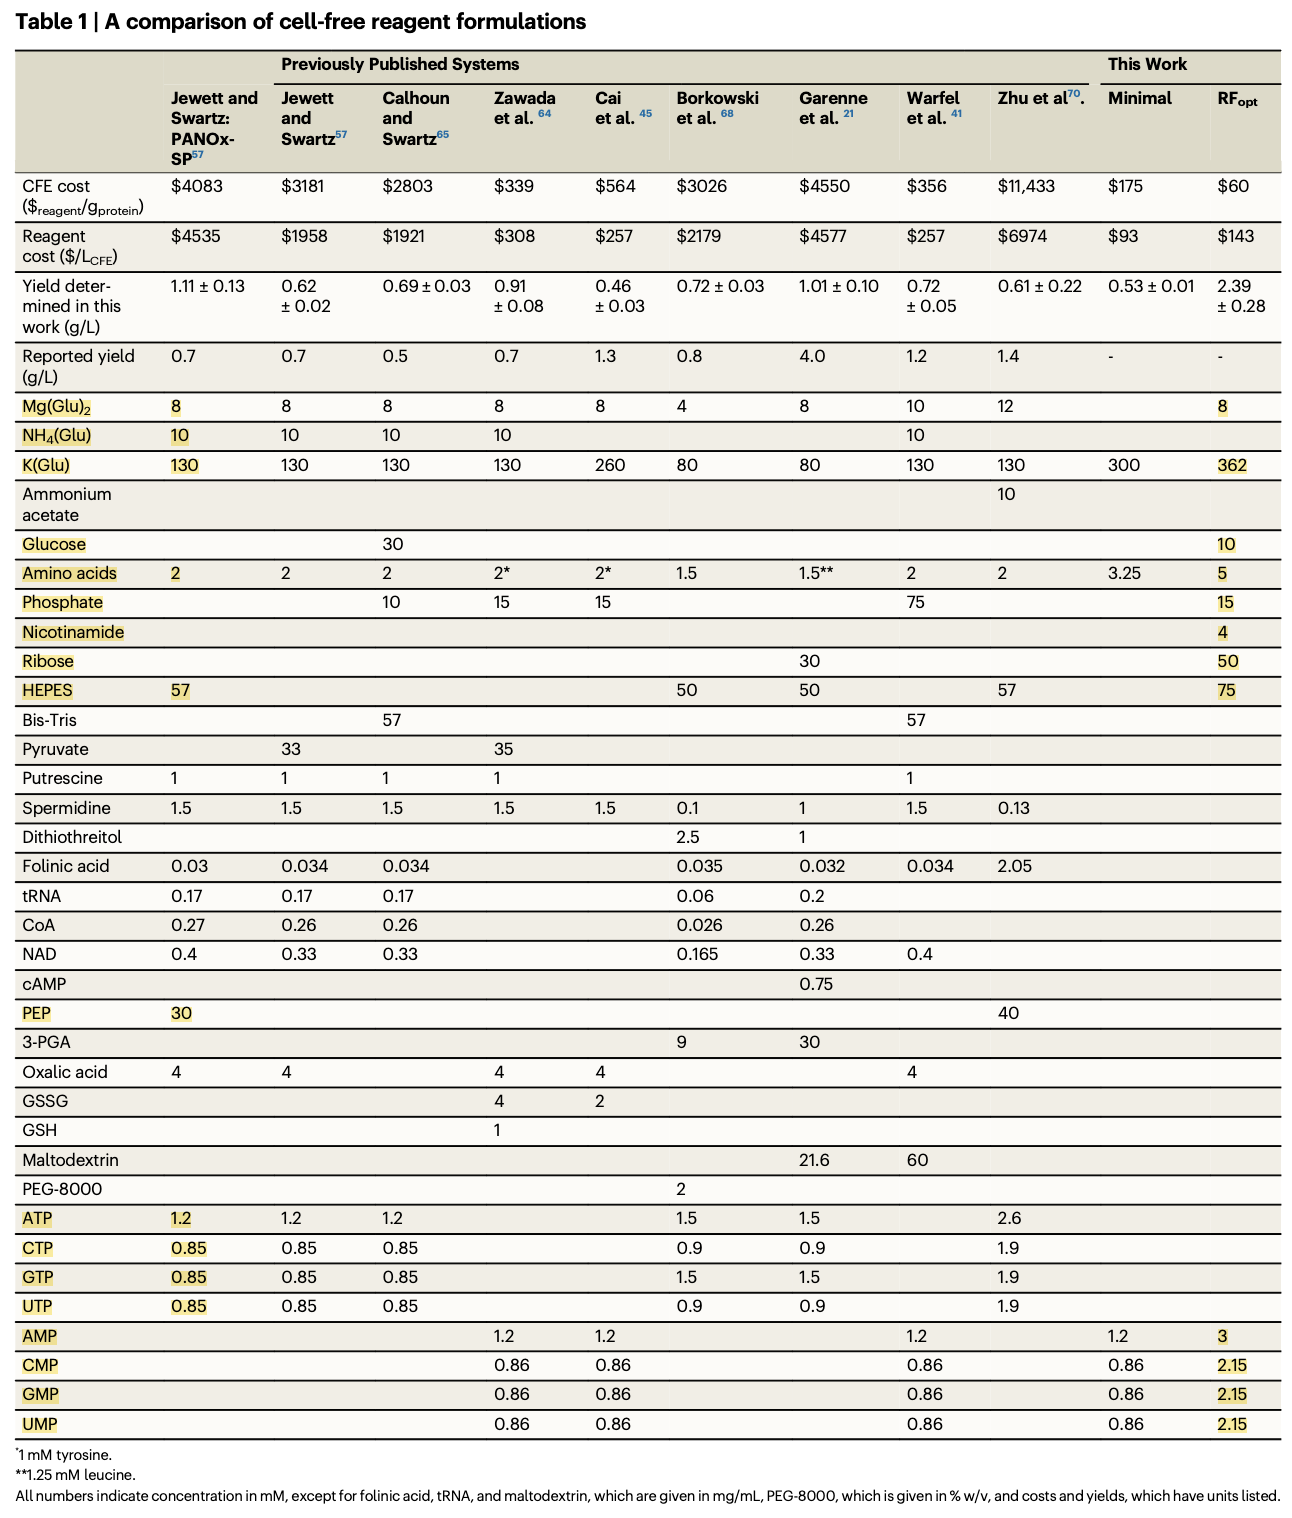
I compare the PANOx-SP formulation and RFopt as listed and tested by Olsen et al. (2026). Both produced sfGFP using E. coli BL21 Star (DE3) lysate in 15 µL reactions at 30°C for 20 hours. Using the same protein and experimental conditions provides a useful basis for comparing the formulations.
Figure 2. Comparison of cell-free reagent formulations, from Olsen et al. (2026). The highlighted entries correspond to the main reagents compared below.
Both contain magnesium glutamate, potassium glutamate, amino acids and HEPES. Their added magnesium glutamate concentration is identical at 8 mM. However, RFopt uses more potassium glutamate, amino acids and HEPES, as shown below.
Added reagent
PANOx-SP
RFopt
Magnesium glutamate
8 mM
8 mM
Ammonium glutamate
10 mM
None added
Potassium glutamate
130 mM
362 mM
Glucose
None added
10 mM
Amino acids, each
2 mM
5 mM
Phosphate
None added
15 mM
Nicotinamide
None added
4 mM
Ribose
None added
50 mM
HEPES
57 mM
75 mM
PEP
30 mM
None added
ATP
1.2 mM
None added
CTP, GTP, UTP
0.85 mM each
None added
AMP
None added
3 mM
CMP, GMP, UMP
None added
2.15 mM each
NAD
0.4 mM
None added
The main difference is how energy and nucleotides are supplied. PANOx-SP uses PEP to regenerate ATP and directly supplies nucleoside triphosphates, or NTPs. RFopt supplies nucleoside monophosphates, or NMPs, together with ribose, glucose and phosphate. It relies on metabolism in the lysate to generate the required NTPs and maintain energy supply. RFopt also omits NAD, CoA, tRNA, folinic acid, spermidine and putrescine, which are included in PANOx-SP.
PANOx-SP produced 1.11 ± 0.13 g/L sfGFP, while RFopt produced 2.39 ± 0.28 g/L. Their reagent costs were approximately $4,083/g and $60/g of protein, respectively. These results suggest that lower-cost inputs can support high yield when the whole formulation is changed.
B. Design one reaction composition for each protein
Each design is for a 20 µL reaction using the reagents available on the course platform.
sfGFP
Reagent
Concentration
Potassium glutamate
253.59 mM
HEPES-KOH, pH 7.5
75.00 mM
Ribose
49.96 mM
Glucose
9.71 mM
Magnesium glutamate
8.22 mM
Potassium phosphate, 1.6:1 dibasic:monobasic molar ratio
7.50 mM
Potassium phosphate, 1.6:1 monobasic:dibasic molar ratio
7.50 mM
17 amino acid mix
5.00 mM
Tyrosine, pH 12
5.00 mM
Cysteine
5.00 mM
Nicotinamide
4.00 mM
AMP
3.00 mM
CMP
2.13 mM
GMP
2.13 mM
UMP
2.13 mM
Spermidine
1.25 mM
I designed an sfGFP reaction based on RFopt using the reagents available on the course platform. I added 1.25 mM spermidine because it is a low cost reagent and has positive corelation with protein titer reported by Smith et al.. Their results motivated this test. My hypothesis is that polyamines such as spermidine stabilize nucleic acids and ribosomal function, thereby improving transcription and translation.
I reduced potassium glutamate from 362 mM to 253.59 mM to accommodate the reagent combination within the fixed 20 µL volume, which may also reduce aggregation during synthesis. The formulation retains approximately the RFopt concentrations of ribose, glucose, amino acids, NMPs and other components. I also kept total phosphate at 15 mM and combined equal amounts of the two phosphate stocks, giving a nominal monobasic:dibasic ratio of 1:1.
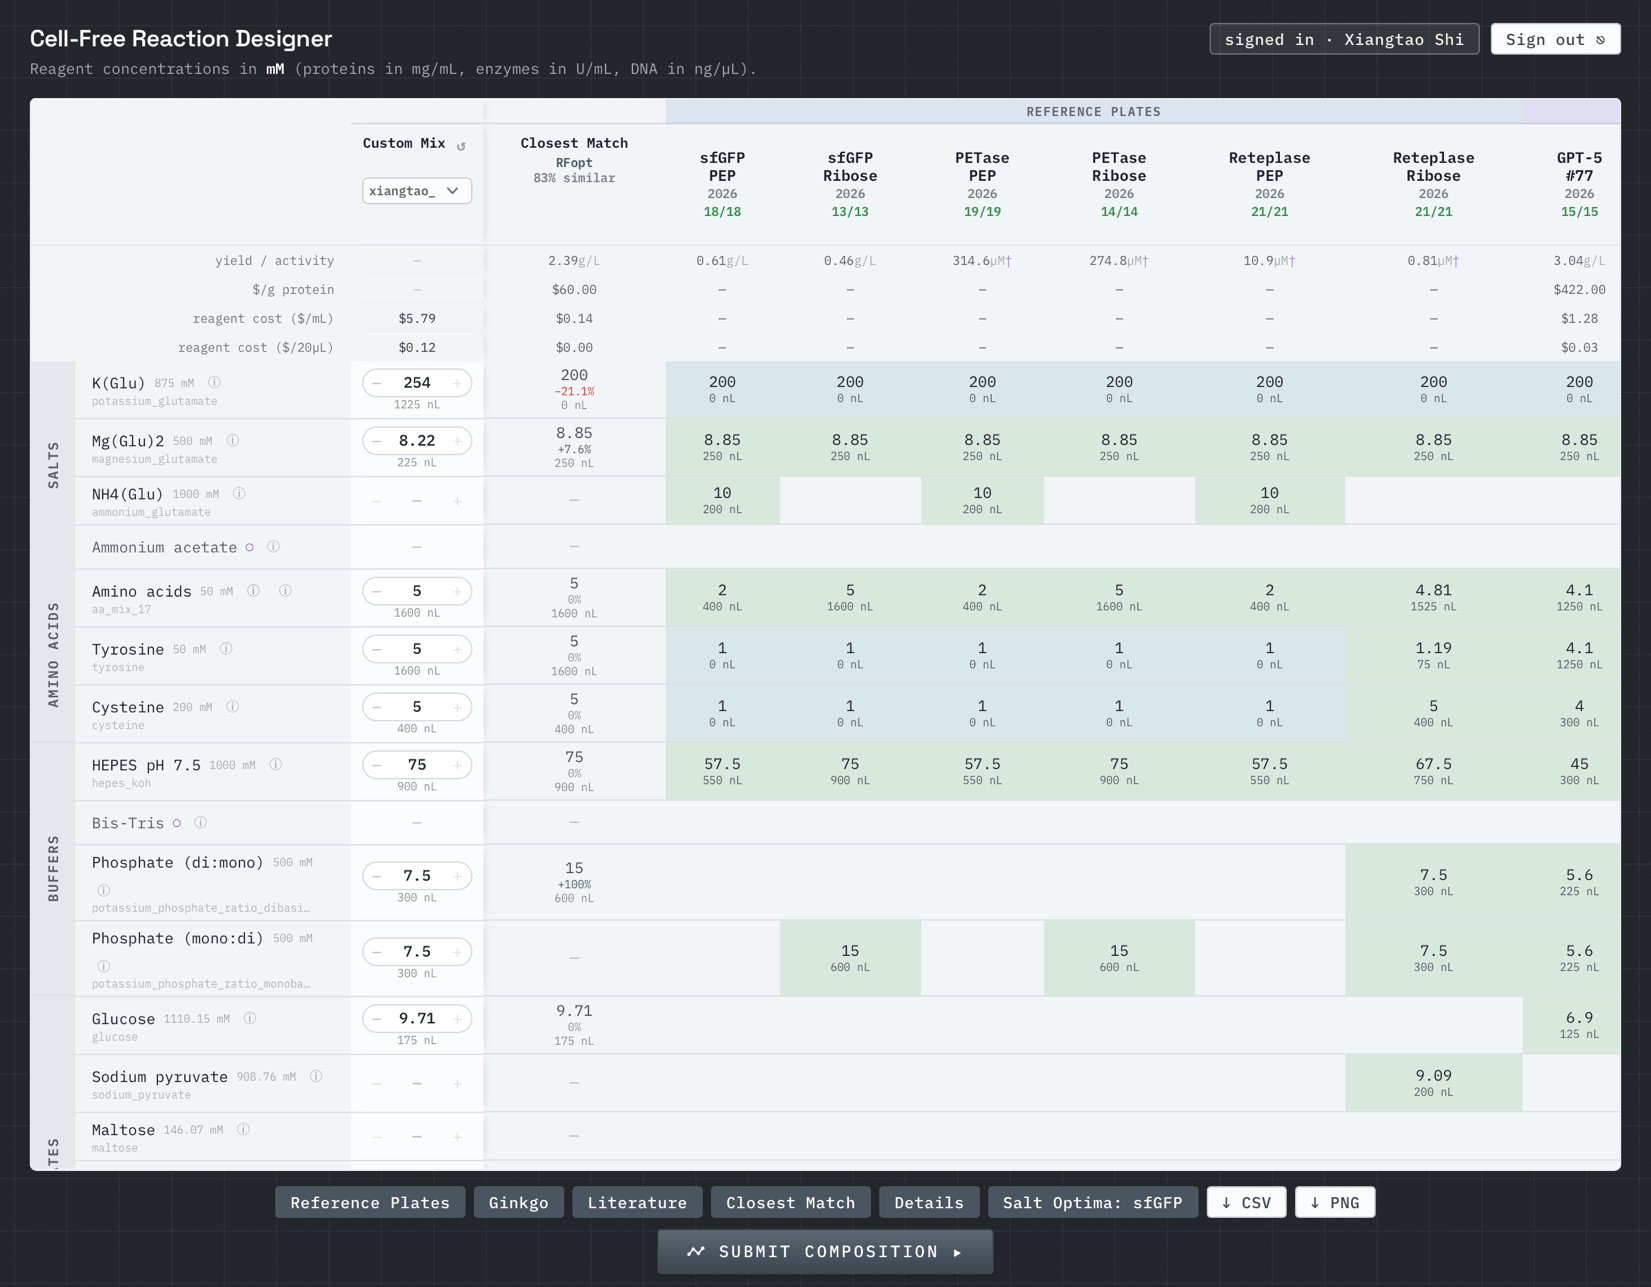
Figure 3. My sfGFP formulation in the Cell-Free Reaction Designer. The displayed potassium glutamate value is rounded to 254 mM.
PETase
Reagent
Concentration or volume
Potassium glutamate
298.44 mM
HEPES-KOH, pH 7.5
75.00 mM
Ribose
49.96 mM
Potassium phosphate, 1.6:1 monobasic:dibasic molar ratio
15.00 mM
Magnesium glutamate
8.22 mM
17 amino acid mix
5.00 mM
Nicotinamide
4.00 mM
AMP
3.00 mM
CMP
2.13 mM
GMP
2.13 mM
UMP
2.13 mM
DsbC (E. coli, 25.5 kDa)
2.50 µM
Water
0.750 µL (volume)
The course’s PETase target is TfCut2 cutinase, which has one disulfide bond. I retained DsbC but reduced it from 5 to 2.5 µM. I want to test whether a smaller dose preserves enough activity to lower the cost per functional output.
Reteplase
Reagent
Concentration
Potassium glutamate
201.09 mM
HEPES-KOH, pH 7.5
117.50 mM
PEP mono (0.1 M stock)
30.00 mM
Ammonium glutamate
10.00 mM
Magnesium glutamate
5.72 mM
Oxidized glutathione (GSSG)
4.04 mM
Potassium oxalate
3.75 mM
17 amino acid mix
2.00 mM
Spermidine
1.56 mM
ATP
1.25 mM
Putrescine dihydrochloride
1.25 mM
Reduced glutathione (GSH)
1.00 mM
CTP
875.00 µM
GTP
875.00 µM
UTP
875.00 µM
NAD
375.00 µM
Coenzyme A
250.00 µM
DsbC (E. coli, 25.5 kDa)
2.50 µM
Folinic acid
0.025 g/L
I used the Reteplase PEP reference formulation as a starting point. I increased HEPES-KOH (pH 7.5) from 57.5 to 117.5 mM to provide greater buffering capacity. I also decreased magnesium glutamate, Mg(Glu)₂, from about 8.22 to 5.72 mM. Furthermore, I reduced DsbC from 5 to 2.5 µM to lower reagent cost, although the effect on protein folding and activity would need to be tested. The remaining components were kept approximately unchanged.
Community reagent suggestion: FkpA
FkpA is an E. coli chaperone with peptidyl-prolyl isomerase activity that helps proteins fold. Groff et al. found that purified FkpA reduced aggregation and worked with DsbC to improve antibody folding and assembly in a cell-free system. Since our Reteplase formulation already includes DsbC, I guess FkpA could provide additional folding support to improve the amount of active Reteplase.
Discussion forum
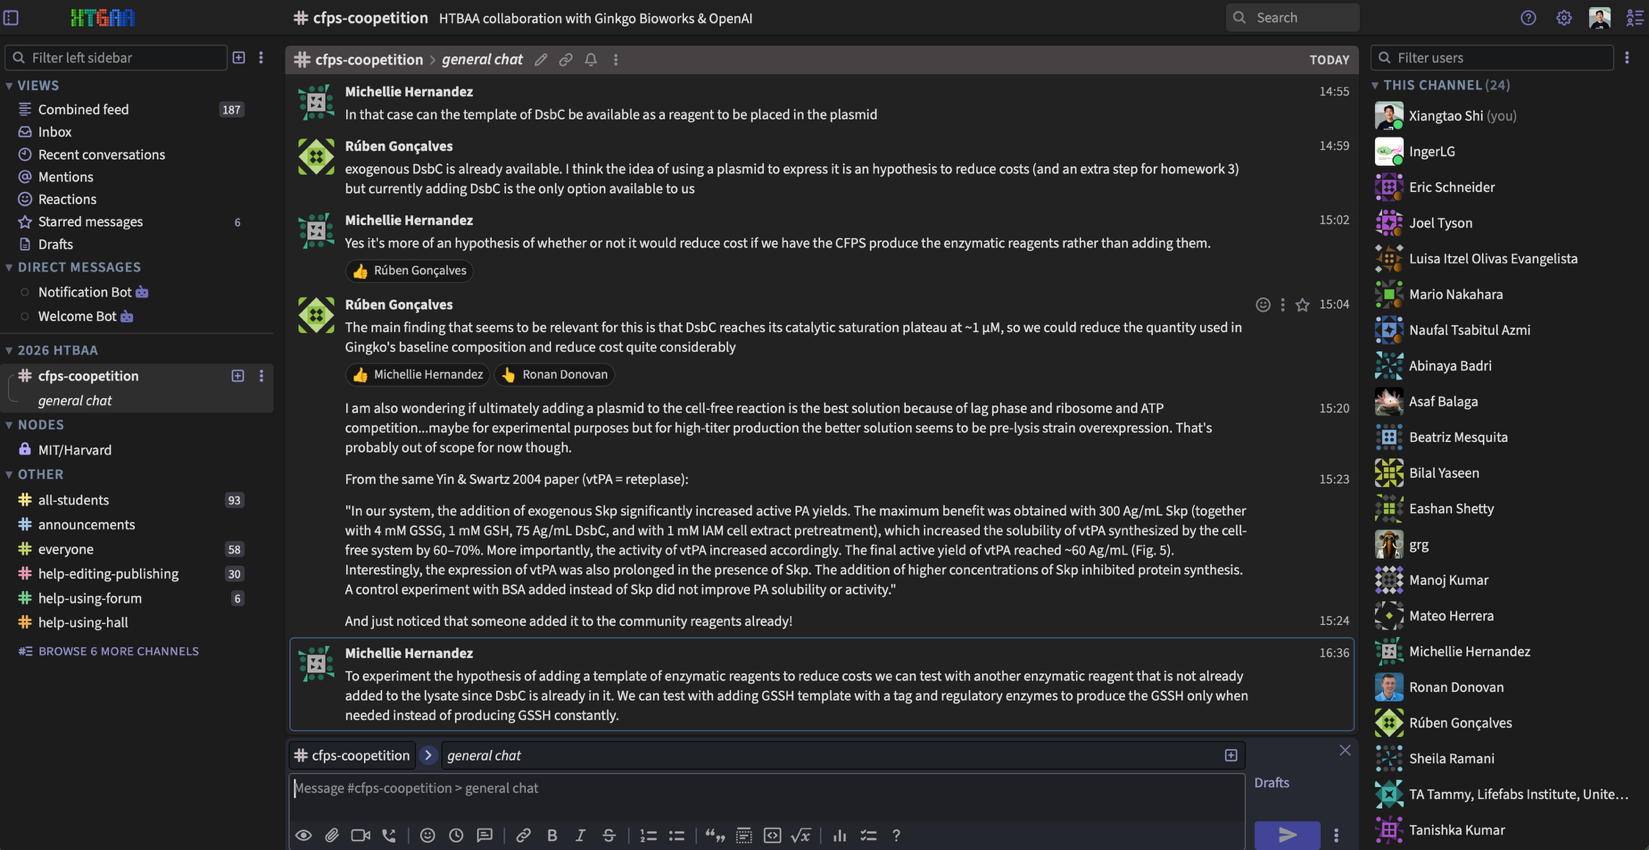
I joined the cfps-coopetition channel on the course forum.
Figure 4. The cfps-coopetition discussion channel.
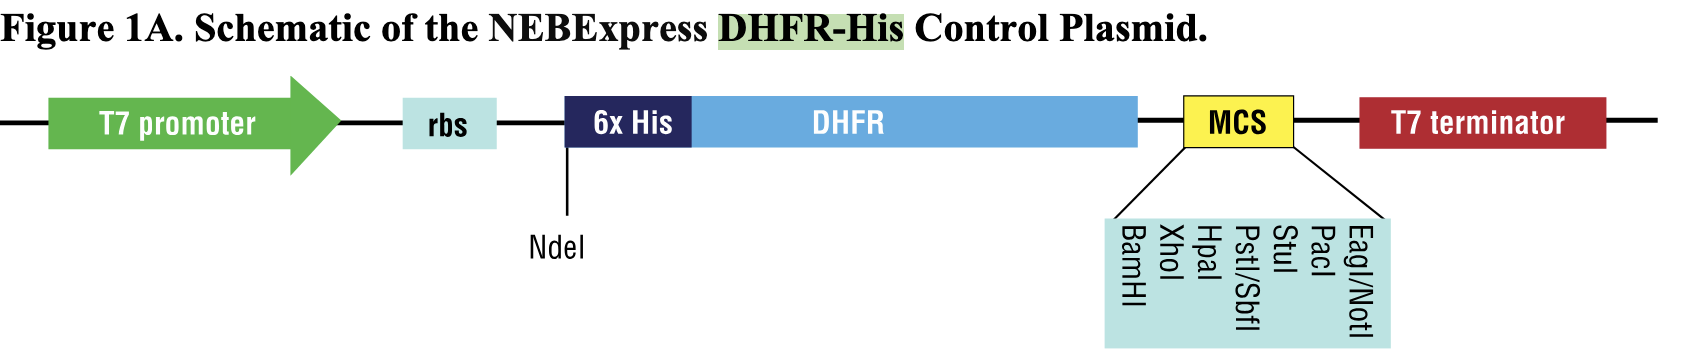
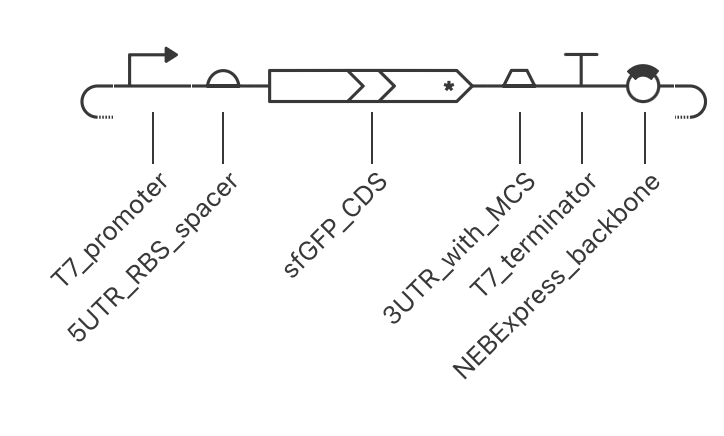
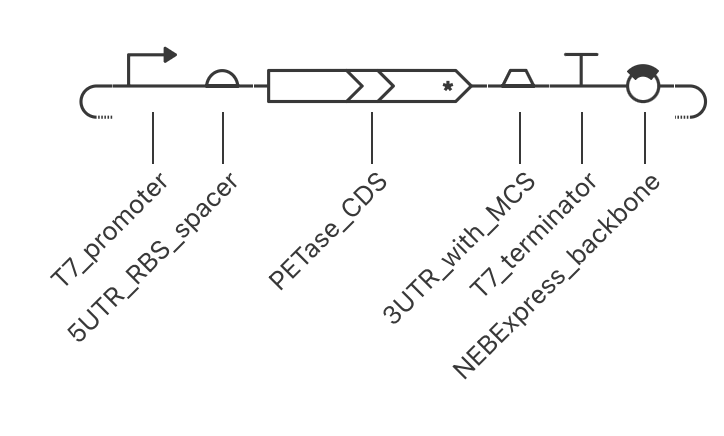
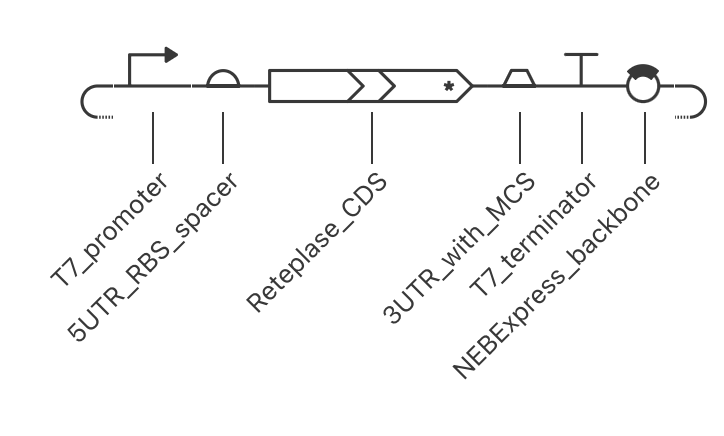
I designed three T7-compatible plasmids for the E. coli cell-free system by replacing the complete N-His–DHFR coding region of the NEBExpress DHFR-His control plasmid with synonymous DNA sequences encoding the sfGFP, PETase, and Reteplase sequences provided in the assignment. Each construct retains the original T7 promoter, ribosome-binding site, eight-nucleotide RBS-to-start spacer, downstream region, and T7 terminator. The tags and linkers included in the supplied protein sequences are preserved, and each coding sequence ends with a TAA stop codon. The resulting plasmids are 2,970, 3,177, and 3,447 bp, respectively.
Figure 5. The reference plasmid architecture from the NEBExpress Cell-free E. coli Protein Synthesis System.
sfGFP plasmid
Figure 6. The T7-compatible sfGFP construct (2,970 bp).
PETase plasmid
Figure 7. The T7-compatible PETase construct (3,177 bp).
Reteplase plasmid
Figure 8. The T7-compatible Reteplase construct (3,447 bp).
Bonus: DsbC helper plasmid
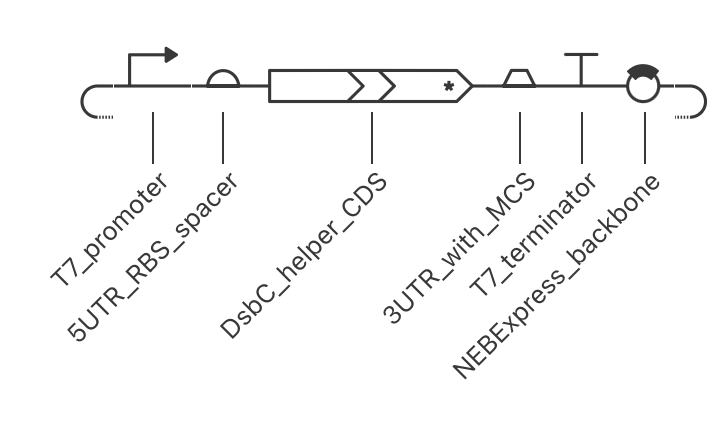
For the bonus design, I propose a separate T7-driven helper plasmid expressing mature E. coli DsbC. DsbC can rearrange incorrectly paired disulfide bonds. This may help Reteplase form its nine disulfide bonds correctly.
Figure 9. The proposed T7-driven DsbC helper construct.
AI assistance
I used Codex (OpenAI) to find resources, compare formulations, help brainstorming and organize this report.
References
Jewett, M. C., & Swartz, J. R. (2004). Mimicking the Escherichia coli cytoplasmic environment activates long-lived and efficient cell-free protein synthesis. Biotechnology and Bioengineering, 86(1), 19–26. doi:10.1002/bit.20026.
Olsen, M. L., et al. (2026). Design-driven optimization of low-cost reagent formulations for reproducible and high-yielding cell-free gene expression. Nature Communications. doi:10.1038/s41467-026-69605-8.
Smith, A. A., et al. (2026). Using a GPT-5-driven autonomous lab to optimize the cost and titer of cell-free protein synthesis. bioRxiv preprint. doi:10.64898/2026.02.05.703998.
Groff, D., et al. (2014). Engineering toward a bacterial “endoplasmic reticulum” for the rapid expression of immunoglobulin proteins. mAbs, 6(3), 671–678. Article.