Week 3 HW: Cell-Free Reaction Design
A. Compare cell-free reaction compositions
Potassium glutamate and magnesium glutamate
Why do their concentrations differ between compositions? Which is more sensitive?
Potassium glutamate contributes to the ionic environment and supplies glutamate. Potassium is essential for translation. Glutamate replaces chloride as the counter-ion because chloride may inhibit some CFPS enzymes. Magnesium glutamate supplies Mg²⁺ for ribosomes, nucleic-acid interactions and enzyme activity. Magnesium holds ribosomes together and keeps tRNAs folded correctly. Potassium glutamate and magnesium glutamate concentrations differ between compositions because they have different functions and their optimal levels depend on the whole reaction formulation.
I guess magnesium glutamate is more sensitive. In Jewett and Swartz’s PANOx-SP experiments, raising added magnesium glutamate from 20 to 24 mM reduced relative yield from 1.00 to 0.73. Raising potassium glutamate from 175 to 225 mM retained 0.92 of the yield. That suggests a narrower magnesium window in this particular system. The course website also describes magnesium as one of the most sensitive CFPS optimization parameters: too little stalls translation, while too much can cause aggregation.
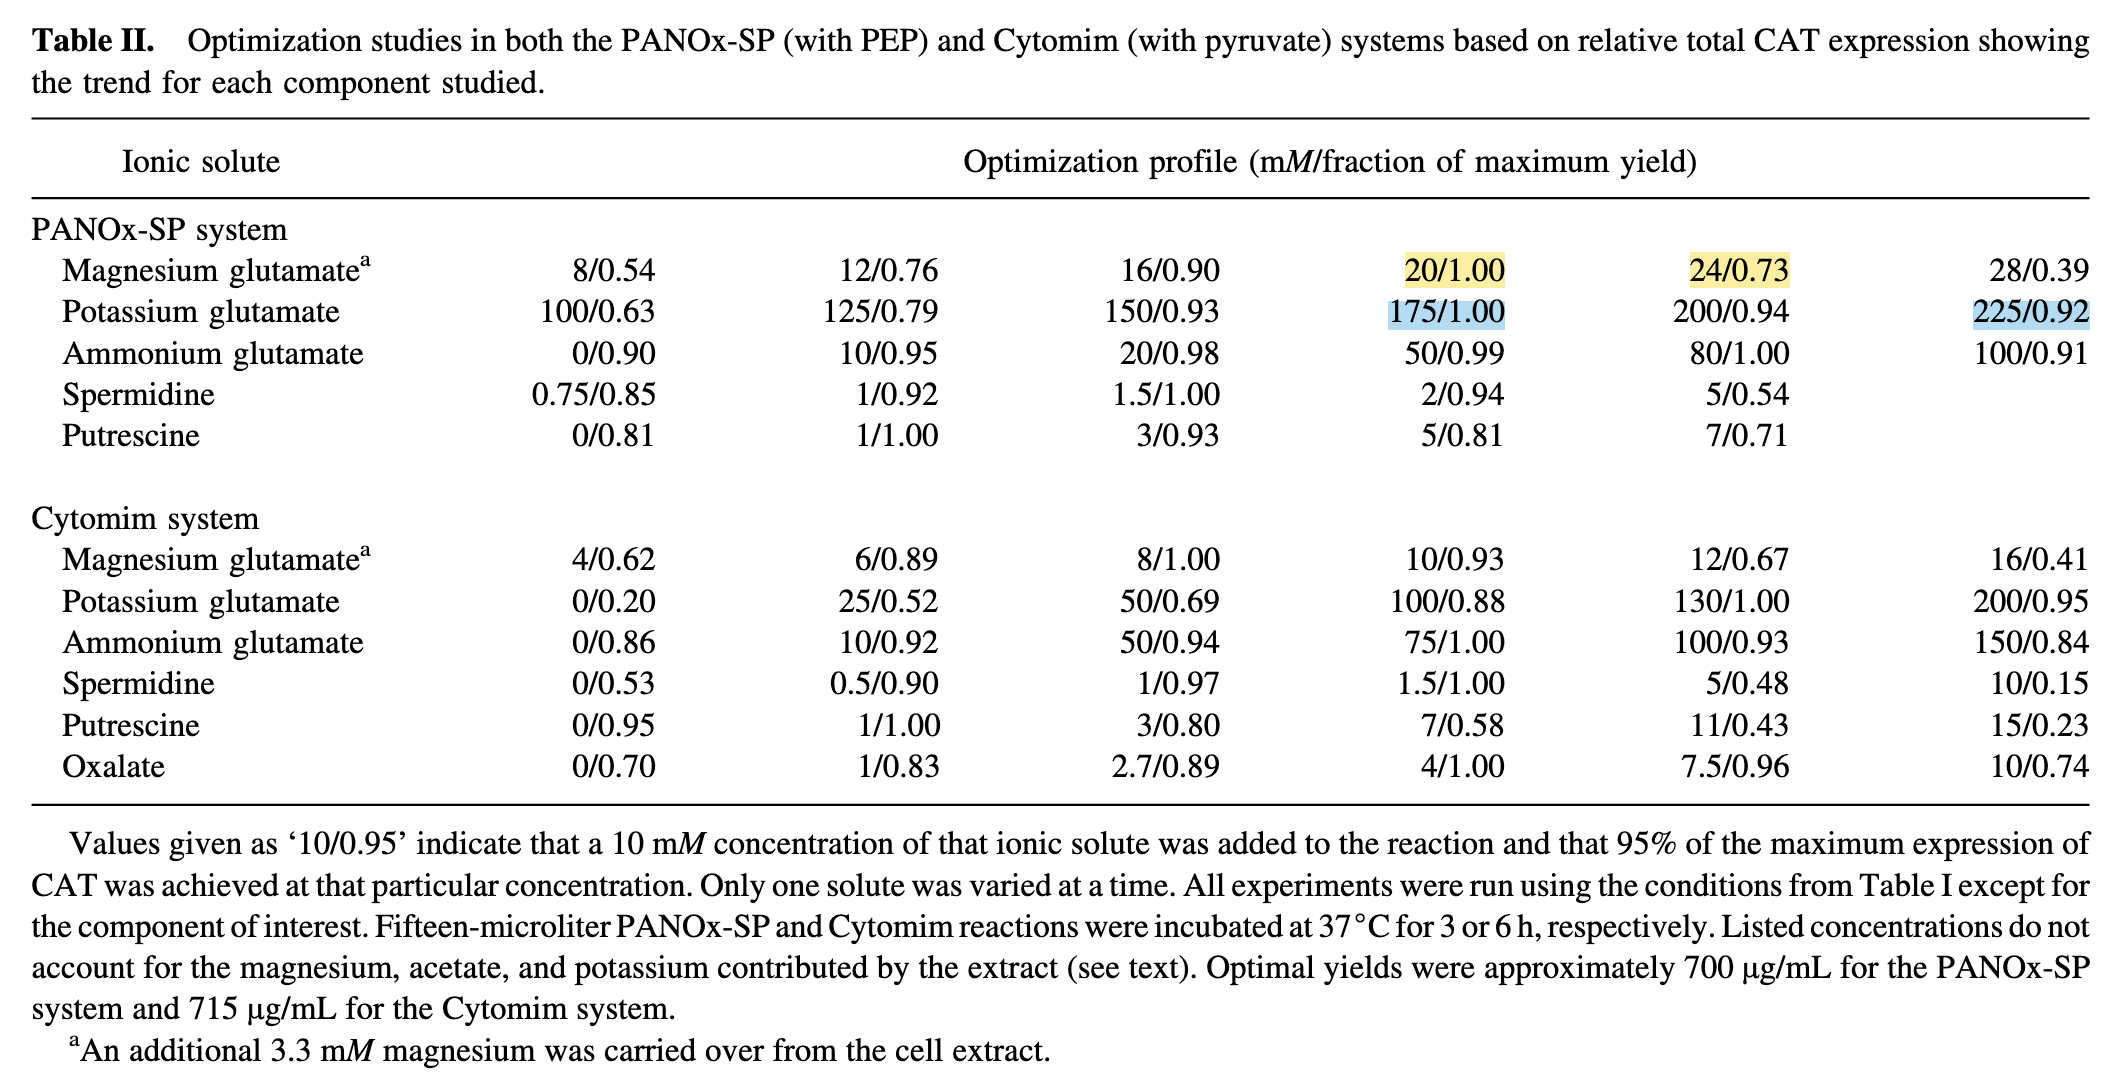
Figure 1. Ionic-solute optimization in the PANOx-SP and Cytomim systems, from Jewett and Swartz (2004). The highlighted values show the magnesium and potassium comparisons discussed above.
PEP+NTP versus Ribose+NMP
How do the two reaction formulations differ?
PEP is phosphoenolpyruvate, an energy substrate used to regenerate ATP. NTPs are nucleoside triphosphates: ATP, CTP, GTP and UTP. RNA polymerase uses them to make mRNA directly.
A Ribose + NMP formulation supplies ribose and less expensive nucleoside monophosphates, such as AMP, CMP, GMP, and UMP. Enzymes in the lysate generate the required NTPs through metabolism and phosphorylation, which is needed for transcription. Olsen et al.’s RFopt formulation also contains glucose, so its energy supply depends on several components working together.
Both formulations require NTPs. The main difference is how these molecules are supplied and maintained. Ribose+NMP can reduce reagent costs, although it may need more time.
Comparing PANOx-SP and RFopt
I compare the PANOx-SP formulation and RFopt as listed and tested by Olsen et al. (2026). Both produced sfGFP using E. coli BL21 Star (DE3) lysate in 15 µL reactions at 30°C for 20 hours. Using the same protein and experimental conditions provides a useful basis for comparing the formulations.
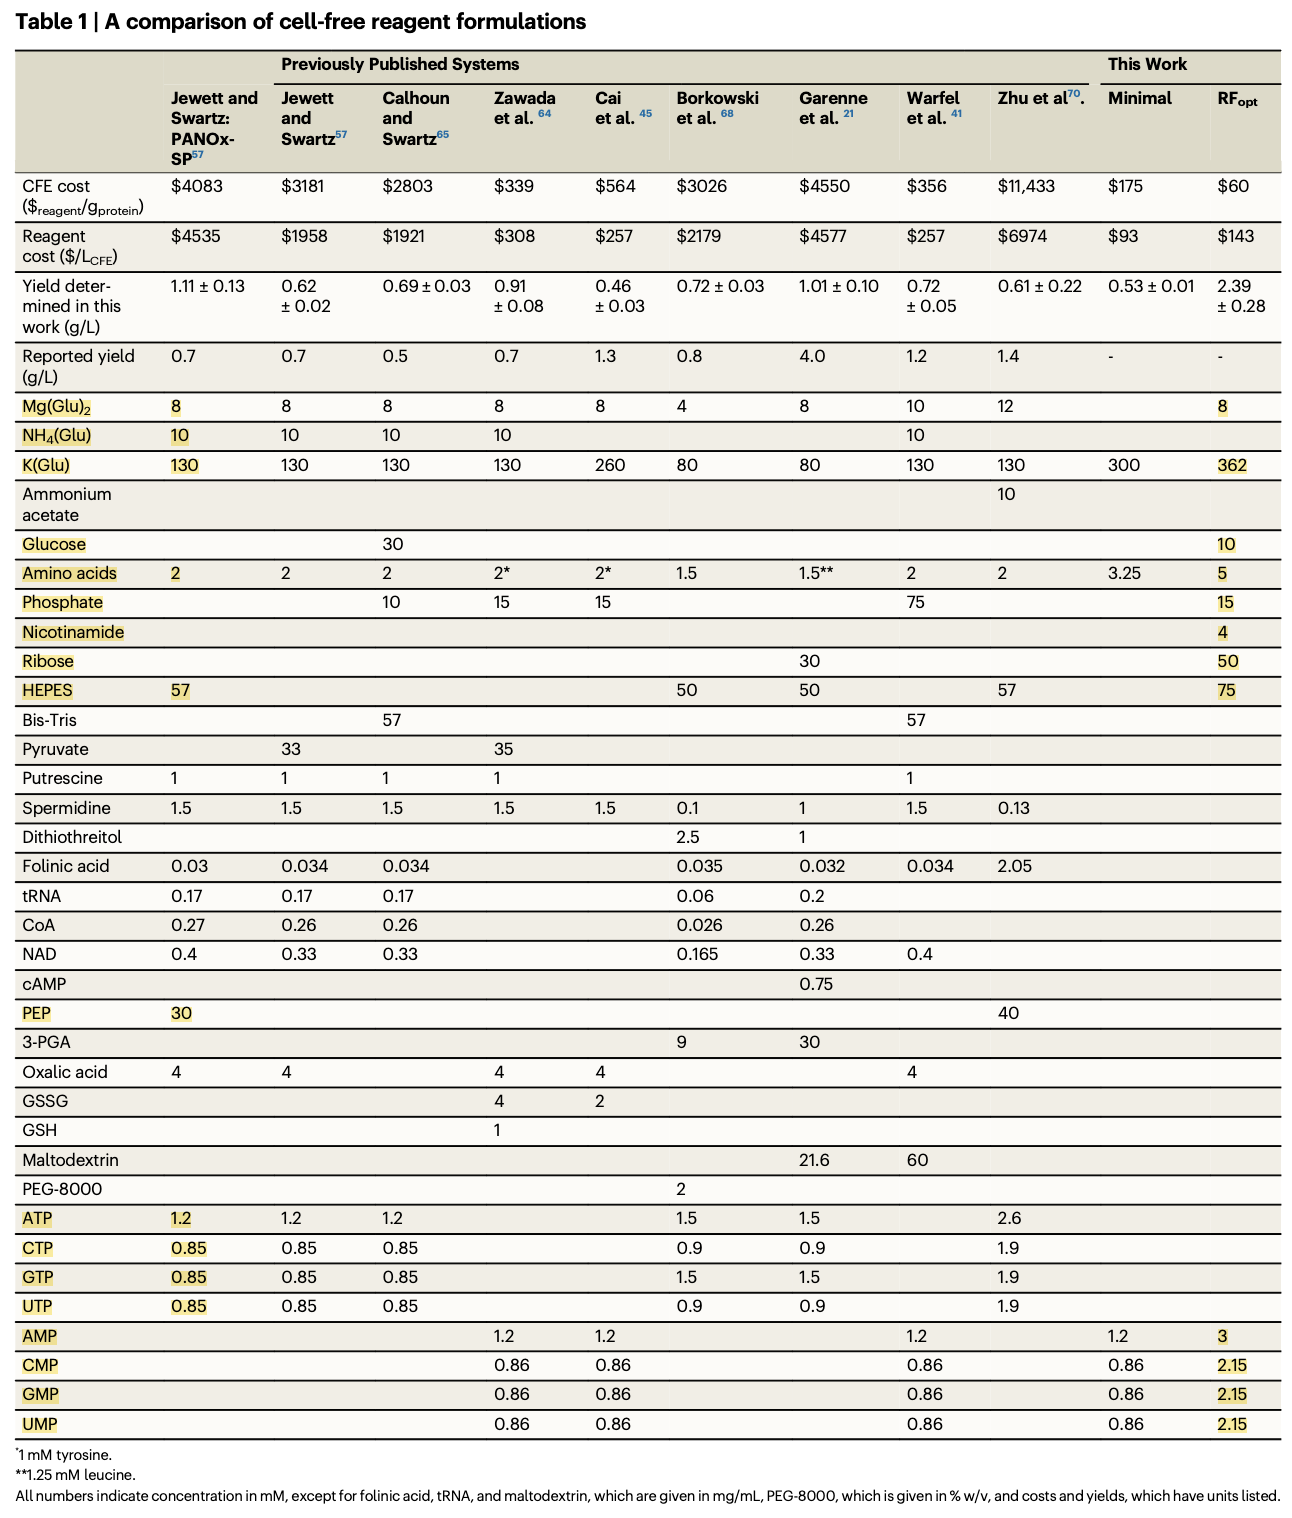
Figure 2. Comparison of cell-free reagent formulations, from Olsen et al. (2026). The highlighted entries correspond to the main reagents compared below.
Both contain magnesium glutamate, potassium glutamate, amino acids and HEPES. Their added magnesium glutamate concentration is identical at 8 mM. However, RFopt uses more potassium glutamate, amino acids and HEPES, as shown below.
| Added reagent | PANOx-SP | RFopt |
|---|---|---|
| Magnesium glutamate | 8 mM | 8 mM |
| Ammonium glutamate | 10 mM | None added |
| Potassium glutamate | 130 mM | 362 mM |
| Glucose | None added | 10 mM |
| Amino acids, each | 2 mM | 5 mM |
| Phosphate | None added | 15 mM |
| Nicotinamide | None added | 4 mM |
| Ribose | None added | 50 mM |
| HEPES | 57 mM | 75 mM |
| PEP | 30 mM | None added |
| ATP | 1.2 mM | None added |
| CTP, GTP, UTP | 0.85 mM each | None added |
| AMP | None added | 3 mM |
| CMP, GMP, UMP | None added | 2.15 mM each |
| NAD | 0.4 mM | None added |
The main difference is how energy and nucleotides are supplied. PANOx-SP uses PEP to regenerate ATP and directly supplies nucleoside triphosphates, or NTPs. RFopt supplies nucleoside monophosphates, or NMPs, together with ribose, glucose and phosphate. It relies on metabolism in the lysate to generate the required NTPs and maintain energy supply. RFopt also omits NAD, CoA, tRNA, folinic acid, spermidine and putrescine, which are included in PANOx-SP.
PANOx-SP produced 1.11 ± 0.13 g/L sfGFP, while RFopt produced 2.39 ± 0.28 g/L. Their reagent costs were approximately $4,083/g and $60/g of protein, respectively. These results suggest that lower-cost inputs can support high yield when the whole formulation is changed.
B. Design one reaction composition for each protein
Each design is for a 20 µL reaction using the reagents available on the course platform.
sfGFP
| Reagent | Concentration |
|---|---|
| Potassium glutamate | 253.59 mM |
| HEPES-KOH, pH 7.5 | 75.00 mM |
| Ribose | 49.96 mM |
| Glucose | 9.71 mM |
| Magnesium glutamate | 8.22 mM |
| Potassium phosphate, 1.6:1 dibasic:monobasic molar ratio | 7.50 mM |
| Potassium phosphate, 1.6:1 monobasic:dibasic molar ratio | 7.50 mM |
| 17 amino acid mix | 5.00 mM |
| Tyrosine, pH 12 | 5.00 mM |
| Cysteine | 5.00 mM |
| Nicotinamide | 4.00 mM |
| AMP | 3.00 mM |
| CMP | 2.13 mM |
| GMP | 2.13 mM |
| UMP | 2.13 mM |
| Spermidine | 1.25 mM |
I designed an sfGFP reaction based on RFopt using the reagents available on the course platform. I added 1.25 mM spermidine because it is a low cost reagent and has positive corelation with protein titer reported by Smith et al.. Their results motivated this test. My hypothesis is that polyamines such as spermidine stabilize nucleic acids and ribosomal function, thereby improving transcription and translation.
I reduced potassium glutamate from 362 mM to 253.59 mM to accommodate the reagent combination within the fixed 20 µL volume, which may also reduce aggregation during synthesis. The formulation retains approximately the RFopt concentrations of ribose, glucose, amino acids, NMPs and other components. I also kept total phosphate at 15 mM and combined equal amounts of the two phosphate stocks, giving a nominal monobasic:dibasic ratio of 1:1.
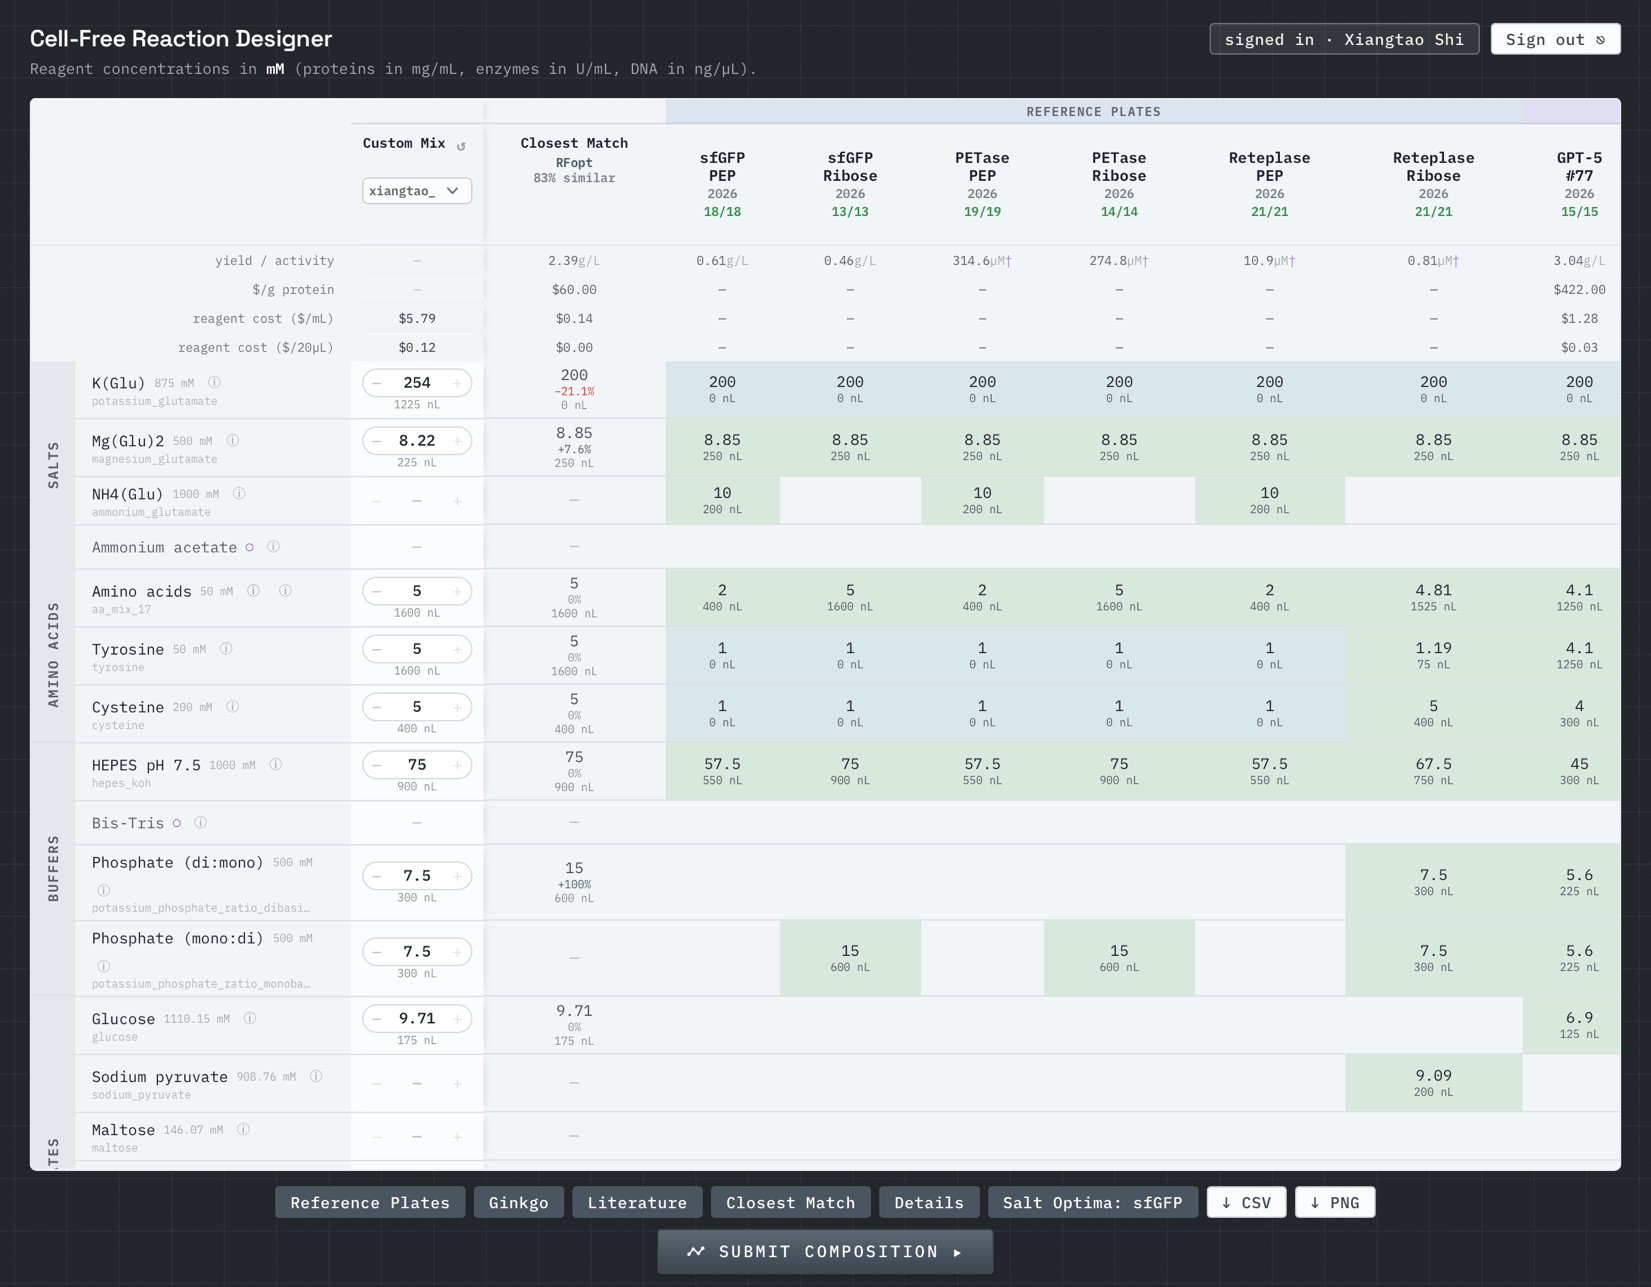
Figure 3. My sfGFP formulation in the Cell-Free Reaction Designer. The displayed potassium glutamate value is rounded to 254 mM.
PETase
| Reagent | Concentration or volume |
|---|---|
| Potassium glutamate | 298.44 mM |
| HEPES-KOH, pH 7.5 | 75.00 mM |
| Ribose | 49.96 mM |
| Potassium phosphate, 1.6:1 monobasic:dibasic molar ratio | 15.00 mM |
| Magnesium glutamate | 8.22 mM |
| 17 amino acid mix | 5.00 mM |
| Nicotinamide | 4.00 mM |
| AMP | 3.00 mM |
| CMP | 2.13 mM |
| GMP | 2.13 mM |
| UMP | 2.13 mM |
| DsbC (E. coli, 25.5 kDa) | 2.50 µM |
| Water | 0.750 µL (volume) |
The course’s PETase target is TfCut2 cutinase, which has one disulfide bond. I retained DsbC but reduced it from 5 to 2.5 µM. I want to test whether a smaller dose preserves enough activity to lower the cost per functional output.
Reteplase
| Reagent | Concentration |
|---|---|
| Potassium glutamate | 201.09 mM |
| HEPES-KOH, pH 7.5 | 117.50 mM |
| PEP mono (0.1 M stock) | 30.00 mM |
| Ammonium glutamate | 10.00 mM |
| Magnesium glutamate | 5.72 mM |
| Oxidized glutathione (GSSG) | 4.04 mM |
| Potassium oxalate | 3.75 mM |
| 17 amino acid mix | 2.00 mM |
| Spermidine | 1.56 mM |
| ATP | 1.25 mM |
| Putrescine dihydrochloride | 1.25 mM |
| Reduced glutathione (GSH) | 1.00 mM |
| CTP | 875.00 µM |
| GTP | 875.00 µM |
| UTP | 875.00 µM |
| NAD | 375.00 µM |
| Coenzyme A | 250.00 µM |
| DsbC (E. coli, 25.5 kDa) | 2.50 µM |
| Folinic acid | 0.025 g/L |
I used the Reteplase PEP reference formulation as a starting point. I increased HEPES-KOH (pH 7.5) from 57.5 to 117.5 mM to provide greater buffering capacity. I also decreased magnesium glutamate, Mg(Glu)₂, from about 8.22 to 5.72 mM. Furthermore, I reduced DsbC from 5 to 2.5 µM to lower reagent cost, although the effect on protein folding and activity would need to be tested. The remaining components were kept approximately unchanged.
Community reagent suggestion: FkpA
FkpA is an E. coli chaperone with peptidyl-prolyl isomerase activity that helps proteins fold. Groff et al. found that purified FkpA reduced aggregation and worked with DsbC to improve antibody folding and assembly in a cell-free system. Since our Reteplase formulation already includes DsbC, I guess FkpA could provide additional folding support to improve the amount of active Reteplase.
Discussion forum
I joined the cfps-coopetition channel on the course forum.
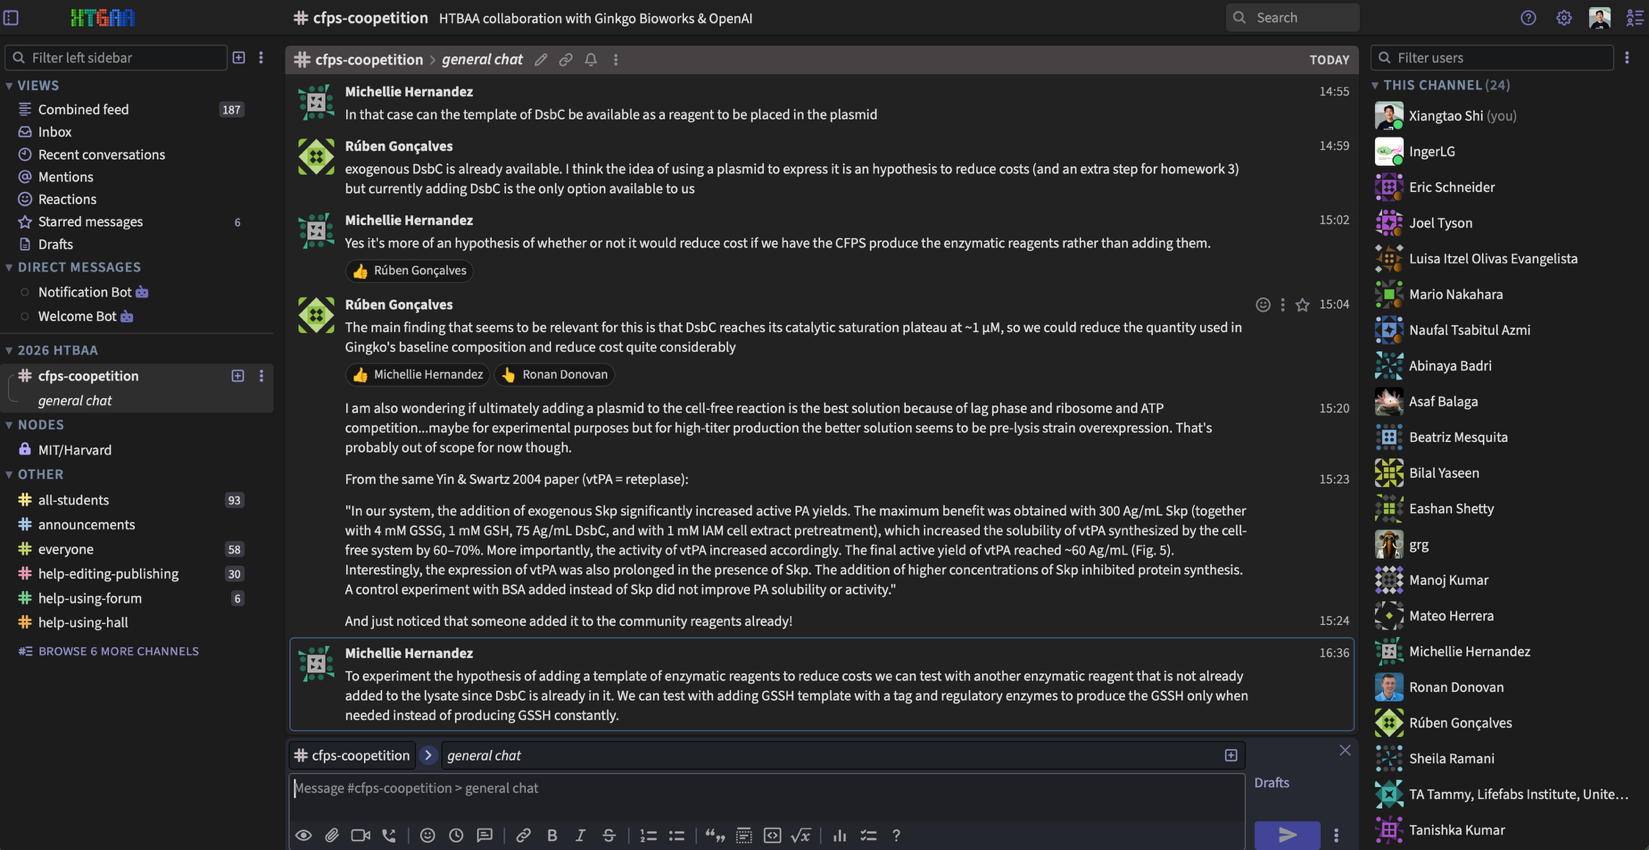
Figure 4. The cfps-coopetition discussion channel.
C. Asimov Kernel: T7-compatible plasmids (optional)
I designed three T7-compatible plasmids for the E. coli cell-free system by replacing the complete N-His–DHFR coding region of the NEBExpress DHFR-His control plasmid with synonymous DNA sequences encoding the sfGFP, PETase, and Reteplase sequences provided in the assignment. Each construct retains the original T7 promoter, ribosome-binding site, eight-nucleotide RBS-to-start spacer, downstream region, and T7 terminator. The tags and linkers included in the supplied protein sequences are preserved, and each coding sequence ends with a TAA stop codon. The resulting plasmids are 2,970, 3,177, and 3,447 bp, respectively.
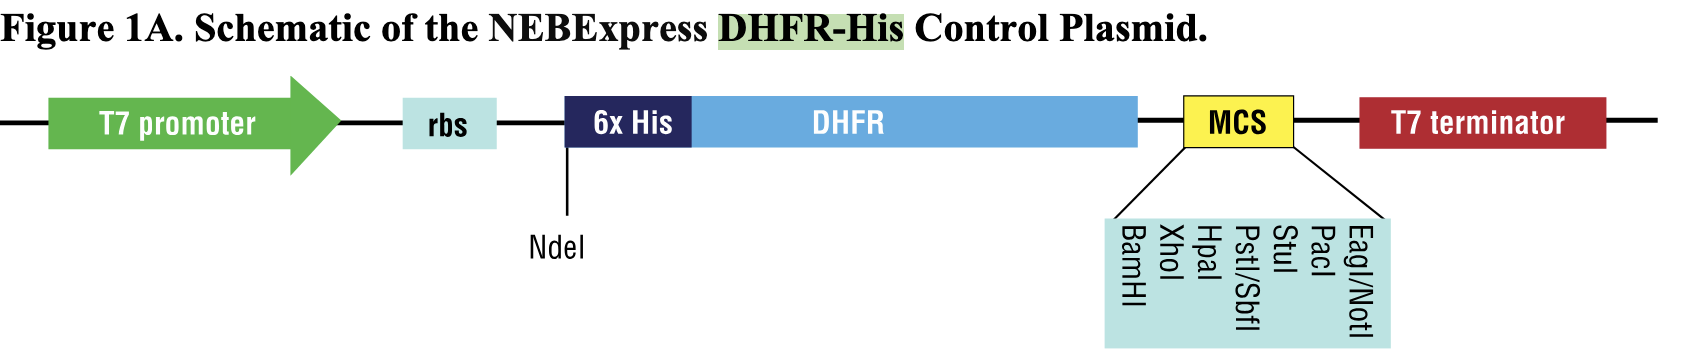
Figure 5. The reference plasmid architecture from the NEBExpress Cell-free E. coli Protein Synthesis System.
sfGFP plasmid
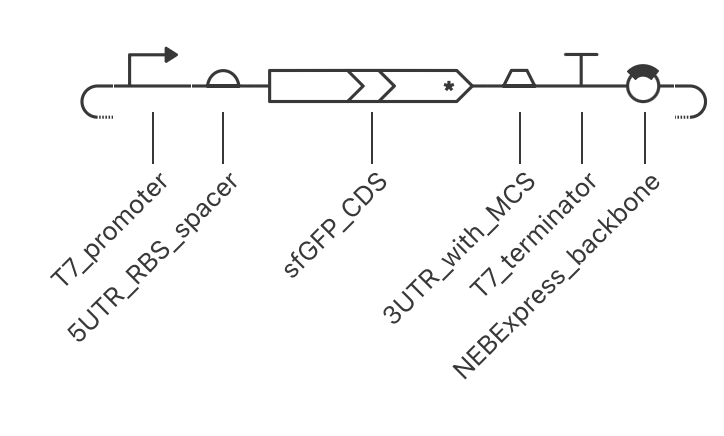
Figure 6. The T7-compatible sfGFP construct (2,970 bp).
PETase plasmid
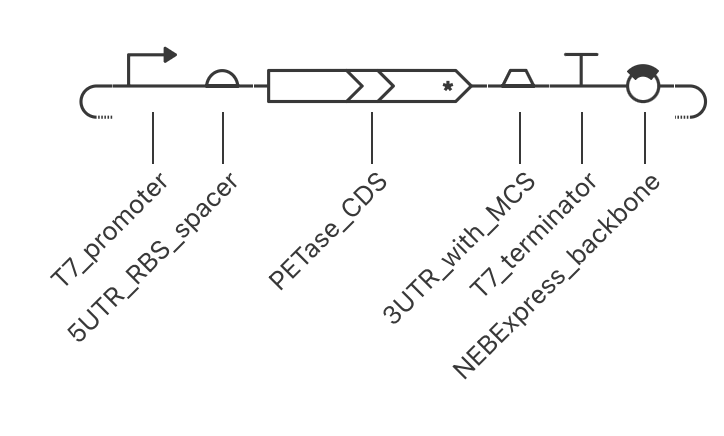
Figure 7. The T7-compatible PETase construct (3,177 bp).
Reteplase plasmid
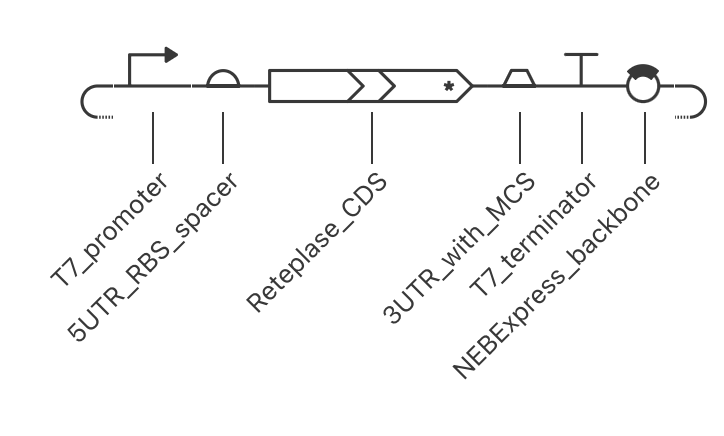
Figure 8. The T7-compatible Reteplase construct (3,447 bp).
Bonus: DsbC helper plasmid
For the bonus design, I propose a separate T7-driven helper plasmid expressing mature E. coli DsbC. DsbC can rearrange incorrectly paired disulfide bonds. This may help Reteplase form its nine disulfide bonds correctly.
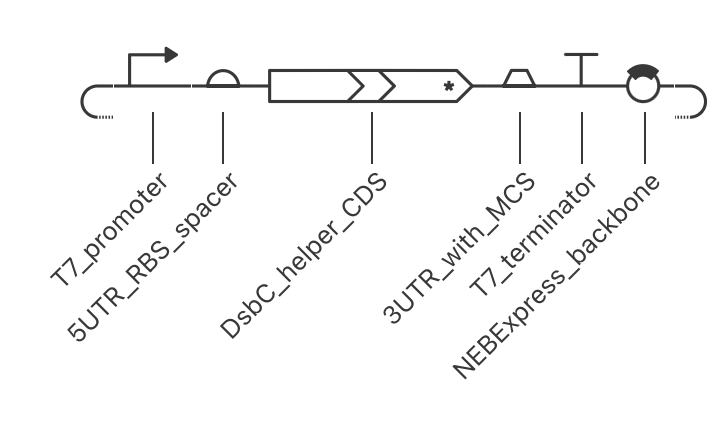
Figure 9. The proposed T7-driven DsbC helper construct.
AI assistance
I used Codex (OpenAI) to find resources, compare formulations, help brainstorming and organize this report.
References
- Jewett, M. C., & Swartz, J. R. (2004). Mimicking the Escherichia coli cytoplasmic environment activates long-lived and efficient cell-free protein synthesis. Biotechnology and Bioengineering, 86(1), 19–26. doi:10.1002/bit.20026.
- Olsen, M. L., et al. (2026). Design-driven optimization of low-cost reagent formulations for reproducible and high-yielding cell-free gene expression. Nature Communications. doi:10.1038/s41467-026-69605-8.
- Smith, A. A., et al. (2026). Using a GPT-5-driven autonomous lab to optimize the cost and titer of cell-free protein synthesis. bioRxiv preprint. doi:10.64898/2026.02.05.703998.
- Groff, D., et al. (2014). Engineering toward a bacterial “endoplasmic reticulum” for the rapid expression of immunoglobulin proteins. mAbs, 6(3), 671–678. Article.
- HTBAA course resources: CFPS reference information, Cell-Free Reaction Designer, and course forum.